Embed Size (px)
Citation preview

Fidelity China Special Situations PLC
Half-Yearly Report for the 6 months ended 30 September 2017
ii Fidelity China Special Situations PLC half-yearly report 2016
Contents
Directors’ Reports1 Investment Objective and Performance
2 Summary of Results
3 Portfolio Manager’s Half-Yearly Review
6 Interim Management Report and Directors’ Responsibility Statement
8 Twenty Largest Holdings
Financial Statements10 Income Statement
12 Statement of Changes in Equity
14 Balance Sheet
15 Cash Flow Statement
16 Notes to the Financial Statements
Information for Shareholders26 Glossary to the Half-Yearly Report
30 Directory
31 Shareholder Information
“Fidelity China Special Situations PLC aims to provide investors with direct access to the growth in the Chinese economy through a spread of investments in companies with a significant interest in China.”
Nicholas Bull, Chairman
1 Fidelity China Special Situations PLC Half-yearly Report 2017
DIR
ECTO
RS’
REP
ORTS
FIN
AN
CIA
L ST
ATE
MEN
TSIN
FORM
ATIO
N F
OR
SHA
REH
OLD
ERS
Job No: 31561 Proof Event: 11 Black Line Event: 21 Park Communications Ltd Alpine Way London E6 6LA
Customer: Fidelity Project Title: Fidelity CSS Half Year Rpt 2016 T: 0207 055 6500 F: 020 7055 6600
Investment Objective and Performance
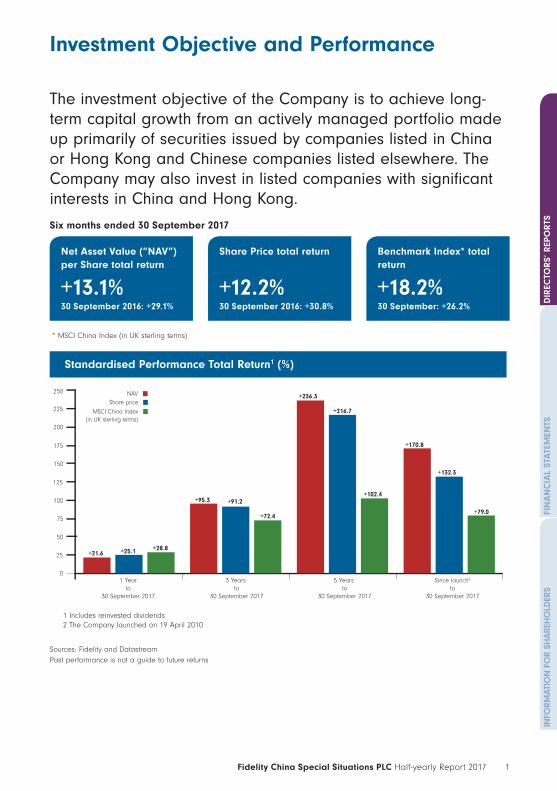
The investment objective of the Company is to achieve long-term capital growth from an actively managed portfolio made up primarily of securities issued by companies listed in China or Hong Kong and Chinese companies listed elsewhere. The Company may also invest in listed companies with significant interests in China and Hong Kong.
Six months ended 30 September 2017
Net Asset Value (“NAV”) per Share total return
+13.1%30 September 2016: +29.1%
Share Price total return
+12.2%30 September 2016: +30.8%
Benchmark Index* total return
+18.2%30 September: +26.2%
* MSCI China Index (in UK sterling terms)
+21.6
%
NAVShare price
MSCI China Index(in UK sterling terms)
Standardised Performance Total Return1 (%)
+25.1 +28.8
+95.3 +91.2
+39.8
+145.3
+197.5
-12.9 -12.1
+39.0
+78.2
+122.7
+85.7
1 Yearto
30 September 2017
3 Years to
30 September 2017
5 Years to
30 September 2017
Since launch2
to30 September 2017
1 Includes reinvested dividends2 The Company launched on 19 April 2010
+72.4
+236.3
+216.7
+102.4
+170.8
+132.3
+79.0
0
25
50
75
100
125
150
175
200
225
250
Sources: Fidelity and DatastreamPast performance is not a guide to future returns
2 Fidelity China Special Situations PLC Half-yearly Report 2017
Job No: 31561 Proof Event: 11 Black Line Event: 2 Park Communications Ltd Alpine Way London E6 6LA
Customer: Fidelity Project Title: Fidelity CSS Half Year Rpt 2016 T: 0207 055 6500 F: 020 7055 6600
Job No: 31561 Proof Event: 11 Black Line Event: 21 Park Communications Ltd Alpine Way London E6 6LA
Customer: Fidelity Project Title: Fidelity CSS Half Year Rpt 2016 T: 0207 055 6500 F: 020 7055 6600
30 September 2017
31 March 2017
Assets
Gross Asset Exposure £1,756.4m £1,586.9m
Net Assets £1,391.3m £1,243.8m
Gearing 26.2% 27.6%
Net Asset Value per Ordinary Share 252.23p 225.36p
Number of Ordinary Shares held outside Treasury 551,614,480 551,914,480
Share Price and Discount data
Share Price at period/year end 217.00p 195.70p
Share Price: period/year high 229.50p 200.00p
Share Price: period/year low 190.10p 132.00p
Discount at period/year end 14.0% 13.2%
Discount: period/year high 14.7% 19.9%
Discount: period/year low 10.5% 11.5%
Earnings for the six months ended 30 September1 2017 2016
Revenue earnings per Ordinary Share 4.06p 3.42p
Capital earnings per Ordinary Share 25.29p 43.72p
Total earnings per Ordinary Share 29.35p 47.14p
Ongoing charges for the six months ended 30 September2 1.12% 1.23%
1 Based on the weighted average number of Ordinary Shares held outside Treasury in issue during the period2 Ongoing charges (excluding performance fees, finance costs and taxation) as a percentage of average Net Asset Values for the period
(prepared in accordance with the methodology recommended by the Association of Investment Companies)
Sources: Fidelity and DatastreamPast performance is not a guide to future returns
Summary of Results
3 Fidelity China Special Situations PLC Half-yearly Report 2017
DIR
ECTO
RS’
REP
ORTS
FIN
AN
CIA
L ST
ATE
MEN
TSIN
FORM
ATIO
N F
OR
SHA
REH
OLD
ERS
Job No: 31561 Proof Event: 11 Black Line Event: 2 Park Communications Ltd Alpine Way London E6 6LA
Customer: Fidelity Project Title: Fidelity CSS Half Year Rpt 2016 T: 0207 055 6500 F: 020 7055 6600
Job No: 31561 Proof Event: 11 Black Line Event: 21 Park Communications Ltd Alpine Way London E6 6LA
Customer: Fidelity Project Title: Fidelity CSS Half Year Rpt 2016 T: 0207 055 6500 F: 020 7055 6600
Portfolio Manager’s Half-Yearly Review
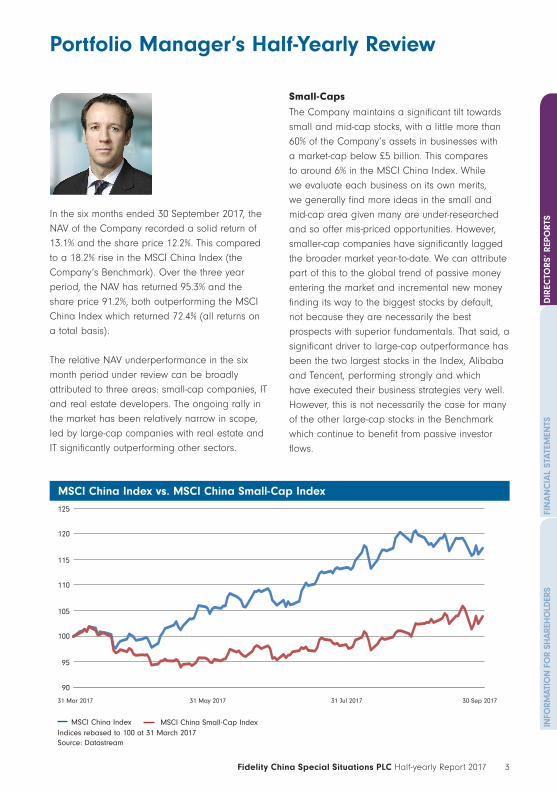
In the six months ended 30 September 2017, the NAV of the Company recorded a solid return of 13.1% and the share price 12.2%. This compared to a 18.2% rise in the MSCI China Index (the Company’s Benchmark). Over the three year period, the NAV has returned 95.3% and the share price 91.2%, both outperforming the MSCI China Index which returned 72.4% (all returns on a total basis).
The relative NAV underperformance in the six month period under review can be broadly attributed to three areas: small-cap companies, IT and real estate developers. The ongoing rally in the market has been relatively narrow in scope, led by large-cap companies with real estate and IT significantly outperforming other sectors.
Small-Caps
The Company maintains a significant tilt towards small and mid-cap stocks, with a little more than 60% of the Company’s assets in businesses with a market-cap below £5 billion. This compares to around 6% in the MSCI China Index. While we evaluate each business on its own merits, we generally find more ideas in the small and mid-cap area given many are under-researched and so offer mis-priced opportunities. However, smaller-cap companies have significantly lagged the broader market year-to-date. We can attribute part of this to the global trend of passive money entering the market and incremental new money finding its way to the biggest stocks by default, not because they are necessarily the best prospects with superior fundamentals. That said, a significant driver to large-cap outperformance has been the two largest stocks in the Index, Alibaba and Tencent, performing strongly and which have executed their business strategies very well. However, this is not necessarily the case for many of the other large-cap stocks in the Benchmark which continue to benefit from passive investor flows.
MSCI China Small-Cap IndexMSCI China IndexIndices rebased to 100 at 31 March 2017Source: Datastream
MSCI China Index vs. MSCI China Small-Cap Index
90
95
100
105
110
115
120
125
31 Mar 2017 31 May 2017 31 Jul 2017 30 Sep 2017
4 Fidelity China Special Situations PLC Half-yearly Report 2017
Job No: 31561 Proof Event: 11 Black Line Event: 2 Park Communications Ltd Alpine Way London E6 6LA
Customer: Fidelity Project Title: Fidelity CSS Half Year Rpt 2016 T: 0207 055 6500 F: 020 7055 6600
Job No: 31561 Proof Event: 11 Black Line Event: 21 Park Communications Ltd Alpine Way London E6 6LA
Customer: Fidelity Project Title: Fidelity CSS Half Year Rpt 2016 T: 0207 055 6500 F: 020 7055 6600
Portfolio Manager’s Half-Yearly Review continued
IT Sector
IT giants Alibaba and Tencent once again recorded extremely strong returns and their shares are more than 40% up over the reporting period. These are the Company’s two largest holdings yet we remain underweight compared to the Index, hence both were relative detractors to performance. I continue to believe in the long-term opportunities in both. Alibaba holds a dominant e-commerce position that will go from strength-to-strength. It also has other very promising businesses in relatively early stages of development, such as Cloud and financial services. Tencent’s WeChat platform has a massive 960 million users in China and is clearly the foremost online platform, but is still under-monetised relative to levels seen in the West, especially compared to the likes of Facebook. Both companies dominate online mobile smartphone payments, which further add to their extensive data sets. All of this means that Alibaba and Tencent have a captive audience and an increasing amount of extremely valuable data for advertising and identifying trends. However, with the two stocks representing close to one-third of the Benchmark, getting close to market weight would impede diversification and limit capital that could be allocated to smaller companies with better risk-reward profiles.
Elsewhere within IT, the large underweight in Baidu detracted from returns. Of the big three IT companies in China, I believe it faces the biggest challenges. Its primary business is online search, an area likely to lose market-share of online advertising spend against other areas with faster user growth, particularly social driven platforms like WeChat. Conversely, online classified platform 58.com was one of the main contributors to performance over the period after recording strong results driven by increasing property classifieds, especially in the rental market, in a growing number of cities.
The IT sector is a core investment for the Company. The structural technology shifts we see globally are happening faster in China and many companies play an important role as a consumption enabler. Also, data is now a key commodity for businesses that will continue to grow in importance over the mid-term. The Company’s newest unlisted holding that was purchased in Q2 2017 is Jiguang, a leading “big data” platform (trading name is Aurora Mobile). It serves over 500,000 apps in China and works with around 250,000 developers, holding dominant market share in the “App Push Notification Service” segment. Jiguang has first mover advantage in this field and benefits from great depth and unique data granularity.
Real Estate Developers
The real estate sector has also rallied significantly, with a swathe of developers seeing share price appreciation of over 40%. However, I question the sustainability of this given increasing government measures to contain property prices. More worryingly, two of China’s most highly leveraged companies, Sunac China and China Evergrande returned a staggering 237% and 251% respectively in this six-month review period. I continue to hold no developers as valuations are stretched and momentum is set to slow with government policy focused on taking the heat out of the property market.
China Consumer
Elsewhere, the Company’s holdings in consumer related names, including China Meidong Auto, Yihai and Brilliance China added value. China Meidong Auto is a car dealership based in the Guangdong region that continues to grow its network while its excellent management team is highly successful in taking over weaker dealerships and turning them around. Hot pot condiment supplier Yihai continues to see growth from its relationship with popular hot pot
5 Fidelity China Special Situations PLC Half-yearly Report 2017
DIR
ECTO
RS’
REP
ORTS
FIN
AN
CIA
L ST
ATE
MEN
TSIN
FORM
ATIO
N F
OR
SHA
REH
OLD
ERS
Job No: 31561 Proof Event: 11 Black Line Event: 2 Park Communications Ltd Alpine Way London E6 6LA
Customer: Fidelity Project Title: Fidelity CSS Half Year Rpt 2016 T: 0207 055 6500 F: 020 7055 6600
Job No: 31561 Proof Event: 11 Black Line Event: 21 Park Communications Ltd Alpine Way London E6 6LA
Customer: Fidelity Project Title: Fidelity CSS Half Year Rpt 2016 T: 0207 055 6500 F: 020 7055 6600
restaurant chain Haidilao and rapidly growing retail sales of its products. Brilliance China, a joint venture with BMW, remains in a sweet spot for aspirational Chinese consumers.
The rising Chinese middle class and their increasing aspirations is a key reason for the Company’s substantial overweight position in the consumer discretionary sector. Within this area, I have been finding great potential in consumer services. The Chinese consumer is a significant purchaser of goods, but we also see a greater demand for experiences and lifestyle consumption – travel, hotels, restaurants and education, to name a few. Education is a particularly interesting industry with companies offering a range of services from school and professional test preparation (New Oriental Education & Technology) to private schools (China Yuhua Education). Despite being ‘discretionary’ the household budget’s spend on education is often viewed as a necessity in order to compete in an ever-increasing competitive environment. The lack of price sensitivity makes for interesting investment opportunities.
Gearing
The Chinese market has rallied over the last six months supported by strong earnings revisions. This, combined with valuations that still stack up well compared to global markets and good flow of new ideas related to many of the ideas mentioned in this report, has led me to keep net gearing relatively high. We remain positive on the earnings outlook for the market, but I do envisage more shorting opportunities should valuations continue expanding, which would likely lower net market exposure. However, net gearing remains in the mid to high teens as a reflection of our conviction in the strong structural growth opportunities that exist in China.
Outlook
We are currently in the midst of a clear cyclical upturn in the economy. Supply-side reform in areas like steel and cement has helped to lift pricing across a range of commodities. On the policy front, there is increasing rhetoric focused on the risks associated with the build-up of credit we have seen in the economy. This focus could become stronger post recent leadership changes – all positive in addressing our major concern for the long-term health of the economy. The environment remains positive for ongoing growth in consumption as part of the natural expansion of the middle-class, a key investment theme for the portfolio. While market sentiment has clearly turned more positive to the risk-reward balance around the opportunities in the Chinese market, we still find good value relative to the long-term growth potential.
Dale NichollsPortfolio Manager23 November 2017
6 Fidelity China Special Situations PLC Half-yearly Report 2017
Job No: 31561 Proof Event: 11 Black Line Event: 2 Park Communications Ltd Alpine Way London E6 6LA
Customer: Fidelity Project Title: Fidelity CSS Half Year Rpt 2016 T: 0207 055 6500 F: 020 7055 6600
Job No: 31561 Proof Event: 11 Black Line Event: 21 Park Communications Ltd Alpine Way London E6 6LA
Customer: Fidelity Project Title: Fidelity CSS Half Year Rpt 2016 T: 0207 055 6500 F: 020 7055 6600
Interim Management Report and Directors’ Responsibility StatementGearing
The Company has a three year unsecured fixed rate loan facility agreement with Scotiabank Europe PLC for US$150,000,000. The agreement was effective on 14 February 2017 and the interest rate is fixed at 3.01% per annum until the facility terminates on 14 February 2020.
To achieve further gearing, the Company uses contracts for difference (“CFDs”) on a number of holdings in its portfolio.
At 30 September 2017, the Company’s gearing, defined as Gross Asset Exposure in excess of Net Assets, was 26.2% (31 March 2017: 27.6%; 30 September 2016: 25.5%). This is within the limit set by the Company’s Prospectus of 30%.
Discount Management
The Company’s discount widened slightly from 13.2% at the start of the reporting period to 14.0% at the end of the reporting period.
The Board recognises that the Company’s share price is affected by the interaction of supply and demand in the market and investor sentiment towards China, as well as the performance of the NAV per Ordinary Share. Recognising these factors, and following a detailed review by the Board of the discount policy, it is the Board’s belief at present that the discount is best addressed by repurchasing the Company’s shares according to market conditions. Any shares repurchased can be held in Treasury or cancelled.
In the reporting period, the Company repurchased 300,000 Ordinary Shares into Treasury. Since the end of the reporting period and as at the date of this report, a further 200,000 Ordinary Shares have been repurchased into Treasury. No Ordinary Shares have been issued in the reporting period and as at the date of this report.
Allocation of Expenses
As mentioned in the Annual Report for the year ending 31 March 2017, management fees and finance costs have, since the launch, been apportioned equally between revenue and capital. As capital returns have contributed considerably more than revenue to the total returns over the life of the Company, the Board has a reasonable expectation that future returns will also be similar. The Directors have therefore decided that with effect from 1 April 2017, 75% of management fees and finance costs will be charged to capital and the remaining 25% will be charged to revenue. Although total returns remain unchanged, the capital return has decreased and the revenue return has increased. Consequently, the amount available for distribution as dividends out of revenue reserve has increased.
Principal Risks and Uncertainties
The Board, with the assistance of the Manager, has developed a risk matrix which, as part of the risk management and internal controls process, identifies the key risks and uncertainties faced by the Company.
The Board believes that the principal risks and uncertainties faced by the Company continue to fall into the following categories: market, performance, discount control, gearing and currency risks. Other risks facing the Company include cybercrime, tax and regulatory and operational (service providers) risks. Information on each of these risks is given in the Strategic Report section of the Annual Report for the year ended 31 March 2017 and can be found on the Company’s pages of the Manager’s website at www.fidelityinvestmenttrusts.com.
7 Fidelity China Special Situations PLC Half-yearly Report 2017
DIR
ECTO
RS’
REP
ORTS
FIN
AN
CIA
L ST
ATE
MEN
TSIN
FORM
ATIO
N F
OR
SHA
REH
OLD
ERS
Job No: 31561 Proof Event: 11 Black Line Event: 2 Park Communications Ltd Alpine Way London E6 6LA
Customer: Fidelity Project Title: Fidelity CSS Half Year Rpt 2016 T: 0207 055 6500 F: 020 7055 6600
Job No: 31561 Proof Event: 11 Black Line Event: 21 Park Communications Ltd Alpine Way London E6 6LA
Customer: Fidelity Project Title: Fidelity CSS Half Year Rpt 2016 T: 0207 055 6500 F: 020 7055 6600
These principal risks and uncertainties have not materially changed in the six months to 30 September 2017 and are equally applicable to the remaining six months of the Company’s financial year.
Transactions with the Managers and Related Parties
FIL Investment Services (UK) Limited is the Company’s Alternative Investment Fund Manager (“AIFM”) and has delegated the investment management (other than investment management in unlisted securities) to FIL Investment Management (Hong Kong) Limited. It has delegated the investment management of the unlisted securities and the company secretariat function to FIL Investments International. Transactions with the Managers and related party transactions with the Directors are disclosed in Note 14 on page 25.
Going Concern
The Directors have considered the Company’s investment objective, risk management policies, liquidity risk, credit risk, capital management policies and procedures, the nature of its portfolio (being mainly securities which are readily realisable) and its expenditure and cash flow projections. They have concluded that the Company has adequate resources to continue in operational existence for the foreseeable future. Thus they continue to adopt the going concern basis of accounting in preparing these Financial Statements.
By order of the Board.FIL Investments International23 November 2017
Directors’ Responsibility Statement
The Disclosure and Transparency Rules (“DTR”) of the UK Listing Authority require the Directors to confirm their responsibilities in relation to the preparation and publication of the Interim Management Report and Financial Statements.
The Directors confirm to the best of their knowledge that:
a) the condensed set of Financial Statements contained within the Half-Yearly Report has been prepared in accordance with the International Accounting Standards 34: “Interim Financial Reporting”; and
b) the Interim Management Report, together with the Portfolio Manager’s Half-Yearly Review on pages 3 to 5, includes a fair review of the information required by DTR 4.2.7R and 4.2.8R.
The Half-Yearly Report has not been audited or reviewed by the Company’s Independent Auditor.
The Half-Yearly Report was approved by the Board on 23 November 2017 and the above responsibility statement was signed on its behalf by Nicholas Bull, Chairman.
8 Fidelity China Special Situations PLC Half-yearly Report 2017
Job No: 31561 Proof Event: 11 Black Line Event: 2 Park Communications Ltd Alpine Way London E6 6LA
Customer: Fidelity Project Title: Fidelity CSS Half Year Rpt 2016 T: 0207 055 6500 F: 020 7055 6600
Job No: 31561 Proof Event: 11 Black Line Event: 21 Park Communications Ltd Alpine Way London E6 6LA
Customer: Fidelity Project Title: Fidelity CSS Half Year Rpt 2016 T: 0207 055 6500 F: 020 7055 6600
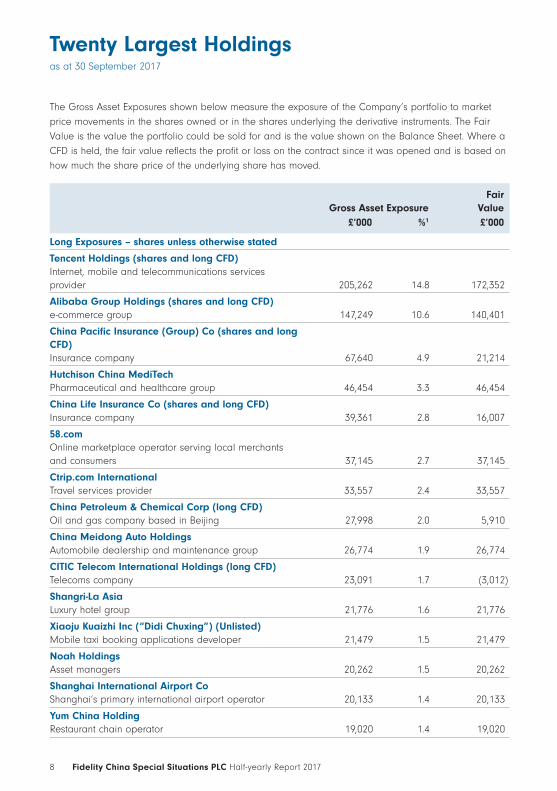
Twenty Largest Holdingsas at 30 September 2017
The Gross Asset Exposures shown below measure the exposure of the Company’s portfolio to market price movements in the shares owned or in the shares underlying the derivative instruments. The Fair Value is the value the portfolio could be sold for and is the value shown on the Balance Sheet. Where a CFD is held, the fair value reflects the profit or loss on the contract since it was opened and is based on how much the share price of the underlying share has moved.
Gross Asset ExposureFair
Value£’000 %1 £’000
Long Exposures – shares unless otherwise stated
Tencent Holdings (shares and long CFD)Internet, mobile and telecommunications services provider 205,262 14.8 172,352
Alibaba Group Holdings (shares and long CFD)e-commerce group 147,249 10.6 140,401
China Pacific Insurance (Group) Co (shares and long CFD)Insurance company 67,640 4.9 21,214
Hutchison China MediTechPharmaceutical and healthcare group 46,454 3.3 46,454
China Life Insurance Co (shares and long CFD)Insurance company 39,361 2.8 16,007
58.comOnline marketplace operator serving local merchants and consumers 37,145 2.7 37,145
Ctrip.com InternationalTravel services provider 33,557 2.4 33,557
China Petroleum & Chemical Corp (long CFD)Oil and gas company based in Beijing 27,998 2.0 5,910
China Meidong Auto HoldingsAutomobile dealership and maintenance group 26,774 1.9 26,774
CITIC Telecom International Holdings (long CFD)Telecoms company 23,091 1.7 (3,012)
Shangri-La AsiaLuxury hotel group 21,776 1.6 21,776
Xiaoju Kuaizhi Inc (“Didi Chuxing”) (Unlisted)Mobile taxi booking applications developer 21,479 1.5 21,479
Noah Holdings Asset managers 20,262 1.5 20,262
Shanghai International Airport CoShanghai’s primary international airport operator 20,133 1.4 20,133
Yum China HoldingRestaurant chain operator 19,020 1.4 19,020
9 Fidelity China Special Situations PLC Half-yearly Report 2017
DIR
ECTO
RS’
REP
ORTS
FIN
AN
CIA
L ST
ATE
MEN
TSIN
FORM
ATIO
N F
OR
SHA
REH
OLD
ERS
Job No: 31561 Proof Event: 11 Black Line Event: 2 Park Communications Ltd Alpine Way London E6 6LA
Customer: Fidelity Project Title: Fidelity CSS Half Year Rpt 2016 T: 0207 055 6500 F: 020 7055 6600
Job No: 31561 Proof Event: 11 Black Line Event: 21 Park Communications Ltd Alpine Way London E6 6LA
Customer: Fidelity Project Title: Fidelity CSS Half Year Rpt 2016 T: 0207 055 6500 F: 020 7055 6600
Gross Asset ExposureFair
Value£’000 %1 £’000
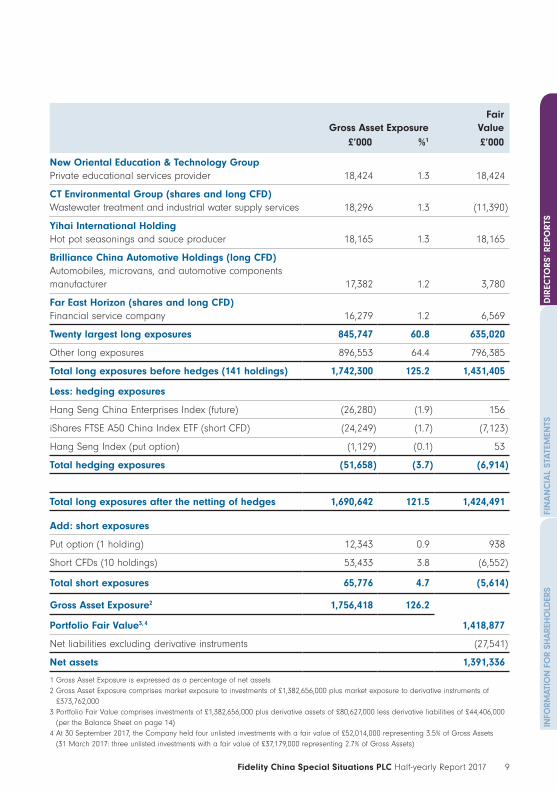
New Oriental Education & Technology GroupPrivate educational services provider 18,424 1.3 18,424
CT Environmental Group (shares and long CFD)Wastewater treatment and industrial water supply services 18,296 1.3 (11,390)
Yihai International Holding Hot pot seasonings and sauce producer 18,165 1.3 18,165
Brilliance China Automotive Holdings (long CFD)Automobiles, microvans, and automotive components manufacturer 17,382 1.2 3,780
Far East Horizon (shares and long CFD)Financial service company 16,279 1.2 6,569
Twenty largest long exposures 845,747 60.8 635,020
Other long exposures 896,553 64.4 796,385
Total long exposures before hedges (141 holdings) 1,742,300 125.2 1,431,405
Less: hedging exposures
Hang Seng China Enterprises Index (future) (26,280) (1.9) 156
iShares FTSE A50 China Index ETF (short CFD) (24,249) (1.7) (7,123)
Hang Seng Index (put option) (1,129) (0.1) 53
Total hedging exposures (51,658) (3.7) (6,914)
Total long exposures after the netting of hedges 1,690,642 121.5 1,424,491
Add: short exposures
Put option (1 holding) 12,343 0.9 938
Short CFDs (10 holdings) 53,433 3.8 (6,552)
Total short exposures 65,776 4.7 (5,614)
Gross Asset Exposure2 1,756,418 126.2
Portfolio Fair Value3, 4 1,418,877
Net liabilities excluding derivative instruments (27,541)
Net assets 1,391,336
1 Gross Asset Exposure is expressed as a percentage of net assets2 Gross Asset Exposure comprises market exposure to investments of £1,382,656,000 plus market exposure to derivative instruments of
£373,762,0003 Portfolio Fair Value comprises investments of £1,382,656,000 plus derivative assets of £80,627,000 less derivative liabilities of £44,406,000
(per the Balance Sheet on page 14)4 At 30 September 2017, the Company held four unlisted investments with a fair value of £52,014,000 representing 3.5% of Gross Assets
(31 March 2017: three unlisted investments with a fair value of £37,179,000 representing 2.7% of Gross Assets)
10 Fidelity China Special Situations PLC Half-yearly Report 2017
Job No: 31561 Proof Event: 13 Black Line Event: 2 Park Communications Ltd Alpine Way London E6 6LA
Customer: Fidelity Project Title: Fidelity FCSS Half Year Rpt 2016 T: 0207 055 6500 F: 020 7055 6600
Job No: 31561 Proof Event: 13 Black Line Event: 2 Park Communications Ltd Alpine Way London E6 6LA
Customer: Fidelity Project Title: Fidelity FCSS Half Year Rpt 2016 T: 0207 055 6500 F: 020 7055 6600
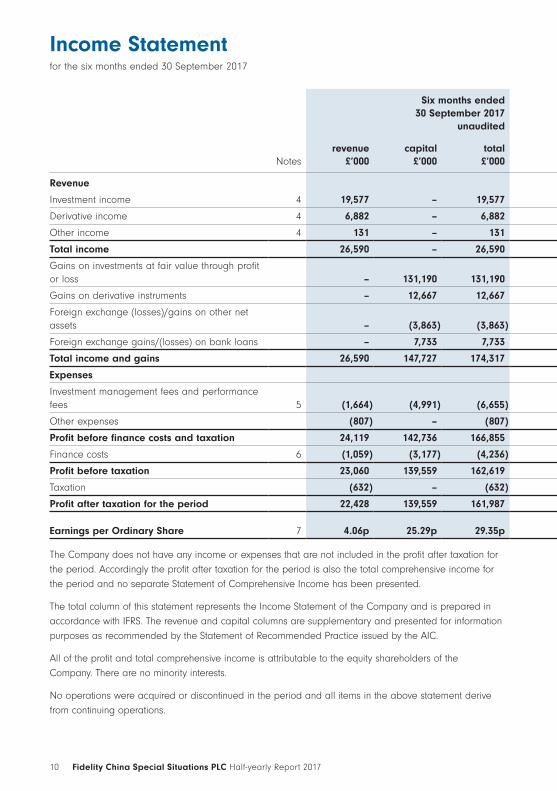
Income Statementfor the six months ended 30 September 2017
Six months ended30 September 2017
unaudited
Year ended31 March 2017
audited
Six months ended30 September 2016
unaudited
Notesrevenue
£’000capital
£’000total £’000
revenue £’000
capital £’000
total £’000
revenue £’000
capital £’000
total £’000
Revenue
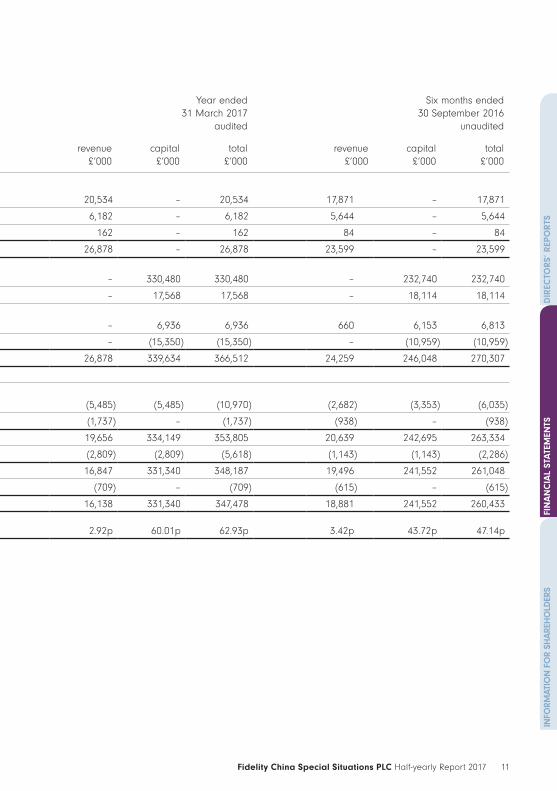
Investment income 4 19,577 – 19,577 20,534 – 20,534 17,871 – 17,871
Derivative income 4 6,882 – 6,882 6,182 – 6,182 5,644 – 5,644
Other income 4 131 – 131 162 – 162 84 – 84
Total income 26,590 – 26,590 26,878 – 26,878 23,599 – 23,599
Gains on investments at fair value through profit or loss – 131,190 131,190 – 330,480 330,480 – 232,740 232,740
Gains on derivative instruments – 12,667 12,667 – 17,568 17,568 – 18,114 18,114
Foreign exchange (losses)/gains on other net assets – (3,863) (3,863) – 6,936 6,936 660 6,153 6,813
Foreign exchange gains/(losses) on bank loans – 7,733 7,733 – (15,350) (15,350) – (10,959) (10,959)
Total income and gains 26,590 147,727 174,317 26,878 339,634 366,512 24,259 246,048 270,307
Expenses
Investment management fees and performance fees 5 (1,664) (4,991) (6,655) (5,485) (5,485) (10,970) (2,682) (3,353) (6,035)
Other expenses (807) – (807) (1,737) – (1,737) (938) – (938)
Profit before finance costs and taxation 24,119 142,736 166,855 19,656 334,149 353,805 20,639 242,695 263,334
Finance costs 6 (1,059) (3,177) (4,236) (2,809) (2,809) (5,618) (1,143) (1,143) (2,286)
Profit before taxation 23,060 139,559 162,619 16,847 331,340 348,187 19,496 241,552 261,048
Taxation (632) – (632) (709) – (709) (615) – (615)
Profit after taxation for the period 22,428 139,559 161,987 16,138 331,340 347,478 18,881 241,552 260,433
Earnings per Ordinary Share 7 4.06p 25.29p 29.35p 2.92p 60.01p 62.93p 3.42p 43.72p 47.14p
The Company does not have any income or expenses that are not included in the profit after taxation for the period. Accordingly the profit after taxation for the period is also the total comprehensive income for the period and no separate Statement of Comprehensive Income has been presented.
The total column of this statement represents the Income Statement of the Company and is prepared in accordance with IFRS. The revenue and capital columns are supplementary and presented for information purposes as recommended by the Statement of Recommended Practice issued by the AIC.
All of the profit and total comprehensive income is attributable to the equity shareholders of the Company. There are no minority interests.
No operations were acquired or discontinued in the period and all items in the above statement derive from continuing operations.
11 Fidelity China Special Situations PLC Half-yearly Report 2017
Job No: 31561 Proof Event: 13 Black Line Event: 2 Park Communications Ltd Alpine Way London E6 6LA
Customer: Fidelity Project Title: Fidelity FCSS Half Year Rpt 2016 T: 0207 055 6500 F: 020 7055 6600
Job No: 31561 Proof Event: 13 Black Line Event: 2 Park Communications Ltd Alpine Way London E6 6LA
Customer: Fidelity Project Title: Fidelity FCSS Half Year Rpt 2016 T: 0207 055 6500 F: 020 7055 6600
FIN
AN
CIA
L ST
ATE
MEN
TSIN
FORM
ATIO
N F
OR
SHA
REH
OLD
ERS
DIR
ECTO
RS’
REP
ORTS
DIR
ECTO
RS’
REP
ORTS
FIN
AN
CIA
L ST
ATE
MEN
TS
Six months ended30 September 2017
unaudited
Year ended31 March 2017
audited
Six months ended30 September 2016
unaudited
Notesrevenue
£’000capital
£’000total £’000
revenue £’000
capital £’000
total £’000
revenue £’000
capital £’000
total £’000
Revenue
Investment income 4 19,577 – 19,577 20,534 – 20,534 17,871 – 17,871
Derivative income 4 6,882 – 6,882 6,182 – 6,182 5,644 – 5,644
Other income 4 131 – 131 162 – 162 84 – 84
Total income 26,590 – 26,590 26,878 – 26,878 23,599 – 23,599
Gains on investments at fair value through profit or loss – 131,190 131,190 – 330,480 330,480 – 232,740 232,740
Gains on derivative instruments – 12,667 12,667 – 17,568 17,568 – 18,114 18,114
Foreign exchange (losses)/gains on other net assets – (3,863) (3,863) – 6,936 6,936 660 6,153 6,813
Foreign exchange gains/(losses) on bank loans – 7,733 7,733 – (15,350) (15,350) – (10,959) (10,959)
Total income and gains 26,590 147,727 174,317 26,878 339,634 366,512 24,259 246,048 270,307
Expenses
Investment management fees and performance fees 5 (1,664) (4,991) (6,655) (5,485) (5,485) (10,970) (2,682) (3,353) (6,035)
Other expenses (807) – (807) (1,737) – (1,737) (938) – (938)
Profit before finance costs and taxation 24,119 142,736 166,855 19,656 334,149 353,805 20,639 242,695 263,334
Finance costs 6 (1,059) (3,177) (4,236) (2,809) (2,809) (5,618) (1,143) (1,143) (2,286)
Profit before taxation 23,060 139,559 162,619 16,847 331,340 348,187 19,496 241,552 261,048
Taxation (632) – (632) (709) – (709) (615) – (615)
Profit after taxation for the period 22,428 139,559 161,987 16,138 331,340 347,478 18,881 241,552 260,433
Earnings per Ordinary Share 7 4.06p 25.29p 29.35p 2.92p 60.01p 62.93p 3.42p 43.72p 47.14p
The Company does not have any income or expenses that are not included in the profit after taxation for the period. Accordingly the profit after taxation for the period is also the total comprehensive income for the period and no separate Statement of Comprehensive Income has been presented.
The total column of this statement represents the Income Statement of the Company and is prepared in accordance with IFRS. The revenue and capital columns are supplementary and presented for information purposes as recommended by the Statement of Recommended Practice issued by the AIC.
All of the profit and total comprehensive income is attributable to the equity shareholders of the Company. There are no minority interests.
No operations were acquired or discontinued in the period and all items in the above statement derive from continuing operations.
12 Fidelity China Special Situations PLC Half-yearly Report 2017
Job No: 31561 Proof Event: 13 Black Line Event: 2 Park Communications Ltd Alpine Way London E6 6LA
Customer: Fidelity Project Title: Fidelity FCSS Half Year Rpt 2016 T: 0207 055 6500 F: 020 7055 6600
Job No: 31561 Proof Event: 13 Black Line Event: 2 Park Communications Ltd Alpine Way London E6 6LA
Customer: Fidelity Project Title: Fidelity FCSS Half Year Rpt 2016 T: 0207 055 6500 F: 020 7055 6600
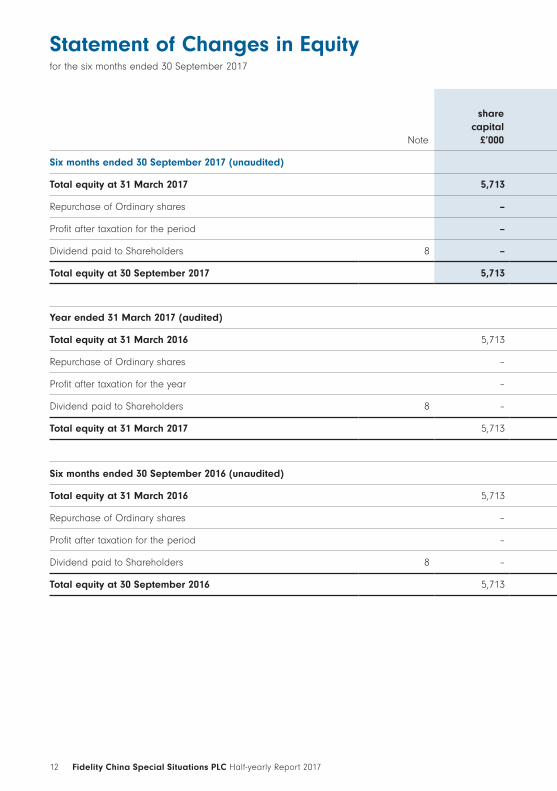
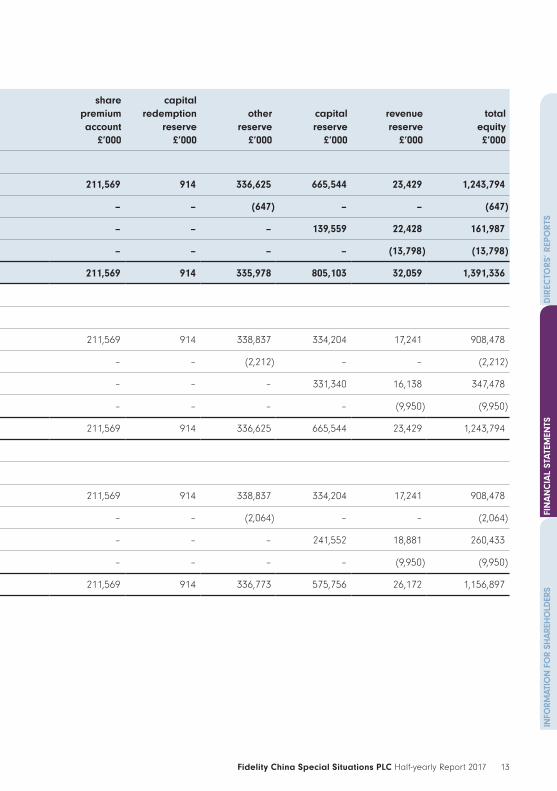
Statement of Changes in Equityfor the six months ended 30 September 2017
Note
share capital
£’000
share premium account
£’000
capital redemption
reserve £’000
other reserve
£’000
capital reserve
£’000
revenue reserve
£’000
total equity £’000
Six months ended 30 September 2017 (unaudited)
Total equity at 31 March 2017 5,713 211,569 914 336,625 665,544 23,429 1,243,794
Repurchase of Ordinary shares – – – (647) – – (647)
Profit after taxation for the period – – – – 139,559 22,428 161,987
Dividend paid to Shareholders 8 – – – – – (13,798) (13,798)
Total equity at 30 September 2017 5,713 211,569 914 335,978 805,103 32,059 1,391,336
Year ended 31 March 2017 (audited)
Total equity at 31 March 2016 5,713 211,569 914 338,837 334,204 17,241 908,478
Repurchase of Ordinary shares – – – (2,212) – – (2,212)
Profit after taxation for the year – – – – 331,340 16,138 347,478
Dividend paid to Shareholders 8 – – – – – (9,950) (9,950)
Total equity at 31 March 2017 5,713 211,569 914 336,625 665,544 23,429 1,243,794
Six months ended 30 September 2016 (unaudited)
Total equity at 31 March 2016 5,713 211,569 914 338,837 334,204 17,241 908,478
Repurchase of Ordinary shares – – – (2,064) – – (2,064)
Profit after taxation for the period – – – – 241,552 18,881 260,433
Dividend paid to Shareholders 8 – – – – – (9,950) (9,950)
Total equity at 30 September 2016 5,713 211,569 914 336,773 575,756 26,172 1,156,897
13 Fidelity China Special Situations PLC Half-yearly Report 2017
Job No: 31561 Proof Event: 13 Black Line Event: 2 Park Communications Ltd Alpine Way London E6 6LA
Customer: Fidelity Project Title: Fidelity FCSS Half Year Rpt 2016 T: 0207 055 6500 F: 020 7055 6600
Job No: 31561 Proof Event: 13 Black Line Event: 2 Park Communications Ltd Alpine Way London E6 6LA
Customer: Fidelity Project Title: Fidelity FCSS Half Year Rpt 2016 T: 0207 055 6500 F: 020 7055 6600
FIN
AN
CIA
L ST
ATE
MEN
TSIN
FORM
ATIO
N F
OR
SHA
REH
OLD
ERS
DIR
ECTO
RS’
REP
ORTS
DIR
ECTO
RS’
REP
ORTS
FIN
AN
CIA
L ST
ATE
MEN
TS
Note
share capital
£’000
share premium account
£’000
capital redemption
reserve £’000
other reserve
£’000
capital reserve
£’000
revenue reserve
£’000
total equity £’000
Six months ended 30 September 2017 (unaudited)
Total equity at 31 March 2017 5,713 211,569 914 336,625 665,544 23,429 1,243,794
Repurchase of Ordinary shares – – – (647) – – (647)
Profit after taxation for the period – – – – 139,559 22,428 161,987
Dividend paid to Shareholders 8 – – – – – (13,798) (13,798)
Total equity at 30 September 2017 5,713 211,569 914 335,978 805,103 32,059 1,391,336
Year ended 31 March 2017 (audited)
Total equity at 31 March 2016 5,713 211,569 914 338,837 334,204 17,241 908,478
Repurchase of Ordinary shares – – – (2,212) – – (2,212)
Profit after taxation for the year – – – – 331,340 16,138 347,478
Dividend paid to Shareholders 8 – – – – – (9,950) (9,950)
Total equity at 31 March 2017 5,713 211,569 914 336,625 665,544 23,429 1,243,794
Six months ended 30 September 2016 (unaudited)
Total equity at 31 March 2016 5,713 211,569 914 338,837 334,204 17,241 908,478
Repurchase of Ordinary shares – – – (2,064) – – (2,064)
Profit after taxation for the period – – – – 241,552 18,881 260,433
Dividend paid to Shareholders 8 – – – – – (9,950) (9,950)
Total equity at 30 September 2016 5,713 211,569 914 336,773 575,756 26,172 1,156,897
14 Fidelity China Special Situations PLC Half-yearly Report 2017
Job No: 31561 Proof Event: 13 Black Line Event: 2 Park Communications Ltd Alpine Way London E6 6LA
Customer: Fidelity Project Title: Fidelity FCSS Half Year Rpt 2016 T: 0207 055 6500 F: 020 7055 6600
Job No: 31561 Proof Event: 13 Black Line Event: 2 Park Communications Ltd Alpine Way London E6 6LA
Customer: Fidelity Project Title: Fidelity FCSS Half Year Rpt 2016 T: 0207 055 6500 F: 020 7055 6600
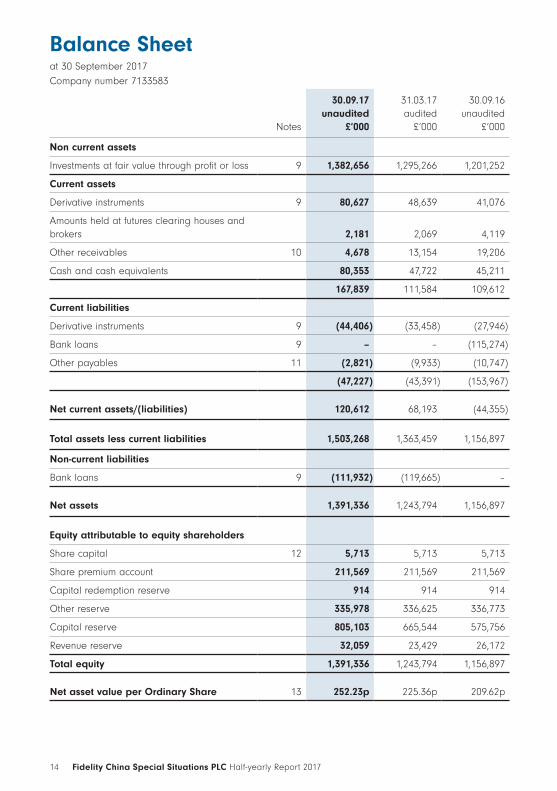
Balance Sheetat 30 September 2017 Company number 7133583
Notes
30.09.17 unaudited
£’000
31.03.17 audited
£’000
30.09.16 unaudited
£’000
Non current assets
Investments at fair value through profit or loss 9 1,382,656 1,295,266 1,201,252
Current assets
Derivative instruments 9 80,627 48,639 41,076
Amounts held at futures clearing houses and brokers 2,181 2,069 4,119
Other receivables 10 4,678 13,154 19,206
Cash and cash equivalents 80,353 47,722 45,211
167,839 111,584 109,612
Current liabilities
Derivative instruments 9 (44,406) (33,458) (27,946)
Bank loans 9 – – (115,274)
Other payables 11 (2,821) (9,933) (10,747)
(47,227) (43,391) (153,967)
Net current assets/(liabilities) 120,612 68,193 (44,355)
Total assets less current liabilities 1,503,268 1,363,459 1,156,897
Non-current liabilities
Bank loans 9 (111,932) (119,665) –
Net assets 1,391,336 1,243,794 1,156,897
Equity attributable to equity shareholders
Share capital 12 5,713 5,713 5,713
Share premium account 211,569 211,569 211,569
Capital redemption reserve 914 914 914
Other reserve 335,978 336,625 336,773
Capital reserve 805,103 665,544 575,756
Revenue reserve 32,059 23,429 26,172
Total equity 1,391,336 1,243,794 1,156,897
Net asset value per Ordinary Share 13 252.23p 225.36p 209.62p
15 Fidelity China Special Situations PLC Half-yearly Report 2017
Job No: 31561 Proof Event: 13 Black Line Event: 2 Park Communications Ltd Alpine Way London E6 6LA
Customer: Fidelity Project Title: Fidelity FCSS Half Year Rpt 2016 T: 0207 055 6500 F: 020 7055 6600
Job No: 31561 Proof Event: 13 Black Line Event: 2 Park Communications Ltd Alpine Way London E6 6LA
Customer: Fidelity Project Title: Fidelity FCSS Half Year Rpt 2016 T: 0207 055 6500 F: 020 7055 6600
FIN
AN
CIA
L ST
ATE
MEN
TSIN
FORM
ATIO
N F
OR
SHA
REH
OLD
ERS
DIR
ECTO
RS’
REP
ORTS
DIR
ECTO
RS’
REP
ORTS
FIN
AN
CIA
L ST
ATE
MEN
TS
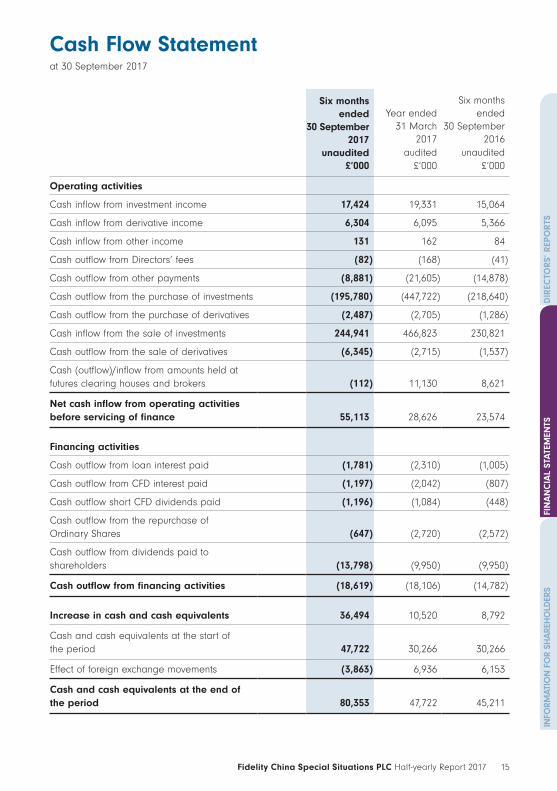
Cash Flow Statementat 30 September 2017
Six months ended
30 September 2017
unaudited £’000
Year ended31 March
2017audited
£’000
Six months ended
30 September 2016
unaudited £’000
Operating activities
Cash inflow from investment income 17,424 19,331 15,064
Cash inflow from derivative income 6,304 6,095 5,366
Cash inflow from other income 131 162 84
Cash outflow from Directors’ fees (82) (168) (41)
Cash outflow from other payments (8,881) (21,605) (14,878)
Cash outflow from the purchase of investments (195,780) (447,722) (218,640)
Cash outflow from the purchase of derivatives (2,487) (2,705) (1,286)
Cash inflow from the sale of investments 244,941 466,823 230,821
Cash outflow from the sale of derivatives (6,345) (2,715) (1,537)
Cash (outflow)/inflow from amounts held at futures clearing houses and brokers (112) 11,130 8,621
Net cash inflow from operating activities before servicing of finance 55,113 28,626 23,574
Financing activities
Cash outflow from loan interest paid (1,781) (2,310) (1,005)
Cash outflow from CFD interest paid (1,197) (2,042) (807)
Cash outflow short CFD dividends paid (1,196) (1,084) (448)
Cash outflow from the repurchase of Ordinary Shares (647) (2,720) (2,572)
Cash outflow from dividends paid to shareholders (13,798) (9,950) (9,950)
Cash outflow from financing activities (18,619) (18,106) (14,782)
Increase in cash and cash equivalents 36,494 10,520 8,792
Cash and cash equivalents at the start of the period 47,722 30,266 30,266
Effect of foreign exchange movements (3,863) 6,936 6,153
Cash and cash equivalents at the end of the period 80,353 47,722 45,211
16 Fidelity China Special Situations PLC Half-yearly Report 2017
Job No: 31561 Proof Event: 13 Black Line Event: 2 Park Communications Ltd Alpine Way London E6 6LA
Customer: Fidelity Project Title: Fidelity FCSS Half Year Rpt 2016 T: 0207 055 6500 F: 020 7055 6600
Job No: 31561 Proof Event: 13 Black Line Event: 2 Park Communications Ltd Alpine Way London E6 6LA
Customer: Fidelity Project Title: Fidelity FCSS Half Year Rpt 2016 T: 0207 055 6500 F: 020 7055 6600
Notes to the Financial Statements
1 Principal Activity
Fidelity China Special Situations PLC is an Investment Company incorporated in England and Wales with a premium listing on the London Stock Exchange. The Company’s registration number is 7133583, and its registered office is Beech Gate, Millfield Lane, Lower Kingswood, Tadworth, Surrey, KT20 6RP. The Company has been approved by HM Revenue & Customs as an Investment Trust under Section 1158 of the Corporation Tax Act, 2010 and intends to conduct its affairs so as to continue to be approved.
2 Publication of Non-statutory Accounts
The Financial Statements in this half-yearly financial report have not been audited by the Company’s Independent Auditor and do not constitute statutory accounts as defined in section 434 of the Companies Act 2006 (the “Act”). The financial information for the year ended 31 March 2017 is extracted from the latest published financial statements of the Company. Those financial statements were delivered to the Registrar of Companies and included the Independent Auditor’s Report which was unqualified and did not contain a statement under either section 498(2) or 498(3) of the Act.
3 Basis of Preparation
These half-yearly financial statements have been prepared in accordance with International Accounting Standard 34: Interim Financial Reporting and use the same accounting policies as set out in the Company’s Annual Report and Financial Statements for the year ended 31 March 2017. Those Financial Statements were prepared in accordance with; International Financial Reporting Standards (“IFRS”), to the extent that they have been adopted by the European Union, the Companies Acts that apply to companies reporting under IFRS, IFRC interpretations and, as far as it is consistent with IFRS, the Statement of Recommended Practice: Financial Statements of Investment Trust Companies and Venture Capital Trusts (“SORP”) issued by the Association of Investment Companies (“AIC”), in November 2014.
As explained in the Interim Management Report and Directors’ Responsibility Statement on page 6, with effect from 1 April 2017, 25% of investment management fees and finance costs are charged to revenue and 75% to capital. Prior to 1 April 2017, investment management fees and finance costs were charged 50% to revenue and 50% to capital.
17 Fidelity China Special Situations PLC Half-yearly Report 2017
Job No: 31561 Proof Event: 13 Black Line Event: 2 Park Communications Ltd Alpine Way London E6 6LA
Customer: Fidelity Project Title: Fidelity FCSS Half Year Rpt 2016 T: 0207 055 6500 F: 020 7055 6600
Job No: 31561 Proof Event: 13 Black Line Event: 2 Park Communications Ltd Alpine Way London E6 6LA
Customer: Fidelity Project Title: Fidelity FCSS Half Year Rpt 2016 T: 0207 055 6500 F: 020 7055 6600
FIN
AN
CIA
L ST
ATE
MEN
TSIN
FORM
ATIO
N F
OR
SHA
REH
OLD
ERS
DIR
ECTO
RS’
REP
ORTS
DIR
ECTO
RS’
REP
ORTS
FIN
AN
CIA
L ST
ATE
MEN
TS
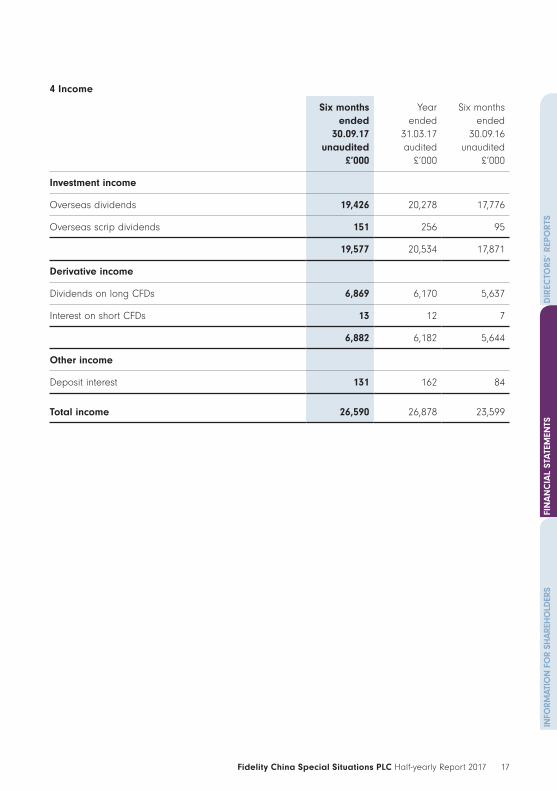
4 Income
Six months ended
30.09.17 unaudited
£’000
Year ended
31.03.17 audited
£’000
Six months ended
30.09.16 unaudited
£’000
Investment income
Overseas dividends 19,426 20,278 17,776
Overseas scrip dividends 151 256 95
19,577 20,534 17,871
Derivative income
Dividends on long CFDs 6,869 6,170 5,637
Interest on short CFDs 13 12 7
6,882 6,182 5,644
Other income
Deposit interest 131 162 84
Total income 26,590 26,878 23,599
18 Fidelity China Special Situations PLC Half-yearly Report 2017
Job No: 31561 Proof Event: 13 Black Line Event: 2 Park Communications Ltd Alpine Way London E6 6LA
Customer: Fidelity Project Title: Fidelity FCSS Half Year Rpt 2016 T: 0207 055 6500 F: 020 7055 6600
Job No: 31561 Proof Event: 13 Black Line Event: 2 Park Communications Ltd Alpine Way London E6 6LA
Customer: Fidelity Project Title: Fidelity FCSS Half Year Rpt 2016 T: 0207 055 6500 F: 020 7055 6600
Notes to the Financial Statements continued
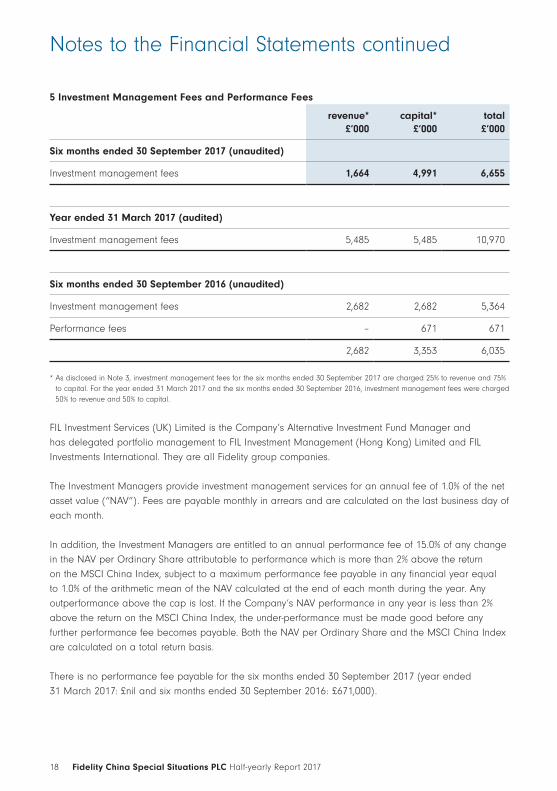
5 Investment Management Fees and Performance Fees
revenue* £’000
capital* £’000
total £’000
Six months ended 30 September 2017 (unaudited)
Investment management fees 1,664 4,991 6,655
Year ended 31 March 2017 (audited)
Investment management fees 5,485 5,485 10,970
Six months ended 30 September 2016 (unaudited)
Investment management fees 2,682 2,682 5,364
Performance fees – 671 671
2,682 3,353 6,035
* As disclosed in Note 3, investment management fees for the six months ended 30 September 2017 are charged 25% to revenue and 75% to capital. For the year ended 31 March 2017 and the six months ended 30 September 2016, investment management fees were charged 50% to revenue and 50% to capital.
FIL Investment Services (UK) Limited is the Company’s Alternative Investment Fund Manager and has delegated portfolio management to FIL Investment Management (Hong Kong) Limited and FIL Investments International. They are all Fidelity group companies.
The Investment Managers provide investment management services for an annual fee of 1.0% of the net asset value (“NAV”). Fees are payable monthly in arrears and are calculated on the last business day of each month.
In addition, the Investment Managers are entitled to an annual performance fee of 15.0% of any change in the NAV per Ordinary Share attributable to performance which is more than 2% above the return on the MSCI China Index, subject to a maximum performance fee payable in any financial year equal to 1.0% of the arithmetic mean of the NAV calculated at the end of each month during the year. Any outperformance above the cap is lost. If the Company’s NAV performance in any year is less than 2% above the return on the MSCI China Index, the under-performance must be made good before any further performance fee becomes payable. Both the NAV per Ordinary Share and the MSCI China Index are calculated on a total return basis.
There is no performance fee payable for the six months ended 30 September 2017 (year ended 31 March 2017: £nil and six months ended 30 September 2016: £671,000).
19 Fidelity China Special Situations PLC Half-yearly Report 2017
Job No: 31561 Proof Event: 13 Black Line Event: 2 Park Communications Ltd Alpine Way London E6 6LA
Customer: Fidelity Project Title: Fidelity FCSS Half Year Rpt 2016 T: 0207 055 6500 F: 020 7055 6600
Job No: 31561 Proof Event: 13 Black Line Event: 2 Park Communications Ltd Alpine Way London E6 6LA
Customer: Fidelity Project Title: Fidelity FCSS Half Year Rpt 2016 T: 0207 055 6500 F: 020 7055 6600
FIN
AN
CIA
L ST
ATE
MEN
TSIN
FORM
ATIO
N F
OR
SHA
REH
OLD
ERS
DIR
ECTO
RS’
REP
ORTS
DIR
ECTO
RS’
REP
ORTS
FIN
AN
CIA
L ST
ATE
MEN
TS
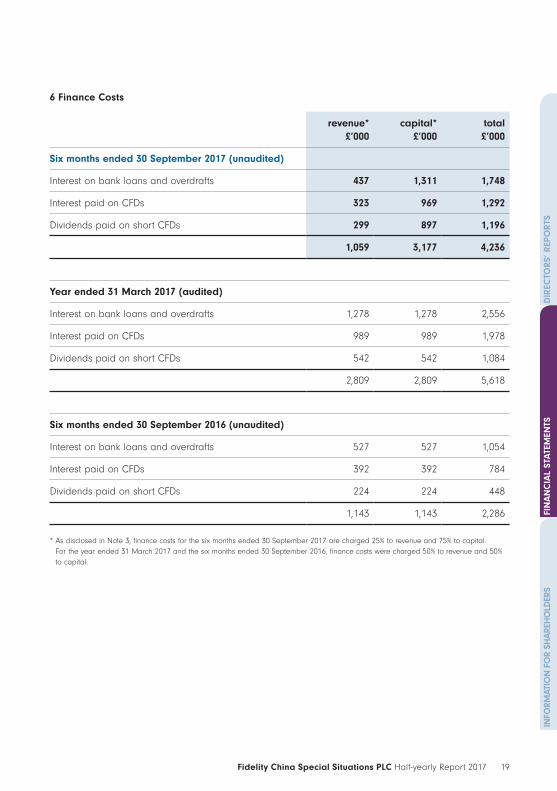
6 Finance Costs
revenue* £’000
capital* £’000
total £’000
Six months ended 30 September 2017 (unaudited)
Interest on bank loans and overdrafts 437 1,311 1,748
Interest paid on CFDs 323 969 1,292
Dividends paid on short CFDs 299 897 1,196
1,059 3,177 4,236
Year ended 31 March 2017 (audited)
Interest on bank loans and overdrafts 1,278 1,278 2,556
Interest paid on CFDs 989 989 1,978
Dividends paid on short CFDs 542 542 1,084
2,809 2,809 5,618
Six months ended 30 September 2016 (unaudited)
Interest on bank loans and overdrafts 527 527 1,054
Interest paid on CFDs 392 392 784
Dividends paid on short CFDs 224 224 448
1,143 1,143 2,286
* As disclosed in Note 3, finance costs for the six months ended 30 September 2017 are charged 25% to revenue and 75% to capital. For the year ended 31 March 2017 and the six months ended 30 September 2016, finance costs were charged 50% to revenue and 50% to capital.
20 Fidelity China Special Situations PLC Half-yearly Report 2017
Job No: 31561 Proof Event: 13 Black Line Event: 2 Park Communications Ltd Alpine Way London E6 6LA
Customer: Fidelity Project Title: Fidelity FCSS Half Year Rpt 2016 T: 0207 055 6500 F: 020 7055 6600
Job No: 31561 Proof Event: 13 Black Line Event: 2 Park Communications Ltd Alpine Way London E6 6LA
Customer: Fidelity Project Title: Fidelity FCSS Half Year Rpt 2016 T: 0207 055 6500 F: 020 7055 6600
Notes to the Financial Statements continued
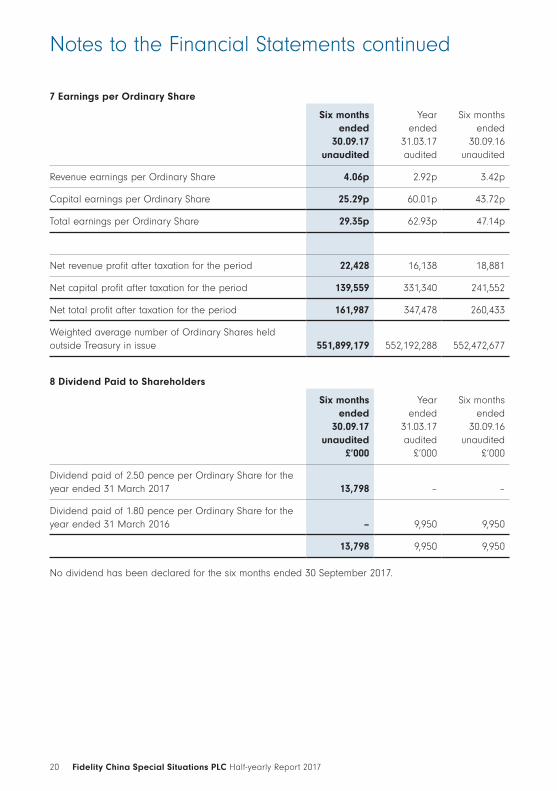
7 Earnings per Ordinary Share
Six months ended
30.09.17 unaudited
Year ended
31.03.17 audited
Six months ended
30.09.16 unaudited
Revenue earnings per Ordinary Share 4.06p 2.92p 3.42p
Capital earnings per Ordinary Share 25.29p 60.01p 43.72p
Total earnings per Ordinary Share 29.35p 62.93p 47.14p
Net revenue profit after taxation for the period 22,428 16,138 18,881
Net capital profit after taxation for the period 139,559 331,340 241,552
Net total profit after taxation for the period 161,987 347,478 260,433
Weighted average number of Ordinary Shares held outside Treasury in issue 551,899,179 552,192,288 552,472,677
8 Dividend Paid to Shareholders
Six months ended
30.09.17 unaudited
£’000
Year ended
31.03.17 audited
£’000
Six months ended
30.09.16 unaudited
£’000
Dividend paid of 2.50 pence per Ordinary Share for the year ended 31 March 2017 13,798 – –
Dividend paid of 1.80 pence per Ordinary Share for the year ended 31 March 2016 – 9,950 9,950
13,798 9,950 9,950
No dividend has been declared for the six months ended 30 September 2017.
21 Fidelity China Special Situations PLC Half-yearly Report 2017
Job No: 31561 Proof Event: 13 Black Line Event: 2 Park Communications Ltd Alpine Way London E6 6LA
Customer: Fidelity Project Title: Fidelity FCSS Half Year Rpt 2016 T: 0207 055 6500 F: 020 7055 6600
Job No: 31561 Proof Event: 13 Black Line Event: 2 Park Communications Ltd Alpine Way London E6 6LA
Customer: Fidelity Project Title: Fidelity FCSS Half Year Rpt 2016 T: 0207 055 6500 F: 020 7055 6600
FIN
AN
CIA
L ST
ATE
MEN
TSIN
FORM
ATIO
N F
OR
SHA
REH
OLD
ERS
DIR
ECTO
RS’
REP
ORTS
DIR
ECTO
RS’
REP
ORTS
FIN
AN
CIA
L ST
ATE
MEN
TS
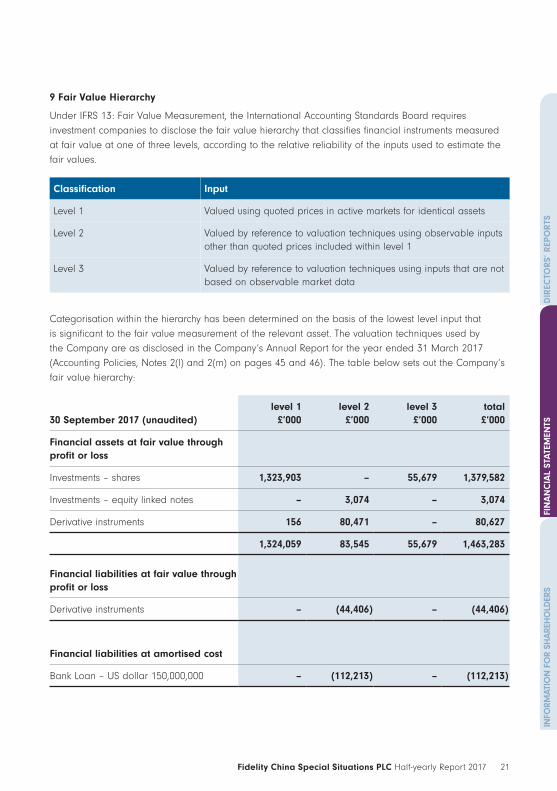
9 Fair Value Hierarchy
Under IFRS 13: Fair Value Measurement, the International Accounting Standards Board requires investment companies to disclose the fair value hierarchy that classifies financial instruments measured at fair value at one of three levels, according to the relative reliability of the inputs used to estimate the fair values.
Classification Input
Level 1 Valued using quoted prices in active markets for identical assets
Level 2 Valued by reference to valuation techniques using observable inputs other than quoted prices included within level 1
Level 3 Valued by reference to valuation techniques using inputs that are not based on observable market data
Categorisation within the hierarchy has been determined on the basis of the lowest level input that is significant to the fair value measurement of the relevant asset. The valuation techniques used by the Company are as disclosed in the Company’s Annual Report for the year ended 31 March 2017 (Accounting Policies, Notes 2(l) and 2(m) on pages 45 and 46). The table below sets out the Company’s fair value hierarchy:
30 September 2017 (unaudited)level 1
£’000level 2
£’000level 3
£’000total£’000
Financial assets at fair value through profit or loss
Investments – shares 1,323,903 – 55,679 1,379,582
Investments – equity linked notes – 3,074 – 3,074
Derivative instruments 156 80,471 – 80,627
1,324,059 83,545 55,679 1,463,283
Financial liabilities at fair value through profit or loss
Derivative instruments – (44,406) – (44,406)
Financial liabilities at amortised cost
Bank Loan – US dollar 150,000,000 – (112,213) – (112,213)
22 Fidelity China Special Situations PLC Half-yearly Report 2017
Job No: 31561 Proof Event: 13 Black Line Event: 2 Park Communications Ltd Alpine Way London E6 6LA
Customer: Fidelity Project Title: Fidelity FCSS Half Year Rpt 2016 T: 0207 055 6500 F: 020 7055 6600
Job No: 31561 Proof Event: 13 Black Line Event: 2 Park Communications Ltd Alpine Way London E6 6LA
Customer: Fidelity Project Title: Fidelity FCSS Half Year Rpt 2016 T: 0207 055 6500 F: 020 7055 6600
Notes to the Financial Statements continued
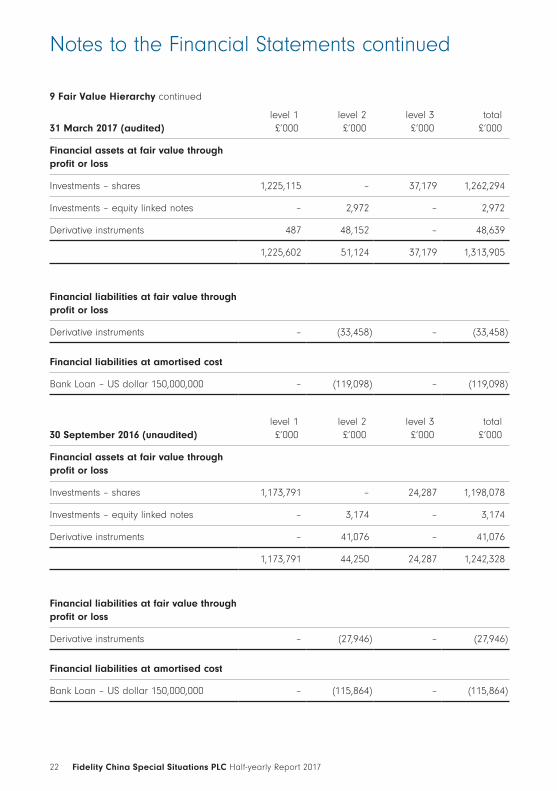
9 Fair Value Hierarchy continued
31 March 2017 (audited) level 1£’000
level 2£’000
level 3£’000
total£’000
Financial assets at fair value through profit or loss
Investments – shares 1,225,115 – 37,179 1,262,294
Investments – equity linked notes – 2,972 – 2,972
Derivative instruments 487 48,152 – 48,639
1,225,602 51,124 37,179 1,313,905
Financial liabilities at fair value through profit or loss
Derivative instruments – (33,458) – (33,458)
Financial liabilities at amortised cost
Bank Loan – US dollar 150,000,000 – (119,098) – (119,098)
30 September 2016 (unaudited) level 1£’000
level 2£’000
level 3£’000
total£’000
Financial assets at fair value through profit or loss
Investments – shares 1,173,791 – 24,287 1,198,078
Investments – equity linked notes – 3,174 – 3,174
Derivative instruments – 41,076 – 41,076
1,173,791 44,250 24,287 1,242,328
Financial liabilities at fair value through profit or loss
Derivative instruments – (27,946) – (27,946)
Financial liabilities at amortised cost
Bank Loan – US dollar 150,000,000 – (115,864) – (115,864)
23 Fidelity China Special Situations PLC Half-yearly Report 2017
Job No: 31561 Proof Event: 13 Black Line Event: 2 Park Communications Ltd Alpine Way London E6 6LA
Customer: Fidelity Project Title: Fidelity FCSS Half Year Rpt 2016 T: 0207 055 6500 F: 020 7055 6600
Job No: 31561 Proof Event: 13 Black Line Event: 2 Park Communications Ltd Alpine Way London E6 6LA
Customer: Fidelity Project Title: Fidelity FCSS Half Year Rpt 2016 T: 0207 055 6500 F: 020 7055 6600
FIN
AN
CIA
L ST
ATE
MEN
TSIN
FORM
ATIO
N F
OR
SHA
REH
OLD
ERS
DIR
ECTO
RS’
REP
ORTS
DIR
ECTO
RS’
REP
ORTS
FIN
AN
CIA
L ST
ATE
MEN
TS
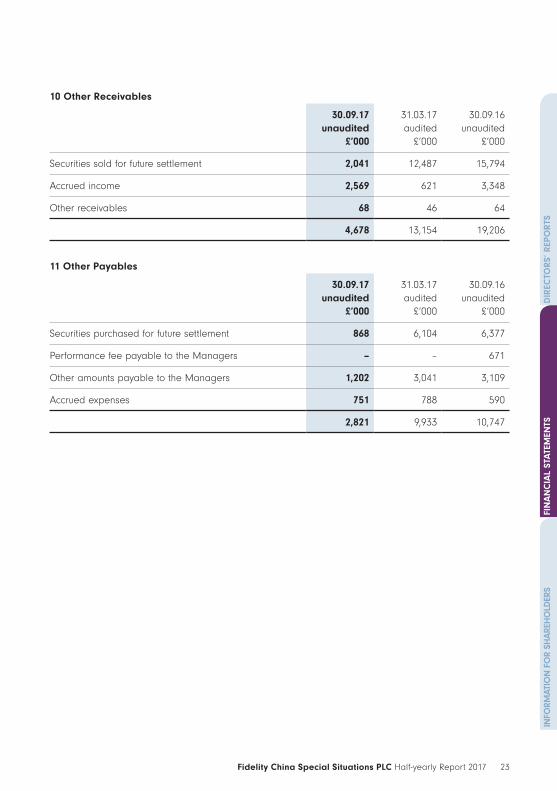
10 Other Receivables
30.09.17 unaudited
£’000
31.03.17 audited
£’000
30.09.16 unaudited
£’000
Securities sold for future settlement 2,041 12,487 15,794
Accrued income 2,569 621 3,348
Other receivables 68 46 64
4,678 13,154 19,206
11 Other Payables
30.09.17 unaudited
£’000
31.03.17 audited
£’000
30.09.16 unaudited
£’000
Securities purchased for future settlement 868 6,104 6,377
Performance fee payable to the Managers – – 671
Other amounts payable to the Managers 1,202 3,041 3,109
Accrued expenses 751 788 590
2,821 9,933 10,747
24 Fidelity China Special Situations PLC Half-yearly Report 2017
Job No: 31561 Proof Event: 13 Black Line Event: 2 Park Communications Ltd Alpine Way London E6 6LA
Customer: Fidelity Project Title: Fidelity FCSS Half Year Rpt 2016 T: 0207 055 6500 F: 020 7055 6600
Job No: 31561 Proof Event: 13 Black Line Event: 2 Park Communications Ltd Alpine Way London E6 6LA
Customer: Fidelity Project Title: Fidelity FCSS Half Year Rpt 2016 T: 0207 055 6500 F: 020 7055 6600
Notes to the Financial Statements continued
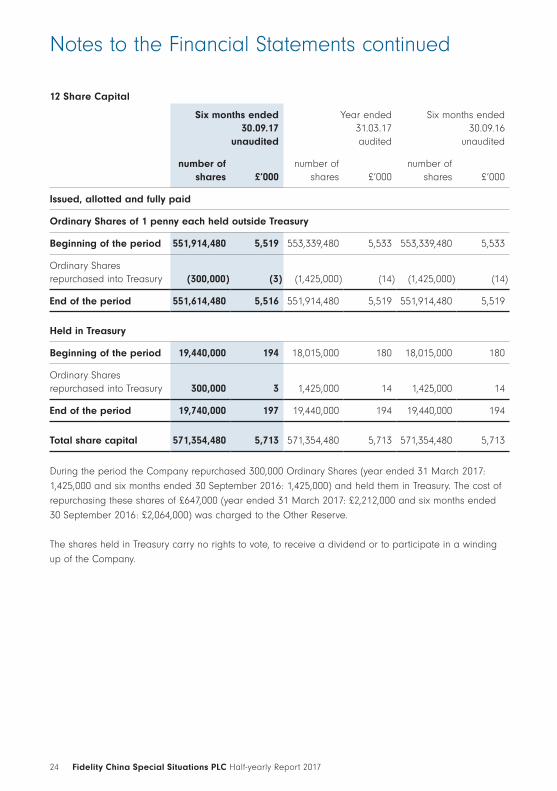
12 Share Capital
Six months ended 30.09.17
unaudited
Year ended 31.03.17 audited
Six months ended 30.09.16
unaudited
number of shares £’000
number of shares £’000
number of shares £’000
Issued, allotted and fully paid
Ordinary Shares of 1 penny each held outside Treasury
Beginning of the period 551,914,480 5,519 553,339,480 5,533 553,339,480 5,533
Ordinary Shares repurchased into Treasury (300,000) (3) (1,425,000) (14) (1,425,000) (14)
End of the period 551,614,480 5,516 551,914,480 5,519 551,914,480 5,519
Held in Treasury
Beginning of the period 19,440,000 194 18,015,000 180 18,015,000 180
Ordinary Shares repurchased into Treasury 300,000 3 1,425,000 14 1,425,000 14
End of the period 19,740,000 197 19,440,000 194 19,440,000 194
Total share capital 571,354,480 5,713 571,354,480 5,713 571,354,480 5,713
During the period the Company repurchased 300,000 Ordinary Shares (year ended 31 March 2017: 1,425,000 and six months ended 30 September 2016: 1,425,000) and held them in Treasury. The cost of repurchasing these shares of £647,000 (year ended 31 March 2017: £2,212,000 and six months ended 30 September 2016: £2,064,000) was charged to the Other Reserve.
The shares held in Treasury carry no rights to vote, to receive a dividend or to participate in a winding up of the Company.
25 Fidelity China Special Situations PLC Half-yearly Report 2017
Job No: 31561 Proof Event: 13 Black Line Event: 2 Park Communications Ltd Alpine Way London E6 6LA
Customer: Fidelity Project Title: Fidelity FCSS Half Year Rpt 2016 T: 0207 055 6500 F: 020 7055 6600
Job No: 31561 Proof Event: 13 Black Line Event: 2 Park Communications Ltd Alpine Way London E6 6LA
Customer: Fidelity Project Title: Fidelity FCSS Half Year Rpt 2016 T: 0207 055 6500 F: 020 7055 6600
FIN
AN
CIA
L ST
ATE
MEN
TSIN
FORM
ATIO
N F
OR
SHA
REH
OLD
ERS
DIR
ECTO
RS’
REP
ORTS
DIR
ECTO
RS’
REP
ORTS
FIN
AN
CIA
L ST
ATE
MEN
TS
13 Net Asset Value Per Ordinary Share
The net asset value per Ordinary Share is based on net assets of £1,391,336,000 (31 March 2017: £1,243,794,000 and 30 September 2016: £1,156,897,000) and on 551,614,480 (31 March 2017: 551,914,480 and 30 September 2016: 551,914,480) Ordinary Shares, being the number of Ordinary Shares held outside Treasury in issue at the period end. It is the Company’s policy that Ordinary Shares held in Treasury will only be issued at a premium to net asset value per share and, therefore, the shares held in Treasury have no dilutive effect.
14 Transactions with the Managers and Related Parties
FIL Investment Services (UK) Limited is the Company’s Alternative Investment Fund Manager and has delegated portfolio management to FIL Investment Management (Hong Kong) Limited and FIL Investments International (“the Investment Managers”). They are all Fidelity group companies.
Details of the fee arrangements are given in Note 5. The following amounts were charged by the Investment Managers in the period; investment management fees: £6,655,000 (year ended 31 March 2017: £10,970,000 and six months ended 30 September 2016: £5,364,000), performance fees: £nil (year ended 31 March 2017: £nil and six months ended 30 September 2016: £671,000) and accounting, administration and secretarial fees: £300,000 (year ended 31 March 2017: £600,000 and six months ended 30 September 2016: £300,000). Fidelity also provides the Company with marketing services. The amount charged for these services was £106,000 (year ended 31 March 2017: £257,000 and six months ended 30 September 2016: £163,000). Amounts payable to the Managers at the Balance Sheet date are included in other payables and are disclosed in Note 11.
As at 30 September 2017, the Board consisted of six non-executive Directors (as shown in the Shareholder Information on page 30) all of whom are considered to be independent by the Board, apart from John Ford who is employed by Fidelity. None of the Directors has a service contract with the Company.
The Chairman receives an annual fee of £42,000, the Audit Committee Chairman receives an annual fee of £32,000, the Chairman of the Investment Committee receives an annual fee of £31,500, the Senior Independent Director receives an annual fee of £31,500 and each other Director receives an annual fee of £26,500, apart from John Ford who waives his Directors’ fees. The following members of the Board hold Ordinary Shares in the Company: Nicholas Bull 90,804 shares, David Causer 65,804 shares, John Ford 7,720 shares, Peter Pleydell-Bouverie 78,683 shares, Elisabeth Scott 19,819 shares and Vera Hong Wei 3,015 shares.
26 Fidelity China Special Situations PLC Half-yearly Report 2017
Job No: 31561 Proof Event: 13 Black Line Event: 2 Park Communications Ltd Alpine Way London E6 6LA
Customer: Fidelity Project Title: Fidelity FCSS Half Year Rpt 2016 T: 0207 055 6500 F: 020 7055 6600
Job No: 31561 Proof Event: 13 Black Line Event: 2 Park Communications Ltd Alpine Way London E6 6LA
Customer: Fidelity Project Title: Fidelity FCSS Half Year Rpt 2016 T: 0207 055 6500 F: 020 7055 6600
AIF
Alternative Investment Fund. The Company is an AIF.
AIFM
Alternative Investment Fund Manager. The Board has appointed FIL Investment Services (UK) Limited to act as the Company’s AIFM.
AIFMD
The Alternative Investment Fund Managers Directive is a European Union Directive implemented on 22 July 2014.
Benchmark Index
MSCI China Index total return – in UK sterling and is a composite of China “B”, “H”, “Red Chip” and “P Chip” share classes.
China “A” Shares
Shares traded on the Chinese Stock Exchanges in Chinese renminbi. Foreign investors were unable to participate in the China “A” Shares market until the introduction of the QFII program in 2002 which provided a legal framework for licensed QFIIs to invest in China “A” shares on the Chinese Stock exchanges and certain other securities previously not eligible for investment by foreign investors.
China “B” Shares
Shares traded on the Shenzhen Stock Exchange and Shanghai Stock Exchange in Hong Kong dollars and US dollars, respectively. The shares are available to foreign individuals and institutional investors and since February 2001, have also been available to domestic individual investors who trade through legal foreign currency accounts.
China “H” Shares
Shares in companies incorporated in the PRC and listed on the Hong Kong Stock Exchange. They are available to non-Chinese investors and are traded in Hong Kong dollars on the Hong Kong Stock Exchange.
Chinese Renminbi
Currency of the PRC.
Chinese Stock Exchanges
The Shanghai Stock Exchange, the Shenzhen Stock Exchange and any other stock exchange located within the PRC.
Contract For Difference (CFD)
A contract for difference is a derivative. It is a contract between the Company and an investment bank at the end of which the parties exchange the difference between the opening price and the closing price of the underlying asset of the specified financial instrument. It does not involve the Company buying or selling the underlying asset, only agreeing to receive or pay the movement in its share price. A contract for difference allows the Company to gain access to the movement in the share price by depositing a small amount of cash known as margin. The Company may reason that the asset price will rise, by buying (“long” position) or fall, by selling (“short” position). If the Company holds long positions, dividends are received and interest is paid. If the Company holds short positions, dividends are paid.
Debt
Bank borrowings and long contracts for difference.
Glossary to the Half-Yearly Report
27 Fidelity China Special Situations PLC Half-yearly Report 2017
Job No: 31561 Proof Event: 13 Black Line Event: 2 Park Communications Ltd Alpine Way London E6 6LA
Customer: Fidelity Project Title: Fidelity FCSS Half Year Rpt 2016 T: 0207 055 6500 F: 020 7055 6600
Job No: 31561 Proof Event: 13 Black Line Event: 2 Park Communications Ltd Alpine Way London E6 6LA
Customer: Fidelity Project Title: Fidelity FCSS Half Year Rpt 2016 T: 0207 055 6500 F: 020 7055 6600
DIR
ECTO
RS’
REP
ORTS
FIN
AN
CIA
L ST
ATE
MEN
TSIN
FORM
ATIO
N F
OR
SHA
REH
OLD
ERS
Derivatives
Financial instruments whose value is derived from the value of an underlying asset or other financial instruments. The main categories of derivatives are contracts for difference, warrants, futures and options.
Discount
If the share price of the Company is lower than the Net Asset Value per Ordinary Share, the Company’s shares are said to be trading at a discount. It is shown as a percentage of the Net Asset Value per Ordinary Share.
Equity Linked Notes (ELNs)
Debt instruments whose return on investment is linked to specific equities or equity markets. The return on equity linked notes may be determined by an equity index, a basket of equities, or a single equity.
Fair Value
The carrying value in the Balance Sheet which represents the amount that would be received or paid on disposal of the financial asset or liability.
Forward Currency Contract
An agreement to buy or sell a currency, commodity or other asset at a specified future date and at a predetermined price. It is not standardised and is not traded on organised exchanges.
Future or Future Contract
An agreement to buy or sell a stated amount of a security, currency or commodity at a specific future date and at a pre-agreed price.
Gearing
Gross Asset Exposure in excess of Net Assets.
Gross Assets
Net Assets plus borrowings.
Gross Asset Exposure
The value of the portfolio to which the Company is exposed, whether through direct or indirect investment (including the economic value of the exposure in the underlying asset of the derivatives, but excluding forward currency contracts).
Hedging
A hedge position demonstrates risk reduction qualities by delivering short exposure to an asset which has regional congruence and a correlation of at least 80% to long exposures in the Company’s portfolio. It therefore distinguishes itself from a “short” which is a position not opened with the objective of reducing the long exposure in the portfolio. Qualifying hedge exposures do not count towards the short exposure limits. For the purposes of calculating Gross Asset Exposure, the exposure attributed to the hedge positions will be deducted from the exposure of the corresponding long positions. Short positions are added to long positions in arriving at the Gross Asset Exposure.
Index Linked Securities
Debt instruments whose return on investment is linked to changes in interest rates, stock exchanges, or other price indices.
Investment Manager
FIL Investment Management (Hong Kong) Limited.
28 Fidelity China Special Situations PLC Half-yearly Report 2017
Job No: 31561 Proof Event: 13 Black Line Event: 2 Park Communications Ltd Alpine Way London E6 6LA
Customer: Fidelity Project Title: Fidelity FCSS Half Year Rpt 2016 T: 0207 055 6500 F: 020 7055 6600
Job No: 31561 Proof Event: 13 Black Line Event: 2 Park Communications Ltd Alpine Way London E6 6LA
Customer: Fidelity Project Title: Fidelity FCSS Half Year Rpt 2016 T: 0207 055 6500 F: 020 7055 6600
Glossary to the Half-Yearly Report continued
Investment Managers
Together, represents the Investment Manager and the Unlisted Investment Manager.
Management Fee
The annual management fee is 1.0% of the Net Asset Value of the Company.
Manager
FIL Investment Services (UK) Limited is the appointed Manager under the Alternative Investment Fund Managers Directive (AIFMD) and has delegated the investment management of the Company to the Investment Managers.
MSCI China Index
The Benchmark Index of the investment performance of the Company, UK sterling equivalent.
Net Assets
Net Assets represent the Company’s total assets less the Company’s total liabilities.
Net Asset Value (NAV)
Net Asset Value is sometimes described as “Shareholders’ Funds” and is the total value of the Company’s assets less the total value of its liabilities. For valuation purposes, it is common to express the Net Asset Value on a per share basis.
Net Asset Value (NAV) per Ordinary Share
The NAV per Ordinary Share is calculated as Shareholders’ Funds divided by the number of Ordinary Shares in issue.
Ongoing Charges
Ongoing charges are the regular, recurring operational expenses of the Company. Finance costs, taxation and the costs of buying and selling investments are excluded. The ongoing charges figure is expressed as a percentage of the average daily net asset values for the reporting period.
Options
An option is a contract which gives the right but not the obligation to buy or sell an underlying asset at an agreed price on or before an agreed date. Options may be call or put and are used to gain or reduce exposure to the underlying asset on a conditional basis.
P Chips
Companies controlled by mainland China individuals, with the establishment and origin of the company in mainland China. P Chips are incorporated outside of the PRC and traded on the Stock Exchange of Hong Kong with a majority of revenues or assets derived from mainland China.
Performance Fee
The Investment Managers are entitled to an annual performance fee of 15% of any change in NAV attributable to performance which is more than 2% above the returns on the MSCI China Index total return – in UK sterling (after making good any cumulative under-performance, including the 2% hurdle, carried forward from previous years), subject to a maximum performance fee payable in any year equal to 1.0% of the arithmetic mean of the value of assets with the valuation calculated at the end of each month during the year.
Portfolio
The Company’s portfolio which may be made up of equities, index linked securities, equity linked notes and other debt securities, cash deposits, money market instruments, foreign currency exchange transactions and other interests including derivatives (such as futures, options and contracts for difference).
PRC
The People’s Republic of China (excluding Taiwan and the Special Administrative Regions of Hong Kong and Macau of the PRC).
29 Fidelity China Special Situations PLC Half-yearly Report 2017
Job No: 31561 Proof Event: 13 Black Line Event: 2 Park Communications Ltd Alpine Way London E6 6LA
Customer: Fidelity Project Title: Fidelity FCSS Half Year Rpt 2016 T: 0207 055 6500 F: 020 7055 6600
Job No: 31561 Proof Event: 13 Black Line Event: 2 Park Communications Ltd Alpine Way London E6 6LA
Customer: Fidelity Project Title: Fidelity FCSS Half Year Rpt 2016 T: 0207 055 6500 F: 020 7055 6600
DIR
ECTO
RS’
REP
ORTS
FIN
AN
CIA
L ST
ATE
MEN
TSIN
FORM
ATIO
N F
OR
SHA
REH
OLD
ERS
Premium
If the share price of the Company is higher than the Net Asset Value per Ordinary Share, the Company’s shares are said to be trading at a premium. The premium is shown as a percentage of the Net Asset Value per Ordinary Share.
QFII
The Investment Manager is a QFII (a Qualified Foreign Institutional Investor) and as such has been granted a QFII licence by the China Securities Regulatory Commission (“CSRC”) which permits the Company to invest in China “A” Shares through the Investment Manager and has received an allocation of quota for onshore investment from the State Administration of Foreign Exchange of the PRC (“SAFE”).
Red Chips
Companies incorporated outside China but which are based in mainland China. Red Chips are listed on, and are required to observe the filing and reporting requirements of the Hong Kong Stock Exchange. Red Chips typically have a significant portion of their business interests located in mainland China and many are owned, either directly or indirectly, by organisations or enterprises controlled by the Chinese state, provinces or municipalities.
Return
The return generated in a given period from investments:
• Revenue Return – reflects the dividends and interest from investments and other income, net of expenses, finance costs and taxation;
• Capital Return – reflects the return on capital, excluding any revenue return; and
• Total Return – reflects the aggregate of revenue and capital returns.
Shareholders’ Funds
Also described as Net Asset Value, Shareholders’ Funds represent the total value of the Company’s assets less the total value of its liabilities as shown in the balance sheet.
Short Stock Exposure
The position of the Company when it has sold a security or derivative that it does not own but is now committed to eventually purchase in order to satisfy its obligation to sell. It is a strategy used to capitalise on an expected decline in the security’s or derivative’s price.
Treasury Shares
Ordinary Shares of the Company that have been repurchased by the Company and not cancelled but held in Treasury. These shares do not receive dividends, have no voting rights and are excluded from the Net Asset Value calculation.
Unlisted Investment Manager
FIL Investment Services (UK) Limited.
Unlisted Companies
Companies not listed on a regulated stock exchange. They are stated at best estimate of fair value, based on recognised valuation techniques which may take account of recent arm’s length transactions in the investments. FIL Investment Services (UK) Limited is the Company’s Unlisted Investment Manager.
Warrants
A derivative security that gives the Company the right to purchase securities (usually equity) from the issuer at a specific price and within a certain time frame.
30 Fidelity China Special Situations PLC Half-yearly Report 2017
Job No: 31561 Proof Event: 13 Black Line Event: 2 Park Communications Ltd Alpine Way London E6 6LA
Customer: Fidelity Project Title: Fidelity FCSS Half Year Rpt 2016 T: 0207 055 6500 F: 020 7055 6600
Job No: 31561 Proof Event: 13 Black Line Event: 2 Park Communications Ltd Alpine Way London E6 6LA
Customer: Fidelity Project Title: Fidelity FCSS Half Year Rpt 2016 T: 0207 055 6500 F: 020 7055 6600
Directory
Board of Directors
Nicholas Bull FCA (Chairman)David Causer FCA (Chairman of the Audit
Committee)John FordThe Hon. Peter Pleydell-Bouverie DL (Chairman of
the Investment Committee)Elisabeth Scott (Senior Independent Director)Vera Wei
Alternative Investment Fund Manager (AIFM/the Manager)
FIL Investment Services (UK) LimitedOakhill House130 Tonbridge RoadHildenboroughTonbridgeKentTN11 9DZ
Investment Manager
FIL Investment Management (Hong Kong) LimitedLevel 21Two Pacific Place88 QueenswayAdmiraltyHong Kong
Unlisted Investment Manager, Secretary and Registered Office
FIL Investments InternationalBeech GateMillfield LaneLower KingswoodTadworthSurreyKT20 6RPEmail: [email protected]
Banker and Custodian
JPMorgan Chase Bank (London Branch)125 London WallLondonEC2Y 5AJ
Depositary
J.P. Morgan Europe Limited25 Bank StreetLondonE14 5JP
Financial Adviser and Stockbrokers
Cenkos Securities plc6,7,8 Tokenhouse YardLondonEC2R 7AS
Independent Auditor
Ernst & Young LLP25 Churchill PlaceLondonE14 5RB
Lawyer
Charles Russell Speechlys LLP5 Fleet PlaceLondonEC4M 7RD
Registrar
Link Asset ServicesThe Registry34 Beckenham RoadBeckenhamKentBR3 4TU
31 Fidelity China Special Situations PLC Half-yearly Report 2017
Job No: 31561 Proof Event: 13 Black Line Event: 2 Park Communications Ltd Alpine Way London E6 6LA
Customer: Fidelity Project Title: Fidelity FCSS Half Year Rpt 2016 T: 0207 055 6500 F: 020 7055 6600
Job No: 31561 Proof Event: 13 Black Line Event: 2 Park Communications Ltd Alpine Way London E6 6LA
Customer: Fidelity Project Title: Fidelity FCSS Half Year Rpt 2016 T: 0207 055 6500 F: 020 7055 6600
DIR
ECTO
RS’
REP
ORTS
FIN
AN
CIA
L ST
ATE
MEN
TSIN
FORM
ATIO
N F
OR
SHA
REH
OLD
ERS
Shareholder Information
Investing in Fidelity China Special Situations Plc
Fidelity China Special Situations PLC is a company listed on the London Stock Exchange and you can buy its shares through a stockbroker, share shop or bank. Fidelity also offers a range of options, so that you can invest in the way that is best for you. Details of how to invest can be found on Fidelity’s website at www.fidelityinvestmenttrusts.com
Contact information
Shareholders and Fidelity Platform Investors should contact the appropriate administrator using the contact details given below and on page 32. Links to the websites of major platforms can be found online at www.fidelityinvestmenttrusts.com
Shareholders on the main share register
Shareholders should note that Capita Asset Services was acquired by Link Group and the new brand name is Link Asset Services. There is no change in the services offered to shareholders.
Contact Link Asset Services, Registrar to Fidelity China Special Situations PLC, The Registry, 34 Beckenham Road, Beckenham, Kent BR3 4TU. Telephone: 0871 664 0300 (calls cost 12p per minute plus network extras. If you are outside the United Kingdom, call +44 371 664 0300. Calls outside the United Kingdom will be charged at the applicable international rate. Lines are open 9.00 am to 5.30 pm Monday to Friday, excluding public holidays in England and Wales).
Email: [email protected]
Details of individual shareholdings and other information can also be obtained online from the Registrar’s Share Portal at www.signalshares.com. Shareholders are able to manage their shareholding online by registering for the Share Portal, a free and secure online access service. Facilities include:
Account Enquiry – Shareholders can access their personal shareholding, including share transaction history, dividend payment history and obtain an up-to-date shareholding valuation.
Amendment of Standing Data – Shareholders can change their registered postal address and add, change or delete dividend mandate instructions. Shareholders can also download forms such as change of address, stock transfer and dividend mandate forms as well as buy and sell shares in the Company.
Should you have any queries in respect of the Link Share Portal, contact the helpline on 0871 664 0300 (calls cost 12p per minute plus your phone company’s access charge. If you are outside the United Kingdom, please call +44 371 664 0300. Calls outside the United Kingdom will be charged at the applicable international rate. Lines are open 9.00 am to 5.30 pm, Monday to Friday excluding public holidays in England and Wales).
Link share dealing service
Link Asset Services offer a low cost share dealing service to buy or sell shares. Further information is available at www.linksharedeal.com, or by telephoning 0371 664 0445 (calls are charged at the standard geographic rate and will vary by provider. Calls outside the United Kingdom will be charged at the applicable international rate. Lines are open 8.00 am to 4.30 pm, Monday to Friday excluding public holidays in England and Wales). The Link Share Dealing Service allows you to deal in the shares of other companies for which Link Asset Services acts as Registrar, provided you are already a shareholder in the relevant company, and that company offers the Share Deal facility to its shareholders.
32 Fidelity China Special Situations PLC Half-yearly Report 2017
Job No: 31561 Proof Event: 13 Black Line Event: 2 Park Communications Ltd Alpine Way London E6 6LA
Customer: Fidelity Project Title: Fidelity FCSS Half Year Rpt 2016 T: 0207 055 6500 F: 020 7055 6600
Shareholder Information continued
Fidelity Platform Investors
Contact Fidelity, using the freephone numbers given below, or by writing to: UK Customer Service, Fidelity International, Oakhill House, 130 Tonbridge Road, Hildenborough, Tonbridge, Kent TN11 9DZ. Website: www.fidelity.co.uk/its.
Private investors: call free on 0800 41 41 10, 9.00 am to 6.00 pm, Monday to Saturday.
Financial advisers: call free on 0800 41 41 81, 8.00 am to 6.00 pm, Monday to Friday.
General enquiries
General enquiries should be made to the Secretary, at the Company’s registered office: FIL Investments International, Investment Trusts, Beech Gate, Millfield Lane, Lower Kingswood, Tadworth, Surrey KT20 6RP.
Telephone: 01732 361144
Email: [email protected]
Website: www.fidelityinvestmenttrusts.com
Financial Calendar 2017/2018
30 September 2017 Half-Yearly period end
November 2017 Announcement of Half-Yearly results
November 2017 Publication of Half-Yearly Report
31 March 2018 Financial year end
June 2018 Publication of Annual Report
July 2018 Annual General Meeting


Fidelity, Fidelity Internaional, the Fidelity International logo and symbol are trademarks of FIL Limited
Printed on FSC® certified paper.
100% of the inks used are vegetable oil based 95% of press chemicals are recycled for further use and on average 99% of any waste associated with this production will be recycled.
The FSC® logo identifies products which contain wood from well-managed forests certified in accordance with the rules of the Forest Stewardship Council®.
This document is printed on Cocoon Silk; a paper made using 50% recycled fibre from genuine waste paper and 50% virgin fibre.
The unavoidable carbon emissions generated during the manufacture and delivery of this document, have been reduced to net zero through a verified, carbon offsetting project.