Embed Size (px)
Citation preview
Fibre-reinforced Concrete for
Industrial Construction
- a fracture mechanics approach to material testing
and structural analysis
INGEMAR LÖFGREN
Department of Civil and Environmental Engineering
Structural Engineering
CHALMERS UNIVERSITY OF TECHNOLOGY
Göteborg, Sweden, 2005


THESIS FOR THE DEGREE OF DOCTOR OF PHILOSOPHY
Fibre-reinforced Concrete for Industrial Construction
- a fracture mechanics approach to material testing
and structural analysis
INGEMAR LÖFGREN
Department of Civil and Environmental Engineering
Structural Engineering
CHALMERS UNIVERSITY OF TECHNOLOGY
Göteborg, Sweden, 2005

Fibre-reinforced Concrete for Industrial Construction
- a fracture mechanics approach to material testing and structural analysis
INGEMAR LÖFGREN
Göteborg, 2005
ISBN 91-7291-696-6
© INGEMAR LÖFGREN, 2005
Doktorsavhandlingar vid Chalmers tekniska högskola
Ny serie nr. 2378
ISSN 0346-718X
Archive no. 35
Department of Civil and Environmental Engineering
Structural Engineering
Chalmers University of Technology
SE-412 96 Göteborg
Sweden
Telephone: + 46 (0)31-772 1000
Cover:
A schematic picture illustrating the suggested and applied approach for material testing
and structural analysis of FRC.
Printed by Chalmers Reproservice
Göteborg, Sweden, 2005

I
Fibre-reinforced Concrete for Industrial Construction
- a fracture mechanics approach to material testing and structural analysis
INGEMAR LÖFGREN
Department of Civil and Environmental Engineering
Structural Engineering
Chalmers University of Technology
ABSTRACT
More efficient and industrialised construction methods are both necessary for the
competitiveness of in-situ concrete and essential if the construction industry is to move
forward. At present, the expenditure on labour (preparation and dismantling of
formwork, reinforcing, and casting and finishing of concrete) almost equals the cost of
material. Fibre-reinforced concrete (FRC) extends the versatility of concrete as a
construction material, offers a potential to simplify the construction process and, when
combined with self-compacting concrete, signifies an important step towards industrial
construction. However, a barrier to more widespread use of FRC has been the lack of
general design guidelines which take into account the material properties characteristic
of FRC, i.e. the stress-crack opening (-w) relationship.
The presented work has been focused on FRC, showing a strain-softening response, and
the interrelationship between material properties and structural behaviour. This has been
examined by investigating and developing test methods and structural analysis models.
A systematic approach for material testing and structural analysis, based on fracture
mechanics, has been presented which covers: (1) material testing; (2) inverse analysis;
(3) adjustment of the -w relationship for fibre efficiency; and (4) cross-sectional and
structural analysis. Furthermore, recommendations for using the wedge-splitting test
(WST) method for FRC have been provided. The relative small scale of the WST
specimens makes it ideal for use in laboratory studies, e.g. for development and
optimisation of new mixes.
By conducting experiments, the approach was demonstrated and it was shown that it is
possible to adjust the -w relationship for any difference in fibre efficiency between the
material test specimen and the structural application considered. Full-scale experiments
were conducted on beams, made of self-compacting fibre-reinforced concrete, with a
small amount of conventional reinforcement. The results indicate that FRC can be used
in combination with low reinforcement ratios; the amount of conventional
reinforcement could be reduced to half that of conventional reinforced concrete (for the
same load-carrying resistance) but still lead to improved structural performance
(reduced crack width and increased flexural stiffness). The results also suggest that the
approach used for the material testing provides the necessary properties to perform
analyses based on non-linear fracture mechanics. Finally, when comparing the peak
loads obtained in the experiments with the results from the analyses, the agreement was
good, with a high correlation (>0.9). Hence, this demonstrates the strength of the
fracture-mechanical approach for material testing and structural analysis.
Key words: concrete, in-situ cast, fibre-reinforced, self-compacting, non-linear fracture
mechanics, stress-crack opening relationship, inverse analysis.

II
Fiberarmerad betong för ett industriellt platsgjutet byggande
- materialprovning och strukturanalys baserad på brottmekanik
INGEMAR LÖFGREN
Institutionen för bygg- och miljöteknik
Konstruktionsteknik
Chalmers tekniska högskola
SAMMANFATTNING
Ökade krav på produktivitet och kvalitet i byggbranschen har aktualiserat behovet av att
utveckla ett resurssnålt byggande. Fiberarmerad betong i kombination med
självkompakterande betong innebär en möjlighet att förenkla byggandet och är ett stort
steg mot ett industriellt platsgjutet byggande. Ett hinder för denna utveckling är
avsaknaden av generella dimensioneringsregler som beaktar de materialegenskaper som
är karakteristiska för fiberarmerad betong, det vill säga sambandet mellan spänning-
spricköppning (-w).
Arbetet i avhandling har fokuserats på fiberarmerad betong och sambandet mellan
materialegenskaper och strukturrespons vilket har analyserats genom att undersöka och
utveckla metoder för materialprovning och modeller för strukturanalys, båda baserade
på brottmekanik. I avhandlingen presenteras en metodik som omfattar: (1)
materialprovning; (2) parameteridentifikation (för att bestämma -w sambandet); (3)
korrigering av -w sambandet avseende skillnad i fibereffektivitetsfaktor; samt (4)
tvärsnitts- och strukturanalys. Genomförda experiment har påvisat att det är möjligt att
ta hänsyn till skillnader i fibereffektivitetsfaktor och att det därför går att korrigera -w
sambandet, vilket även behövs om strukturresponsen skall beskrivas realistiskt. I
avhandlingen presenteras även förslag på hur ”kil-spräck” metoden (wedge-splitting test
method) kan använda för fiberbetong. Kil-spräck metoden är väl lämpad för
laboratoriestudier, t ex vid utveckling och optimering av nya fiberbetonger, tack vare att
relativt små provkroppar används.
En slutsats av arbetet är att fiberarmerad betong i kombination med konventionell
armering medför att denna kan halveras (för samma bärförmåga), men trots detta erhålls
en bättre prestanda (mindre sprickvidd och ökad böjstyvhet). Detta påvisades i utförda
fullskaleförsök som genomfördes på balkar, gjutna med självkompakterande
fiberarmerad betong, med en liten mängd konventionell armering.
Slutligen, genom de försök som har utförts (både materialprovning och fullskaleförsök)
har den föreslagna metodiken demonstrerats och när resultaten från fullskaleförsöken
jämfördes med beräknade var överensstämmelsen god, med en hög korrelation (>0.9).
Detta belyser således styrkan i en brottmekanisk approach för materialprovning och
strukturanalys.
Nyckelord: betong, platsgjuten, fiberarmerad, självkompakterande, ickelinjär
brottmekanik, samband spänning-spricköppning, parameter-
identifikation.

III
LIST OF PUBLICATIONS
This thesis is based on the work contained in the following papers, referred to by
Roman numerals in the text.
I. Löfgren, I. and Gylltoft, K.: In-situ cast concrete building: Important aspects of
industrialised construction, Nordic Concrete Research, 1/2001, pp. 61-80.
II. Löfgren, I.: Lattice-girder elements – Investigation of structural behaviour and
performance enhancements, Nordic Concrete Research, 1/2003, pp. 85-104.
III. Löfgren, I., Stang, H., and Olesen, J.F.: The WST method, a fracture mechanics
test method for FRC. Paper submitted for publication in Materials and Structures
(2005-04-03), 11 pp.
IV. Löfgren, I., Olesen, J.F., and Flansbjer, M.: The WST method for fracture testing
of fibre-reinforced concrete. Paper accepted for publication in Nordic Concrete
Research, 2/2005, 19 pp.
V. Löfgren, I., Stang, H., and Olesen, J.F.: Fracture properties of FRC determined
through inverse analysis of wedge splitting and three-point bending tests, Journal
of Advanced Concrete Technology, Vol. 3, No. 3, pp. 425-436, October 2005,
Japan Concrete Institute.
VI. Löfgren, I.: Fracture behaviour of reinforced FRC beams. Paper submitted for
publication in Structural Concrete, Journal of the fib, October 2005.

IV
OTHER PUBLICATIONS BY THE AUTHOR
During the course of this work, subsequent results and supplementary work have been
presented on several occasions. Moreover, some of the work has been presented in
national engineering magazines for a wider audience. This work has been presented in
the following publications:
LICENTIATE THESIS
Löfgren, I.: In-situ concrete building systems – Developments for industrial
construction. Licentiate Thesis. Publication 02:2, Department of Structural
Engineering, Chalmers University of Technology, Feb. 2002, 138 pp.
CONFERENCE PAPERS
Esping, O. and Löfgren, I.: Investigation of early age deformation in self-compacting
concrete. Presented at the Knud Højgaard conference on Advanced Cement-Based
Materials - Research and Teaching, at Technical University of Denmark, Lyngby, 12-
15 June 2005.
Löfgren, I., Stang, H., and Olesen, J.F.: Wedge splitting test – a test to determine
fracture properties of FRC. In Fibre-Reinforced Concretes - BEFIB 2004 –
Proceedings of the Sixth RILEM symposium. Eds. M.di Prisco, R. Felicetti, and G.A.
Plizzari, pp. 379-388, Varenna, Italy, 20-22 September 2004. PRO 39, RILEM
Publications S.A.R.L, Bagneaux.
Löfgren, I.: The wedge splitting test – a test method for assessment of fracture
parameters of FRC? In Fracture Mechanics of Concrete Structures, Vol. 2, eds. Li et
al., pp. 1155-1162. Ia-FraMCos, 2004. Proceedings of the fifth international
conference on fracture mechanics of concrete and concrete structures. In Vail,
Colorado/USA, 12-16 April 2004.
Löfgren, I.: Analysis of Flexural Behaviour and Crack Propagation of Reinforced FRC
Members. In Proceedings of the Workshop Design Rules for Steel Fibre Reinforced
Concrete Structures, Nordic Miniseminar: Design Rules for Steel Fibre Reinforced
Concrete Structures, Oslo, Norway, October 6, 2003, pp. 25-34.
Löfgren, I. and Gylltoft, K.: Lattice Girder Elements – Structural Behaviour and
Performance Enhancements. In Proceedings XVIII Nordic Concrete Research
Symposium, Helsingör, Denmark, 2002.
Löfgren, I., Gylltoft, K. and Kutti, T.: In-situ concrete building – Innovations in
Formwork. Accepted contribution to the 1st International Conference on Innovation in
Architecture, Engineering and Construction (AEC) in Loughborough, 2001, 10 pp.
Löfgren, I.: Nya Stomsystem för platsgjutet byggande. Presented at: Workshop om nya
idéer för framtidens byggande av bärande konstruktioner, Göteborg 2001.

V
REPORTS
Esping, O. and Löfgren, I.: Cracking due to plastic and autogenous shrinkage –
Investigation of early age deformation of self-compacting concrete – Experimental
study. Publication 05:11, Department of Civil and Environmental Engineering,
Chalmers University of Technology, 95 pp.
Löfgren, I., Olesen, J.F., and Flansbjer, M.: Application of WST-method for fracture
testing of fibre-reinforced concrete. Report 04-13, Department of Structural
Engineering and Mechanics, Chalmers University of Technology, Göteborg 2004.
Löfgren, I.: Wedge splitting test method. Pilot Experiments. Report 03:1, Department of
Structural Engineering and Mechanics, Chalmers University of Technology, Göteborg
2003.
Löfgren, I.: Provning av spännarmerade plattbärlag – Provningsuppdrag för AB
Färdig Betong. Rapport Nr.02:16, Institutionen för Konstruktionsteknik –
Betongbyggnad, Chalmers Tekniska Högskola, Göteborg 2002.
Löfgren, I.: Deformationsmätning vid pågjutning av plattbärlag – Provningsuppdrag
för AB Färdig Betong. Rapport Nr. 02:9, Institutionen för Konstruktionsteknik –
Betongbyggnad, Chalmers Tekniska Högskola, Göteborg 2002.
Löfgren, I.: Lattice Girder Elements in Bending: Pilot Experiment. Chalmers University
of Technology, Department of Structural Engineering – Concrete Structures, Report
No. 01:7, Göteborg 2001.
OTHER PUBLICATIONS
Löfgren, I.: Fiberbetong – beräkningsmetod för bärande konstruktioner. Bygg & Teknik
7/2004, pp. 32.
Löfgren, I. och Johansson, M.: Forskning och utveckling för framtida stombyggnads-
teknik. Bygg & Teknik 2/2003, pp. 12.
Löfgren, I.: Industriellt platsgjutet byggande: Principer och metoder för
industrialisering. Bygg & Teknik, 2/2001, pp. 60-64.

Contents
ABSTRACT I
SAMMANFATTNING II
LIST OF PUBLICATIONS III
OTHER PUBLICATIONS BY THE AUTHOR IV
CONTENTS VI
PREFACE IX
NOTATIONS X
1 INTRODUCTION 1
1.1 Background 1
1.2 Aims, scope and limitations 3
1.3 Outline of the thesis 3
1.4 Original features 4
2 IN-SITU CAST CONCRETE CONSTRUCTION 5
2.1 Introductory remark 5
2.2 Concrete as a construction material 5
2.3 Industrial in-situ cast concrete construction 7
2.4 Cost of in-situ concrete construction 9
2.5 Developments of in-situ concrete construction 11
2.5.1 Formwork systems 13
2.5.2 Reinforcement technology 15
2.5.3 Concrete technology 16
2.6 Concluding remarks 18
3 FIBRE-REINFORCED CONCRETE 19
3.1 General 19
3.2 Fibre technology 19
3.2.1 Fibre geometries 21
3.2.2 Fibre materials and physical properties 22
3.3 Orientation and distribution of fibres 24
3.4 Mechanics of crack formation and propagation 28
3.4.1 Microstructure and microstructural development 29
3.4.2 Pre-cracking mechanisms (Stress transfer) 33
3.4.3 Post-cracking mechanisms (crack bridging) 37
3.5 Mechanical properties 48
3.5.1 Compressive properties 48

VII
3.5.2 Tensile properties 50
3.5.3 Shear properties 52
3.6 Concluding remarks 52
4 FRACTURE-MECHANICS-BASED MATERIAL TESTING OF FRC 53
4.1 Introduction 53
4.2 Approach for determining the -w relationship 54
4.2.1 Material testing 55
4.2.2 Inverse analysis 56
4.2.3 Adjustment of -w relationship for fibre efficiency 59
4.3 Investigation of fracture test methods 63
4.3.1 Uni-axial tension test 64
4.3.2 Three-point bending test on notched beams 67
4.3.3 Wedge-splitting test method 68
4.3.4 Comparison and evaluation of methods 75
4.4 Concluding remarks 79
5 FRACTURE-MECHANICS-BASED STRUCTURAL ANALYSIS 81
5.1 Introductory remarks 81
5.2 Design and analysis approaches 81
5.2.1 Finite element method 81
5.2.2 Analytical approaches 83
5.3 Non-linear hinge model 84
5.3.1 Members without conventional reinforcement 87
5.3.2 Members with conventional reinforcement 88
5.3.3 Influence of the -w relationship 91
5.3.4 Effect of normal force 95
5.3.5 Comparison of conventional RC- and FRC-members 96
5.4 Concluding remarks 98
6 STRUCTURAL APPLICATIONS 99
6.1 Fracture behaviour of reinforced FRC beams 99
6.1.1 Full-sale experiments 100
6.1.2 Fibre quantity and distribution in specimens 103
6.1.3 Materials testing 104
6.1.4 Inverse analysis 106
6.1.5 Adjustment of the -w relationship for fibre efficiency 110
6.1.6 Analysis of experiments 111
6.1.7 Concluding discussion 117
6.2 The lattice girder system - an application study 118
6.2.1 Difficulties in design and analysis 119
6.2.2 Laboratory tests 120
6.2.3 Numerical analysis 121
6.2.4 Structural behaviour 121

6.2.5 Improved performance 124
6.2.6 Concluding discussion 125
7 CONCLUSIONS 127
7.1 General conclusions 127
7.2 Suggestions for future research 129
8 REFERENCES 131
PAPER I - PAPER VI
I. Löfgren, I. and Gylltoft, K.: In-situ cast concrete building: Important aspects of
industrialised construction, Nordic Concrete Research, 1/2001, pp. 61-80.
II. Löfgren, I.: Lattice-girder elements – Investigation of structural behaviour and
performance enhancements, Nordic Concrete Research, 1/2003, pp. 85-104.
III. Löfgren, I., Stang, H., and Olesen, J.F.: The WST method, a fracture mechanics
test method for FRC. Paper submitted for publication in Materials and Structures
(2005-04-03), 11 pp.
IV. Löfgren, I., Olesen, J.F., and Flansbjer, M.: The WST method for fracture testing
of fibre-reinforced concrete. Paper accepted for publication in Nordic Concrete
Research, 2/2005, 19 pp.
V. Löfgren, I., Stang, H., and Olesen, J.F.: Fracture properties of FRC determined
through inverse analysis of wedge splitting and three-point bending tests, Journal
of Advanced Concrete Technology, Vol. 3, No. 3, pp. 425-436, October 2005,
Japan Concrete Institute.
VI. Löfgren, I.: Fracture behaviour of reinforced FRC beams. Paper submitted for
publication in Structural Concrete, Journal of the fib, October 2005.
IX
Preface
The work presented in this thesis was initiated by AB Färdig Betong / Thomas Concrete
Group together with Chalmers University of Technology as a response to the increased
demand for improved construction methods for in-situ cast concrete structures. The
work was carried out from November 1999 until December 2005 at Chalmers
University of Technology, at the Department of Civil and Environmental Engineering,
Division of Structural Engineering, Concrete Structures. Part of the work has been done
in collaboration with the Technical University of Denmark, and a part has been
conducted as a NORDTEST project (No. 04032 1672-04, Part I).
First of all, I would like to thank my supervisor and examiner, Prof. Kent Gylltoft, for
having given me the opportunity to work on this research project, for allowing and
encouraging me to pursue my ideas, and for the valuable discussions we have had
throughout the work. I would also like to extend my appreciation to Prof. Björn
Engström who has enthusiastically shared his broad and deep knowledge.
Penultimate, but not last, are thanks to all of my colleagues – present and former – at the
Department who have all, in one way or another, assisted with the many theoretical and
practical problems encountered, as well as for their good humour making the work more
enjoyable. The staff in the laboratory is remembered with appreciation for its helpful
and technical assistance in the experiments. Moreover, I would like to extend my
sincere gratitude to Prof. Henrik Stang and Prof. John Forbes Olesen at the Technical
University of Denmark (DTU) for a valuable and rewarding collaboration. The
laboratory staff and the Ph.D. students at DTU are also appreciated for their hospitality
and for introducing me to the laboratory facilities and the testing machines.
Finally, but not least, I would like to express my sincere gratitude to the companies that
made this project possible through a donation to Chalmers: Thomas Concrete Group and
AB Färdig Betong. Special appreciation is due to Oskar Esping, my fellow Ph.D.
student at Färdig Betong and Chalmers, for providing indispensable help regarding the
design of self-compacting concrete, and who assisted in developing the self-compacting
fibre-reinforced concrete used in the full-scale experiments. For their involvement in the
project, I would also like to thank Tomas Kutti, his colleagues at Färdig Betong –
particularly the ever so enthusiastic production staff at the Ringö plant – and the staff at
the Central Laboratory of Thomas Concrete Group. Furthermore, Bekaert Sweden is
appreciated for having supplied fibres to the experiments.
It is my hope that this thesis will be read and reviewed critically, and that any
viewpoints, comments and suggestions regarding its content will be directed to me.
Göteborg, November 2005
Ingemar Löfgren

Notations
Upper case letters
A Cross-sectional area
Af Cross-sectional area of fibre
E Modulus of elasticity
Ec Modulus of elasticity of concrete
Ef Modulus of elasticity of fibre
Em Modulus of elasticity of matrix
Fsp Splitting load in the wedge-splitting test
Fv Vertical load in the wedge-splitting test
GF Specific fracture energy
Gf Specific energy dissipated during fracture
I Second moment of inertia
Le Embedment length
Lf Fibre length
M Bending moment
Mcr Cracking moment
N Normal force
Nb Number of bridging fibres
Nf.exp Number of fibres per unit area in a fractured specimen
Vf Volume fraction of fibres
Vm Volume fraction of matrix
Rm Average centre-to centre inter-fibre distance
Q Point load
Lower case letters
a Length of crack
a1 Initial slope of the bi-linear -w relationship
a2 Second slope of the bi-linear -w relationship
b2 Intersection of the bi-linear -w relationship with the y-axis
b Width of beam section
df Diameter of fibre
d1 Distance from compressive edge to reinforcement
fc Compressive strength
ft Tensile strength
fct Tensile strength of concrete
fy Yield strength of reinforcement

XI
fu Tensile strength of reinforcement
h Height of beam section
lch Characteristic length
s Crack spacing or length of non-linear hinge region
rf Fibre radius
w Crack opening
wc Critical crack opening for which (w) = 0
w/c water cement ratio
w/b water binder ratio
(w/b)eff effective water binder ratio (calculated using k-factor acc. to EN 206-1)
w/f water filler ratio (volume-based)
y0 Depth of compressive zone
z Centroidal distance
Greek letters
Wedge angle in the wedge-splitting test
δ Deflection
ε Strain
εc Concrete strain
εu Failure strain of reinforcement
ν Poisson’s ratio
Reinforcement ratio
Coefficient of friction
Curvature
m Average curvature of non-linear hinge element
Crack opening angle
b Fibre efficiency factor
f Aspect ratio of fibre (length / diameter)
σ Stress
σ(w) Stress as a function of crack opening
σw Stress as a function of crack opening
σb Bridging stress
σab Aggregate bridging stress
σfb Fibre bridging stress
av Average bond strength
i Interfacial shear stress
Fibre orientation angle

Abbreviations
ACI American Concrete Institute
CMOD Crack Mouth Opening Displacement
CoV Coefficient of Variance
CTOD Crack Tip Opening Displacement
C-S-H Calcium Silicate Hydrate
C3S Tri-calcium Silicate
DTU Technical University of Denmark
EC 2 Eurocode 2
FEA Finite Element Analysis
FEM Finite Element Method
FRC Fibre-Reinforced Concrete
FRP Fibre-Reinforced Polymers
HSC High-Strength Concrete
HPFRCC High-Performance Fibre-Reinforced Cementitious Composite
LWAC LightWeight Aggregate Concrete
NSC Normal-Strength Concrete
PVA Polyvinyl acetate
PP Polypropylene
RC-65/60 Specification of Dramix fibre (65/60 = aspect ratio / length)
RILEM International Union of Laboratories and Experts in Construction
Materials
SFRC Steel Fibre-Reinforced Concrete
SCC Self-Compacting Concrete
UTT Uni-axial Tension Test
WST Wedge-Splitting Test
ITZ Interfacial Transition Zone
3PBT Three-Point Bending Test
e.g. For example (Latin empli gratia)
i.e. That is (Latin id est)
vs. Versus
-w Stress-crack opening

CHALMERS, Civil and Environmental Engineering 1
1 INTRODUCTION
1.1 Background
In the course of the 20th century, reinforced concrete has established itself as one of the
major building materials, and today concrete structures, including buildings, bridges,
power plants, dams, etc., constitute a large part of the modern civil infrastructure.
Nonetheless, more efficient and industrial construction of concrete structures with
improved performance can be viewed as a necessity for the future competitiveness of
concrete, and is essential if the concrete construction industry is to move forward. A
motive for the need of such development can be found when analysing construction
costs, which indicates that presently the expenditure on labour (e.g. preparation and
dismantling of formwork, reinforcing, and casting and finishing of concrete) almost
equals the cost of material. For a concrete building, roughly 40 percent of the total cost
of the superstructure can be referred to labour costs. On the other hand, there are
material technologies available which have the potential to significantly reduce some of
the more labour-intensive construction activities. Examples of such materials are self-
compacting (SCC) and fibre-reinforced concrete (FRC). For instance, SCC is well
suited for a mechanised and automated manufacturing process, and was initially
developed in Japan as a response to the lack of construction workers and a need to
improve quality. Moreover, FRC has for a long time been perceived as a material with
potential and a material which extends the versatility of concrete as a construction
material, by providing an effective method of overcoming its intrinsic brittleness, and
by presenting an opportunity to reduce one of the more labour-intensive activities
necessary for concrete construction. For example, Krenchel (1974) pointed out early
that “If, as in the case of the fibre-reinforced mortar, it one day proves possible to
achieve an apparent elongation at rupture for ordinary concrete that is ten or more
times the value normally achieved, it will be found that, for example, many of the
structures for which pre-stressed concrete is now used can be produced more simply
and economically in ordinary, reinforced concrete with a certain percentage of fibres
added as secondary reinforcement for crack distribution. Moreover, the risks of
corrosion of the principal reinforcement will be so reduced that it should be possible to
use considerably less concrete cover than is normal to-day. Particularly in the case of
reinforced concrete water tanks, sea-bed structures and similar, this should be of great
economic importance.”
In some types of structures, such as slabs on grade, foundations, and walls, fibres can
replace ordinary reinforcement completely. In other structures, such as beams and
suspended slabs, fibres can be used in combination with ordinary or pre-stressed
reinforcement. In both cases the potential benefits are due to economic factors as well as
to rationalisation and improvement of the working environment at the construction site.
From a structural viewpoint, on the other hand, the main reason for incorporating fibres
is to improve the fracture characteristics and structural behaviour through the fibres’
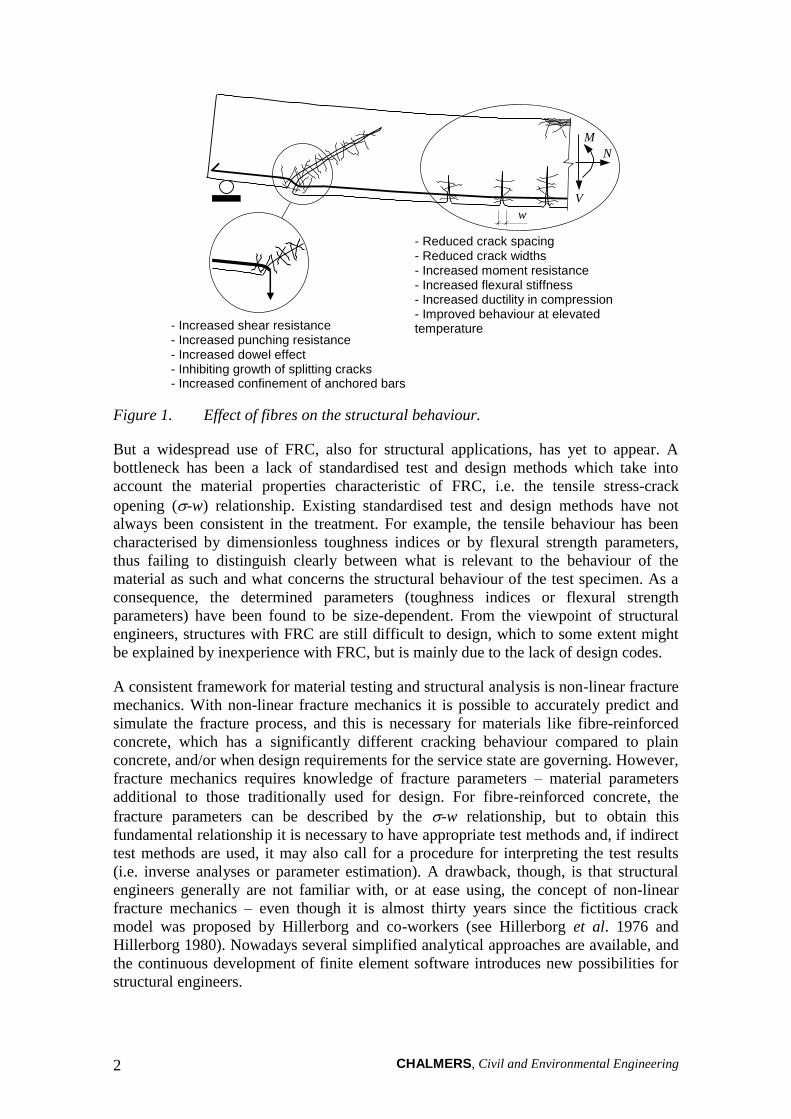
ability to bridge cracks; see Figure 1. This mechanism influences both the serviceability
and ultimate limit states. The effects on the service load behaviour are controlled crack
propagation, which primarily reduces the crack spacing and crack width, and increased
flexural stiffness. The effect on the behaviour in the ultimate limit state is increased load
resistance and, for shear and punching failures, fibres also improve the ductility.
CHALMERS, Civil and Environmental Engineering 2
w
- Increased shear resistance - Increased punching resistance - Increased dowel effect - Inhibiting growth of splitting cracks - Increased confinement of anchored bars
- Reduced crack spacing - Reduced crack widths - Increased moment resistance - Increased flexural stiffness - Increased ductility in compression - Improved behaviour at elevated temperature
N
M
V
Figure 1. Effect of fibres on the structural behaviour.
But a widespread use of FRC, also for structural applications, has yet to appear. A
bottleneck has been a lack of standardised test and design methods which take into
account the material properties characteristic of FRC, i.e. the tensile stress-crack
opening (-w) relationship. Existing standardised test and design methods have not
always been consistent in the treatment. For example, the tensile behaviour has been
characterised by dimensionless toughness indices or by flexural strength parameters,
thus failing to distinguish clearly between what is relevant to the behaviour of the
material as such and what concerns the structural behaviour of the test specimen. As a
consequence, the determined parameters (toughness indices or flexural strength
parameters) have been found to be size-dependent. From the viewpoint of structural
engineers, structures with FRC are still difficult to design, which to some extent might
be explained by inexperience with FRC, but is mainly due to the lack of design codes.
A consistent framework for material testing and structural analysis is non-linear fracture
mechanics. With non-linear fracture mechanics it is possible to accurately predict and
simulate the fracture process, and this is necessary for materials like fibre-reinforced
concrete, which has a significantly different cracking behaviour compared to plain
concrete, and/or when design requirements for the service state are governing. However,
fracture mechanics requires knowledge of fracture parameters – material parameters
additional to those traditionally used for design. For fibre-reinforced concrete, the
fracture parameters can be described by the -w relationship, but to obtain this
fundamental relationship it is necessary to have appropriate test methods and, if indirect
test methods are used, it may also call for a procedure for interpreting the test results
(i.e. inverse analyses or parameter estimation). A drawback, though, is that structural
engineers generally are not familiar with, or at ease using, the concept of non-linear
fracture mechanics – even though it is almost thirty years since the fictitious crack
model was proposed by Hillerborg and co-workers (see Hillerborg et al. 1976 and
Hillerborg 1980). Nowadays several simplified analytical approaches are available, and
the continuous development of finite element software introduces new possibilities for
structural engineers.
CHALMERS, Civil and Environmental Engineering 3
When examining some of the current research literature, it appears that FRC is gaining
further acceptance as a construction material, as a number of countries and
organisations are developing new and improved design guidelines; see e.g. RILEM TC
162-TDF, Kanstad (2003), Ahmad et al. (2004). The number of practical applications is
also growing, and some examples of noteworthy structural applications are tunnel
linings (see e.g. Nanakorn and Horii 1996, and Kooiman 2003) and suspended flat slabs
without any conventional reinforcement (see e.g. Gossla and Pepin 2004). A summary
of different applications is provided by Li (2002). In addition, recently a number of
dissertations on the subject of FRC have been published; see e.g. Aarre (1992), Glavind
(1992), Pedersen (1996), Li (1998), Dubey (1999), Groth (2000), Kooiman (2000),
Barragán (2003), Dupont (2003), Pfyl (2003), Rosenbuch (2003), Ay (2004),
Grünenwald (2004). Also a number of workshops and conferences have also been held;
see e.g. Banthis and Mindess (1995), Banthia et al. (1998), Rossi and Chanvillard
(2000), Silfwerbrand (2001), Kanstad (2003), di Prisco et al. (2004b&c), and Ahmad et
al. (2004).
1.2 Aims, scope and limitations
The principal aim of this research project has been to improve the current knowledge of
the mechanical and structural behaviour of fibre-reinforced concrete. One more specific
aim has been to investigate and develop a consistent methodology for structural analysis
of fibre-reinforced concrete, which includes material testing and inverse analysis. A
long-term aim of the project is also that it may advance the use of fibre-reinforced
concrete and thus lead to more efficient and industrial construction of in-situ cast
concrete.
Regarding its scope, the work has briefly considered the construction process as a
whole, but the main focus has been on the interrelationship between materials, their
properties and how these may be determined, and the structural behaviour/performance.
The work has been limited to investigating steel-fibre reinforced concrete, which
exhibits a tensile softening behaviour, and the applications investigated have had a
focus on commercial and residential construction. Furthermore, the loading conditions
investigated have been limited to bending in combination with normal force, and only
the short-term response has been investigated (i.e. no creep and shrinkage).
The recipients of this work have been envisaged as structural engineers, material
suppliers and materials testing institutes, as well as standardisation organisations and
code officials.
1.3 Outline of the thesis
This thesis consists of six papers and an introductory part. The introductory part gives a
more comprehensive background to the subjects treated in the papers.
In Chapter 2 and Paper I, findings from a preparatory study are presented; this is related
to construction aspects of in-situ cast concrete and industrial construction. Additional
CHALMERS, Civil and Environmental Engineering 4
information is also provided on in-situ construction methods, the cost of construction,
etc. and examples of recent developments.
Chapter 3 provides background information on the mechanics of fibre-reinforced
concrete, and the mechanisms of crack formation and propagation are reviewed.
Examples of different types of fibres are given, and the orientation and distribution of
fibres are discussed.
In Chapter 4 and Papers III to V, different test methods are presented and the results
when using them are compared. An approach for determining the stress-crack opening
relationship is presented, which consists of three steps: (1) material testing; (2) inverse
analysis; and (3) adjustment of the stress-crack opening relationship for fibre efficiency.
Chapter 5 deals with design and analysis methods for flexural members based on
fracture mechanics. A comparison is made between an analytical approach (based on
the non-linear hinge concept) and finite element analyses based on non-linear fracture
mechanics. Finally, examples using the approaches are presented and the flexural
behaviour and crack propagation in FRC members (with and without conventional
reinforcement) are analysed and discussed, as well as compared with conventional
reinforced concrete members.
In Chapter 6 and Papers II and VI, two structural applications are investigated, using
both experiments and analyses. In addition, the suggested approach is used and its
applicability demonstrated.
The major conclusions are presented in Chapter 7 together with suggestions for future
research.
1.4 Original features
The work presented in this thesis is primarily a study of the mechanical behaviour of
fibre-reinforced concrete. It has been shown that by combining both experiments and
non-linear fracture mechanics, a powerful combination is obtained in gaining better
understanding of the mechanical behaviour. Throughout the work, inverse analyses have
systematically been used to determine the tensile fracture properties which have been
used in analyses to investigate the structural behaviour and predict the response.
Recommendations have been provided for: using the wedge-splitting test (WST) as a
fracture test method for fibre-reinforced concrete, and for performing inverse analyses.
An approach has been suggested by which it is possible to consider and adjust for any
differences in fibre efficiency (i.e. number of fibres) between a material test specimen
and ideal conditions (e.g. random 3-D orientation) or a structural element. In addition,
the author has further developed a previously proposed analytical approach (based on
the non-linear hinge concept) for analysis of flexural members and this has been
compared with detailed analyses, using the finite element method and non-linear
fracture mechanics, as well as full-scale experiments.

CHALMERS, Civil and Environmental Engineering 5
2 In-situ cast concrete construction
2.1 Introductory remark
Several studies of the construction industry have pointed out shortcomings that urgently
need attention. Recent studies in the USA and UK suggest that up to 30 percent of
construction is rework, labour is used at only 40 to 60 percent of potential efficiency,
accidents can account for 3-6 percent of total project costs, and at least 10 percent of
materials are wasted; see Table 1. In numerous studies from different countries, the cost
of poor quality, as measured on site, has turned out to be 10 to 20 percent of total
project cost (Cnudde 1991). Furthermore, the increase of efficiency in the construction
industry lags behind other manufacturing industries. Between 1965 and 1996 the
increase of productivity in Sweden was only 2.6 percent per year in the construction
industry, compared to 3.9 percent per year for other industries (see SOU 2000:44).
Table 1. Compilation of data on construction waste, from Koskela (1992).
Waste Cost Country
Quality cost (non-conformance) 12% of total project costs USA
External quality cost (during facility use) 4% of total project costs Sweden
Lack of constructability/buildability 6-10% of total project costs USA
Poor material management 10-12% of labour costs USA
Excess consumption of materials on site 10% on average Sweden
Working time used for non-value-adding activities on site roughly 2/3 of total time USA
Lack of safety 6% of total project costs USA
2.2 Concrete as a construction material
In the course of the 20th century, reinforced concrete has established itself as one of the
major building materials and today concrete structures, including buildings, bridges,
power plants, dams, etc., constitute a large part of the modern civil infrastructure. The
yearly annual consumption of cement was estimated in 2000 to be 1.66 billion tons
(CEMBUREAU 2000); this corresponds to 7 billion m3 concrete or roughly 1 m3 per
person and year.
Concrete, as a material, belongs to a large group of brittle matrix materials, which also
include ceramics. In ENV 206-1 (3.1.1) concrete is defined as material formed by
mixing cement, coarse and fine aggregate, and water, and produced by the hardening of
the cement paste (cement and water); besides these basic components, it may also
contain admixtures and/or additions. The resulting composite material is strong in
compression but relatively weak in tension, and therefore steel reinforcement is often
incorporated to carry the tensile stresses. The mechanical properties of the hardened
concrete and the rheological properties of the fresh concrete are relatively easy to vary
within certain limits. The density produced with regular aggregates is around
2400 kg/m3; the compressive strength, which can be achieved without any special
considerations, ranges from 20 up to 100 MPa, and the modulus of elasticity typically
ranges from 25 to 45 GPa. Furthermore, using lightweight aggregates, with a density

CHALMERS, Civil and Environmental Engineering 6
below 1500 kg/m3 it is possible to produce concrete with densities below 2000 kg/m3
having compressive strength up to 65 MPa and a modulus of elasticity of 25 GPa (see
fib Bulletin 8 2000). In national and international standards, concretes generally are
classified according to their compressive strength. However, a distinction is often made
between different types of concrete depending on the composition, state of hardening or
special properties, of a concrete in particular (see Hilsdorf 1995) and this can be:
according to its density: light-weight, normal-weight, and heavy-weight;
according to its state of hardening: fresh, young, and hardened concrete;
according to the consistence of fresh concrete: earth moist, no-slump, plastic,
self-compacting concrete, etc.;
according to its properties or areas of application: high-strength, frost-resistant,
resistant against chemical attack, abrasion-resistant, architectural, mass
concrete, etc.;
according to the location of its production: site-mixed, ready-mixed, precast
concrete, etc.;
according to its structure: normal, aerated, air-entrained, etc.;
according to the type of reinforcement: plain, reinforced, prestressed, fibre-
reinforced, etc.; and
according to the method of placement, transportation, and compaction:
pumpable, shotcrete, prepact, roller compacted, etc.
As a construction material, concrete has advantages and disadvantages; some of these
are listed in Table 2. The advantages of concrete are what make this material so
ubiquitous, for example: the cost of concrete is relatively low (cost per unit volume);
concrete is moisture-resilient and can be made water-impermeable; concrete is non-
combustible and can resist high temperatures; concrete is, due to its high density, sound-
absorbing and capable of thermal storage; concrete structures can also be made durable,
although this requires experienced designers, work executed with good quality, and a
proper mix design. The disadvantages, on the other hand, are responsible for problems
in infrastructure deterioration, service load failures by excessive cracking and
deflections. Concrete is an intrinsically brittle material with low ductility and, what is
more, high-strength concrete is even more brittle. The tensile strain capacity is low, and
the tensile strength is only about 5% to 10% of its compressive strength. For most
practical purposes in design, the tensile strength is ignored and reinforcement is added
to overcome the poor tensile behaviour. Concrete is not volume-stable over time; it
shrinks, swells, and, when subjected to an external action, creeps. Concrete has a low
strength-to-density ratio. Concrete requires a formwork to support it until it has
hardened. Concrete, when newly cast, may be sensitive to early age drying and plastic
shrinkage cracks may form; see Esping and Löfgren (2005). Desiccation of moisture
requires time, which sometimes may be important for the speed of construction.
CHALMERS, Civil and Environmental Engineering 7
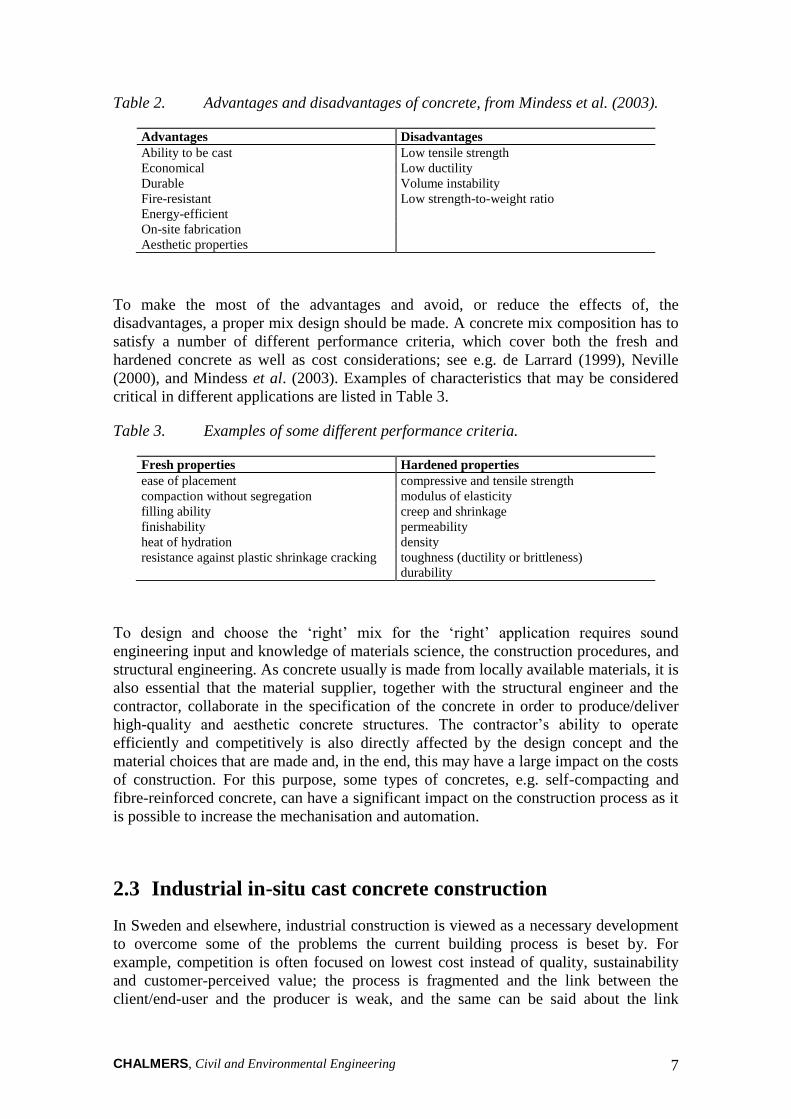
Table 2. Advantages and disadvantages of concrete, from Mindess et al. (2003).
Advantages Disadvantages
Ability to be cast Low tensile strength
Economical Low ductility
Durable Volume instability
Fire-resistant Low strength-to-weight ratio
Energy-efficient
On-site fabrication
Aesthetic properties
To make the most of the advantages and avoid, or reduce the effects of, the
disadvantages, a proper mix design should be made. A concrete mix composition has to
satisfy a number of different performance criteria, which cover both the fresh and
hardened concrete as well as cost considerations; see e.g. de Larrard (1999), Neville
(2000), and Mindess et al. (2003). Examples of characteristics that may be considered
critical in different applications are listed in Table 3.
Table 3. Examples of some different performance criteria.
Fresh properties Hardened properties
ease of placement compressive and tensile strength
compaction without segregation modulus of elasticity
filling ability creep and shrinkage
finishability permeability
heat of hydration density
resistance against plastic shrinkage cracking toughness (ductility or brittleness)
durability
To design and choose the ‘right’ mix for the ‘right’ application requires sound
engineering input and knowledge of materials science, the construction procedures, and
structural engineering. As concrete usually is made from locally available materials, it is
also essential that the material supplier, together with the structural engineer and the
contractor, collaborate in the specification of the concrete in order to produce/deliver
high-quality and aesthetic concrete structures. The contractor’s ability to operate
efficiently and competitively is also directly affected by the design concept and the
material choices that are made and, in the end, this may have a large impact on the costs
of construction. For this purpose, some types of concretes, e.g. self-compacting and
fibre-reinforced concrete, can have a significant impact on the construction process as it
is possible to increase the mechanisation and automation.
2.3 Industrial in-situ cast concrete construction
In Sweden and elsewhere, industrial construction is viewed as a necessary development
to overcome some of the problems the current building process is beset by. For
example, competition is often focused on lowest cost instead of quality, sustainability
and customer-perceived value; the process is fragmented and the link between the
client/end-user and the producer is weak, and the same can be said about the link

CHALMERS, Civil and Environmental Engineering 8
between designers and contractors. However, to compose a clear-cut definition of
industrialised construction/building is perhaps not as straightforward as one might
imagine, since different forms and techniques exist. CIBI W24 (International Council
for Research and Innovation in Building and Construction, work group) offers the
following general definition (see Sarja 1998):
“Industrialised Building is the term given to building technology where modern
systematised methods of design, production planning and control as well as mechanised
and automated manufacture are applied.”
Löfgren (2002) suggested that in-situ concrete construction can be viewed as industrial
when the following criteria are fulfilled:
The entire process is planned, co-ordinated, and controlled – which includes
the design, production, transportation, erection, and on-site construction.
The design and production/construction process of the product is integrated,
and all functional disciplines must be involved.
The production is systematised, mechanised, and automated as far as possible.
The design is systematised and is supported by tools for computer-integrated
construction (CIC) – e.g. ICT (information and communication technology),
CAD/CAM (computer-aided design and manufacturing), CAE/FE (computer-
aided engineering and finite element software), etc.
The process and production are managed so that risks and disturbances are
minimised, e.g. the effect of climate and weather.
For the production, the need for temporary works is minimised.
Measures are taken for continuous improvement of the entire process, which
includes considering new technology, new/improved materials, etc.
Löfgren (2002) also proposed that in-situ concrete construction be viewed as
industrialised if some but not all of the criteria are fulfilled. Furthermore, in-situ
concrete construction is viewed as mechanised if the on-site construction is, first and
foremost, adapted for the use of equipment, machinery, and robotics in order to
minimise the manual labour.
Girmscheid and Hofmann (2000) remark that industrialised construction often fails by
prioritising the production while ignoring product and management processes. Koskela
(2000) and Warszawski (1999) draw similar conclusions. In a study of industrial bridge
construction, conducted by Harryson (2002), three cornerstones were identified: (1)
process development, (2) product development, and (3) productivity development.
Harryson recognises the importance of the organisational/managerial domain as well as
aspects stressing the technical domain, and concludes that in a successful
implementation there cannot be an emphasis in just one of the domains, as suggested in
Figure 2. Hence, for successfully implemented industrial in-situ construction, all stage
of the process must be included and all parties must be involved (clients,
designers/engineers, contractors, and suppliers) and work as a project team.
I See http://www.cibworld.nl.

CHALMERS, Civil and Environmental Engineering 9
Organisational / Managerial Domain
Technical Domain
Productivity
Development
Product
Development
Process
Development
I C
T
Figure 2. The three cornerstones of industrial construction, from Harryson (2002).
2.4 Cost of in-situ concrete construction
In-situ concrete construction is a complex process with many inputs and logistical
problems, and the operations involved in traditional in-situ cast concrete construction
can be seen in Figure 3. The total cost of concrete construction is influenced by several
factors such as material choices/composition, labour costs and the working hours of
those involved in executing the work, and cost for equipment used in executing the
work. But the cost of capital (financing) for the investor as well as the contractor has to
be considered.
Formwork Scaffolding
SITE OPERATIONS
- Erection of falsework & scaffolding
- Erection of formwork
Reinforcement
Transportation to/on-site
SITE OPERATIONS
- Placement
- Fixation
Fabrication
Transportation on-site
Transportation to site
Distribution on-site
(eg pump)
SITE OPERATIONS
- Placement
- Compaction
- Screeding
- Floor finishing
SITE OPERATIONS
- Removal of falsework
- Formwork striking
- Erection of temporary safety scaffolding
Transportation on-site
SITE OPERATIONS
- Surface repair
Construction design input - reinforcement
Non value adding activities
Rework Non value adding activity
Cleaning and repair of formwork
curing
Construction design input - concrete
Construction design input - formwork
Transportation to/on-site
Concrete Batching Plant
Figure 3. Schematic view of operations involved in traditional concrete
construction, from Paper I.
CHALMERS, Civil and Environmental Engineering 10
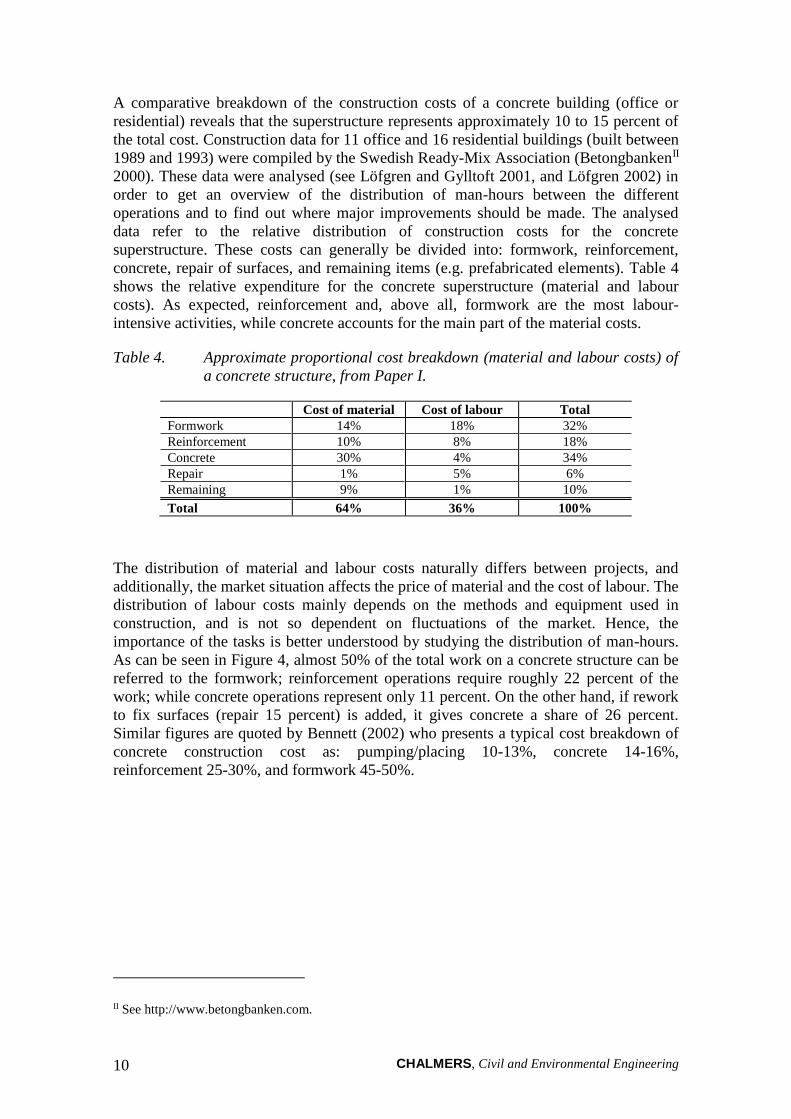
A comparative breakdown of the construction costs of a concrete building (office or
residential) reveals that the superstructure represents approximately 10 to 15 percent of
the total cost. Construction data for 11 office and 16 residential buildings (built between
1989 and 1993) were compiled by the Swedish Ready-Mix Association (BetongbankenII
2000). These data were analysed (see Löfgren and Gylltoft 2001, and Löfgren 2002) in
order to get an overview of the distribution of man-hours between the different
operations and to find out where major improvements should be made. The analysed
data refer to the relative distribution of construction costs for the concrete
superstructure. These costs can generally be divided into: formwork, reinforcement,
concrete, repair of surfaces, and remaining items (e.g. prefabricated elements). Table 4
shows the relative expenditure for the concrete superstructure (material and labour
costs). As expected, reinforcement and, above all, formwork are the most labour-
intensive activities, while concrete accounts for the main part of the material costs.
Table 4. Approximate proportional cost breakdown (material and labour costs) of
a concrete structure, from Paper I.
Cost of material Cost of labour Total
Formwork 14% 18% 32%
Reinforcement 10% 8% 18%
Concrete 30% 4% 34%
Repair 1% 5% 6%
Remaining 9% 1% 10%
Total 64% 36% 100%
The distribution of material and labour costs naturally differs between projects, and
additionally, the market situation affects the price of material and the cost of labour. The
distribution of labour costs mainly depends on the methods and equipment used in
construction, and is not so dependent on fluctuations of the market. Hence, the
importance of the tasks is better understood by studying the distribution of man-hours.
As can be seen in Figure 4, almost 50% of the total work on a concrete structure can be
referred to the formwork; reinforcement operations require roughly 22 percent of the
work; while concrete operations represent only 11 percent. On the other hand, if rework
to fix surfaces (repair 15 percent) is added, it gives concrete a share of 26 percent.
Similar figures are quoted by Bennett (2002) who presents a typical cost breakdown of
concrete construction cost as: pumping/placing 10-13%, concrete 14-16%,
reinforcement 25-30%, and formwork 45-50%.
II See http://www.betongbanken.com.

CHALMERS, Civil and Environmental Engineering 11
Formwork,
columns 2%
Reinforcement,
walls 7%
Reinforcement,
floor 13%
Reinforcement,
columns 2%
Concrete,
walls 4%
Concrete,
floors 7%
Repair
15%
Remaining /Prefab
3%
Formwork,
floor 26%
Concrete,
columns 0.3%
Formwork,
walls 21%
Formwork
49%
Reinforcement
22%
Concrete
11%
Figure 4. Approximate relative breakdown of man-hours for a concrete structure,
from Paper I.
The conclusions that can be drawn ,based on this study, are that:
formwork represents the major portion of man-hours;
work with reinforcement is the second largest portion of the man-hours; and
rework, or repair of surfaces, is quite extensive.
This suggests that effective permanent formwork systems would enable more efficient
concrete construction and render arduous and costly labour activities unnecessary.
Moreover, it may be possible to further rationalise and reduce the labour-intensive work
with reinforcement (placing and fixing) by introducing fibre-reinforced concrete, which
ideally should be combined with a properly designed self-compacting concrete, thus
achieving industrialised and mechanised construction. In addition, with self-compacting
concrete better surface finishing can be expected. The combination of these
developments – permanent formwork systems and self-compacting fibre-reinforced
concrete – could possibly lead to more industrialised construction.
2.5 Developments of in-situ concrete construction
The concrete industry (material suppliers and contractors) is constantly under pressure
to improve productivity and reduce costs without lowering the standard of quality of its
products. This driving force for technical development has had effects on both concrete
and reinforcement technology, and has resulted in new types of concrete and
reinforcement as well as new building systems and methods. In a similar manner, the
development of information technology (construction IT) has presented new
possibilities and methods of work for the planning, design, manufacturing, transport,

CHALMERS, Civil and Environmental Engineering 12
construction, and operation and maintenance of buildings. In this section – based on
Paper I and Löfgren (2002) – a limited number of techniques and research projects will
be discussed in order to illustrate some of the existing potential.
There is a great variety of methods for in-situ concrete construction, e.g. different types
of formwork systems, slip forming, and tilt-up as well as different structural systems
like reinforced concrete, prestressed concrete, and steel-concrete composite systems.
The choice of construction method and its phasing depend on a number of factors, and
e.g. Camellerie (1985) put forward the following factors: availability of funds; method
of financing; capability of the contractors; impact on labour market; fabrication time;
critical prerequisite sequences; interface between concurrent phases; use of equipment;
weather conditions; economics and use alternate to determine completion date; design
time. When planning the concreting process, the following aspects should also be
considered: specified properties of the concrete, in both the hardened and fresh states;
whether any special type should be used, e.g. self-compacting or high-strength; methods
of handling/transporting the concrete on site; compaction, curing, and finishing
methods; reinforcement densities and congestions; pour sizes and construction joints.
Studies of concrete construction have revealed that there are considerable improvements
to be made by developing and systematising the construction process and the design.
When studying the operations in Figure 3, from a value management perspective, it is
clear that erection and dismantling of scaffolding and the stripping, cleaning and
repairing of formwork are examples of non-value-adding activities. The operations are
necessary for traditional formwork, but they add no value for the end-client. In a case
study of seven construction projects, conducted by Burwick (1998), the advantages and
drawbacks of participating formwork (precast concrete panels) were investigated. All
projects demonstrated time savings of 10 to 35 percent and the system required fewer
workers (by 10 to 30 percent). Other advantages were better surface finish (less rework)
and improved working conditions. The drawbacks of the system were that material cost
was higher, requirements for co-ordination within the design were found to be higher,
and dimensional tolerance was more severe. Reinforcement details were not thoroughly
planned, and placing reinforcement in walls was difficult. Furthermore, a study of the
construction process for in-situ concrete buildings was conducted in the European
Concrete Building Project at BRE in Cardington; see Best Practice Guides (BRE 2000
& 2001). The current process was mapped, the sources of waste were identified (non-
value-adding activities, see Figure 3), and an improved process was developed and
used; the resulting improvement can be seen in Table 5. These savings have been
confirmed by findings in other projects, e.g. the study conducted at the Reading
Production Engineering Group (see Gray 1995).
Table 5. Potential savings, according to BRE – European Concrete Building
Project (Best Practice Guides, BRE 2000 & 2001).
Improvement area Reduction in total
cycle time [%]
Reduction in total
man-hours [%]
Supply chain management 10.5 15.0
Buildability 3.0 3.5
Resource allocation 6.5 10.5
Operational methods 8.5 13.5
Total 28.5 42.5

CHALMERS, Civil and Environmental Engineering 13
2.5.1 Formwork systems
The selection of formwork system/technique is crucial because it often decides the
speed of construction. In addition, the formwork cost is one of the larger parts of the
total cost and often the most variable of these. Generally, a formwork system can be
defined as (see Hanna 1998):‘‘the total system of support for freshly placed concrete
including the mould or sheathing which contacts the concrete as well as supporting
members, hardware, and necessary bracing.’’ Examples of different formwork systems
are: conventional wood/plywood systems, proprietary formwork, table forms, tunnel
forms, stay-in-place forms; see e.g. Johnston (1997), Hanna and Sanvido (1991), and
Bennett (2002). For the selection of the formwork type and its design, factors to be
taken into consideration include, for example: concrete mix proportions, rate of placing,
extent and type of compaction, method of placing, the shape of the structure, structural
forms, building span, repetitive nature, etc. Furthermore, according to Patrick (1998),
the type and quantity of site labour (when constructing a slab) can be significantly
affected by:
the nature of the work (e.g. skilled, etc.);
the total number of individual parts;
the weight of the individual parts;
the height of the floor lift, if formwork and scaffolding are required;
whether the formwork has to be stripped, cleaned or repaired, and manipulated
into the next position;
the life (i.e. number of uses) of the formwork parts in the case of removable
systems;
whether repair to the soffit finish is required if the formwork is removed; and
the amount of reinforcement that must be placed in the slab.
Generally, a distinction can be made between two main categories of formwork
systems: the temporary formwork systems, which are reusable, and the permanent, or
stay-in-place, formwork systems. Temporary formwork can be made of timber planks,
plywood sheets, metal panels, etc. Temporary formwork systems have had a substantial
development, they have become easier to handle and assemble and also lighter thanks to
the use of aluminium (see Figure 5).
Figure 5. Example of temporary formwork systems from PERI. Pictures courtesy of
PERI.
CHALMERS, Civil and Environmental Engineering 14
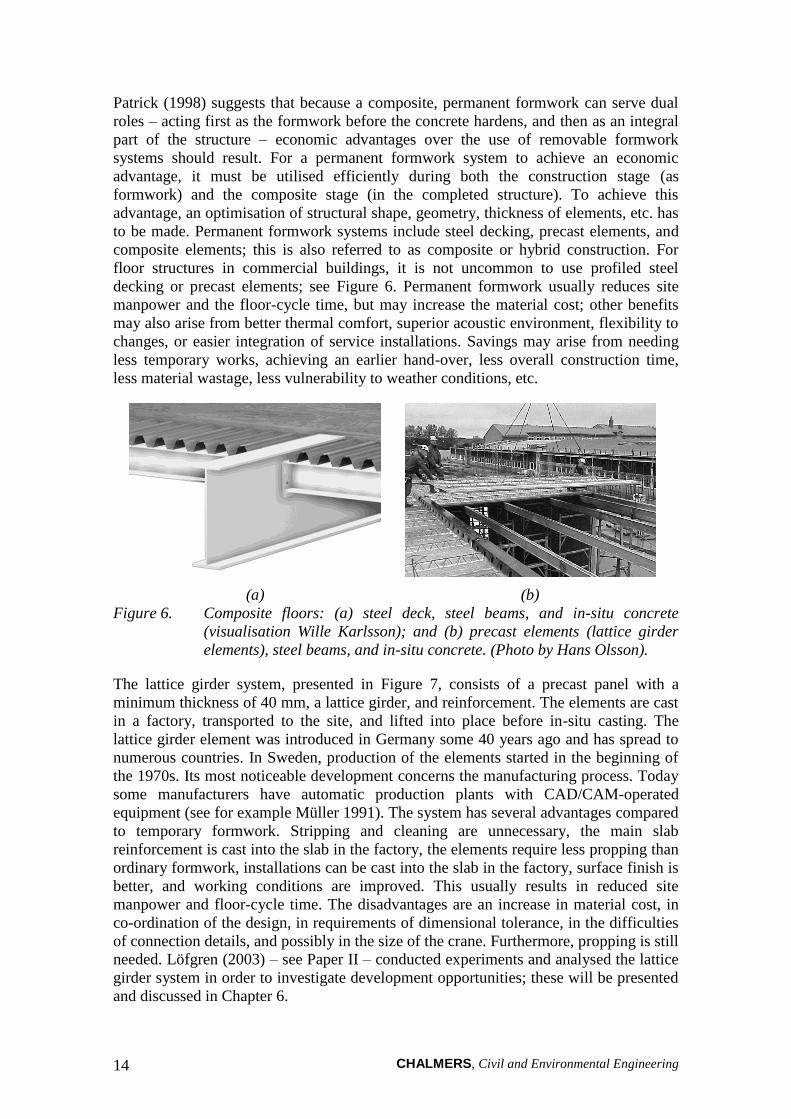
Patrick (1998) suggests that because a composite, permanent formwork can serve dual
roles – acting first as the formwork before the concrete hardens, and then as an integral
part of the structure – economic advantages over the use of removable formwork
systems should result. For a permanent formwork system to achieve an economic
advantage, it must be utilised efficiently during both the construction stage (as
formwork) and the composite stage (in the completed structure). To achieve this
advantage, an optimisation of structural shape, geometry, thickness of elements, etc. has
to be made. Permanent formwork systems include steel decking, precast elements, and
composite elements; this is also referred to as composite or hybrid construction. For
floor structures in commercial buildings, it is not uncommon to use profiled steel
decking or precast elements; see Figure 6. Permanent formwork usually reduces site
manpower and the floor-cycle time, but may increase the material cost; other benefits
may also arise from better thermal comfort, superior acoustic environment, flexibility to
changes, or easier integration of service installations. Savings may arise from needing
less temporary works, achieving an earlier hand-over, less overall construction time,
less material wastage, less vulnerability to weather conditions, etc.
(a) (b)
Figure 6. Composite floors: (a) steel deck, steel beams, and in-situ concrete
(visualisation Wille Karlsson); and (b) precast elements (lattice girder
elements), steel beams, and in-situ concrete. (Photo by Hans Olsson).
The lattice girder system, presented in Figure 7, consists of a precast panel with a
minimum thickness of 40 mm, a lattice girder, and reinforcement. The elements are cast
in a factory, transported to the site, and lifted into place before in-situ casting. The
lattice girder element was introduced in Germany some 40 years ago and has spread to
numerous countries. In Sweden, production of the elements started in the beginning of
the 1970s. Its most noticeable development concerns the manufacturing process. Today
some manufacturers have automatic production plants with CAD/CAM-operated
equipment (see for example Müller 1991). The system has several advantages compared
to temporary formwork. Stripping and cleaning are unnecessary, the main slab
reinforcement is cast into the slab in the factory, the elements require less propping than
ordinary formwork, installations can be cast into the slab in the factory, surface finish is
better, and working conditions are improved. This usually results in reduced site
manpower and floor-cycle time. The disadvantages are an increase in material cost, in
co-ordination of the design, in requirements of dimensional tolerance, in the difficulties
of connection details, and possibly in the size of the crane. Furthermore, propping is still
needed. Löfgren (2003) – see Paper II – conducted experiments and analysed the lattice
girder system in order to investigate development opportunities; these will be presented
and discussed in Chapter 6.
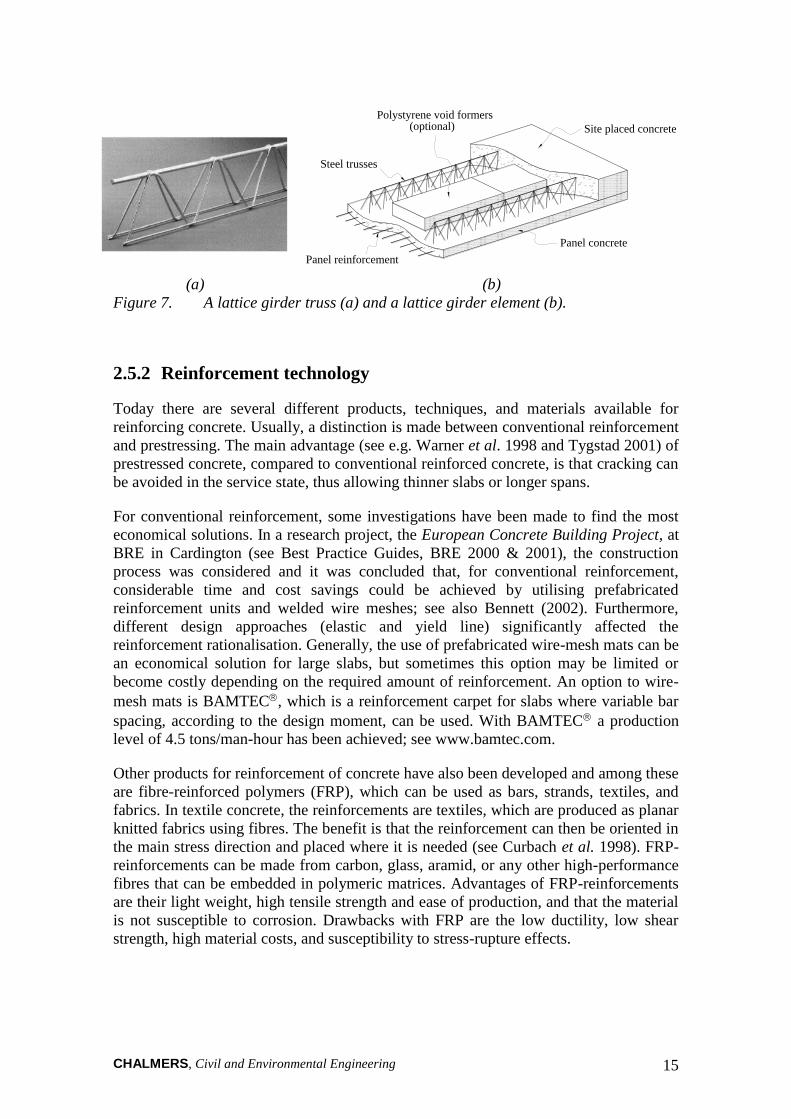
CHALMERS, Civil and Environmental Engineering 15
Panel reinforcement
(optional)
Steel trusses
Panel concrete
Site placed concrete
Polystyrene void formers
(a) (b)
Figure 7. A lattice girder truss (a) and a lattice girder element (b).
2.5.2 Reinforcement technology
Today there are several different products, techniques, and materials available for
reinforcing concrete. Usually, a distinction is made between conventional reinforcement
and prestressing. The main advantage (see e.g. Warner et al. 1998 and Tygstad 2001) of
prestressed concrete, compared to conventional reinforced concrete, is that cracking can
be avoided in the service state, thus allowing thinner slabs or longer spans.
For conventional reinforcement, some investigations have been made to find the most
economical solutions. In a research project, the European Concrete Building Project, at
BRE in Cardington (see Best Practice Guides, BRE 2000 & 2001), the construction
process was considered and it was concluded that, for conventional reinforcement,
considerable time and cost savings could be achieved by utilising prefabricated
reinforcement units and welded wire meshes; see also Bennett (2002). Furthermore,
different design approaches (elastic and yield line) significantly affected the
reinforcement rationalisation. Generally, the use of prefabricated wire-mesh mats can be
an economical solution for large slabs, but sometimes this option may be limited or
become costly depending on the required amount of reinforcement. An option to wire-
mesh mats is BAMTEC, which is a reinforcement carpet for slabs where variable bar
spacing, according to the design moment, can be used. With BAMTEC a production
level of 4.5 tons/man-hour has been achieved; see www.bamtec.com.
Other products for reinforcement of concrete have also been developed and among these
are fibre-reinforced polymers (FRP), which can be used as bars, strands, textiles, and
fabrics. In textile concrete, the reinforcements are textiles, which are produced as planar
knitted fabrics using fibres. The benefit is that the reinforcement can then be oriented in
the main stress direction and placed where it is needed (see Curbach et al. 1998). FRP-
reinforcements can be made from carbon, glass, aramid, or any other high-performance
fibres that can be embedded in polymeric matrices. Advantages of FRP-reinforcements
are their light weight, high tensile strength and ease of production, and that the material
is not susceptible to corrosion. Drawbacks with FRP are the low ductility, low shear
strength, high material costs, and susceptibility to stress-rupture effects.

CHALMERS, Civil and Environmental Engineering 16
2.5.3 Concrete technology
The concrete industry has developed into a high-tech industry. Viewed from the early
beginning, the progress has been enormous, notably in the improvement of concrete
strength. However, it is not only strength that has been increased. Lately other material
properties have been recognised as equally important – for example, permeability,
ductility, and workability. Examples of this development can be seen in: Bache (1989),
Li (1995), Walraven (1999), Brandt and Kucharska (1999), Guse and Müller (2000),
Guerrini (2000), Flaga (2000), Aïtcin (2000), Zilch (2000), Flaga (2000), Brouwer
(2001), Harryson (2002), Bentur (2002), Bennett (2002), Chong and Garboczi (2002).
With this development, it is now possible to obtain certain predefined properties by
adapting a certain mixture composition; to quote Walraven (1999), the era of “tailor-
made concrete” has arrived. Examples of ‘new’ types of concretes (or cementitious
composites) are:
HSC – High-Strength Concrete;
LWAC – LightWeight Aggregate Concrete;
SCC – Self-Compacting Concrete;
FRC – Fibre-Reinforced Concrete or FRCC – Fibre-Reinforced Cement
Composite;
HPFRCC – High-Performance Fibre-Reinforced Cement Composite; and
ECCIII – Engineered Cementitious Composites.
All of the above-mentioned concretes (or cement composites) can be classified as high-
performance materials. High-performance concrete is the generic classification of
concretes with improved performance, in one or several attributes, compared to
ordinary/regular concrete.
High-strength concrete, as the term suggests, is characterised as concrete having a
higher compressive strength than normal concrete. The boundary between normal and
high strength is not fixed and has increased with time; today, concrete having a
compressive strength above 60 to 80 MPa can be considered as high-strength. The
utilisation of high-strength concrete progresses rapidly, and, for example, it was used in
the construction of the twin towers in Kuala Lumpur, Malaysia. The technology of high-
strength concrete is by now well established and the benefits and disadvantages are
more or less well known; see e.g. Shah and Ahmad (1994) and CEB Bulletin 222.
Lightweight aggregate concrete is a concrete with closed structure, containing
lightweight aggregates, and having an oven-dry density of not more than 2200 kg/m3
(fib Bulletin 8, 2000). Lightweight aggregate concrete has the advantage of reduced
dead weight and improved thermal insulation ability. By reducing the dead load, longer
spans can be achieved (resulting in fewer columns or unpropped permanent formwork)
and savings can be made on the foundation. Lightweight concrete floor slabs were used,
for example, in the Guggenheim museum in Bilbao, Spain (fib Bulletin 8, 2000); the
III ECC is an ultra-ductile mortar-based composite, reinforced with short random fibres; for more
information see the ECC technology network, http://www.engineeredcomposites.com/.

CHALMERS, Civil and Environmental Engineering 17
concrete had a density of 1700 kg/m3, and a compressive strength of 25 MPa, in order to
reduce the weight of the structure. However, there is need for further development and
research to be able to present an economical solution. As stated in fib Bulletin 8 (2000),
“The challenges for the aggregate industry are thus to produce an aggregate with:
high strength;
low weight;
good production properties (low water absorption); and
reasonable price.”
Self-compacting concrete was first developed in 1988 as a response to problems with
durability of concrete structures in Japan; see Ozawa et al. (1992). The concrete was
named ‘high-performance concrete’ at the three stages:
(1) fresh, self-compactable (able to fill in every corner of the formwork);
(2) early age, avoidance from initial defects; and
(3) hardened, protection against external factors.
Self-compacting concrete is well suited for a mechanised and automated manufacturing
process, and will offers new possibilities of mechanising the work tasks. In a research
project investigating rational production systems by utilising self-compacting concrete,
it was found that production was rationalised and that the advantages were numerous
(Grauers, 1998), for example:
rationalised concrete production, faster construction and less casting time;
reduction in labour at the building site;
better working conditions and reduced health problems for the workers;
good homogeneity, improved quality and durability, and smoother surfaces;
and
easier casting in difficult situations, e.g. complex forms or congested
reinforcement.
Fibre-reinforced concrete (FRC) is a concrete containing dispersed fibres. In
comparison to conventional reinforcement, the characteristics of fibre reinforcement are
that: (1) the fibres are generally distributed throughout a cross-section, whereas
reinforcement bars are only placed where needed; (2) the fibres are relatively short and
closely spaced, whereas the reinforcement bars are continuous and not as closely
placed; and (3) it is generally not possible to achieve the same area of reinforcement
with fibres as with reinforcing bars. This means that, unlike ordinary reinforced
concrete with an appropriate minimum reinforcement, a softening response is observed
after cracking. In contrast to plain concrete, the toughness is significantly increased as a
result of fibres transmitting force across cracks. The advent of fibre reinforcement has
thus extended the versatility of concrete as a construction material by providing an
effective method of overcoming its intrinsic brittleness, and provides an opportunity to
reduce one of the more labour-intensive activities necessary for concrete construction.
The use of fibres in concrete is not a novel concept, but it is not until recently that there
seems to be any significant use in structural applications. Li (2002) estimates the
amount of fibres used worldwide to be 300,000 tons per year; the growth rate in North

CHALMERS, Civil and Environmental Engineering 18
America is expected to be 20% per year. Most of the current applications are non-
structural; the fibres are used to control plastic and drying shrinkage in, for example,
floors and pavements, and in most applications the fibre volume is less than 1%. The
main advantage of including fibres in the matrices is that it improves the
ductility/toughness and the post-peak stress–strain/crack relationship. The types of
fibres commonly used include steel, glass, carbon, polyvinyl alcohol (PVA),
polypropylene (PP), and cellulose.
High-performance fibre-reinforced cement composite (HPFRCC) is, according to
Naaman and Reinhardt (1996), characterised or defined as ‘high-performance’ if the
stress–strain curve shows a quasi-strain hardening (or pseudo-strain hardening)
behaviour (i.e. a post-cracking strength larger than the cracking strength, or elastic-
plastic response). Examples of this type of material are: SIFCON (Slurry Infiltrated
Concrete), SIMCON (Slurry Infiltrated Mat Concrete), CRC, and Ductal. In SIFCON
the steel fibres are first placed in the mould, fibre volumes are typically 4 to 12%, and
the paste is then infiltrated. Most of these HPFRCC applications use a high fibre
volume, 4 to 20%. The negative aspect of the high fibre volume is that it is expensive.
Recent scientific advances have made it possible to achieve strain-hardening materials
with less than 2%. Engineered cementitious composite (ECC) is a material developed at
the ACE-MRL at the University of Michigan (see Li 2002). The material properties for
an ECC with 2% PE (polyethylene) fibres are: a tensile strength of 2.5 MPa, a tensile
strain capacity of 3 to 6%, a modulus of elasticity of 22 to 35 GPa, and a fracture energy
of 27 kJ/m2.
2.6 Concluding remarks
Current concrete construction and design are meeting new challenges from other
construction materials and techniques (e.g. steel, precast concrete, and timber). An ‘on-
site’ industrialisation of concrete construction could address this challenge and the
problems affecting the construction industry. It was shown that labour costs represent
roughly 40 percent of the construction cost, where formwork accounts for the major
portion of this cost (almost 50 percent) and reinforcement for the other large part.
However, research confirms that there are substantial possibilities for improvement
(reduction of man-hours and construction time as well as improved working conditions),
see BRE 2000 & 2001, Grauers (1998), Burwick (1998), and Bennett (2002).
Consequently, development of new formwork/building systems has the potential to
reduce labour. In addition, new materials, well suited for a mechanised and automated
manufacturing process, have been developed. Examples of such materials are self-
compacting concrete (SCC) and fibre-reinforced concrete (FRC), and these could be
utilised for industrialisation of in-situ cast concrete construction. On the other hand, it
will require material suppliers, structural engineers, and construction management able
to produce, design, plan, and control their use. It is also essential that test methods as
well as design codes and standards, covering these materials, are available.
CHALMERS, Civil and Environmental Engineering 19
3 Fibre-reinforced concrete
3.1 General
The use of fibres in concrete is not a novel concept; early patents on fibre-reinforced
concrete date back to 1874 (A. Berard, USA) and fibres with shapes similar to those
currently used were patented already in 1927 (G. Martin, USA), 1939 (Zitkevic, Britain)
and 1943 (G. Constantinesco, England) – for a more comprehensive historical review
see e.g. Naaman (1985) and Beddar (2004).
Generally, concrete containing a hydraulic cement, water, fine and coarse aggregate,
and discontinuous discrete fibres is called fibre-reinforced concrete (FRC). Fibres of
various shapes and sizes produced from steel, synthetics, glass, and natural materials
can be used. However, for most structural and non-structural purposes, steel fibres are
the most used of all fibre materials, whereas synthetic fibres (e.g. polypropylene and
nylon) are mainly used to control the early cracking (plastic shrinkage cracks) in slabs.
Fibres are generally added during mixing, but may also be pre-placed into a mould and
the cementitious matrix subsequently infiltrated (e.g. SIFCON).
The constituents of a composite are generally arranged so that one or more
discontinuous phases are embedded in a continuous phase. The discontinuous phase is
termed the reinforcement and the continuous phase is the matrix. In any composite
material, fibres are added to improve the properties and behaviour of the material, and
these fibres can be either continuous or discontinuous (i.e. short), with a preferred (e.g.
uni-directional or bi-directional) or random orientation. Moreover, the matrix can be
classified as either brittle or ductile; cement-based materials are typical brittle matrix
materials. Depending on the characteristics of the matrix, the addition of discontinuous
fibres will influence either the strength or the toughness. Normally, in a ductile matrix,
short fibres are added to increase the strength, while for a brittle matrix the fibres are
added primarily to improve the toughness. The main factors controlling the performance
of a composite material are: (1) the physical properties of fibres and matrix; (2) the
strength and bond between fibres and matrix; and (3) the amount of fibres (volume
fraction) and their distribution and orientation.
3.2 Fibre technology
There is a wide range of fibres (see Figure 8) that can be used to improve toughness and
other properties of concrete and cementitious composites. Steel fibres have been used
for a considerable time, but modern steel fibres have higher slenderness and more
complex geometries, and are often made of high-strength steel. Further, synthetic fibres
are becoming more attractive as they can provide effective reinforcement comparable to
that of steel fibres. Types of synthetic fibres that have been incorporated into cement
matrices include: polyethylene (PE), polypropylene (PP), acrylics (PAN), polyvinyl
acetate (PVA), polyamides (PA), aramid, polyester (PES), and carbon. Some examples
of different commercially available fibres can be seen in Figure 8. The both mechanical
and geometrical properties of fibres vary widely and as does the effect they have on the
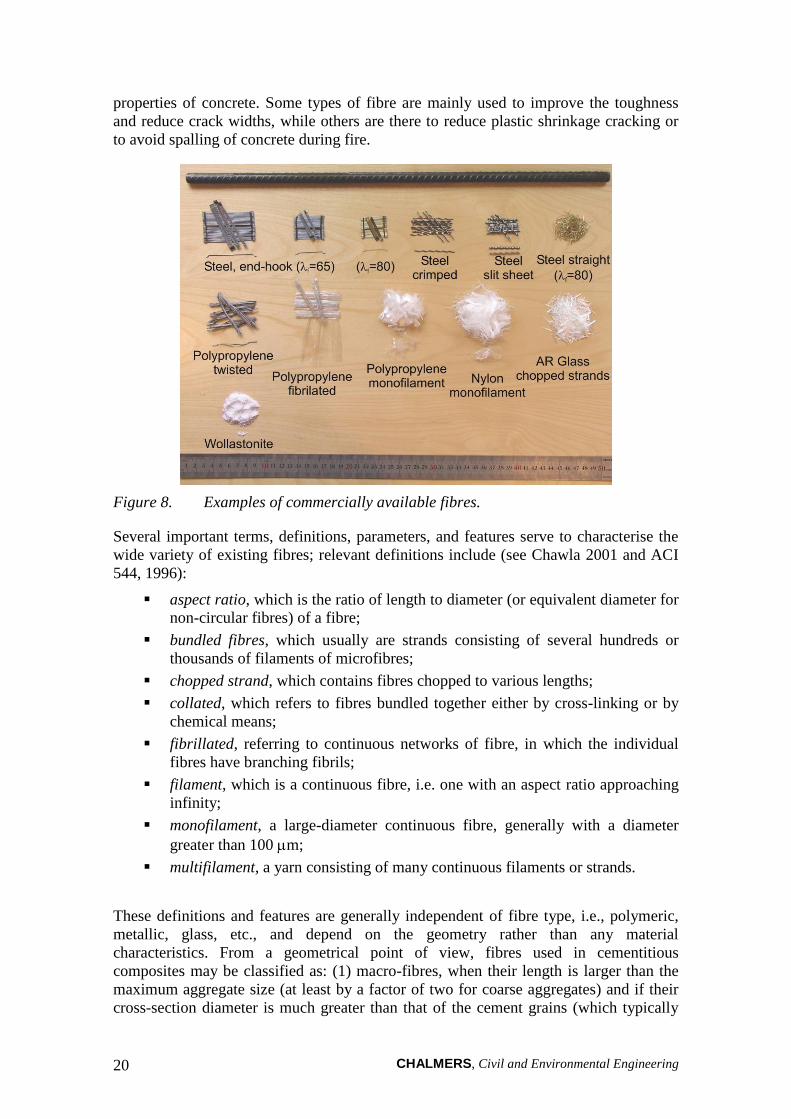
CHALMERS, Civil and Environmental Engineering 20
properties of concrete. Some types of fibre are mainly used to improve the toughness
and reduce crack widths, while others are there to reduce plastic shrinkage cracking or
to avoid spalling of concrete during fire.
Figure 8. Examples of commercially available fibres.
Several important terms, definitions, parameters, and features serve to characterise the
wide variety of existing fibres; relevant definitions include (see Chawla 2001 and ACI
544, 1996):
aspect ratio, which is the ratio of length to diameter (or equivalent diameter for
non-circular fibres) of a fibre;
bundled fibres, which usually are strands consisting of several hundreds or
thousands of filaments of microfibres;
chopped strand, which contains fibres chopped to various lengths;
collated, which refers to fibres bundled together either by cross-linking or by
chemical means;
fibrillated, referring to continuous networks of fibre, in which the individual
fibres have branching fibrils;
filament, which is a continuous fibre, i.e. one with an aspect ratio approaching
infinity;
monofilament, a large-diameter continuous fibre, generally with a diameter
greater than 100 m;
multifilament, a yarn consisting of many continuous filaments or strands.
These definitions and features are generally independent of fibre type, i.e., polymeric,
metallic, glass, etc., and depend on the geometry rather than any material
characteristics. From a geometrical point of view, fibres used in cementitious
composites may be classified as: (1) macro-fibres, when their length is larger than the
maximum aggregate size (at least by a factor of two for coarse aggregates) and if their
cross-section diameter is much greater than that of the cement grains (which typically
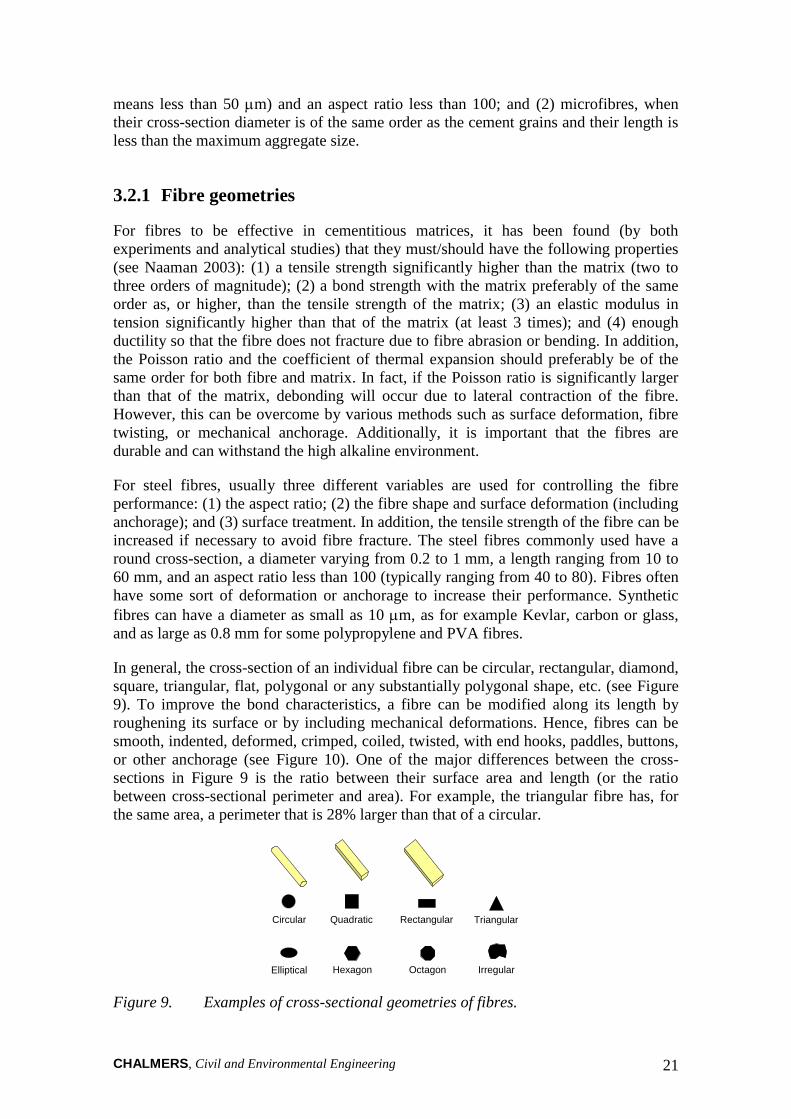
CHALMERS, Civil and Environmental Engineering 21
means less than 50 m) and an aspect ratio less than 100; and (2) microfibres, when
their cross-section diameter is of the same order as the cement grains and their length is
less than the maximum aggregate size.
3.2.1 Fibre geometries
For fibres to be effective in cementitious matrices, it has been found (by both
experiments and analytical studies) that they must/should have the following properties
(see Naaman 2003): (1) a tensile strength significantly higher than the matrix (two to
three orders of magnitude); (2) a bond strength with the matrix preferably of the same
order as, or higher, than the tensile strength of the matrix; (3) an elastic modulus in
tension significantly higher than that of the matrix (at least 3 times); and (4) enough
ductility so that the fibre does not fracture due to fibre abrasion or bending. In addition,
the Poisson ratio and the coefficient of thermal expansion should preferably be of the
same order for both fibre and matrix. In fact, if the Poisson ratio is significantly larger
than that of the matrix, debonding will occur due to lateral contraction of the fibre.
However, this can be overcome by various methods such as surface deformation, fibre
twisting, or mechanical anchorage. Additionally, it is important that the fibres are
durable and can withstand the high alkaline environment.
For steel fibres, usually three different variables are used for controlling the fibre
performance: (1) the aspect ratio; (2) the fibre shape and surface deformation (including
anchorage); and (3) surface treatment. In addition, the tensile strength of the fibre can be
increased if necessary to avoid fibre fracture. The steel fibres commonly used have a
round cross-section, a diameter varying from 0.2 to 1 mm, a length ranging from 10 to
60 mm, and an aspect ratio less than 100 (typically ranging from 40 to 80). Fibres often
have some sort of deformation or anchorage to increase their performance. Synthetic
fibres can have a diameter as small as 10 m, as for example Kevlar, carbon or glass,
and as large as 0.8 mm for some polypropylene and PVA fibres.
In general, the cross-section of an individual fibre can be circular, rectangular, diamond,
square, triangular, flat, polygonal or any substantially polygonal shape, etc. (see Figure
9). To improve the bond characteristics, a fibre can be modified along its length by
roughening its surface or by including mechanical deformations. Hence, fibres can be
smooth, indented, deformed, crimped, coiled, twisted, with end hooks, paddles, buttons,
or other anchorage (see Figure 10). One of the major differences between the cross-
sections in Figure 9 is the ratio between their surface area and length (or the ratio
between cross-sectional perimeter and area). For example, the triangular fibre has, for
the same area, a perimeter that is 28% larger than that of a circular.
Circular Quadratic Rectangular Triangular
Irregular Hexagon Octagon Elliptical
Figure 9. Examples of cross-sectional geometries of fibres.

CHALMERS, Civil and Environmental Engineering 22
Straight End-hooks
crimped (wave shaped)
Paddles End knobs Coned
Surface indented
Toothed Bow shaped Irregular Twisted
Figure 10. Examples of some typical fibre geometries.
3.2.2 Fibre materials and physical properties
Metallic fibres are made of either carbon steel or stainless steel and their tensile strength
varies from 200 to 2,600 MPa (see Table 6). In the draft European Standard prEN
14889-1:2004 the following definition is provided for steel fibres: “Steel fibres are
straight or deformed pieces of cold-drawn steel wire, straight or deformed cut sheet
fibres, melt extracted fibres, shaved cold drawn wire fibres and fibres milled from steel
blocks which are suitable to be homogeneously mixed into concrete or mortar”. Steel
fibres can also have coatings, for example of zinc for improved corrosion resistance, or
brass for improved bond characteristics. In prEN 14889-1:2004, steel fibres are divided
into five general groups and defined in accordance with the basic material used for the
production of the fibres according to:
■ Group I , cold-drawn wire.
■ Group II, cut sheet.
■ Group III, melt extracted.
■ Group IV, shaved cold drawn wire.
■ Group V, milled from blocks.
There is a large variety of synthetic fibres available commercially – polymer fibres such
as: polypropylene (PP), polyethylene (PE), polyamides, polyethylene terephthalate
(PET), polyacrylonitrile (PAN), polytetrafluooroethylene (PTFE), aramid, etc., are well-
established fibres. The properties of synthetic fibre vary considerably, in particular with
respect to the modulus of elasticity; see Table 6. In the draft European Standard prEN
14889-2:2004 the following definition is provided for polymer fibres: “Polymer fibres
are straight or deformed pieces of extruded orientated and cut material which are
suitable to be homogeneously mixed into concrete or mortar”. Polymer is defined as:
“basic fibre material based on polyolefin (e.g. polypropylene or polyethylene),
polyester, nylon, PVA, acrylic and aramids etc. and blends of them”. Moreover, in
prEN 14889-2:2004 fibres are to be characterised in classes in accordance with the
intended use, which are:

CHALMERS, Civil and Environmental Engineering 23
■ Class I; intended primarily to improve the short-term plastic properties of
mortar and/or concrete by controlling plastic shrinkage, settlement cracks, and
reducing bleeding, but not adversely affecting the long-term properties.
■ Class II; intended primarily to improve the durability of mortar and/or
concrete by improving abrasion and impact resistance and by reducing
damage caused by cycles of freezing and thawing.
■ Class III; fibres which primarily increase the residual strength of mortar and/or
concrete.
■ Class IV; fibres which are primarily used to improve the fire resistance of
mortar and/or concrete.
Naturally occurring fibres include organic fibres such as cellulose, silk, wool, cotton,
jute, hemp, sisal and inorganic fibres such as asbestos, Wollastonite, and basalt. For
example, Wollastonite is a natural mineral, calcium meta-silicate (-CaO-CaSiO2), with
a relatively high modulus (see Table 6 and Figure 8), and is generally available in the
shape of acicular particles for commercial applications. Wollastonite microfibres have
lateral dimensions of about 25–40 µm and lengths ranging from 0.4 to 0.6 mm.
More comprehensive information on different types of fibres, their properties and use
can be found in the following references: in general textbooks on fibre-reinforced
composites, e.g. Bentur and Mindess (1999) and Balagura and Shah (1992); in
textbooks on fibres, e.g. Hongu and Phillips (1997) and Hearle (2001); in ACI 544
(1996), a state-of-the-art report on fibre-reinforced concrete; in Zheng and Feldman
(1995), a review article on synthetic fibre-reinforced concrete.

CHALMERS, Civil and Environmental Engineering 24
Table 6. Physical properties of some fibres.
Type of Fibre
Diameter
[m]
Specific
gravity
[g/cm3]
Tensile
strength
[MPa]
Elastic
modulus
[GPa]
Ultimate
elongation
[%]
Metallic
Steel 5-1 000 7.85 200-2 600 195-210 0.5-5
Glass
E glass 8-15 2.54 2 000-4 000 72 3.0-4.8
AR glass 8-20 2.70 1 500-3 700 80 2.5-3.6
Synthetic
Acrylic (PAN) 5-17 1.18 200-1 000 14.6-19.6 7.5-50.0
Aramid (e.g. Kevlar) 10-12 1.4-1.5 2 000-3 500 62-130 2.0-4.6
Carbon (low modulus) 7-18 1.6-1.7 800-1 100 38-43 2.1-2-5
Carbon (high modulus) 7-18 1.7-1.9 1 500-4 000 200-800 1.3-1.8
Nylon (polyamide) 20-25 1.16 965 5.17 20.0
Polyester (e.g. PET) 10-8 1.34-1.39 280-1 200 10-18 10-50
Polyethylene (PE) 25-1 000 0.96 80-600 5.0 12-100
Polyethylene (HPPE) - 0.97 4 100-3 000 80-150 2.9-4.1
Polypropylene (PP) 10-200 0.90-0.91 310-760 3.5-4.9 6-15.0
Polyvinyl acetate
(PVA)
3-8 1.2-2.5 800-3 600 20-80 4-12
Natural - organic
Cellulose (wood) 15-125 1.50 300-2 000 10-50 20
Coconut 100-400 1.12-1.15 120-200 19-25 10-25
Bamboo 50-400 1.50 350-50 33-40 -
Jute 100-200 1.02-1.04 250-350 25-32 1.5-1.9
Natural - inorganic
Asbestos 0.02-25 2.55 200-1 800 164 2-3
Wollastonite 25-40 2.87-3.09 2 700-4 100 303-530 -
3.3 Orientation and distribution of fibres
The fibre orientation plays an important role for the mechanical performance of fibre-
reinforced composites. The technology of dispersed reinforcement provides for direct
and random (free) orientation of fibres in the concrete body. Directed orientation, see
Figure 11 (a)-(e), is realised mainly by using continuous filaments, plaits, various types
of fabrics and non-fabric nets, or by special production techniques like pre-placing the
fibres (e.g. SIFCON) or for example in the Hatcheck process. Body-random orientation
is characterised by equi-probable and unlimited (free) distribution of short fibres
throughout the body of the concrete (in three-dimensional space); see Figure 11(f). The
angles of inclination of the fibres relative to the surface of the component range from
zero to 90, as long as the dimensions of the component, in all directions, exceed the
length of fibres considerably. Plane-random orientation is characterised by equi-
probable and unlimited (free) distribution of fibres in a two-dimensional space. This
case occurs mainly in thin-walled elements, e.g. flat sheets, plates, etc., when the
thickness of an element is less than the length of the fibres used. As a result of this, the
angle of inclination of fibres relative to the surface of the elements is comparatively
low. Constrained-random orientation is relevant when at least two geometric parameters
of a structural unit, e.g. height and width, are restricted in dimensions and limit the free,
random orientation of fibres in the body of the concrete. Such a situation can be
observed in the case of beams, plates, etc. The smaller the cross-section, the more
restricted the possibilities of free orientation of the fibres. However, it should also be

CHALMERS, Civil and Environmental Engineering 25
noted that for fibre-reinforced concrete there are a number of other factors influencing
the fibre orientation and distribution apart from purely geometrical considerations –
such as the method of placement, the equipment used (e.g. pumping), and the properties
of the fresh concrete (resistance against fibre segregation).
Figure 11. Schematic representation of different fibre composites: (a) unidirectional
continuous; (b) bi-directional continuous; (c) discontinuous with biased
1-D fibre orientation; (d) discontinuous with biased 2-D fibre orientation;
(e) discontinuous with plane-random orientation; (f) discontinuous with
random fibre orientation; (g) particulate composite (particle suspension);
and (h) fibre-reinforced and particulate composite (e.g. fibre-reinforced
concrete).
To determine the mechanical behaviour of the different composites presented in Figure
11 it is necessary to consider the orientation of the fibres. The fibre orientation and the
numbers crossing an arbitrary crack plane can be determined by theoretical
considerations. For this purpose it is common to define the fibre efficiency factor, b, as
the efficiency of bridging, in terms of the amount of fibres bridging a crack, with
respect to orientation effects; see e.g. Li and Stang (2001). In the case of a one-
dimensional system (1-D) it is quite simple to determine the fibre efficiency, which is
optimal since all the fibres are oriented in the direction of the load. For this case the
fibre efficiency equals one (b.1-D = 1), whereas the embedment length varies from half
the fibre length to zero (0 < Le Lf/2); see Figure 12.
x
y
Lf
crack plane
Le z
Figure 12. Fibre orientation in 1-D, based on Li and Stang (2001).

CHALMERS, Civil and Environmental Engineering 26
The situation changes, however, once the fibre orientation becomes plane-random (2-D)
or random (3-D); see Figure 13(a) for the 2-D case and Figure 13(b) for the 3-D. The
number of fibres, Nb, bridging an arbitrary crack plane can be determined by
theoretically considering all possible fibre embedment lengths, Le, and angles, .
According to Li and Stang (2001), if the centroidal distance z and the orientation angle
are treated as random variables, Nb can be computed from the probability density
functions p(z) and p():
bf
f
bA
VN where
1
0
cos2
0
dzdzpp
fL
z
b
0 = -1
0
2-D
3-D
and 1 = /2 for both 2-D and 3-D.
The upper integration limit on z is imposed to eliminate those fibers which do not bridge
the crack. This is the case for fibres oriented at angle , and centroidal distance
z > ( Lf / 2) cos. The expression for p(z) is always 2/Lf . The expression for p() (Li et
al. 1990), however, depends on whether the fibres are dispersed in 2-D or 3-D. These
functions are tabulated in Table 7. As can be seen in Table 7, for the 2-D case the fibre
efficiency is 0.64 (2/) while for the 3-D case it is 0.5 (exactly half as many as for the 1-
D case).
However, if restrictions are imposed on the inclination angle to, e.g. due to
production techniques or by specimen boundaries, this can be incorporated by
determining a new probability density function p´() which considers the restricted
inclination angle, see Table 7.
x
y
Lf
crack plane
Le
z
f
r
2
1
z
xy
(a) (b)
Figure 13. Fibre orientation (from Li and Stang 2001): (a) in 2-D and (b) in 3-D.

CHALMERS, Civil and Environmental Engineering 27
Table 7. Bridging probability density functions and efficiency factors, from Li and
Stang (2001).
1-D 2-D 3-D
p() – 1/ sin()
b 1 2/ 1/2
p΄() – 1/(2*) sin()/(1- cos(*))
΄b – 1/* 1/2(1- cos(*))
The fibre orientation in any structural member (beam, slab, etc.) or materials test
specimen is influenced by its boundaries. Analysis has shown that the effect of
constrained orientation of fibres is manifested mainly in cases when the dimensions of
the member are less than five times the length of the fibres; see e.g. Soroushian and Lee
(1990) and Kooiman (2000). When the dimensions of the member are greater, the effect
of constraint is considerably reduced and the orientation of the fibres approaches those
of body-random. To consider this, an average fibre efficiency factor, b, can
theoretically be determined by taking into account the dimensions of the member, the
length of the fibre, and the wall effects in cases of 2-D fibre orientation. Such
theoretical approaches have been suggested by Rao (1979), Soroushian and Lee (1990),
Kooiman (2000), and Dupont and Vandewalle (2005). In Figure 14 it can be seen how
the average fibre efficiency factor depends on the beam and fibre geometry. For a
relatively short fibre Figure 14(a), the average fibre efficiency factor will approach the
2-D factor only for very small members, while for a long fibre Figure 14(b) it can
exceed the 2-D factor for small members. Moreover, it can be observed that even for
quite large members the average fibre efficiency is higher than the 3-D factor of 0.5.
0.5
0.6
0.7
0.8
0 200 400 600 800
Height of section, h , [mm]
l f = 35 mm
75
b =
b.2D = 0.64
Av
era
ge f
ibre
eff
icie
ncy
facto
r [-
]
2000
125
250
500
0.5
0.6
0.7
0.8
0 200 400 600 800
Height of section, h , [mm]
l f = 65 mm
75
b =
b.2D = 0.64
Av
era
ge f
ibre
eff
icie
ncy
facto
r [-
]
2000
125
250
500
(a) (b)
Figure 14. Average fibre efficiency factor, B, as a function of beam geometry
(height, h, and width, b): (a) for a fibre length of 35 mm; and (b) for a
fibre length of 65 mm.
CHALMERS, Civil and Environmental Engineering 28
3.4 Mechanics of crack formation and propagation
Concrete usually exhibits a large number of microcracks, especially at the interface
between coarser aggregates and mortar, even before subjection to any load. These
microcracks influence the mechanical behaviour of concrete, and their propagation
during loading contributes to the non-linear behaviour at low stress levels and causes
volume expansion near failure. Many of these microcracks are caused by segregation,
shrinkage or thermal expansion of the mortar. Additionally, microcracks develop during
loading because of the difference in stiffness between aggregates and mortar, and since
the aggregate-mortar interface usually constitutes the weakest link in the composite
system. Furthermore, the presence of flaws and microcracks and the coalescence of
these when loaded is the primary reason for the low tensile strength of concrete.
Generally, cement-based materials have a relatively low tensile strength but more
importantly a low tensile strain capacity, which leads to brittle behaviour and the fact
that cracks are almost inevitable in any concrete structure.
It is now generally accepted that the primary effect of fibres is that they improve the
post-cracking behaviour and the toughness – i.e. the capacity of transferring stresses
after matrix cracking and the tensile strains at rupture – rather than the tensile strength;
see e.g. Shah (1991), Mindess (1995) and Li and Maalej (1996b). In some of the early
work on fibre-reinforced concrete, see Romualdi and Batson (1963), it was thought that
the tensile strength could be increased due to an assumption that fibres delay the
widening of microcracks (initiated at flaws) – and that the closer the fibres were spaced,
the more resistance to cracking. This concept was adapted from the model for fracture
mechanics of materials with points of discontinuity developed by Griffith (1920). But as
the fibres that were used in the study were large compared to the flaw size and the
amount of fibres that could be mixed without problems was rather limited (up to 3.0
volume percent), this mechanism is not likely to have contributed to the strength of the
material. Rather, as Romualdi and Batson (1963) and Romualdi and Mandel (1964)
used indirect test methods (i.e. splitting test and flexural tests) to determine the tensile
strength, it is more likely that the interpreted increase in tensile strength was an effect of
the increased toughness after matrix cracking resulting in a higher peak load (often
interpreted as the modulus of rupture). On the other hand, more recent investigations on
the mechanics of microfibres have shown that these actually can delay the widening of
microcracks (as postulated by Romualdi and Batson); see for example Betterman et al.
(1995), Nelson et al. (2002), and Lawler et al. (2003).
Compared to other composite materials (e.g. fibre-reinforced polymers), fibre-
reinforced cement-based composites are different. An obvious difference is that the
reinforcing effect primarily occurs after the brittle matrix has cracked, either at the
microscopic level or with visible cracks through the composites. in addition, a fibre-
reinforced concrete contains both aggregates and fibres and is thus a combination of a
particulate- and fibre-reinforced composite. However, probably the most important
difference is the unique character of the cement-based matrix, whose structure involves
a wide range of particle sizes and void spaces, and this will briefly be discussed in the
following section.

CHALMERS, Civil and Environmental Engineering 29
3.4.1 Microstructure and microstructural development
Concrete is a heterogeneous, composite, material made from hydraulic cement,
aggregates, and water; see Figure 15. In concrete, it is the hardened cement paste that
binds the different components together. Cement paste, in itself, is a very brittle material
with a tensile strength on the order of 2.0 to 9.0 MPa, a compressive strength of 20 to
150 MPa, a modulus of elasticity of 10 to 20 GPa, and a fracture energy of 10 Nm/m2.
Modern concretes also contain many different additives and admixtures (see Figure 15)
to improve the workability, compressive strength, etc. The bulk volume of the concrete
is occupied by aggregate (which roughly occupies 75% of the total volume) whose solid
particles may range in size from 0.1 m to 30 mm; the diameter of fibres typically
ranges from 1 m to 1 mm with lengths from about 1 mm up to 100 mm. The
nanometre and micrometer structure of hardened cement paste (e.g. porosity) is highly
dependent on the water/cement ratio, the composition of the original grains, the
temperature of hydration, the presence of chemical admixtures at the time of hydration,
the degree of hydration, etc. Furthermore, concrete is full of flaws, such as pores, air
voids, lenses of bleed water under coarse aggregates, and microcracks caused by
shrinkage and thermal strains which have been restrained by coarse aggregates and
boundary conditions. From a mechanical point of view, concrete is often viewed as a
three-phase composite material consisting of the aggregate, the hardened cement paste
(the matrix), and the interface between these two phases (the interfacial transition zone,
ITZ). The major parameters influencing the properties of the hardened concrete are:
the properties of the hydrated cement paste (the matrix), e.g. porosity and
microcracks;
the properties of the aggregates; and
the bond/interface between hydrated cement paste and aggregates.
CONCRETE-LIKE COMPOSITES or CEMENTITIOUS COMPOSITES
INCLUSIONS DISCONTINUOUS PHASE CONTINUOUS PHASE-MATRIX
GRAINS (fillers)
BINDERS PORES AGGREGATES PORES REINFORCEMENTS
Cements Polymers Bitumens Gypsums
Sands Fly Ash Silica
Grounded lime stone
Artificial
Natural Artificial
Natural Artificial
Lightweight
Natural Artificial
Discontinuous fibres - micro fibres - macro fibres
Continuous fibres Mats & fabrics
Water & Admixtures
Figure 15. Constituents for concrete-like composites, based on Brandt (1995).
The strength of cement-based materials is related to the development of the
microstructure, the hydration of the cement grains, and pozzolanic reactions. Hydration
is the process by which Portland cement becomes a firm, hardened mass after the
addition of water, and which is responsible for the microstructural development. The
cement hydration process is a complex sequence of overlapping chemical reactions
between clinker components, calcium sulphate, and water, leading to setting and
hardening. Immediately after mixing cement and water, reactions start to occur and
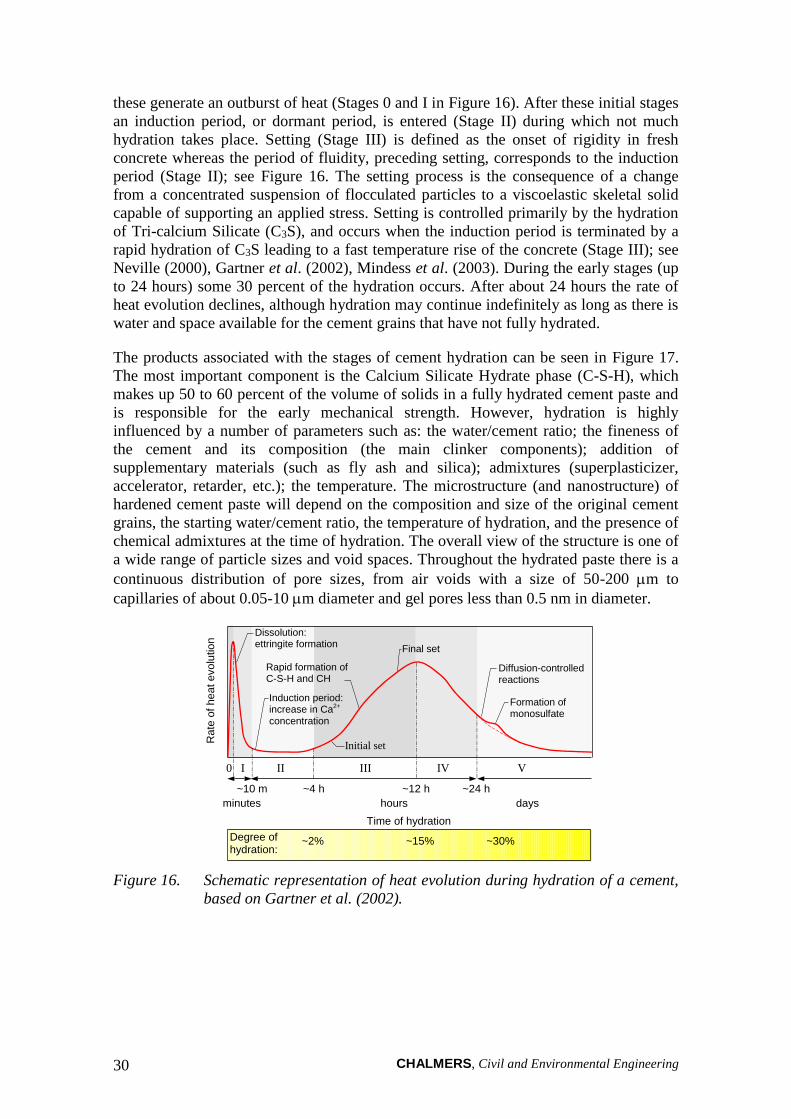
CHALMERS, Civil and Environmental Engineering 30
these generate an outburst of heat (Stages 0 and I in Figure 16). After these initial stages
an induction period, or dormant period, is entered (Stage II) during which not much
hydration takes place. Setting (Stage III) is defined as the onset of rigidity in fresh
concrete whereas the period of fluidity, preceding setting, corresponds to the induction
period (Stage II); see Figure 16. The setting process is the consequence of a change
from a concentrated suspension of flocculated particles to a viscoelastic skeletal solid
capable of supporting an applied stress. Setting is controlled primarily by the hydration
of Tri-calcium Silicate (C3S), and occurs when the induction period is terminated by a
rapid hydration of C3S leading to a fast temperature rise of the concrete (Stage III); see
Neville (2000), Gartner et al. (2002), Mindess et al. (2003). During the early stages (up
to 24 hours) some 30 percent of the hydration occurs. After about 24 hours the rate of
heat evolution declines, although hydration may continue indefinitely as long as there is
water and space available for the cement grains that have not fully hydrated.
The products associated with the stages of cement hydration can be seen in Figure 17.
The most important component is the Calcium Silicate Hydrate phase (C-S-H), which
makes up 50 to 60 percent of the volume of solids in a fully hydrated cement paste and
is responsible for the early mechanical strength. However, hydration is highly
influenced by a number of parameters such as: the water/cement ratio; the fineness of
the cement and its composition (the main clinker components); addition of
supplementary materials (such as fly ash and silica); admixtures (superplasticizer,
accelerator, retarder, etc.); the temperature. The microstructure (and nanostructure) of
hardened cement paste will depend on the composition and size of the original cement
grains, the starting water/cement ratio, the temperature of hydration, and the presence of
chemical admixtures at the time of hydration. The overall view of the structure is one of
a wide range of particle sizes and void spaces. Throughout the hydrated paste there is a
continuous distribution of pore sizes, from air voids with a size of 50-200 m to
capillaries of about 0.05-10 m diameter and gel pores less than 0.5 nm in diameter.
Time of hydration
Degree of hydration:
~2% ~15% ~30%
minutes hours days
0 I II III IV V
~4 h ~12 h ~24 h ~10 m
Rate
of he
at e
volu
tio
n Dissolution:
ettringite formation
Initial set
Final set
Induction period: increase in Ca2+ concentration
Rapid formation of C-S-H and CH
Formation of monosulfate
Diffusion-controlled reactions
Figure 16. Schematic representation of heat evolution during hydration of a cement,
based on Gartner et al. (2002).
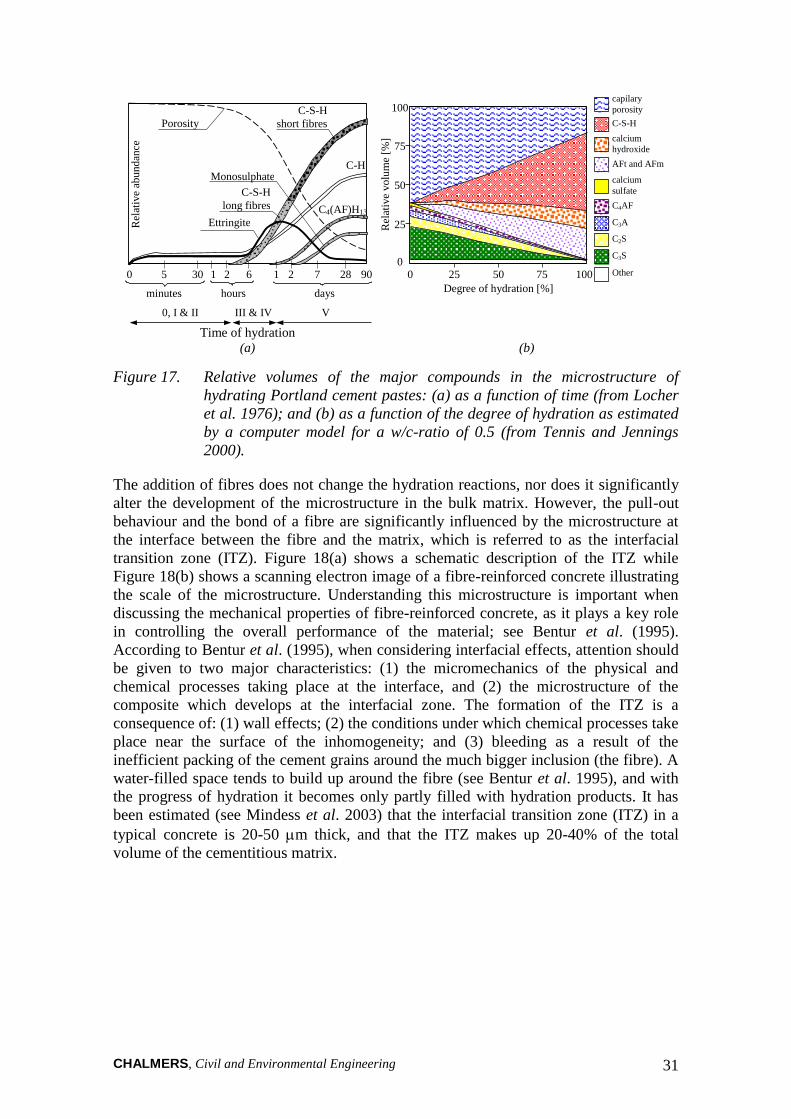
CHALMERS, Civil and Environmental Engineering 31
0 5 30 1 2 6 1 2 7 28 90
minutes hours days
Porosity
C-S-H
short fibres
C-H
C4(AF)H13
Monosulphate
Ettringite
C-S-H
long fibres
Time of hydration
V III & IV 0, I & II
0 25 50 75 100
Degree of hydration [%]
0
25
50
75
100
Rel
ativ
e v
olu
me
[%]
capilary
porosity
C-S-H
calcium
hydroxide
AFt and AFm
calcium
sulfate
C4AF
C3A
C2S
C3S
Other
(a) (b)
Rel
ativ
e ab
und
ance
Figure 17. Relative volumes of the major compounds in the microstructure of
hydrating Portland cement pastes: (a) as a function of time (from Locher
et al. 1976); and (b) as a function of the degree of hydration as estimated
by a computer model for a w/c-ratio of 0.5 (from Tennis and Jennings
2000).
The addition of fibres does not change the hydration reactions, nor does it significantly
alter the development of the microstructure in the bulk matrix. However, the pull-out
behaviour and the bond of a fibre are significantly influenced by the microstructure at
the interface between the fibre and the matrix, which is referred to as the interfacial
transition zone (ITZ). Figure 18(a) shows a schematic description of the ITZ while
Figure 18(b) shows a scanning electron image of a fibre-reinforced concrete illustrating
the scale of the microstructure. Understanding this microstructure is important when
discussing the mechanical properties of fibre-reinforced concrete, as it plays a key role
in controlling the overall performance of the material; see Bentur et al. (1995).
According to Bentur et al. (1995), when considering interfacial effects, attention should
be given to two major characteristics: (1) the micromechanics of the physical and
chemical processes taking place at the interface, and (2) the microstructure of the
composite which develops at the interfacial zone. The formation of the ITZ is a
consequence of: (1) wall effects; (2) the conditions under which chemical processes take
place near the surface of the inhomogeneity; and (3) bleeding as a result of the
inefficient packing of the cement grains around the much bigger inclusion (the fibre). A
water-filled space tends to build up around the fibre (see Bentur et al. 1995), and with
the progress of hydration it becomes only partly filled with hydration products. It has
been estimated (see Mindess et al. 2003) that the interfacial transition zone (ITZ) in a
typical concrete is 20-50 m thick, and that the ITZ makes up 20-40% of the total
volume of the cementitious matrix.
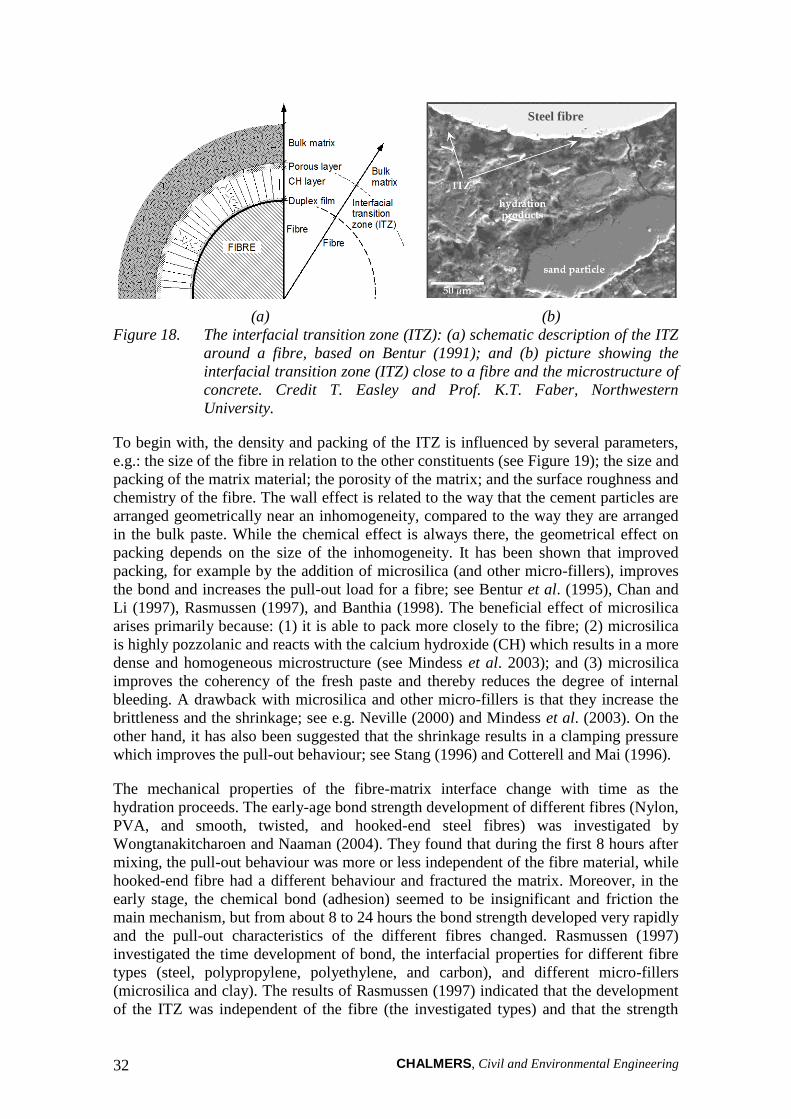
CHALMERS, Civil and Environmental Engineering 32
Steel fibre
(a) (b)
Figure 18. The interfacial transition zone (ITZ): (a) schematic description of the ITZ
around a fibre, based on Bentur (1991); and (b) picture showing the
interfacial transition zone (ITZ) close to a fibre and the microstructure of
concrete. Credit T. Easley and Prof. K.T. Faber, Northwestern
University.
To begin with, the density and packing of the ITZ is influenced by several parameters,
e.g.: the size of the fibre in relation to the other constituents (see Figure 19); the size and
packing of the matrix material; the porosity of the matrix; and the surface roughness and
chemistry of the fibre. The wall effect is related to the way that the cement particles are
arranged geometrically near an inhomogeneity, compared to the way they are arranged
in the bulk paste. While the chemical effect is always there, the geometrical effect on
packing depends on the size of the inhomogeneity. It has been shown that improved
packing, for example by the addition of microsilica (and other micro-fillers), improves
the bond and increases the pull-out load for a fibre; see Bentur et al. (1995), Chan and
Li (1997), Rasmussen (1997), and Banthia (1998). The beneficial effect of microsilica
arises primarily because: (1) it is able to pack more closely to the fibre; (2) microsilica
is highly pozzolanic and reacts with the calcium hydroxide (CH) which results in a more
dense and homogeneous microstructure (see Mindess et al. 2003); and (3) microsilica
improves the coherency of the fresh paste and thereby reduces the degree of internal
bleeding. A drawback with microsilica and other micro-fillers is that they increase the
brittleness and the shrinkage; see e.g. Neville (2000) and Mindess et al. (2003). On the
other hand, it has also been suggested that the shrinkage results in a clamping pressure
which improves the pull-out behaviour; see Stang (1996) and Cotterell and Mai (1996).
The mechanical properties of the fibre-matrix interface change with time as the
hydration proceeds. The early-age bond strength development of different fibres (Nylon,
PVA, and smooth, twisted, and hooked-end steel fibres) was investigated by
Wongtanakitcharoen and Naaman (2004). They found that during the first 8 hours after
mixing, the pull-out behaviour was more or less independent of the fibre material, while
hooked-end fibre had a different behaviour and fractured the matrix. Moreover, in the
early stage, the chemical bond (adhesion) seemed to be insignificant and friction the
main mechanism, but from about 8 to 24 hours the bond strength developed very rapidly
and the pull-out characteristics of the different fibres changed. Rasmussen (1997)
investigated the time development of bond, the interfacial properties for different fibre
types (steel, polypropylene, polyethylene, and carbon), and different micro-fillers
(microsilica and clay). The results of Rasmussen (1997) indicated that the development
of the ITZ was independent of the fibre (the investigated types) and that the strength
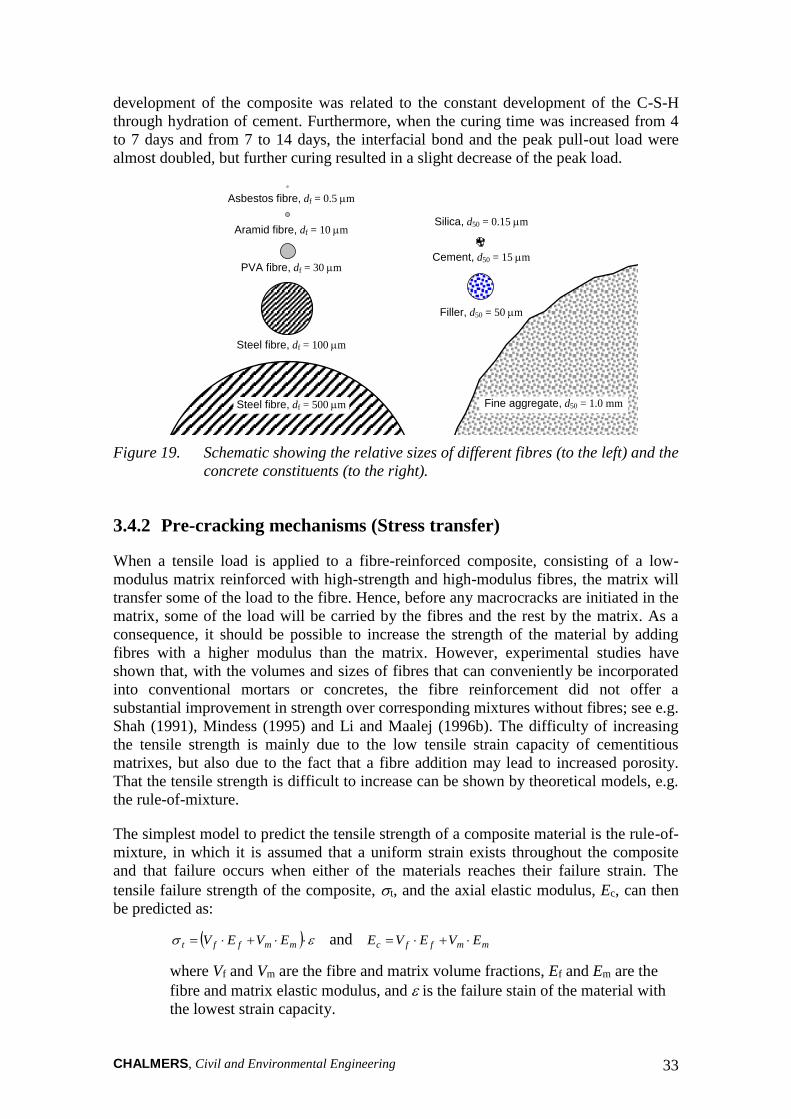
CHALMERS, Civil and Environmental Engineering 33
development of the composite was related to the constant development of the C-S-H
through hydration of cement. Furthermore, when the curing time was increased from 4
to 7 days and from 7 to 14 days, the interfacial bond and the peak pull-out load were
almost doubled, but further curing resulted in a slight decrease of the peak load.
Steel fibre, df = 500 m
Steel fibre, df = 100 m
PVA fibre, df = 30 m
Aramid fibre, df = 10 m
Asbestos fibre, df = 0.5 m
Silica, d50 = 0.15 m
Cement, d50 = 15 m
Filler, d50 = 50 m
Fine aggregate, d50 = 1.0 mm
Figure 19. Schematic showing the relative sizes of different fibres (to the left) and the
concrete constituents (to the right).
3.4.2 Pre-cracking mechanisms (Stress transfer)
When a tensile load is applied to a fibre-reinforced composite, consisting of a low-
modulus matrix reinforced with high-strength and high-modulus fibres, the matrix will
transfer some of the load to the fibre. Hence, before any macrocracks are initiated in the
matrix, some of the load will be carried by the fibres and the rest by the matrix. As a
consequence, it should be possible to increase the strength of the material by adding
fibres with a higher modulus than the matrix. However, experimental studies have
shown that, with the volumes and sizes of fibres that can conveniently be incorporated
into conventional mortars or concretes, the fibre reinforcement did not offer a
substantial improvement in strength over corresponding mixtures without fibres; see e.g.
Shah (1991), Mindess (1995) and Li and Maalej (1996b). The difficulty of increasing
the tensile strength is mainly due to the low tensile strain capacity of cementitious
matrixes, but also due to the fact that a fibre addition may lead to increased porosity.
That the tensile strength is difficult to increase can be shown by theoretical models, e.g.
the rule-of-mixture.
The simplest model to predict the tensile strength of a composite material is the rule-of-
mixture, in which it is assumed that a uniform strain exists throughout the composite
and that failure occurs when either of the materials reaches their failure strain. The
tensile failure strength of the composite, t, and the axial elastic modulus, Ec, can then
be predicted as:
mmfft EVEV and mmffc EVEVE
where Vf and Vm are the fibre and matrix volume fractions, Ef and Em are the
fibre and matrix elastic modulus, and is the failure stain of the material with
the lowest strain capacity.

CHALMERS, Civil and Environmental Engineering 34
However, the rule-of-mixture is a simplification and idealisation, and such aspects as
the strength of interface between the fibre and the matrix or the case of a random 3D-
orientation of fibres are not considered. On the other hand, these effects can be taken
into account by modifying the relationship and introducing factors that have to be
theoretically derived or experimentally determined; see e.g. Bentur and Mindess (1995),
Balaguru and Shah (1992), Maidl (1995). This results in the following approximate
relationship for the tensile failure strength of the composite:
ff
f
avlmmft Vd
LV
where mf is the matrix failure strength; is a fibre orientation efficiency
factor; l is a fibre length influence coefficient; av is the average bond
strength; and Lf/df is the fibre aspect ratio.
It should be noted that the fibre orientation efficiency factor is not the same before
matrix cracking as after the matrix has cracked. For determining the elastic properties
(i.e. before matrix cracking) when the composite is subjected to deformation only in the
direction of the applied stress, efficiency factors are according to Cox (1952) for
random 2-D 2-D = 1/3 and for random 3-D 3-D = 1/6. Krenchel (1964) considered the
case when deformations occurs in other directions as well and determined the following
efficiency factors: for random 2-D, 2-D = 3/8 and for random 3-D, 3-D = 1/5. After
matrix cracking, the factor depends upon the number of fibres per unit area; see
Krenchel (1964) and Cotterell and Mai (1995).
The stress transfer from the matrix to the fibre (see Figure 20) can be described by the
shear-lag theory, originally introduced by Cox (1952). The shear-lag model can also be
used to describe the load transferred from fibre to matrix, as the case when the matrix
has cracked.
Uniform stress
Deformation of matrix
Tensile stress in fibre Shear stress at interface
Matrix
Fibre
x
Em , m
Ef , rf , Lf
Figure 20. The stress build-up in a fibre and the interface for the shear-lag theory.
The shear lag model is perhaps one of the simplest models which takes into account the
geometry of the phases as well as their volume fraction, having originally been
developed for describing fibrous paper (Cox, 1952). The composite is viewed as
comprising of long, but not continuous, fibres within a matrix. It assumes that the load
is transferred from the matrix to the fibres by the generation of shear stresses at the fibre
matrix interface, and given equilibrium conditions between the fibre stress, f, and the
interfacial shear stress, i.
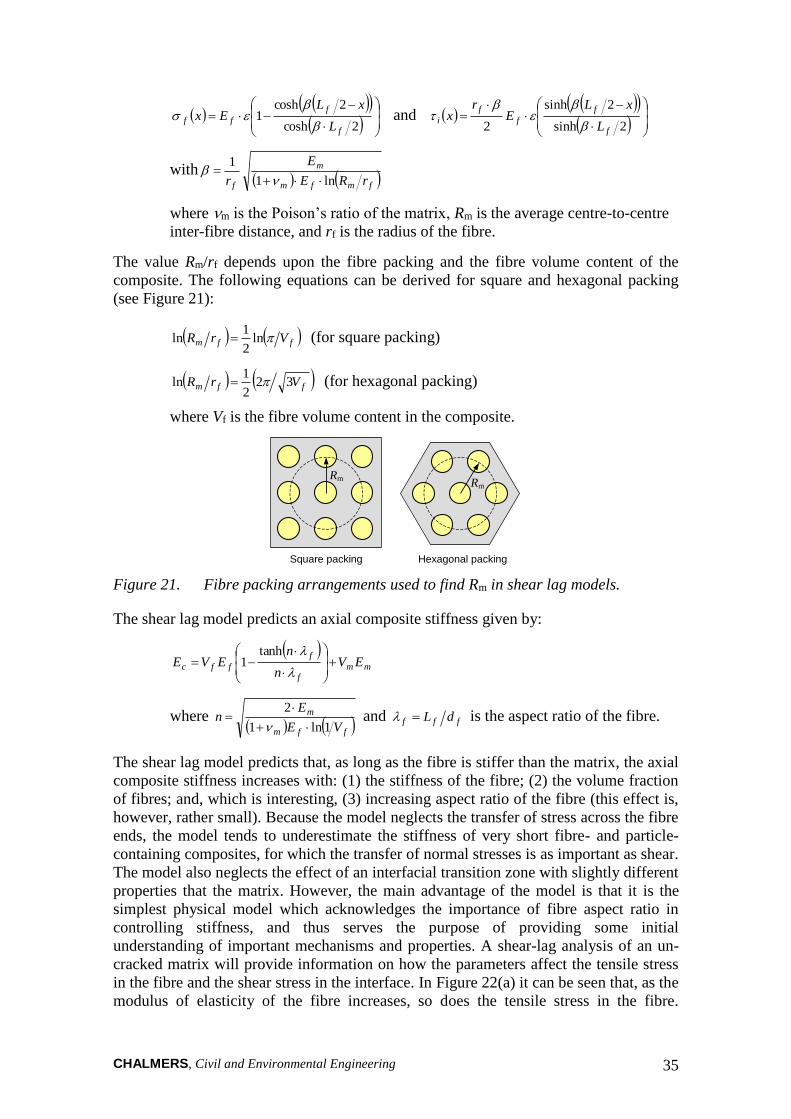
CHALMERS, Civil and Environmental Engineering 35
2cosh
2cosh1
f
f
ffL
xLEx
and
2sinh
2sinh
2 f
f
f
f
iL
xLE
rx
with fmfm
m
f rRE
E
r ln1
1
where m is the Poison’s ratio of the matrix, Rm is the average centre-to-centre
inter-fibre distance, and rf is the radius of the fibre.
The value Rm/rf depends upon the fibre packing and the fibre volume content of the
composite. The following equations can be derived for square and hexagonal packing
(see Figure 21):
ffm VrR ln2
1ln (for square packing)
ffm VrR 322
1ln (for hexagonal packing)
where Vf is the fibre volume content in the composite.
Rm Rm
Square packing Hexagonal packing
Figure 21. Fibre packing arrangements used to find Rm in shear lag models.
The shear lag model predicts an axial composite stiffness given by:
mm
f
f
ffc EVn
nEVE
tanh1
where ffm
m
VE
En
1ln1
2
and fff dL is the aspect ratio of the fibre.
The shear lag model predicts that, as long as the fibre is stiffer than the matrix, the axial
composite stiffness increases with: (1) the stiffness of the fibre; (2) the volume fraction
of fibres; and, which is interesting, (3) increasing aspect ratio of the fibre (this effect is,
however, rather small). Because the model neglects the transfer of stress across the fibre
ends, the model tends to underestimate the stiffness of very short fibre- and particle-
containing composites, for which the transfer of normal stresses is as important as shear.
The model also neglects the effect of an interfacial transition zone with slightly different
properties that the matrix. However, the main advantage of the model is that it is the
simplest physical model which acknowledges the importance of fibre aspect ratio in
controlling stiffness, and thus serves the purpose of providing some initial
understanding of important mechanisms and properties. A shear-lag analysis of an un-
cracked matrix will provide information on how the parameters affect the tensile stress
in the fibre and the shear stress in the interface. In Figure 22(a) it can be seen that, as the
modulus of elasticity of the fibre increases, so does the tensile stress in the fibre.
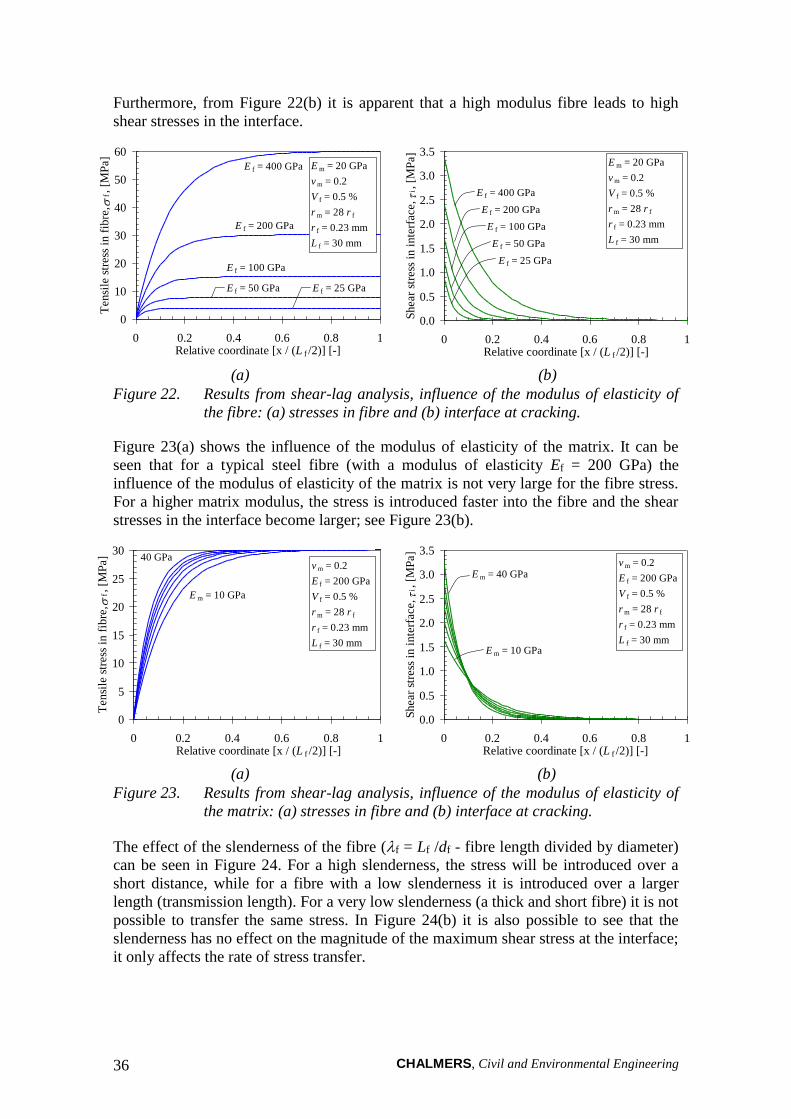
CHALMERS, Civil and Environmental Engineering 36
Furthermore, from Figure 22(b) it is apparent that a high modulus fibre leads to high
shear stresses in the interface.
0
10
20
30
40
50
60
0 0.2 0.4 0.6 0.8 1Relative coordinate [x / (L f /2)] [-]
Tensi
le s
tress
in f
ibre
, f , [M
Pa]
E f = 400 GPa
E f = 200 GPa
E f = 100 GPa
E f = 50 GPa E f = 25 GPa
E m = 20 GPa
v m = 0.2
V f = 0.5 %
r m = 28 r f
r f = 0.23 mm
L f = 30 mm
0.0
0.5
1.0
1.5
2.0
2.5
3.0
3.5
0 0.2 0.4 0.6 0.8 1Relative coordinate [x / (L f /2)] [-]
Sh
ear
stre
ss i
n i
nte
rface,
i , [
MP
a]
E f = 400 GPa
E f = 200 GPa
E f = 100 GPa
E f = 50 GPa
E f = 25 GPa
E m = 20 GPa
v m = 0.2
V f = 0.5 %
r m = 28 r f
r f = 0.23 mm
L f = 30 mm
(a) (b)
Figure 22. Results from shear-lag analysis, influence of the modulus of elasticity of
the fibre: (a) stresses in fibre and (b) interface at cracking.
Figure 23(a) shows the influence of the modulus of elasticity of the matrix. It can be
seen that for a typical steel fibre (with a modulus of elasticity Ef = 200 GPa) the
influence of the modulus of elasticity of the matrix is not very large for the fibre stress.
For a higher matrix modulus, the stress is introduced faster into the fibre and the shear
stresses in the interface become larger; see Figure 23(b).
0
5
10
15
20
25
30
0 0.2 0.4 0.6 0.8 1Relative coordinate [x / (L f /2)] [-]
Ten
sile
str
ess
in
fib
re,
f ,
[MP
a] 40 GPa
E m = 10 GPa
v m = 0.2
E f = 200 GPa
V f = 0.5 %
r m = 28 r f
r f = 0.23 mm
L f = 30 mm
0.0
0.5
1.0
1.5
2.0
2.5
3.0
3.5
0 0.2 0.4 0.6 0.8 1Relative coordinate [x / (L f /2)] [-]
Sh
ear
stre
ss i
n i
nte
rface,
i , [
MP
a]
E m = 40 GPa
E m = 10 GPa
v m = 0.2
E f = 200 GPa
V f = 0.5 %
r m = 28 r f
r f = 0.23 mm
L f = 30 mm
(a) (b)
Figure 23. Results from shear-lag analysis, influence of the modulus of elasticity of
the matrix: (a) stresses in fibre and (b) interface at cracking.
The effect of the slenderness of the fibre (f = Lf /df - fibre length divided by diameter)
can be seen in Figure 24. For a high slenderness, the stress will be introduced over a
short distance, while for a fibre with a low slenderness it is introduced over a larger
length (transmission length). For a very low slenderness (a thick and short fibre) it is not
possible to transfer the same stress. In Figure 24(b) it is also possible to see that the
slenderness has no effect on the magnitude of the maximum shear stress at the interface;
it only affects the rate of stress transfer.

CHALMERS, Civil and Environmental Engineering 37
0
5
10
15
20
25
30
0 0.2 0.4 0.6 0.8 1Relative coordinate [x / (L f /2)] [-]
Tensi
le s
tress
in f
ibre
, f , [M
Pa]
f = L f / d f = 25
E m = 20 GPa
v m = 0.2
E f = 200 GPa
V f = 0.5 %
r m = 28 r f
L f = 30 mm
150
50
0.0
0.5
1.0
1.5
2.0
2.5
0 0.2 0.4 0.6 0.8 1Relative coordinate [x / (L f /2)] [-]
Sh
ear
stre
ss i
n i
nte
rface,
i , [
MP
a]
f = L f /d f = 25
E m = 20 GPa
v m = 0.2
V f = 0.5 %
E f = 200 GPa
r m = 28 r f
L f = 30 mm
50
150
(a) (b)
Figure 24. Results from shear-lag analysis, influence of the slenderness of the fibre
(the fibre diameter): (a) stresses in fibre and (b) interface at cracking.
3.4.3 Post-cracking mechanisms (crack bridging)
For most FRCs, the major reinforcing effect of fibres comes about first after matrix
cracking. Examination of fractured steel fibre-reinforced concrete specimens (see Figure
25) shows that failure takes place primarily due to fibre pull-out and that, for fibres with
deformed ends (e.g. end-hooks), a considerable energy dissipation takes place as the
fibre is straightened and plastically deformed; see Figure 25(c).
(a) (b) (c)
Figure 25. Fractured specimens with fibres protruding: (a) uni-axial tension
specimen; (b) beam specimen; and (c) close-up of an end-hooked fibre
that has been straightened during pull-out.
Thus, unlike plain concrete, a FRC specimen does not break in such a brittle manner
after initiation of the first crack. This has the effect of increasing the work of fracture,
which is referred to as toughness or fracture energy and is represented by the area under
the stress-crack opening curve (see Figure 26). Also the tensile deformation capacity is
significantly improved as the critical crack opening – the crack opening when no stress
is transferred – is increased from approximately 0.3 mm to half the fibre length (which
for steel fibres usually means 10 to 30 mm); see Figure 26. In addition to the fibres, the
matrix cracking contributes to the energy dissipation by aggregate bridging (see Figure
26), which results in a bridging traction that decays towards zero for a crack opening of
0.3 mm. Although, the fibre bridging is predominant when it comes to energy
dissipation and bridging traction.
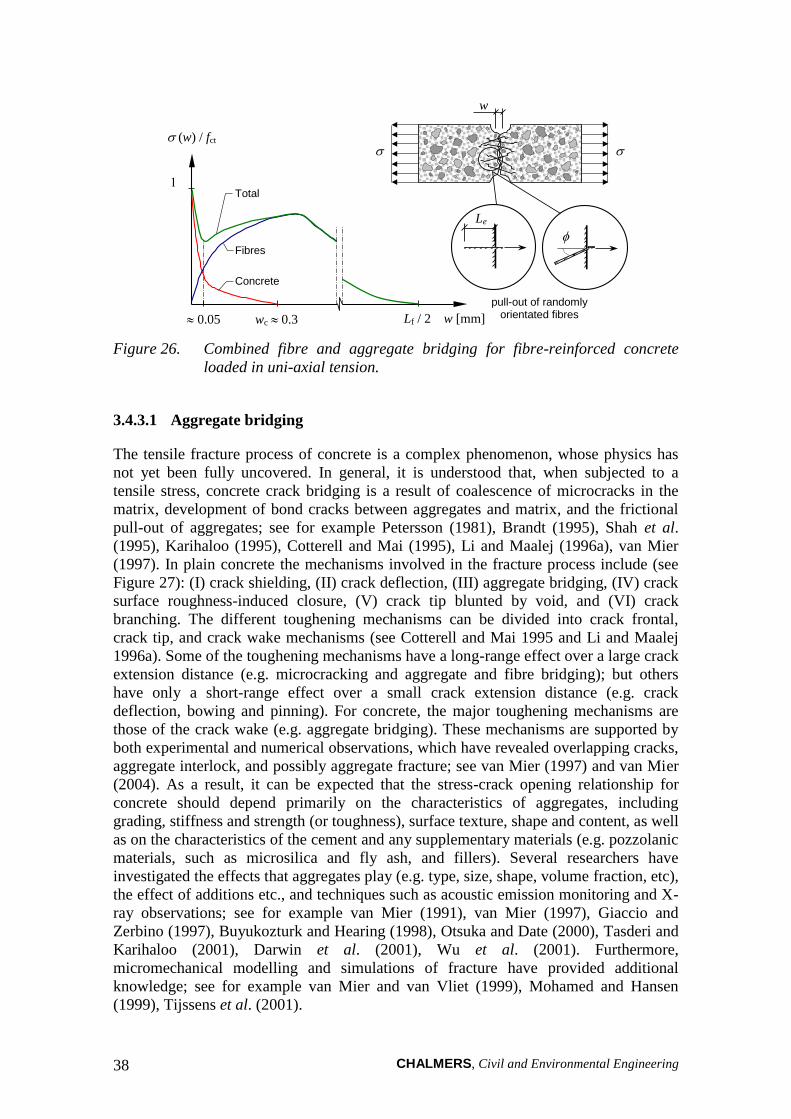
CHALMERS, Civil and Environmental Engineering 38
wc 0.3 w [mm]
(w) / fct
Concrete
Fibres
Total
w
Le
pull-out of randomly orientated fibres
Lf / 2 0.05
Figure 26. Combined fibre and aggregate bridging for fibre-reinforced concrete
loaded in uni-axial tension.
3.4.3.1 Aggregate bridging
The tensile fracture process of concrete is a complex phenomenon, whose physics has
not yet been fully uncovered. In general, it is understood that, when subjected to a
tensile stress, concrete crack bridging is a result of coalescence of microcracks in the
matrix, development of bond cracks between aggregates and matrix, and the frictional
pull-out of aggregates; see for example Petersson (1981), Brandt (1995), Shah et al.
(1995), Karihaloo (1995), Cotterell and Mai (1995), Li and Maalej (1996a), van Mier
(1997). In plain concrete the mechanisms involved in the fracture process include (see
Figure 27): (I) crack shielding, (II) crack deflection, (III) aggregate bridging, (IV) crack
surface roughness-induced closure, (V) crack tip blunted by void, and (VI) crack
branching. The different toughening mechanisms can be divided into crack frontal,
crack tip, and crack wake mechanisms (see Cotterell and Mai 1995 and Li and Maalej
1996a). Some of the toughening mechanisms have a long-range effect over a large crack
extension distance (e.g. microcracking and aggregate and fibre bridging); but others
have only a short-range effect over a small crack extension distance (e.g. crack
deflection, bowing and pinning). For concrete, the major toughening mechanisms are
those of the crack wake (e.g. aggregate bridging). These mechanisms are supported by
both experimental and numerical observations, which have revealed overlapping cracks,
aggregate interlock, and possibly aggregate fracture; see van Mier (1997) and van Mier
(2004). As a result, it can be expected that the stress-crack opening relationship for
concrete should depend primarily on the characteristics of aggregates, including
grading, stiffness and strength (or toughness), surface texture, shape and content, as well
as on the characteristics of the cement and any supplementary materials (e.g. pozzolanic
materials, such as microsilica and fly ash, and fillers). Several researchers have
investigated the effects that aggregates play (e.g. type, size, shape, volume fraction, etc),
the effect of additions etc., and techniques such as acoustic emission monitoring and X-
ray observations; see for example van Mier (1991), van Mier (1997), Giaccio and
Zerbino (1997), Buyukozturk and Hearing (1998), Otsuka and Date (2000), Tasderi and
Karihaloo (2001), Darwin et al. (2001), Wu et al. (2001). Furthermore,
micromechanical modelling and simulations of fracture have provided additional
knowledge; see for example van Mier and van Vliet (1999), Mohamed and Hansen
(1999), Tijssens et al. (2001).

CHALMERS, Civil and Environmental Engineering 39
Main crack Microcracks Main crack
Aggregate
Aggregate bridging
Main crack Void
Friction between crack faces
Secondary crack tip
Main crack tip
(I) (II)
(III) (IV)
(V) (VI)
Crack tip blunting
Figure 27. Some toughening mechanisms in plain concrete, from Shah et al. (1995).
Based on the numerous studies mentioned, it is generally acknowledged that the uni-
axial behaviour can be explained as presented in Figure 28. Pre-existing microcracks
exists within the concrete, even before any stresses have been applied, as a result of the
internal restraint caused by the aggregate and shrinkage and thermal deformations.
When a stress is applied, microcracks will start to grow, initially at the interface
between the cement paste and the aggregates (A), and eventually the microcracks
propagate into the mortar (B). Once the peak stress is reached (C), microcracks
propagate in an unstable manner and crack localisation occurs, with the result that
macro-cracks propagate through the specimen, leading to the stress-drop (D). Crack
bridging and crack branching is the principal mechanism responsible for the long
softening tail (D-E) observed in experiments. But as the fracture process to a large
extent depends on the aggregates and their bond to the matrix, it is different for high-
strength concrete and lightweight aggregate concrete. For these two types of concrete,
the aggregates may become the weak link and aggregate rupture may occur, which
reduces the bridging effect and results in a more brittle fracture process.
C
D
fct
Elongation, l
bridging and branching
macro-crack growth
micro-crack growth
A
macro-crack
w
B
traction free
micro-cracking
E D
E
C B
w
A
Bridging stress
bridging and branching
macro-crack growth
concrete fracture process zone
Figure 28. Schematic description of the fracture process in uni-axial tension and the
resulting stress-crack opening relationship.
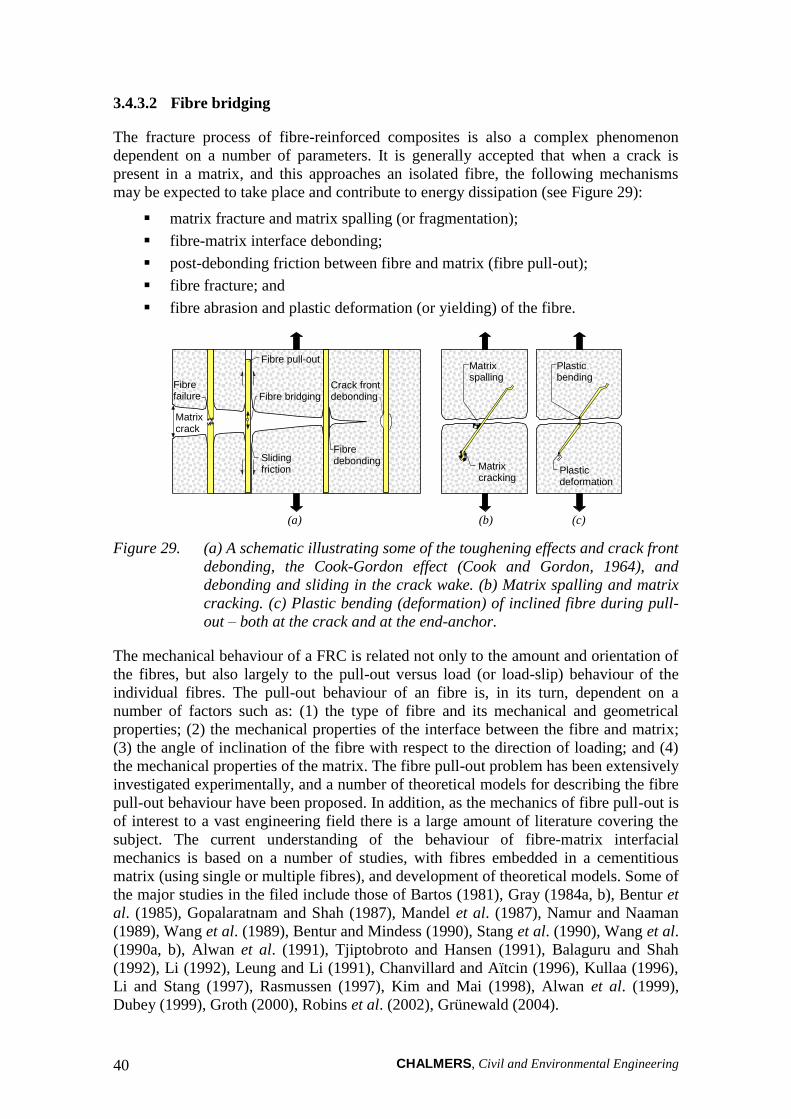
CHALMERS, Civil and Environmental Engineering 40
3.4.3.2 Fibre bridging
The fracture process of fibre-reinforced composites is also a complex phenomenon
dependent on a number of parameters. It is generally accepted that when a crack is
present in a matrix, and this approaches an isolated fibre, the following mechanisms
may be expected to take place and contribute to energy dissipation (see Figure 29):
matrix fracture and matrix spalling (or fragmentation);
fibre-matrix interface debonding;
post-debonding friction between fibre and matrix (fibre pull-out);
fibre fracture; and
fibre abrasion and plastic deformation (or yielding) of the fibre.
Matrix spalling
Matrix cracking
Plastic bending
Plastic deformation
Crack front debonding
Sliding friction
Fibre bridging
(a) (b) (c)
Fibre pull-out
Fibre debonding
Matrix crack
Fibre failure
Figure 29. (a) A schematic illustrating some of the toughening effects and crack front
debonding, the Cook-Gordon effect (Cook and Gordon, 1964), and
debonding and sliding in the crack wake. (b) Matrix spalling and matrix
cracking. (c) Plastic bending (deformation) of inclined fibre during pull-
out – both at the crack and at the end-anchor.
The mechanical behaviour of a FRC is related not only to the amount and orientation of
the fibres, but also largely to the pull-out versus load (or load-slip) behaviour of the
individual fibres. The pull-out behaviour of an fibre is, in its turn, dependent on a
number of factors such as: (1) the type of fibre and its mechanical and geometrical
properties; (2) the mechanical properties of the interface between the fibre and matrix;
(3) the angle of inclination of the fibre with respect to the direction of loading; and (4)
the mechanical properties of the matrix. The fibre pull-out problem has been extensively
investigated experimentally, and a number of theoretical models for describing the fibre
pull-out behaviour have been proposed. In addition, as the mechanics of fibre pull-out is
of interest to a vast engineering field there is a large amount of literature covering the
subject. The current understanding of the behaviour of fibre-matrix interfacial
mechanics is based on a number of studies, with fibres embedded in a cementitious
matrix (using single or multiple fibres), and development of theoretical models. Some of
the major studies in the filed include those of Bartos (1981), Gray (1984a, b), Bentur et
al. (1985), Gopalaratnam and Shah (1987), Mandel et al. (1987), Namur and Naaman
(1989), Wang et al. (1989), Bentur and Mindess (1990), Stang et al. (1990), Wang et al.
(1990a, b), Alwan et al. (1991), Tjiptobroto and Hansen (1991), Balaguru and Shah
(1992), Li (1992), Leung and Li (1991), Chanvillard and Aïtcin (1996), Kullaa (1996),
Li and Stang (1997), Rasmussen (1997), Kim and Mai (1998), Alwan et al. (1999),
Dubey (1999), Groth (2000), Robins et al. (2002), Grünewald (2004).
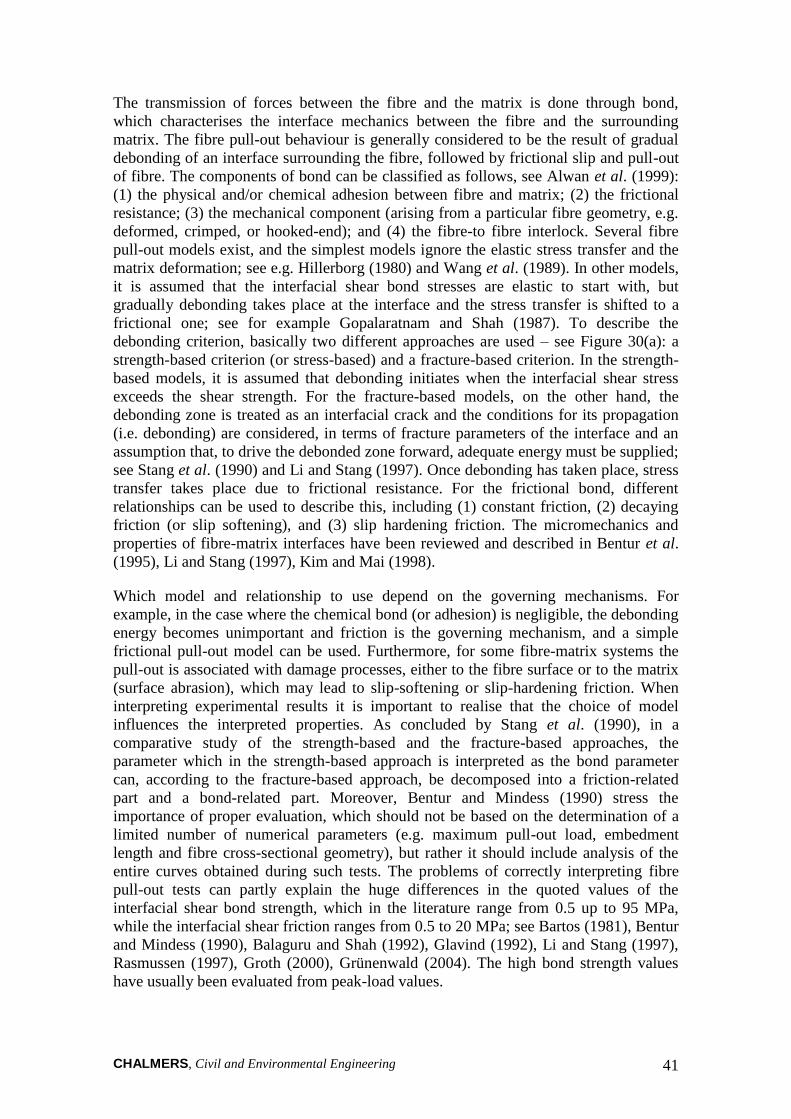
CHALMERS, Civil and Environmental Engineering 41
The transmission of forces between the fibre and the matrix is done through bond,
which characterises the interface mechanics between the fibre and the surrounding
matrix. The fibre pull-out behaviour is generally considered to be the result of gradual
debonding of an interface surrounding the fibre, followed by frictional slip and pull-out
of fibre. The components of bond can be classified as follows, see Alwan et al. (1999):
(1) the physical and/or chemical adhesion between fibre and matrix; (2) the frictional
resistance; (3) the mechanical component (arising from a particular fibre geometry, e.g.
deformed, crimped, or hooked-end); and (4) the fibre-to fibre interlock. Several fibre
pull-out models exist, and the simplest models ignore the elastic stress transfer and the
matrix deformation; see e.g. Hillerborg (1980) and Wang et al. (1989). In other models,
it is assumed that the interfacial shear bond stresses are elastic to start with, but
gradually debonding takes place at the interface and the stress transfer is shifted to a
frictional one; see for example Gopalaratnam and Shah (1987). To describe the
debonding criterion, basically two different approaches are used – see Figure 30(a): a
strength-based criterion (or stress-based) and a fracture-based criterion. In the strength-
based models, it is assumed that debonding initiates when the interfacial shear stress
exceeds the shear strength. For the fracture-based models, on the other hand, the
debonding zone is treated as an interfacial crack and the conditions for its propagation
(i.e. debonding) are considered, in terms of fracture parameters of the interface and an
assumption that, to drive the debonded zone forward, adequate energy must be supplied;
see Stang et al. (1990) and Li and Stang (1997). Once debonding has taken place, stress
transfer takes place due to frictional resistance. For the frictional bond, different
relationships can be used to describe this, including (1) constant friction, (2) decaying
friction (or slip softening), and (3) slip hardening friction. The micromechanics and
properties of fibre-matrix interfaces have been reviewed and described in Bentur et al.
(1995), Li and Stang (1997), Kim and Mai (1998).
Which model and relationship to use depend on the governing mechanisms. For
example, in the case where the chemical bond (or adhesion) is negligible, the debonding
energy becomes unimportant and friction is the governing mechanism, and a simple
frictional pull-out model can be used. Furthermore, for some fibre-matrix systems the
pull-out is associated with damage processes, either to the fibre surface or to the matrix
(surface abrasion), which may lead to slip-softening or slip-hardening friction. When
interpreting experimental results it is important to realise that the choice of model
influences the interpreted properties. As concluded by Stang et al. (1990), in a
comparative study of the strength-based and the fracture-based approaches, the
parameter which in the strength-based approach is interpreted as the bond parameter
can, according to the fracture-based approach, be decomposed into a friction-related
part and a bond-related part. Moreover, Bentur and Mindess (1990) stress the
importance of proper evaluation, which should not be based on the determination of a
limited number of numerical parameters (e.g. maximum pull-out load, embedment
length and fibre cross-sectional geometry), but rather it should include analysis of the
entire curves obtained during such tests. The problems of correctly interpreting fibre
pull-out tests can partly explain the huge differences in the quoted values of the
interfacial shear bond strength, which in the literature range from 0.5 up to 95 MPa,
while the interfacial shear friction ranges from 0.5 to 20 MPa; see Bartos (1981), Bentur
and Mindess (1990), Balaguru and Shah (1992), Glavind (1992), Li and Stang (1997),
Rasmussen (1997), Groth (2000), Grünenwald (2004). The high bond strength values
have usually been evaluated from peak-load values.
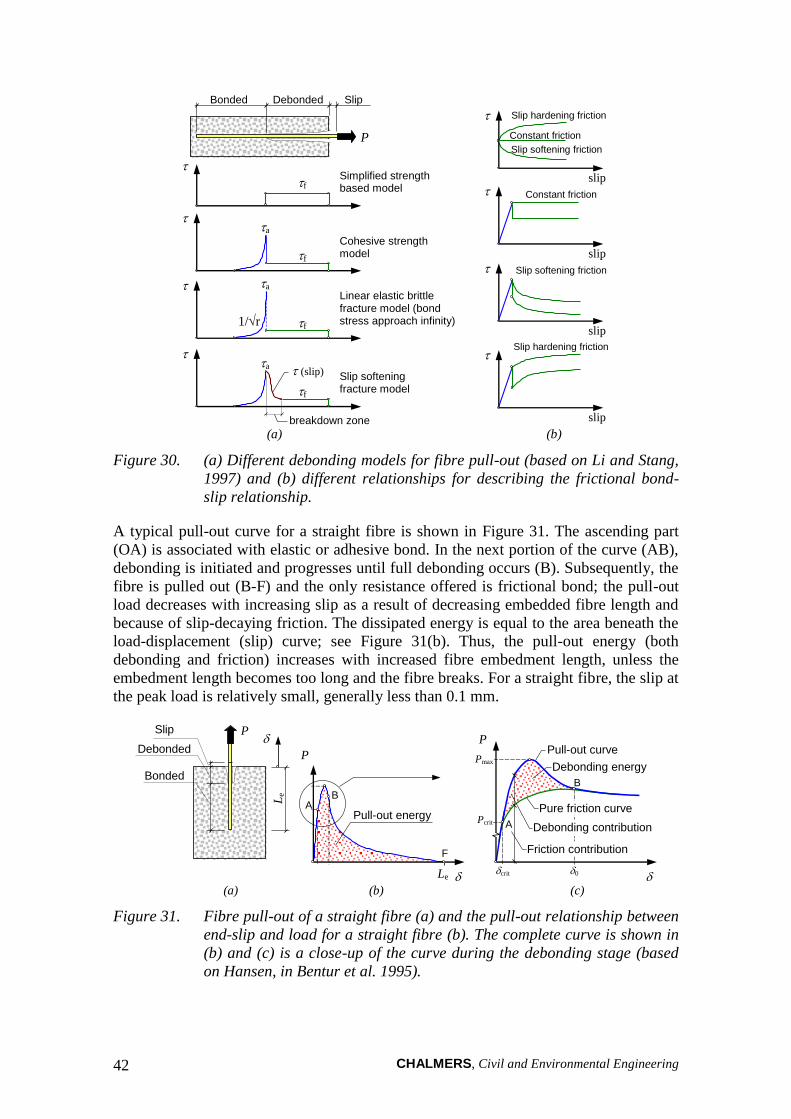
CHALMERS, Civil and Environmental Engineering 42
Slip
P
f
a Linear elastic brittle fracture model (bond stress approach infinity)
f
a Cohesive strength model
1/r
f
a Slip softening fracture model
f Simplified strength based model
breakdown zone
Bonded Debonded
(slip)
slip
slip
slip
Constant friction
(a) (b)
Slip softening friction
Slip hardening friction
slip
Constant friction
Slip softening friction
Slip hardening friction
Figure 30. (a) Different debonding models for fibre pull-out (based on Li and Stang,
1997) and (b) different relationships for describing the frictional bond-
slip relationship.
A typical pull-out curve for a straight fibre is shown in Figure 31. The ascending part
(OA) is associated with elastic or adhesive bond. In the next portion of the curve (AB),
debonding is initiated and progresses until full debonding occurs (B). Subsequently, the
fibre is pulled out (B-F) and the only resistance offered is frictional bond; the pull-out
load decreases with increasing slip as a result of decreasing embedded fibre length and
because of slip-decaying friction. The dissipated energy is equal to the area beneath the
load-displacement (slip) curve; see Figure 31(b). Thus, the pull-out energy (both
debonding and friction) increases with increased fibre embedment length, unless the
embedment length becomes too long and the fibre breaks. For a straight fibre, the slip at
the peak load is relatively small, generally less than 0.1 mm.
P Pull-out curve
Pure friction curve
Debonding energy
Friction contribution
Debonding contribution
P
Le
Bonded
Debonded
Slip
P
Le
Pull-out energy
B
B
A
A
(a) (c) (b)
F
Pcrit
Pmax
crit 0
Figure 31. Fibre pull-out of a straight fibre (a) and the pull-out relationship between
end-slip and load for a straight fibre (b). The complete curve is shown in
(b) and (c) is a close-up of the curve during the debonding stage (based
on Hansen, in Bentur et al. 1995).
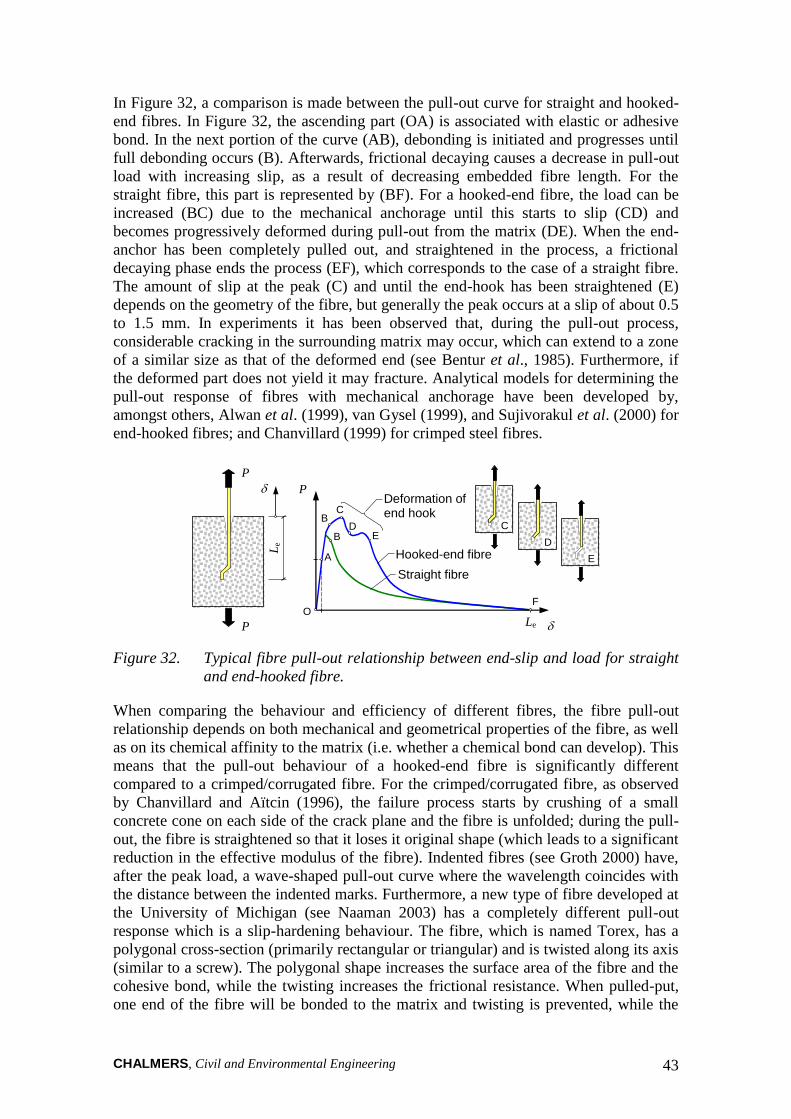
CHALMERS, Civil and Environmental Engineering 43
In Figure 32, a comparison is made between the pull-out curve for straight and hooked-
end fibres. In Figure 32, the ascending part (OA) is associated with elastic or adhesive
bond. In the next portion of the curve (AB), debonding is initiated and progresses until
full debonding occurs (B). Afterwards, frictional decaying causes a decrease in pull-out
load with increasing slip, as a result of decreasing embedded fibre length. For the
straight fibre, this part is represented by (BF). For a hooked-end fibre, the load can be
increased (BC) due to the mechanical anchorage until this starts to slip (CD) and
becomes progressively deformed during pull-out from the matrix (DE). When the end-
anchor has been completely pulled out, and straightened in the process, a frictional
decaying phase ends the process (EF), which corresponds to the case of a straight fibre.
The amount of slip at the peak (C) and until the end-hook has been straightened (E)
depends on the geometry of the fibre, but generally the peak occurs at a slip of about 0.5
to 1.5 mm. In experiments it has been observed that, during the pull-out process,
considerable cracking in the surrounding matrix may occur, which can extend to a zone
of a similar size as that of the deformed end (see Bentur et al., 1985). Furthermore, if
the deformed part does not yield it may fracture. Analytical models for determining the
pull-out response of fibres with mechanical anchorage have been developed by,
amongst others, Alwan et al. (1999), van Gysel (1999), and Sujivorakul et al. (2000) for
end-hooked fibres; and Chanvillard (1999) for crimped steel fibres.
P
P
Le
P
Le
Hooked-end fibre
Straight fibre
Deformation of end hook
O
A
C B
D E
F
E
D
C B
Figure 32. Typical fibre pull-out relationship between end-slip and load for straight
and end-hooked fibre.
When comparing the behaviour and efficiency of different fibres, the fibre pull-out
relationship depends on both mechanical and geometrical properties of the fibre, as well
as on its chemical affinity to the matrix (i.e. whether a chemical bond can develop). This
means that the pull-out behaviour of a hooked-end fibre is significantly different
compared to a crimped/corrugated fibre. For the crimped/corrugated fibre, as observed
by Chanvillard and Aïtcin (1996), the failure process starts by crushing of a small
concrete cone on each side of the crack plane and the fibre is unfolded; during the pull-
out, the fibre is straightened so that it loses it original shape (which leads to a significant
reduction in the effective modulus of the fibre). Indented fibres (see Groth 2000) have,
after the peak load, a wave-shaped pull-out curve where the wavelength coincides with
the distance between the indented marks. Furthermore, a new type of fibre developed at
the University of Michigan (see Naaman 2003) has a completely different pull-out
response which is a slip-hardening behaviour. The fibre, which is named Torex, has a
polygonal cross-section (primarily rectangular or triangular) and is twisted along its axis
(similar to a screw). The polygonal shape increases the surface area of the fibre and the
cohesive bond, while the twisting increases the frictional resistance. When pulled-put,
one end of the fibre will be bonded to the matrix and twisting is prevented, while the

CHALMERS, Civil and Environmental Engineering 44
other end rotates as the fibre is gradually pulled out. Naaman (2003) concludes that
Torex fibre has a significantly better performance (two to three times higher pull-out
load); this can be utilised either to improve the performance of the fibre-reinforced
concrete, or to reduce the required volume fraction of fibres.
The pull-out behaviour and maximum load also depend on the angle of inclination of
the fibre. Here the matrix strength plays an important role, as a weak matrix is prone to
spalling and local damage due to the additional concentrated stress (see Figure 33). In
general, it has been found that flexible fibres (e.g. synthetic) tend to increase in pull-out
load to a high angle, while stiff but ductile fibres (e.g. steel) increase up to about 45
inclination angle and then decrease. However, brittle fibres (e.g. carbon) tend to have a
decreased pull-out load at all inclining angles. Naaman and Shah (1976) found that the
pull-out load of inclined steel fibres was almost as high, and that the work required to
completely pull out an inclined fibre was higher than that of a fibre parallel with the
load; similar results were found by Bartos and Duris (1994). Brandt (1985) calculated
the optimal orientation of steel fibres, and concluded that the optimal inclination angle
depends on the interfacial properties of fibre and matrix; his model considered the
energy contribution of debonding, friction, plastic deformation, matrix spalling, and
complementary friction between fibre and matrix due to local compression.
Furthermore, Brandt found that the maximum pull-out energy was at an intermediate
angle of about 35-50. Li et al. (1990) investigated the pull-out behaviour of synthetic
fibres and found that the pull-out load increased with the inclination angle. Leung and
Chi (1995) developed a theoretical, micromechanical model and identified that there
exists an optimum range of the yield strength of the fibre, which depends on the matrix
properties and the risk of spalling at high fibre load.
Fibre subjected to bending and shear
Crack faces
2
F S
R : F = Sx + Rx
Matrix spalling
w
(a) (b)
Figure 33. (a) Bending and shearing of a fibre across a crack and the components of
a crack bridging force, based on Leung and Li (1992). (b) Inclined
bridging effect described by a pulley approach where the matrix is
modelled with spring elements.
So far only single fibre systems have been discussed, but a fibre-reinforced concrete
consists of several fibres which, in most cases, have random orientation. Bentur et al.
(1985) and Bentur and Mindess (1990) pointed out, and observed in experiments, that
the process of debonding and pull-out is quite different in an actual fibre-reinforced
specimen, in which a crack is induced to propagate in the matrix across the fibre,
compared to a simple pull-out test. It has also been observed that the pull-out behaviour
and maximum load also depend on the spacing of the fibres (see Naaman and

CHALMERS, Civil and Environmental Engineering 45
Shah 1976). When investigating the pull-out process, Bentur et al. (1985) showed that
hooked fibres damage the matrix at the hook and that the zone is on the same order as
the dimension of the hook. Hence, it is likely that for some types of fibres, e.g.
deformed steel fibres, the pull-out behaviour will be affected by adjacent fibres, which
also was found in an investigation by Naaman and Shah (1976). Naaman and Shah
tested both aligned and inclined fibres and found that there was a decline in the pull-out
resistance with increase in fibre density, and that the inclined fibres had the highest
reduction. To what degree this affects the pull-out resistance is difficult to state, as it
depends on the extent of the damaged zone in the matrix, which is influenced by a
number of parameters such as the type of fibre (e.g. straight, hooked-end, or crimped),
the dimensions of the fibre and its mechanical anchorage, and the properties of the
matrix. Yet, it is likely that the best performance is achieved when the fibres are
uniformly dispersed throughout the body.
3.4.3.3 Combined aggregate and fibre bridging
In a fibre-reinforced concrete, the resulting tensile bridging stress and energy dissipation
are due to a number of mechanisms acting simultaneously; these have been explained
separately. Compared to plain concrete, fibres act as an additional bridging mechanism
and the critical crack opening (the stress-free) increases by a factor larger than 10, and
so does the fracture energy. The tensile stress, fct, is scarcely influenced by the fibres,
while the maximum fibre bridging stress depends on the parameters described for the
single fibre pull-out and the additional effects caused by randomly oriented fibres.
Hence, for a fibre-reinforced concrete there will be a combined effect of aggregate and
fibre bridging (see Figure 34), where the aggregate bridging has a relatively short
working range in comparison to the fibres. In Figure 34, three distinct zones can be
identified as:
a traction-free zone, which occurs for relatively large crack openings;
a bridging zone, where stress is transferred by fibre pull-out, and aggregate
bridging; and
a zone of microcracking and microcrack growth.
C
D
fct
Elongation, l
bridging and branching
macro-crack growth
micro-crack growth
A
macro-crack
w
B
traction free bridging and
branching
micro-cracking
E D
E
C B
w
macro-crack
growth
A
Bridging stress
FRC
Concrete D
aggregate bridging
E
Figure 34. Schematic description of the effect of fibres on the fracture process in uni-
axial tension.
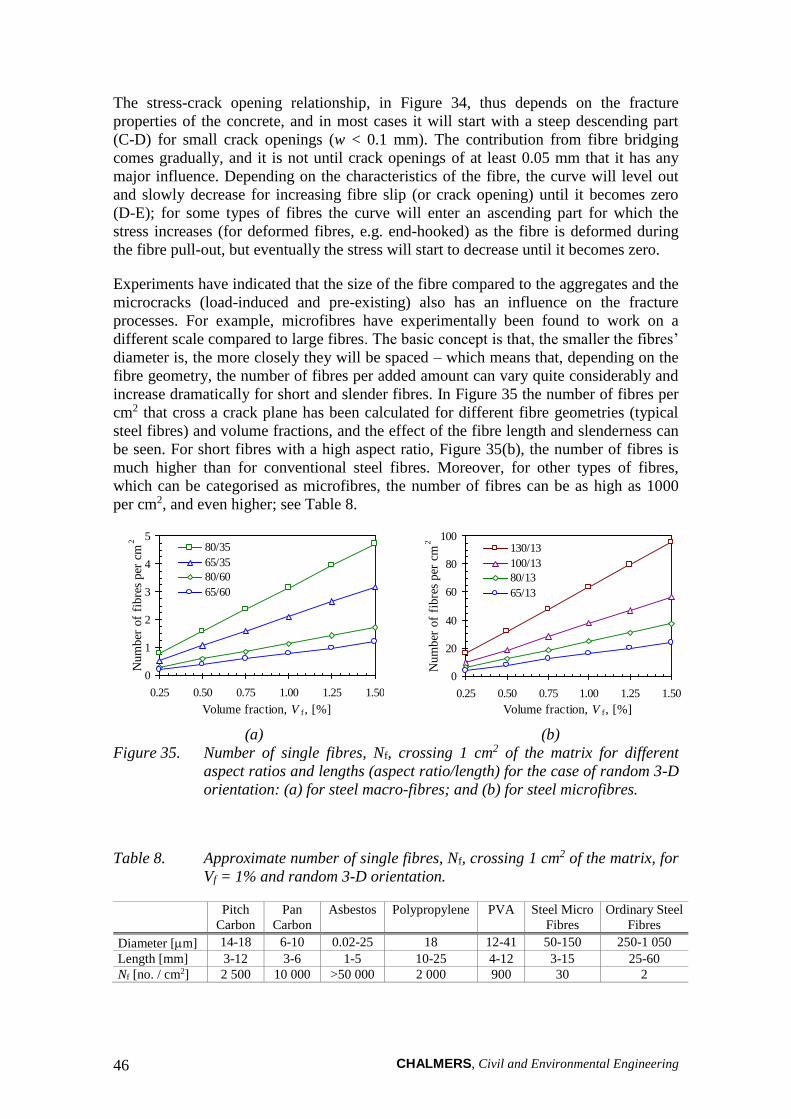
CHALMERS, Civil and Environmental Engineering 46
The stress-crack opening relationship, in Figure 34, thus depends on the fracture
properties of the concrete, and in most cases it will start with a steep descending part
(C-D) for small crack openings (w < 0.1 mm). The contribution from fibre bridging
comes gradually, and it is not until crack openings of at least 0.05 mm that it has any
major influence. Depending on the characteristics of the fibre, the curve will level out
and slowly decrease for increasing fibre slip (or crack opening) until it becomes zero
(D-E); for some types of fibres the curve will enter an ascending part for which the
stress increases (for deformed fibres, e.g. end-hooked) as the fibre is deformed during
the fibre pull-out, but eventually the stress will start to decrease until it becomes zero.
Experiments have indicated that the size of the fibre compared to the aggregates and the
microcracks (load-induced and pre-existing) also has an influence on the fracture
processes. For example, microfibres have experimentally been found to work on a
different scale compared to large fibres. The basic concept is that, the smaller the fibres’
diameter is, the more closely they will be spaced – which means that, depending on the
fibre geometry, the number of fibres per added amount can vary quite considerably and
increase dramatically for short and slender fibres. In Figure 35 the number of fibres per
cm2 that cross a crack plane has been calculated for different fibre geometries (typical
steel fibres) and volume fractions, and the effect of the fibre length and slenderness can
be seen. For short fibres with a high aspect ratio, Figure 35(b), the number of fibres is
much higher than for conventional steel fibres. Moreover, for other types of fibres,
which can be categorised as microfibres, the number of fibres can be as high as 1000
per cm2, and even higher; see Table 8.
0
1
2
3
4
5
0.25 0.50 0.75 1.00 1.25 1.50
Volume fraction, V f , [%]
Nu
mb
er o
f fi
bre
s p
er c
m2
80/35
65/35
80/60
65/60
0
20
40
60
80
100
0.25 0.50 0.75 1.00 1.25 1.50
Volume fraction, V f , [%]
Nu
mb
er o
f fi
bre
s p
er c
m2
130/13
100/13
80/13
65/13
(a) (b)
Figure 35. Number of single fibres, Nf, crossing 1 cm2 of the matrix for different
aspect ratios and lengths (aspect ratio/length) for the case of random 3-D
orientation: (a) for steel macro-fibres; and (b) for steel microfibres.
Table 8. Approximate number of single fibres, Nf, crossing 1 cm2 of the matrix, for
Vf = 1% and random 3-D orientation.
Pitch
Carbon
Pan
Carbon
Asbestos Polypropylene PVA Steel Micro
Fibres
Ordinary Steel
Fibres
Diameter [m] 14-18 6-10 0.02-25 18 12-41 50-150 250-1 050
Length [mm] 3-12 3-6 1-5 10-25 4-12 3-15 25-60
Nf [no. / cm2] 2 500 10 000 >50 000 2 000 900 30 2
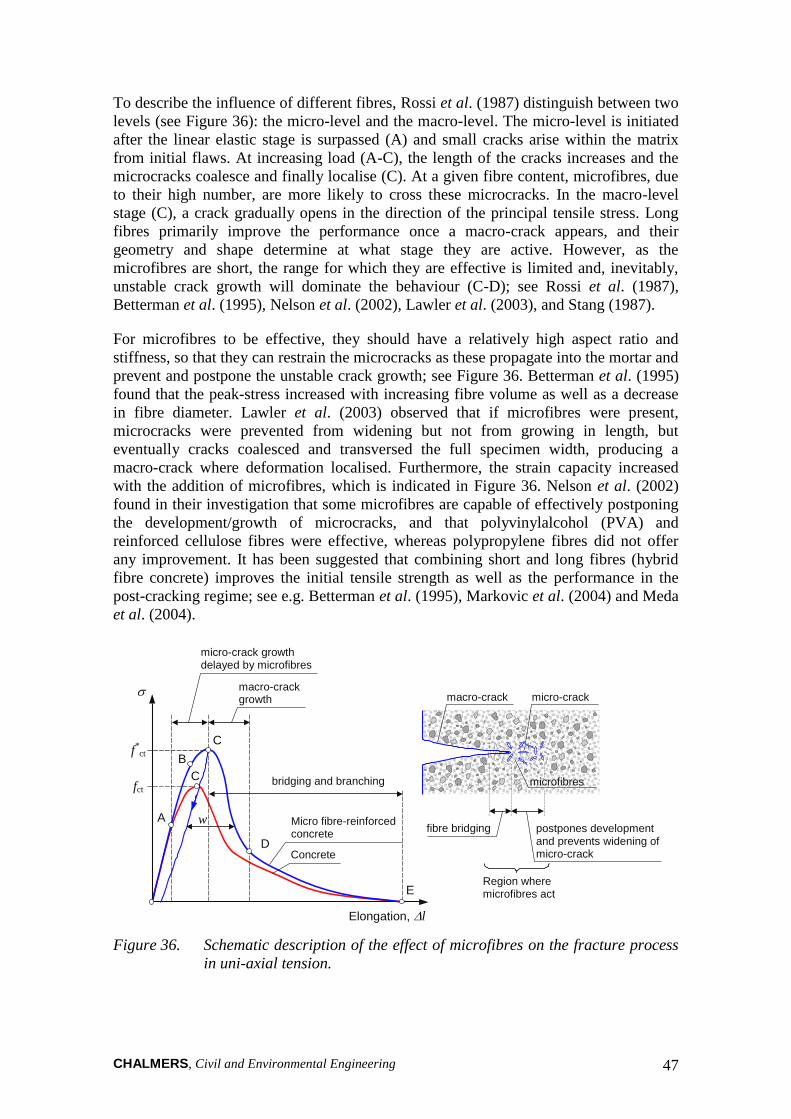
CHALMERS, Civil and Environmental Engineering 47
To describe the influence of different fibres, Rossi et al. (1987) distinguish between two
levels (see Figure 36): the micro-level and the macro-level. The micro-level is initiated
after the linear elastic stage is surpassed (A) and small cracks arise within the matrix
from initial flaws. At increasing load (A-C), the length of the cracks increases and the
microcracks coalesce and finally localise (C). At a given fibre content, microfibres, due
to their high number, are more likely to cross these microcracks. In the macro-level
stage (C), a crack gradually opens in the direction of the principal tensile stress. Long
fibres primarily improve the performance once a macro-crack appears, and their
geometry and shape determine at what stage they are active. However, as the
microfibres are short, the range for which they are effective is limited and, inevitably,
unstable crack growth will dominate the behaviour (C-D); see Rossi et al. (1987),
Betterman et al. (1995), Nelson et al. (2002), Lawler et al. (2003), and Stang (1987).
For microfibres to be effective, they should have a relatively high aspect ratio and
stiffness, so that they can restrain the microcracks as these propagate into the mortar and
prevent and postpone the unstable crack growth; see Figure 36. Betterman et al. (1995)
found that the peak-stress increased with increasing fibre volume as well as a decrease
in fibre diameter. Lawler et al. (2003) observed that if microfibres were present,
microcracks were prevented from widening but not from growing in length, but
eventually cracks coalesced and transversed the full specimen width, producing a
macro-crack where deformation localised. Furthermore, the strain capacity increased
with the addition of microfibres, which is indicated in Figure 36. Nelson et al. (2002)
found in their investigation that some microfibres are capable of effectively postponing
the development/growth of microcracks, and that polyvinylalcohol (PVA) and
reinforced cellulose fibres were effective, whereas polypropylene fibres did not offer
any improvement. It has been suggested that combining short and long fibres (hybrid
fibre concrete) improves the initial tensile strength as well as the performance in the
post-cracking regime; see e.g. Betterman et al. (1995), Markovic et al. (2004) and Meda
et al. (2004).
C
D
E
f*
ct
Elongation, l
bridging and branching
macro-crack growth
micro-crack growth delayed by microfibres
A
fct C
fibre bridging
microfibres
macro-crack
w
Concrete
Micro fibre-reinforced concrete
Region where microfibres act
B
postpones development and prevents widening of micro-crack
micro-crack
Figure 36. Schematic description of the effect of microfibres on the fracture process
in uni-axial tension.

CHALMERS, Civil and Environmental Engineering 48
3.5 Mechanical properties
In concrete design and quality control, compressive strength is the property generally
specified and by which concrete is classified. The main reason for this is that, compared
to most other properties, testing of compressive strength is relatively easy. Furthermore,
many properties of concrete, such as modulus of elasticity, tensile strength,
permeability, etc., are believed to be dependent on the compressive strength and may
therefore be deduced from the strength data. Though, the compressive strength cannot
be utilised as a replacement for all properties, especially not for the increase of
toughness observed in fibre-reinforced concrete. This means that for fibre-reinforced
concrete some sort of toughness property is required, and that other test methods have to
be utilised to characterise it. In addition, the type of properties required depends on the
constitutive models that are used to describe the material in numerical analyses.
The ranges of some mechanical properties of cement-based materials, such as cement
paste and concrete, are listed in Table 9. In the table, values of the following properties
are listed: the compressive strength fc; the tensile strength ft; the modulus of elasticity E;
the fracture energy GF; and the characteristic length lch. The characteristic length is an
indication of the material’s brittleness and is defined as:
2t
Fcch
f
GEl
Table 9. Range of mechanical properties of cement-based materials.
Material
fc
[MPa]
ft
[MPa]
E
[GPa]
GF
[Nm/m2]
lch
[mm]
Cement paste 10 – 25 2.0 – 10.0 10 – 30 10 5 – 15
Mortar 1.0 – 10.0 10 – 30 10 – 50 100 – 200
Normal-strength concrete 20 – 80 1.5 – 5.0 25 – 40 50 – 150 200 – 400
High-strength concrete > 80 4.0 – 5.5 40 – 50 100 – 150 150 – 250
Fibre-reinforced concrete 20 – 80 1.5 – 5.0 25 – 40 > 500 > 1 000
3.5.1 Compressive properties
The stress–strain relation of plain concrete exhibits nearly linear elastic response up to
about 30% of the compressive strength. This is followed by gradual softening up to the
concrete compressive strength; beyond the compressive strength, the concrete stress–
strain relation exhibits strain softening until failure takes place by crushing.
Experimental observations have suggested that the macroscopic behaviour under
compression is due to frictional sliding along pre-existing flaws, resulting in formation
of tensile cracks at the tips of these flaws; see Vonk (1992) and van Mier (1997).
Cracking starts as sliding on the aggregate-cement paste interface (the weak zone) and
propagates into the matrix as tensile cracks; these tensile cracks grow with increasing
compression and become parallel to the direction of the principal compressive stress.
The final failure is due to interaction of the tensile cracks. The main explanation, as
proposed by Neville (1997), of the largely curvilinear stress–strain relation of concrete
lies in the presence of interfaces between the aggregate and the hardened cement paste,
in which microcracks develop even under modest loading. The behaviour of concrete
changes and as the compressive strength increases and it becomes more brittle. For a

CHALMERS, Civil and Environmental Engineering 49
normal-strength concrete, the aggregate is significantly stronger and stiffer than the
cement paste, while for a high-strength concrete the strength and stiffness are alike. As a
result, some cracks extend through the aggregates resulting in a smooth crack surface,
compared to the more tortuous crack surface in normal-strength concrete. In high-
strength concrete, the tensile strength of the aggregate, rather than the interface between
paste and aggregates, may become the weak link (see Darwin et al. 2001).
With fibres present in the matrix, the concrete become more ductile (see Figure 37), and
the main effect of fibres appears to be that they offer resistance against the longitudinal
crack growth. Though, the effect of fibres is highly dependent on the type of fibre used,
the size and properties of the fibres, the volume fraction added, and the properties of the
matrix. Glavind (1992), for example, found that the addition of fibres was particularly
advantageous for improving the mechanical properties of high-strength concrete loaded
in compression, as the inherent brittleness was significantly reduced. Generally it can be
concluded that conventional steel fibres at moderate dosages (<1%) do not affect the
pre-peak properties, whereas the strain at crack localisation and the failure strain
increase. However, with microfibres (e.g. carbon and Wollastonite) and for high fibre
volumes (> 1%) it is possible to increase the compressive strength.
Figure 37. Schematic description of the behaviour of concrete and FRC in
compression.
To take into account the beneficial effect of steel fibres, a number of empirical
expressions have been proposed; see e.g. Ezeldin and Balaguru (1992), Taerwe and van
Gysel (1996a,b). For structural design, elasto-plastic constitutive models with a
parabolic transition have been proposed for the compressive behaviour of steel fibre-
reinforced concrete, with ultimate strains of 3.0-3.5‰ (see e.g. Nanakorn and Horii,
1996; ACI 544 (1994); Lok and Pei, 1998; and RILEM TC TDF-162, 2003a). RILEM
Technical Committee TDF-162 (2003a) suggests that the compressive strength of steel
fibre-reinforced concrete should be determined by means of standard tests, i.e. as
suggested in e.g. ENV 1992-1-1, on either concrete cylinders or cubes. Furthermore, the
concrete is classified according to the same strength classes as in ENV 1992-1-1, e.g.
C30/37.
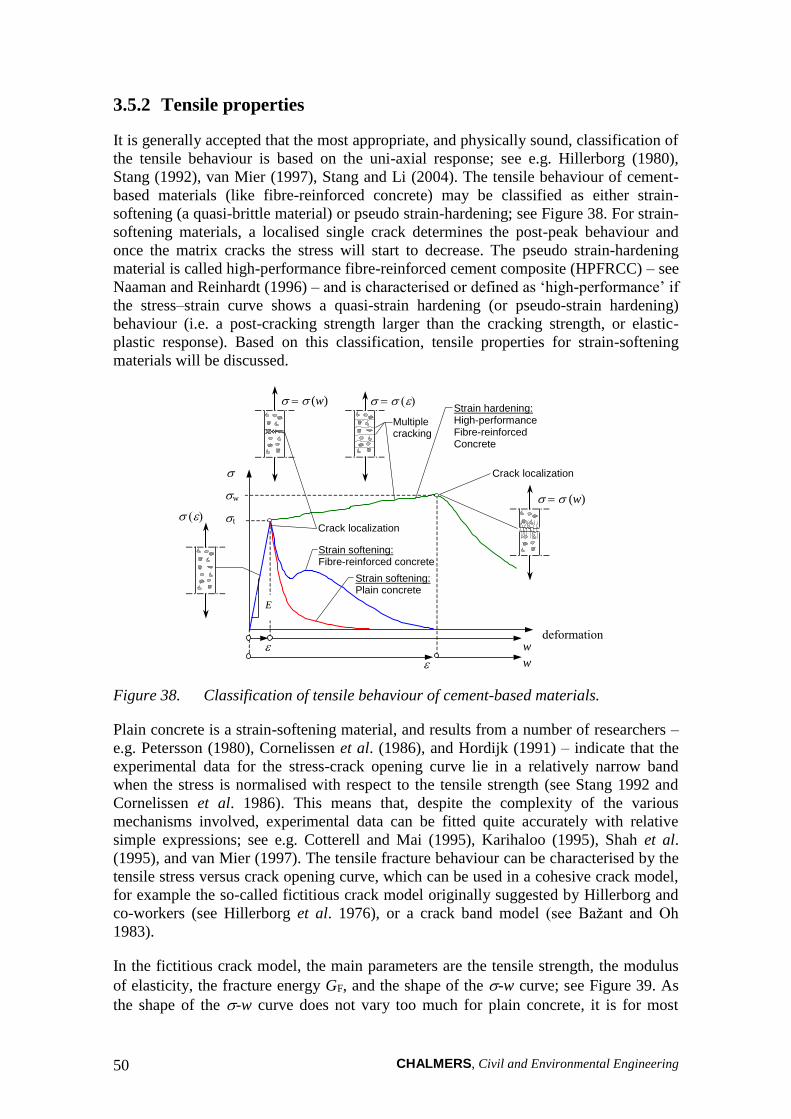
CHALMERS, Civil and Environmental Engineering 50
3.5.2 Tensile properties
It is generally accepted that the most appropriate, and physically sound, classification of
the tensile behaviour is based on the uni-axial response; see e.g. Hillerborg (1980),
Stang (1992), van Mier (1997), Stang and Li (2004). The tensile behaviour of cement-
based materials (like fibre-reinforced concrete) may be classified as either strain-
softening (a quasi-brittle material) or pseudo strain-hardening; see Figure 38. For strain-
softening materials, a localised single crack determines the post-peak behaviour and
once the matrix cracks the stress will start to decrease. The pseudo strain-hardening
material is called high-performance fibre-reinforced cement composite (HPFRCC) – see
Naaman and Reinhardt (1996) – and is characterised or defined as ‘high-performance’ if
the stress–strain curve shows a quasi-strain hardening (or pseudo-strain hardening)
behaviour (i.e. a post-cracking strength larger than the cracking strength, or elastic-
plastic response). Based on this classification, tensile properties for strain-softening
materials will be discussed.
w
deformation
t
E
w
Strain softening: Plain concrete
Strain softening: Fibre-reinforced concrete
Strain hardening: High-performance Fibre-reinforced Concrete
(w)
w
Multiple cracking
(w)
Crack localization
Crack localization
Figure 38. Classification of tensile behaviour of cement-based materials.
Plain concrete is a strain-softening material, and results from a number of researchers –
e.g. Petersson (1980), Cornelissen et al. (1986), and Hordijk (1991) – indicate that the
experimental data for the stress-crack opening curve lie in a relatively narrow band
when the stress is normalised with respect to the tensile strength (see Stang 1992 and
Cornelissen et al. 1986). This means that, despite the complexity of the various
mechanisms involved, experimental data can be fitted quite accurately with relative
simple expressions; see e.g. Cotterell and Mai (1995), Karihaloo (1995), Shah et al.
(1995), and van Mier (1997). The tensile fracture behaviour can be characterised by the
tensile stress versus crack opening curve, which can be used in a cohesive crack model,
for example the so-called fictitious crack model originally suggested by Hillerborg and
co-workers (see Hillerborg et al. 1976), or a crack band model (see Bažant and Oh
1983).
In the fictitious crack model, the main parameters are the tensile strength, the modulus
of elasticity, the fracture energy GF, and the shape of the -w curve; see Figure 39. As
the shape of the -w curve does not vary too much for plain concrete, it is for most

CHALMERS, Civil and Environmental Engineering 51
practical engineering applications usually sufficient to determine the fracture energy,
GF, and the tensile strength and to select an appropriate -w relationship. The fracture
energy can be determined experimentally in: uni-axial tension tests, which yield the
complete -w curve; three-point bending tests, e.g. according to RILEM TC-50 FMC
(1985); or other fracture test methods, such as the wedge-splitting test method (see
RILEM TC 89-FMT, 1991). If no experimental results exist, values of the fracture
energy have been recommended in CEB-FIP Model Code 1990 (see CEB-FIP 1993).
When the fracture energy and tensile strength have been determined, the -w
relationship can be approximated as: linear (see Hillerborg et al. 1976); bi-linear (see
e.g. Petersson 1981, Gylltoft 1983, and CEB-FIP 1993); multi- or polylinear (see e.g.
Nanakorn and Horii 1996 and Kitsutaka 1997); polynomial or exponential (see e.g.
Reinhardt 1984, Cornelissen et al. 1986, and Stang 1992). For most practical
applications it has been found that the bi-linear relationship is a sufficient
approximation (see e.g. Cotterell and Mai 1995).
Ec
fct
()
1
wc
w
ctf
w
dwwG
cw
F
0
(b) (a)
Figure 39. Description of the tensile behaviour in the fictitious crack model: (a) a
stress–strain curve and (b) a stress-crack opening curve (where GF is the
fracture energy and wc is the critical crack opening).
Fibre-reinforced concretes, with low and moderate volume fractions of fibres, can also
be regarded as a strain-softening material. As already pointed out, the tensile strength
and modulus of elasticity are not significantly affected. Although, the fibres have a
considerable impact on the tensile fracture behaviour, and the fracture energy and shape
of the -w curves vary considerably depending on type and amount of fibres used, the
quality of the concrete, etc.; see e.g. Li et al. (1993). Furthermore, as pointed out by
Hillerborg (1980), the complete fracture energy is of no interest since the stress-free
crack opening, wc, occurs at very large crack openings for most FRCs, while for most
concretes (without fibres) it is seldom larger than 0.3 mm. Consequently, with the
fictitious crack model as a framework, to completely characterise the mechanical
behaviour of fibre-reinforced concrete in tension it is necessary to determine the -w
relationship. As the shape of the -w curve will be more or less complex (see Figure
38), it may be necessary to simplify the relationship in a similar manner as for plain
concrete. Exactly how the -w relationship should be approximated depends, among
other things, on its shape, the constitutive model used, and the type of analysis (i.e.
whether it is for determining the structural behaviour in service state or ultimate limit
state); see Hillerborg (1980), Stang and Olesen (2000), and RILEM TC 162-TDF
(2002a).
CHALMERS, Civil and Environmental Engineering 52
3.5.3 Shear properties
The principal action responsible for transferring shear stresses across a crack in plain
concrete is often explained as aggregate interlock and friction at the crack faces. For
fibre-reinforced concrete, at low and moderate fibre dosages the cracking strength is not
affected but, as soon as the matrix cracks, the fibres are activated and start to be pulled
out, resulting in a significant toughening behaviour (see Barragán 2002). Allos (1989)
reported that the shear transfer capacity could be significantly increased, as much as up
to 60% of the compressive strength. Barragán (2002) found that the maximum shear
strength increased with the fibre volume fraction (for high-strength concrete the
increase was significant, close to 100% with 40 kg/m3 steel fibres). For reinforced
concrete it is known that the amount of reinforcement crossing the shear plane
influences the shear friction and the shear capacity due to dowel effects and a similar
effect is observed for FRC. Barragán (2002) evaluated the dowel action of fibres by
evaluating the residual shear stresses at different slip limits and found that this increased
with the fibre volume fraction.
3.6 Concluding remarks
In this chapter, properties of different fibre materials have been introduced and a short
introduction to the orientation of fibres in concrete has been provided. As the
microstructure of concrete, and its development with time, play a significant role in
controlling the performance of a fibre-reinforced concrete, this has briefly been
outlined. Subsequently, the pre- and post-cracking mechanisms of both plain and fibre-
reinforced concrete have been described. For plain concrete, it was shown that there are
a number of complex mechanisms involved in the fracture process, and that the major
toughening mechanism is the aggregate bridging but that increased toughness also can
be achieved by e.g. air voids. For fibre-reinforced concrete, with a low volume fraction
of fibres (Vf < 1.0%), it was shown that the fibres have a negligible effect on the
strength (both in tension and compression) and that the primary effect of fibres is their
ability to improve the post-cracking behaviour and the toughness – i.e. the capacity of
transferring stresses after matrix cracking and the tensile strains at rupture. Furthermore,
the mechanics of fibre pull-out (of individual fibres) was discussed, examples of
schematic pull-out curves were given, and the importance for the mechanical behaviour
of a fibre-reinforced concrete was also shown. For the fibre pull-out, it was shown that
this depends on the characteristics of the fibre and the matrix, the mechanical properties
of the interface between fibre and matrix, and the angle of inclination of the fibre with
respect to the direction of loading. In the end, mechanical properties were discussed and
some examples were provided.

CHALMERS, Civil and Environmental Engineering 53
4 Fracture-mechanics-based material testing of FRC
4.1 Introduction
During the past four decades, different methods have been proposed and used to
characterise the tensile behaviour of fibre-reinforced concrete (FRC): e.g. by measuring
the flexural strength, as in the early work of Romualdi and Mandel (1964), or by
determining the behaviour in terms of dimensionless toughness indices (as prescribed in
ASTM C 1018) to determine residual flexural strengths at prescribed deflections; see
and RILEM TC 162-TDF (2002b). In addition, the splitting test (also known as the
Brazilian test) has been used to determine the splitting tensile strength. The main test-
set-ups used are:
uni-axial tension test or direct tensile test;
flexural test; and
panel test or plate test.
Other test methods exist, e.g. the wedge-splitting test (WST) method, the compact
tension test, etc., but the most common test approach appears to be the flexural test on
beam/prism. Beam/prism specimens are loaded in either three-point or four-point
bending and can be equipped with a notch. Flexural beam tests are used in a number of
national standards/guidelines: see e.g. the draft European Standard prEN14845-1; ACI
544; ASTM C 1018; JCI-SF4 (Japan); UNI U73041440 (Italy), in di Prisco et al.
(2004b). Panel/plate tests are typically used for shotcrete and can be either square
panels, e.g. the EFNARC panel test (see EFNARC, 1996), or round panels (ASTM
1550-02). Panel/plate tests are typical application-specific tests where the loading
condition of the test method simulates a design situation in a real structure. For
determining tensile fracture properties of concrete and fibre-reinforced concrete, the
three-point bending test on a notched beam is probably the most widespread method;
see RILEM TC-50 FMC (1985) for plain concrete and RILEM TC 162-TDF (2002b)
for steel fibre-reinforced concrete. For a review of different test methods, see RILEM
Report 5 (1991), ACI 544 (1996), Stang et al. (2000), Bentur and Mindess (1990),
Gopalaratnam et al. (1991), Balaguru and Shah (1992), Gopalaratnam and Gettu (1995),
Banthia and Trottier (1995), Barr et al. (1996), Mindess et al. (1996), Taylor et al.
(1997), van Mier (1997), Marti et al. (1999), Chanvillard (2000), Kooiman (2000),
Lambrechts (2004).
The fracture behaviour of fibre-reinforced concrete can be described by the stress-crack
opening (-w) relationship, as was shown in the previous chapter, but to obtain this it is
necessary to have appropriate test methods that can be used to determine this
fundamental relationship. But determining the -w relationship is an intricate problem,
especially in a flexural test for which it may also be necessary to have a procedure for
interpreting the test results, for example by conducting inverse analysis (see Paper V).
Generally when characterising/classifying fibre-reinforced cementitious composites,
Stang (1992 & 2004) and Stand and Li (2004) suggested that a distinction should be
made between materials that, when loaded under uni-axial stress, show tension
softening (strain localisation) and those with a strain-hardening behaviour; see Figure
40. For this purpose, the uni-axial tension test (UTT) appears to be the most

CHALMERS, Civil and Environmental Engineering 54
straightforward and physically sound method of classification, as the -w relationship
can be directly determined from the test results. However, the UTT requires
sophisticated testing equipment and is quite time-consuming to carry out, and it has
been shown that the test result is affected by machine specimen interaction and it is
difficult to accurately determine the tensile strength; see e.g. Aarre (1992), van Mier
(1997), Rossi (1997), Stang and Bendixen (1998), Chanvillard (2000), Østergaard
(2003), and Barragán (2003). As a substitute for the UTT, flexural tests are frequently
used in standards. In a flexural test the response can be either deflection hardening or
deflection softening; see Figure 40. But to complicate matters, a material showing a
tension-softening behaviour when loaded under uni-axial stress can show either
deflection hardening or softening behaviour, as is seen in Figure 40. The response,
deflection hardening or softening, depends on the fracture properties (the toughness) of
the material as well as the dimensions of the specimen. For example, a thin beam may
show a deflection hardening behaviour but, as the beam height is increased, the
response eventually may change to deflection softening. It is also a well-known fact that
for fibre-reinforced concrete the fibre distribution and orientation are influenced by the
specimen geometry, and it may also be affected during the casting procedure. A
consequence of this is that care should be taken when specifying a test set-up and in
particular when interpreting the test result.
Tension softening
Strain hardening
Deflection softening
Deflection hardening
Str
ess
Str
ess
Strain / Deformation
Strain / Deformation
Deflection
Deflection
Lo
ad
L
oa
d
Localization
Localization
Multiple cracking
Multiple cracking
Single crack Matrix cracking
Single crack
FRC
Concrete
HPFRC
FRC
Concrete
FRC & HPFRC
Matrix cracking
Matrix cracking
Uni-axial response
Flexural response
Figure 40. Characterisation of the tensile and flexural behaviour.
4.2 Approach for determining the -w relationship
To determine the -w relationship for FRC, an approach which overcomes some of the
problems mentioned in Section 4.1 has been developed and used in this study. The
approach has three steps: (1) the material testing, e.g. the WST or the 3PBT; (2) inverse
analysis (using non-linear fracture mechanics) where the -w relationship is determined;
and (3) adjustment of the -w relationship for any differences in fibre efficiency (the
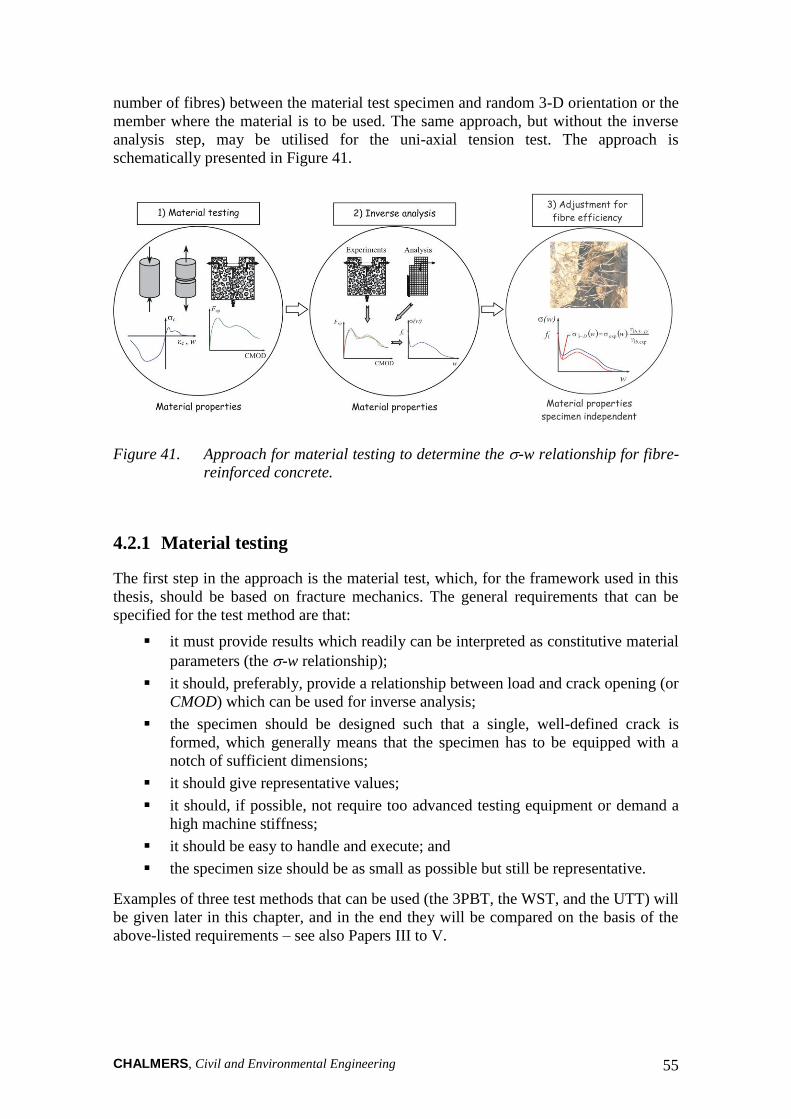
CHALMERS, Civil and Environmental Engineering 55
number of fibres) between the material test specimen and random 3-D orientation or the
member where the material is to be used. The same approach, but without the inverse
analysis step, may be utilised for the uni-axial tension test. The approach is
schematically presented in Figure 41.
Figure 41. Approach for material testing to determine the -w relationship for fibre-
reinforced concrete.
4.2.1 Material testing
The first step in the approach is the material test, which, for the framework used in this
thesis, should be based on fracture mechanics. The general requirements that can be
specified for the test method are that:
it must provide results which readily can be interpreted as constitutive material
parameters (the -w relationship);
it should, preferably, provide a relationship between load and crack opening (or
CMOD) which can be used for inverse analysis;
the specimen should be designed such that a single, well-defined crack is
formed, which generally means that the specimen has to be equipped with a
notch of sufficient dimensions;
it should give representative values;
it should, if possible, not require too advanced testing equipment or demand a
high machine stiffness;
it should be easy to handle and execute; and
the specimen size should be as small as possible but still be representative.
Examples of three test methods that can be used (the 3PBT, the WST, and the UTT) will
be given later in this chapter, and in the end they will be compared on the basis of the
above-listed requirements – see also Papers III to V.

CHALMERS, Civil and Environmental Engineering 56
4.2.2 Inverse analysis
The second step in the approach is the determination of the -w relationship by inverse
analysis. Inverse analysis – also referred to as parameter or function estimation – is
achieved by minimising the differences between calculated displacements and target
displacements (e.g. CMOD) obtained from test results (see Figure 42). In this manner,
inverse analysis can be used to determine a -w relationship from test results of
methods like the 3PBT and the WST.
experimental results
model prediction: yi = f (xi, 1,...,n)
y
x
yi
xi
Error: 21,..., in yE
Figure 42. Principle of inverse analysis.
For regular concrete (i.e. without fibres), extensive research has been carried out to
determine the best approach for inverse analysis, and different strategies have been
proposed. Of the available approaches, some define the shape of the -w relationship as
bi-linear according to Figure 43(a); see e.g. Roelfstra and Wittmann (1986), Planas et
al. (1999), Østergaard (2003), Bolzon et al. (2002), and Que and Tin-Loi (2002).
Alternatively, an exponential softening function according to Figure 43(b) is used; see
e.g. Villmann et al. 2004. In others, a polylinear (or multilinear) -w relationship is
used, see Figure 43(c), in conjunction with a stepwise analysis; see e.g. Kitsutaka
(1997) and Nanakorn and Horii (1996b).
The inverse analysis approach has also been used for FRC; see e.g. Rokugo et al.
(1989), Uchida et al. (1995), Kooiman (2000), Meda et al. (2001), and Sousa et al.
(2002). A more comprehensive review of different approaches is provided in Paper V.
However, there are some problems associated with conducting inverse analysis on FRC,
such as: (1) the shape of the -w relationship is not as well defined as for regular
concrete, but varies depending on the mix constituents; (2) with increasing fibre
volumes, it becomes difficult to distinguish between the effect of the tensile strength
and the first slope of the -w relationship; (3) the inverse problem is often ill-posed, i.e.
there exists no unique solution; (4) a large number of parameters may be required for
describing the -w relationship; and (5) the response is influenced by the position of the
fibres (see Figure 44), which may be reflected on the determined -w relationship as it
is usually assumed that the properties are uniform over the section.

CHALMERS, Civil and Environmental Engineering 57
b2
w1 wc
a2
1
ctf
w
(a)
w
a1
wc
w
ctf
w
(b)
1
1
a1
1
ctf
w
an a2
w
w1 w2 wn wc
b2
(c)
1
1
1
Figure 43. Different -w relationships: (a) bi-linear; (b) exponential; and (c)
polylinear (or multilinear).
Assuming uniform properties may well be justified for concrete without fibres, while
for FRC it is quite likely that there will be variations due to non-uniform fibre
distribution. These variations may not influence the tensile strength much, but a fibre
bundle situated close to the notch (see Figure 44) may have a significant effect on the
behaviour and influence the determination of the -w relationship. In a uni-axial tension
test, the position of a single fibre is not as important as for the 3PBT and the WST,
where a flexural loading condition arises. In Figure 44 different positions of a fibre are
shown; a fibre positioned directly at the notch (or at the beam surface if there is no
notch) will contribute significantly more to the bending resistance and it will also slow
down the crack propagation. In Figure 44(c) the situation which occurs in an un-notched
specimen is shown; here fibres will have 2-D orientation at the bottom of the specimen,
as they will be aligned with the edges, and a region with 2-D orientation will extend to a
depth equal to half fibre length. Another problem which has been observed for beams
without a notch, Figure 44(c), is that the orientation of the fibres at the bottom of the
beam may have a favourable effect on the flexural resistance; see e.g. Schumacher et al.
(2003).
(a) (b)
df1 df1
Ff1 Ff1
(c)
df1
Ff1
Region with 2-D
fibre orientation
M M M
Notched beam:
first fibre at the
notch tip
Notched beam:
first fibre at a distance
from notch tip
Un-notched beam:
2-D fibre orientation at
the bottom of the beam
Figure 44. Different positions of a fibre: (a) notched specimen with a fibre just above
the notch; (b) notched specimen with a fibre at a distance from the notch;
and (c) the situation in an un-notched specimen.
In this study, inverse analyses were conducted on the averaged load–CMOD curves (the
average of all tested specimens from one mix). The benefits of this are that effects of
any variations in fibre distribution and orientation between specimens are averaged out
and a representative curve is provided, and that only one analysis is required for
determination of the -w relationship. A drawback with this approach, which has been

CHALMERS, Civil and Environmental Engineering 58
observed, is that when the load–CMOD curve is averaged the peak is somewhat
flattened out or smoothed (see e.g. Villmann et al. 2004). A consequence is that the
initial part of the -w relationship is affected; this, on the other hand, affects plain
concrete or fibre-reinforced concrete with a low volume fraction of fibres, which
exhibits a more brittle behaviour.
When performing an inverse analysis on FRC the following general recommendations
can be provided:
(1) Preferably the tensile strength should be determined in an independent test
or be based on previous experience. If a splitting test is conducted, it should
not be performed on the FRC but rather on a reference mix without fibres,
but care should be taken so that this mix is representative (e.g. porosity) –
see Olesen et al. (2003).
(2) It is important that the first descending slope of the -w relationship is
estimated realistically – the slope should be sufficiently steep – and an
adequate number of points should be used to describe the subsequent parts
of the -w relationship.
(3) If possible, try in advance to get some information or understanding about
the behaviour of the fibres (the fibre pull-out) that are used and how they
may influence the shape of the -w relationship.
(4) The fitting interval should be chosen carefully. For example, when using a
bi-linear relationship it may not be possible to get a good fit over the entire
experimental curve (especially if the test is continued to a very large CMOD
or deflection). A choice should be made regarding which part of the -w
relationship is most important, i.e. small (< 0.5 mm) or large (> 1.0 mm)
crack openings; see also Sousa and Gettu (2004).
If the tensile strength is to be predicted correctly, the initial slope is important; i.e. a less
steep slope has to be compensated by a lower tensile strength in order to fit the test data.
But it should be pointed out that the initial slope should be steep, and this can be based
on the following observations: (1) the initial part of the -w relationship is quite steep
for plain concrete (see Stang 1992 and Cornelissen et al. 1986); and (2) the contribution
from fibre bridging comes gradually and it is not until crack openings of at least 0.05
mm that it has any major influence (see Li et al. 1993). Moreover, uni-axial tension tests
on fibre-reinforced concrete have shown that the -w relationship starts with an initial
steep descending slope (see Figure 45 or e.g. Li et al. 1993 and Barragán 2002).

CHALMERS, Civil and Environmental Engineering 59
0.0
1.0
2.0
3.0
0.0 0.1 0.2 0.3
Crack opening, w , [mm]
Ten
sile
str
ess
[MP
a]
Mix 1 & 2
w/b 0.58
Mix 1: 0.5% RC-65/60
Mix 2: 1.0% RC-65/60
0.0
1.0
2.0
3.0
0.0 0.1 0.2 0.3
Crack opening, w , [mm]
Ten
sile
str
ess
[MP
a]
Mix 3 & 4
w/b 0.42
Mix 4: 1.0% RC-65/60
Mix 3: 0.5% RC-65/60
(a) (b)
Figure 45. The initial part of the -w relationship: (a) for a concrete with w/b 0.58
and (b) for w/b 0.42. Fibre type used: Dramix RC 65/60 (aspect ratio 65
& length 60 mm); for mix composition see Paper III.
4.2.3 Adjustment of -w relationship for fibre efficiency
The third step in the approach is to adjust the -w relationship, considering the actual
number of fibres crossing the fracture plane in the test specimen. In Section 3.3, it was
shown that the specimen size, in relation to the fibre length, had a considerable impact
on the fibre efficiency factor. Hence, when using small specimens for material
characterisation it is apparent that this will influence the fibre orientation and, more
importantly, the fibre bridging stress. The question is whether the obtained fibre
bridging stress can/may be adjusted/corrected by considering the actual number of
fibres. Thus, if it assumed that the material test specimen used for material
characterisation has a more or less random 3-D fibre orientation but with a different
fibre efficiency factor compared to random 3-D. Hence, could an experimentally
determined fibre efficiency factor, b.exp, be used to modify the stress-crack opening
relationship so that it more closely corresponds to that of a completely random 3D-
orientation?
If it is postulated that there exists a linear relationship between the number of fibres and
the fibre bridging stress, then it would be possible to adjust the -w relationship
obtained from inverse analyses, b.exp(w), considering the difference in fibre efficiency
factor between the material test specimen and the theoretical value for random 3-D
orientation, b.3-D, according to:
exp.
3.exp.3.
b
DbbDb ww
which then should provide the -w relationship for random 3-D orientation, b.3-D(w).
The experimental fibre efficiency factor, b.exp, for the material test specimen can be
determined by counting the number of fibres crossing the fracture plane and calculating
with the following expression:
CHALMERS, Civil and Environmental Engineering 60
ff
f
bAV
N exp.
exp.
where Nf.exp is the number of fibres per unit area, Vf is the fibre volume
fraction, and Af is the cross-sectional area of a fibre.
But as pointed out in Chapter 3.4.3, it has been observed that neighbouring fibres may
influence each other by damaging the matrix. On the other hand, if the difference in
fibre efficiency is not too large, it may be an acceptable approximation to assume a
linear relationship.
The proposed hypothesis can be supported by the following observations: (1) in most
theoretical models for fibre-reinforced composites, it is assumed that the tensile
behaviour may be obtained by a simple summation of the individual components; and
(2) experimental results, using different test methods (UTT, 3PBT, and WST), indicate
an almost linear relationship between the number of fibres and the tensile stress at
different crack openings.
Regarding the first observation, examples of such theoretical models for fibre-
reinforced composites can be found in e.g. Li et al. (1993), Kullaa (1994), Li and Stang
(2001) and Voo & Foster (2003). In these models, it is assumed that the effects of each
individual fibre (considering all possible embedment lengths and orientations) can be
summed over the failure surface to yield the overall behaviour. It is also often assumed
(but not necessarily) that the geometric centres of the fibres are uniformly distributed in
space and all fibres have an equal probability of being oriented in any direction. For
example, in the model presented by Li and Stang (2001), see Figure 46, the total fibre
bridging fb(w) is a summation of the forces induced by each bridging fibre – every
single fibre with random distribution and orientation – across the matrix crack per unit
area. The following expression gives the fibre bridging stress:
ddzzppgVLPA
Vw
fL
z
fef
f
fb
1
0
cos2
0
,...,;
where is the orientation angle of the fibre, 0 and 1 are the integration limits,
z is the centroidal distance to the fibre, g() is a function considering
inclination angle effects (e.g. snubbing), and probability density functions for
the fibre orientation are p(z) and p().
The complete bridging relation b(w) is determined by adding up the individual
contributions of the aggregate bridging ab(w), the fibre bridging fb(w), and the
prestressing effect ps(w). This gives the following expression:
wwww psfbabb

CHALMERS, Civil and Environmental Engineering 61
Fibre
Matrix Matrix
Le P
P(Le, )=0 P(Le, , )
w
fb
P()
z
p(z)
p()
feP
P
0
ddzzppLPA
Vw
fL
z
ef
ffb
1
0
cos2
0
,,
matrix crack plane
Figure 46. Micromechanical model for fibre bridging: modular construction of the
fb-w relationship, based on Li and Stang (2001).
Results from experiments presented in the literature also seem to confirm a linear
relationship between fibre content and the tensile stress at different crack openings. This
can be seen in for example Li et al. (1993), Barragán et al. (2003), Barragán (2003),
Gettu and Barragán (2003), Barros and Antunes (2003), and Dupont (2003).
To investigate the hypothesis, a small experimental study was carried out using the
WST method (which is described later in this chapter). For the experiments, a self-
compacting concrete, with a w/b ratio of 0.55, was used and the volume fraction of
fibres was varied between 0 and 1.0%, using end-hooked fibres of the type Dramix
RC-65/35 (fibre aspect ratio 65 and length 35 mm). For each mix, three WST specimens
(dimensions 150150150 mm3) were tested after water curing. Figure 47(a) shows the
relationship between the volume fraction and the number of fibres per cm2 while Figure
47(b) shows the experimental fibre efficiency factor, b.exp. This factor was determined
by counting the number of fibres crossing the fracture plane. As can be seen in Figure
47, in all the mixes the number of fibres exceeds the theoretical value for random 3-D
orientation, and for the mix with Vf = 1.0% it even exceeds the theoretical value for
random 2-D orientation.
y = 2.5396x
R2 = 0.9651
y = 2.1045x
0.0
1.0
2.0
3.0
0.00 0.25 0.50 0.75 1.00 1.25
V f [%]
Theoretical
From WST-
specimens
Nu
mb
er o
f fi
bre
s p
er c
m2 [
no
. /
cm2]
0.58
0.53 0.54 0.55
0.59
0.66
0.3
0.4
0.5
0.6
0.7
0.25 0.38 0.50 0.63 0.75 1.00
V f [%]
b.2D= 0.64
b.3D= 0.5
Ex
per
imen
tal
fib
re e
ffic
ien
cy f
acto
r [-]
(a) (b)
Figure 47. (a) Relationship between the actual number of fibres per cm2 in the
specimens and the fibre volume fraction Vf. (b) The experimental fibre
efficiency factor for the different mixes.

CHALMERS, Civil and Environmental Engineering 62
The results from the wedge-splitting tests are presented in Figure 48, which shows the
splitting load versus CMOD curve (a) and the dissipated energy (b). As can be seen,
when the volume fraction of fibres increases there is a significant increase in both the
splitting load and the dissipated energy, also presented in Figure 49(a). In Figure 49(b)
the dissipated energy at different CMODs has been plotted against the actual number of
fibres and, as can be seen, there appears to be a fairly linear relationship between the
dissipated energy and the number of fibres.
0
2 000
4 000
6 000
8 000
0.0 2.0 4.0 6.0
CMOD [mm]
1.0%
0.25%
0.375
%
0.75%
0.625
%0.50%
0%
Sp
litt
ing
Lo
ad [
N]
0
1 000
2 000
3 000
4 000
5 000
0.0 2.0 4.0 6.0
CMOD [mm]D
issi
pat
ed E
ner
gy
, G
f, [
Nm
/m2]
0%
1.0%
0.75%
0.25%
(a) (b)
Figure 48. Effect of fibre volume fraction (0% Vf 1.0%): (a) on the splitting
load–CMOD curve, and (b) on the dissipated energy.
0
1 000
2 000
3 000
4 000
5 000
0.00 0.25 0.50 0.75 1.00 1.25
V f [%]
Dis
sip
ated
En
erg
y,
Gf, [
Nm
/m2]
6.0mm
5.0mm
4.0mm
3.0mm
2.0mm
CMOD =
1.0mm
0
1 000
2 000
3 000
4 000
5 000
0.0 1.0 2.0 3.0
Number of fibres per cm2 [no./cm
2]
Dis
sip
ated
En
erg
y,
Gf, [
Nm
/m2]
4.0mm; R2=0.99
2.0mm; R2=0.99
1.0mm; R2=1.00
CMOD = ; R2=
6.0mm; R2=0.98
(a) (b)
Figure 49. (a) Effect of fibre volume fraction (0.25% Vf 1.0%) on the dissipated
energy at different CMODs. (b) Dissipated energy at different CMODs
plotted against the actual number of fibres per cm2.
To investigate the effect on the -w relationship, inverse analyses were conducted and a
bi-linear -w relationship (see Figure 43) was determined through use of a Matlab
program, developed at DTU by Østergaard (2003) – see Paper V. The results of the
inverse analyses are presented in Figure 50 and Figure 51. Figure 50(a) shows the
relation between the number of fibres and the b2 parameter in the bi-linear relationship
(see Figure 43), which has a R2 value of 0.988. In Figure 50(b) the tensile stress at
different crack openings has been plotted against the number of fibres, which also
indicates a linear relationship. Finally, Figure 51 shows the adjusted -w relationships
and it can be seen that the agreement is fairly good for most of the investigated mixes,
with the exception of the mix with Vf = 0.5%. Hence, the results of this investigation
seem to confirm that it may be acceptable to assume a linear relationship between the

CHALMERS, Civil and Environmental Engineering 63
number of fibres and the -w relationship, particularly for small crack openings
(< 1mm), and that the -w relationships can be adjusted accordingly. However, it should
be noted that the experiments were carried out using only three specimens, for which
the coefficient of variance was between 5 and 20%, and only one type of concrete and
fibre type was used.
y = 0.278x + 0.257
R2 = 0.988
0.0
0.2
0.4
0.6
0.8
1.0
0.0 0.5 1.0 1.5 2.0 2.5 3.0
Number of fibres per cm2 [no. / cm
2]
b2 [
-]
R2 = 0.998
R2 = 0.996
R2 = 0.969
0.0
1.0
2.0
3.0
4.0
0.0 0.5 1.0 1.5 2.0 2.5 3.0
Number of fibres per cm2 [no. / cm
2]
Ten
sile
str
ess
[MP
a]
w = 2.0mm
w = 1.0mm
w = 0.5mm
(a) (b)
Figure 50. Effect of the number of fibres on the -w relationship: (a) on the b2
parameter in the bi-linear stress-crack opening relationship and (b) on
the tensile stress at different crack openings.
0.0
1.0
2.0
3.0
4.0
0.0 0.5 1.0 1.5 2.0
Crack opening [mm]
Ten
sile
Str
ess
[MP
a]
w/b 0.55
RC-65/350.625%
0.25% 0.375% 0.50%
0.75%
1.0%
Figure 51. Effect of fibre volume fraction (0% Vf 1.0%) on the -w relationship.
4.3 Investigation of fracture test methods
Recently RILEM technical committee 162-TDF, “Test and design methods for steel
fibre-reinforced concrete”, published recommendations for two test methods for steel
fibre-reinforced concrete (SFRC); see RILEM TC 162-TDF (2001) and (2002b). The
proposed test methods are a uni-axial tension test (UTT) and a three-point bending test
(3PBT) on notched beams. In Papers III and V these test methods were investigated and
compared with an alternative test method called the wedge-splitting test (WST) method,
for which two different specimen sizes have been investigated. Furthermore, in Paper
IV the WST method was investigated in a Round Robin study. Inverse analyses have
been used to obtain -w relationships for the 3PBT and the WST. For the comparison of
the three test methods, five different concrete mixes were used in this investigation. The
varied parameters were (see Table 10): the volume fraction of fibres, Vf; the water
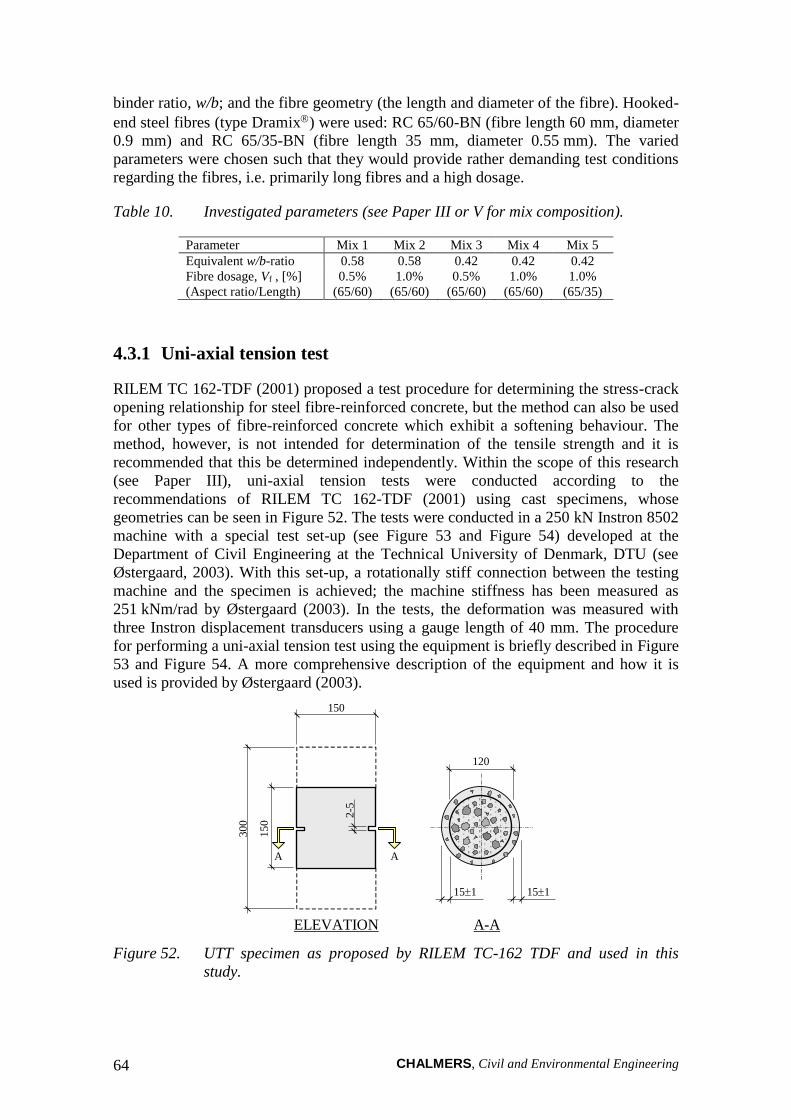
CHALMERS, Civil and Environmental Engineering 64
binder ratio, w/b; and the fibre geometry (the length and diameter of the fibre). Hooked-
end steel fibres (type Dramix) were used: RC 65/60-BN (fibre length 60 mm, diameter
0.9 mm) and RC 65/35-BN (fibre length 35 mm, diameter 0.55 mm). The varied
parameters were chosen such that they would provide rather demanding test conditions
regarding the fibres, i.e. primarily long fibres and a high dosage.
Table 10. Investigated parameters (see Paper III or V for mix composition).
Parameter Mix 1 Mix 2 Mix 3 Mix 4 Mix 5
Equivalent w/b-ratio 0.58 0.58 0.42 0.42 0.42
Fibre dosage, Vf , [%]
(Aspect ratio/Length)
0.5%
(65/60)
1.0%
(65/60)
0.5%
(65/60)
1.0%
(65/60)
1.0%
(65/35)
4.3.1 Uni-axial tension test
RILEM TC 162-TDF (2001) proposed a test procedure for determining the stress-crack
opening relationship for steel fibre-reinforced concrete, but the method can also be used
for other types of fibre-reinforced concrete which exhibit a softening behaviour. The
method, however, is not intended for determination of the tensile strength and it is
recommended that this be determined independently. Within the scope of this research
(see Paper III), uni-axial tension tests were conducted according to the
recommendations of RILEM TC 162-TDF (2001) using cast specimens, whose
geometries can be seen in Figure 52. The tests were conducted in a 250 kN Instron 8502
machine with a special test set-up (see Figure 53 and Figure 54) developed at the
Department of Civil Engineering at the Technical University of Denmark, DTU (see
Østergaard, 2003). With this set-up, a rotationally stiff connection between the testing
machine and the specimen is achieved; the machine stiffness has been measured as
251 kNm/rad by Østergaard (2003). In the tests, the deformation was measured with
three Instron displacement transducers using a gauge length of 40 mm. The procedure
for performing a uni-axial tension test using the equipment is briefly described in Figure
53 and Figure 54. A more comprehensive description of the equipment and how it is
used is provided by Østergaard (2003).
150
150
300
2-5
151
ELEVATION A-A
A A
120
151
Figure 52. UTT specimen as proposed by RILEM TC-162 TDF and used in this
study.
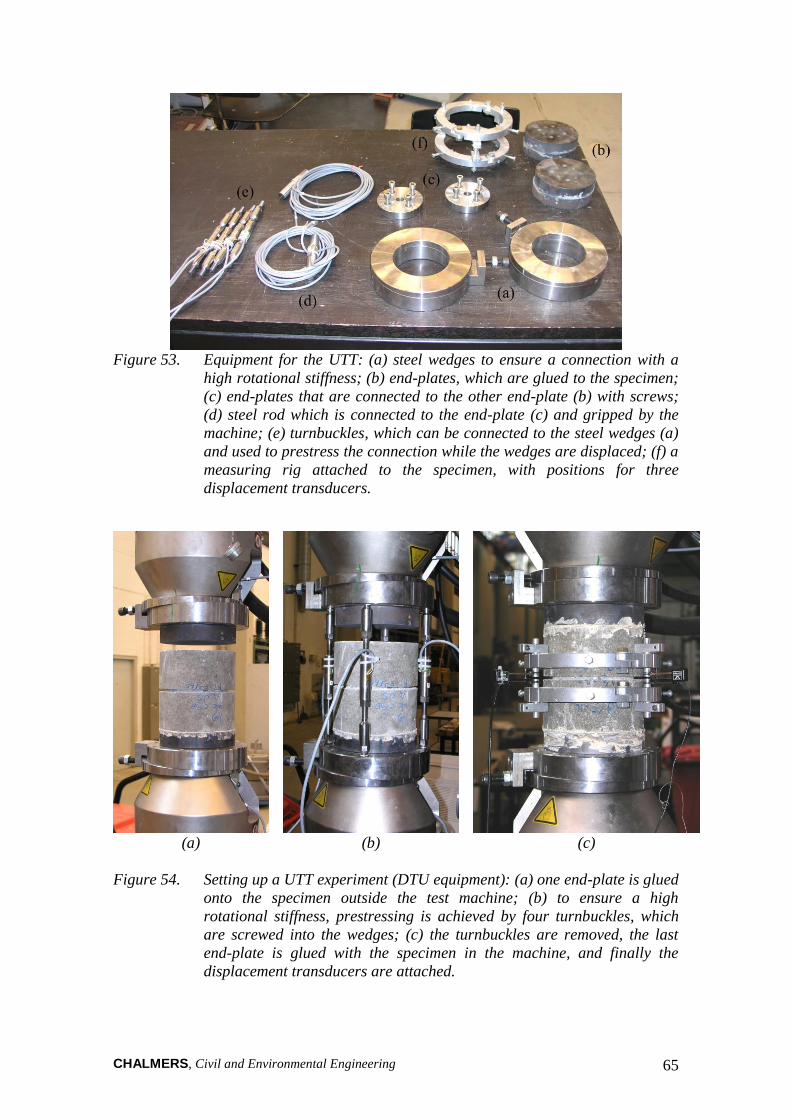
CHALMERS, Civil and Environmental Engineering 65
Figure 53. Equipment for the UTT: (a) steel wedges to ensure a connection with a
high rotational stiffness; (b) end-plates, which are glued to the specimen;
(c) end-plates that are connected to the other end-plate (b) with screws;
(d) steel rod which is connected to the end-plate (c) and gripped by the
machine; (e) turnbuckles, which can be connected to the steel wedges (a)
and used to prestress the connection while the wedges are displaced; (f) a
measuring rig attached to the specimen, with positions for three
displacement transducers.
(a) (b) (c)
Figure 54. Setting up a UTT experiment (DTU equipment): (a) one end-plate is glued
onto the specimen outside the test machine; (b) to ensure a high
rotational stiffness, prestressing is achieved by four turnbuckles, which
are screwed into the wedges; (c) the turnbuckles are removed, the last
end-plate is glued with the specimen in the machine, and finally the
displacement transducers are attached.

CHALMERS, Civil and Environmental Engineering 66
Typical results from the uni-axial tension tests are presented in Figure 55 and Figure 56,
which show both the stress–deformation response and the stress-crack opening
relationship. As can be seen, in the pre-peak region the response is linear up to a stress
level of about 70% of the peak-stress where the curve deviates and a non-linear
behaviour can be observed. The results of these experiments suggest that the magnitude
of the deformation in this pre-peak non-linear zone is quite small, somewhere between 2
and 5 m. After the peak-stress a softening response is observed, but the fibre-
reinforced concretes are capable of transferring stresses for large crack openings; see
e.g. Mix 4 in Figure 56(b).
0.0
1.0
2.0
3.0
0 0.01 0.02 0.03
Deformation [mm]
Ten
sile
str
ess
[M
Pa]
Mix 1: w/b 0.58
Mix 3: w/b 0.42
0.5% RC-65/60
Mix 1
Mix 3
0.0
1.0
2.0
3.0
0.0 0.5 1.0 1.5 2.0
Crack opening, w , [mm]
Ten
sile
str
ess
[M
Pa]
Mix 3
Mix 1
(a) (b)
Figure 55. Typical results from the UTT experiments (see Paper III): (a) stress–
deformation response in the pre- and immediate post-peak behaviour
(result from one specimen); (b) stress-crack opening relationship.
0
1
2
3
0.00 0.01 0.02 0.03
Deformation [mm]
Ten
sile
str
ess
[M
Pa]
Mix 2: w/b 0.58
& Mix 4: w/b 0.42
1.0% RC-65/60
Mix 5: w/b 0.42
1.0% RC-65/35
Mix 2
Mix 5
Mix 4
0.0
1.0
2.0
3.0
0.0 0.5 1.0 1.5 2.0
Crack opening, w , [mm]
Ten
sile
str
ess
[M
Pa]
Mix 2
Mix 5
Mix 4
(a) (b)
Figure 56. Typical results from the UTT experiments (see Paper III): (a) stress–
deformation response in the pre- and immediate post-peak behaviour
(result from one specimen); (b) stress-crack opening relationship.

CHALMERS, Civil and Environmental Engineering 67
4.3.2 Three-point bending test on notched beams
A three-point bending test on notched beams was suggested by RILEM TC 162-TDF
(2002b); the intended use is for evaluation of the tensile behaviour of steel-fibre
reinforced concrete. The test method can be used for determination of:
the limit of proportionality (LOP);
equivalent flexural tensile strengths; and
residual flexural tensile strengths.
The result from the test method can be used together with the design method based on a
stress–strain approach which has been proposed by RILEM TC 162-TDF (2000).
Material properties are determined from the test result and a stress–strain diagram can
be defined. The specimen geometry and the loading conditions can be seen in Figure 57.
The suggested standard test specimen is not intended for concrete with steel fibres
longer than 60 mm and/or aggregates larger than 32 mm. The beams are cast in moulds
and after curing the beams are notched using wet sawing.
550
250 25
15
0 7
5
25
h =
15
0
b = 150
F
hsp
= 1
25
notch
25
A–A
A 250 25
A
75
Figure 57. Test set-up for the three-point bending test on notched beams according
to RILEM TC 162-TDF.
Within the scope of this research, three-point bending tests were conducted according to
the recommendations of RILEM TC 162-TDF (2002b) having a geometry according to
Figure 57. The specimens were tested in an Instron 6025 universal testing machine, see
Figure 58, with a capacity of 100 kN. The crack mouth opening displacement, CMOD,
was measured at a distance of 8 mm from the bottom of the beam with an Instron clip
gauge, having a 10 mm gauge length and a maximum travel of 5 mm. The net load-
point deflection was measured by two LVDTs. The tests were performed under CMOD
control. For each mix, five specimens were tested.

CHALMERS, Civil and Environmental Engineering 68
Figure 58. Photo of the test set-up used in the experiments.
4.3.3 Wedge-splitting test method
The wedge splitting test (WST) method, originally proposed by Linsbauer and Tschegg
(1986) and later developed by Brühwiler and Wittmann (1990), has also been used for
fracture testing. The method is interesting since it does not require sophisticated test
equipment; the test is stable and mechanical testing machines with a constant crosshead
displacement can be used. Furthermore, a standard cube specimen is used, but the test
can also be performed on core-drilled samples. Researchers have used the WST method
extensively, and recently there has been increased interest in it. The method has proved
to be successful for the determination of fracture properties of ordinary concrete, at
early age and later (see Østergaard, 2003, Abdalla and Karihaloo, 2003, and Karihaloo
et al. 2004), and for autoclaved aerated concrete (Trunk et al., 1999). In addition, the
method has been used for the study of fatigue crack growth in high-strength concrete
(Kim and Kim, 1999), for determining fracture behaviour of polypropylene fibre-
reinforced concrete (Elser et al., 1996), and for determination of stress-crack opening
relationships of interfaces between precast and in-situ concrete (see e.g. Lundgren et al.
2005) and between steel and concrete (see e.g. Walter et al., 2005). For steel fibre-
reinforced concrete, a small number of references can be found; Meda et al. (2001) used
the WST method to determine a bi-linear stress-crack opening relationship through
inverse analysis. Nemegeer et al. (2003) used the WST method to investigate the
corrosion resistance of cracked fibre-reinforced concrete.
In Figure 59 the specimen geometry and loading procedure are clarified. The specimen
is equipped with a groove (to be able to apply the splitting load) and a starter notch (to
ensure the crack propagation). Two steel platens with roller bearings are placed partly
on top of the specimen, partly into the groove, and through a wedging device the
splitting force, Fsp, is applied. During a test, the load in the vertical direction, Fv, and the
crack mouth opening displacement (CMOD) are monitored. The applied horizontal
splitting force, Fsp, is related to the vertical compressive load, Fv, through (see RILEM
Report 5):
cot1
tan1
tan2
v
sp
FF
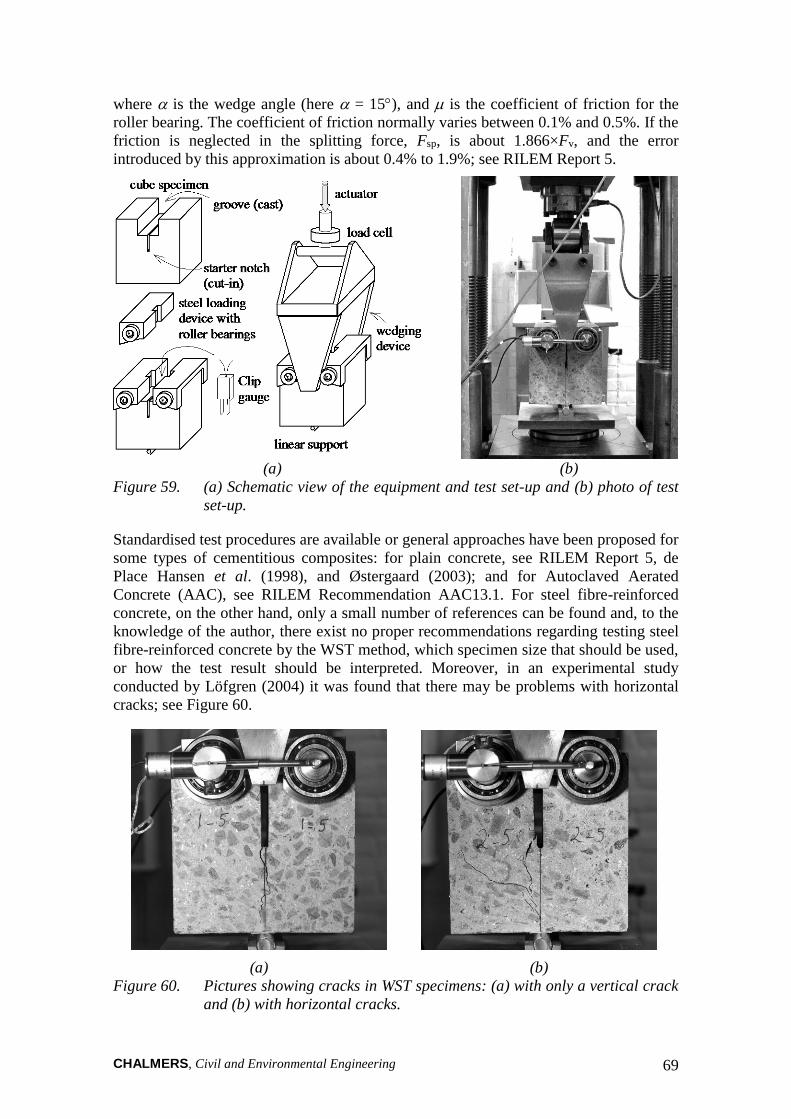
CHALMERS, Civil and Environmental Engineering 69
where is the wedge angle (here = 15), and is the coefficient of friction for the
roller bearing. The coefficient of friction normally varies between 0.1% and 0.5%. If the
friction is neglected in the splitting force, Fsp, is about 1.866×Fv, and the error
introduced by this approximation is about 0.4% to 1.9%; see RILEM Report 5.
(a) (b)
Figure 59. (a) Schematic view of the equipment and test set-up and (b) photo of test
set-up.
Standardised test procedures are available or general approaches have been proposed for
some types of cementitious composites: for plain concrete, see RILEM Report 5, de
Place Hansen et al. (1998), and Østergaard (2003); and for Autoclaved Aerated
Concrete (AAC), see RILEM Recommendation AAC13.1. For steel fibre-reinforced
concrete, on the other hand, only a small number of references can be found and, to the
knowledge of the author, there exist no proper recommendations regarding testing steel
fibre-reinforced concrete by the WST method, which specimen size that should be used,
or how the test result should be interpreted. Moreover, in an experimental study
conducted by Löfgren (2004) it was found that there may be problems with horizontal
cracks; see Figure 60.
(a) (b)
Figure 60. Pictures showing cracks in WST specimens: (a) with only a vertical crack
and (b) with horizontal cracks.
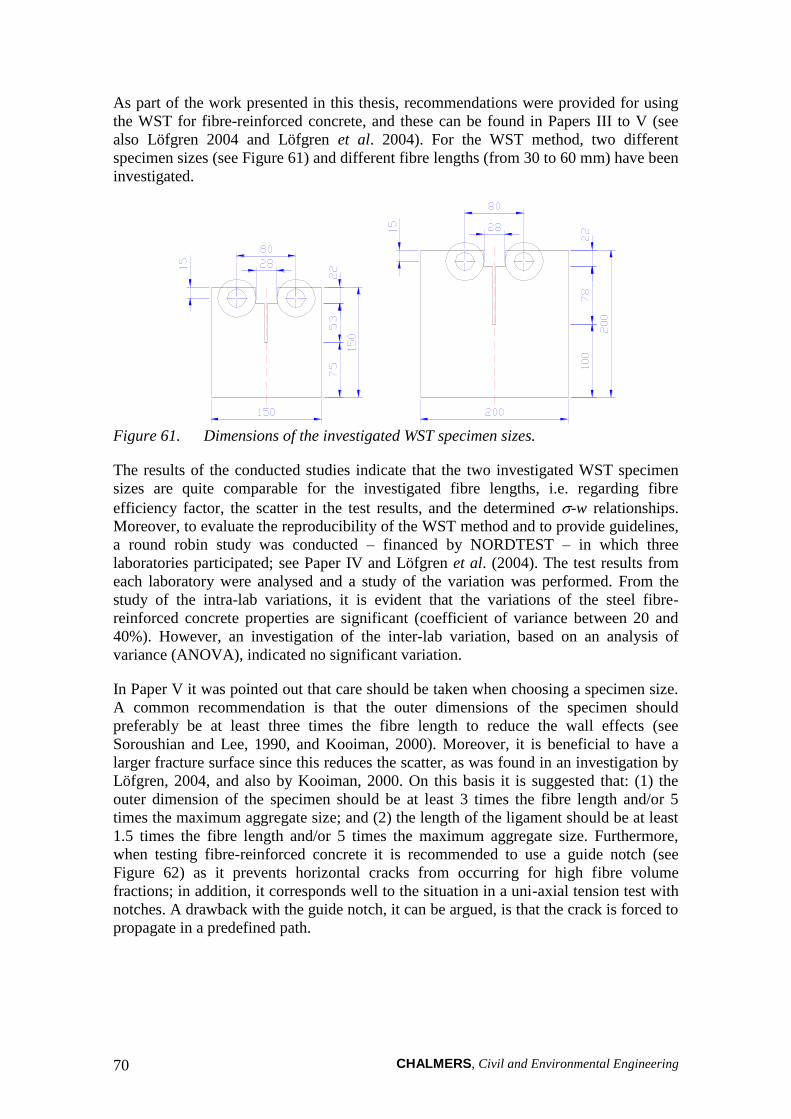
CHALMERS, Civil and Environmental Engineering 70
As part of the work presented in this thesis, recommendations were provided for using
the WST for fibre-reinforced concrete, and these can be found in Papers III to V (see
also Löfgren 2004 and Löfgren et al. 2004). For the WST method, two different
specimen sizes (see Figure 61) and different fibre lengths (from 30 to 60 mm) have been
investigated.
Figure 61. Dimensions of the investigated WST specimen sizes.
The results of the conducted studies indicate that the two investigated WST specimen
sizes are quite comparable for the investigated fibre lengths, i.e. regarding fibre
efficiency factor, the scatter in the test results, and the determined -w relationships.
Moreover, to evaluate the reproducibility of the WST method and to provide guidelines,
a round robin study was conducted – financed by NORDTEST – in which three
laboratories participated; see Paper IV and Löfgren et al. (2004). The test results from
each laboratory were analysed and a study of the variation was performed. From the
study of the intra-lab variations, it is evident that the variations of the steel fibre-
reinforced concrete properties are significant (coefficient of variance between 20 and
40%). However, an investigation of the inter-lab variation, based on an analysis of
variance (ANOVA), indicated no significant variation.
In Paper V it was pointed out that care should be taken when choosing a specimen size.
A common recommendation is that the outer dimensions of the specimen should
preferably be at least three times the fibre length to reduce the wall effects (see
Soroushian and Lee, 1990, and Kooiman, 2000). Moreover, it is beneficial to have a
larger fracture surface since this reduces the scatter, as was found in an investigation by
Löfgren, 2004, and also by Kooiman, 2000. On this basis it is suggested that: (1) the
outer dimension of the specimen should be at least 3 times the fibre length and/or 5
times the maximum aggregate size; and (2) the length of the ligament should be at least
1.5 times the fibre length and/or 5 times the maximum aggregate size. Furthermore,
when testing fibre-reinforced concrete it is recommended to use a guide notch (see
Figure 62) as it prevents horizontal cracks from occurring for high fibre volume
fractions; in addition, it corresponds well to the situation in a uni-axial tension test with
notches. A drawback with the guide notch, it can be argued, is that the crack is forced to
propagate in a predefined path.

CHALMERS, Civil and Environmental Engineering 71
starter
notch
0.2
5 b
Front view Top view
guide notch
guide notch
0.5
b
0.2
5 b
b
Figure 62. Specimen with notches on the sides of the specimen to prevent horizontal
cracks.
To investigate the problems with horizontal cracks, analyses have been carried out using
the commercially available program package DIANA, version 8.1 (see Löfgren, 2004).
In the analysis all elements outside the crack were assumed to have linear elastic and
isotropic behaviour and the crack was modelled with a discrete crack, using so-called
non-linear interface elements. The interface elements can be considered as non-linear
springs describing the Mode I fracture properties. The stress distribution at peak load,
for a specimen size of 150150150 mm3, is presented in Figure 63. As can be seen,
there exists a region outside the assumed fracture plane with tensile stresses as high as
the tensile strength of 3.0 MPa. This is both perpendicular and parallel to the crack. In
fact, the principal stresses, close to the crack plane, are parallel to the crack. Similar
results from FE analysis have been found by Leite et al. (2004), who analysed WST
experiments, and Planas et al. (1992) and Olson (1994) who analysed notched beams.
1.0
-1.0 -3.0
1.0
-0.14
-1.0
-0.14 0.14
-0.14
0.14 3.0
3.0 2.4
(b) (a)
Figure 63. Results from analysis of a 150 mm WST specimen, stresses at peak load:
(a) stresses perpendicular to the crack, (b) stresses parallel to the crack.
Analysis conducted for a fibre-reinforced concrete (w/c = 0.55, Vf =
0.75%) with a tensile strength of roughly 3.0 MPa. From Löfgren (2004).

CHALMERS, Civil and Environmental Engineering 72
Furthermore, experimental investigations of the effect of the guide notch were
conducted in a series of tests. An initial pilot study was undertaken, using specimens
100100100 mm3, on a FRC with volume fraction of 1.0% and fibres with a length of
35 mm. For this investigation three different cases were considered, using three
specimens for each (see Figure 64): (a) with a deep guide notch (depth approximately
20 mm); (b) with a shallow guide notch (depth approximately 10 mm); and (c) without a
guide notch. In Figure 65(a), a comparison is made between the splitting load–CMOD
curves, and in Figure 65(b) the dissipated energy is compared. The results suggest that a
guide notch may prevent the horizontal cracks from appearing (see Figure 64), but the
dissipated energy increased by roughly 10 to 20% with a guide notch.
(a) (b) (c)
Figure 64. Pictures showing cracks in WST specimens (specimen size 100100100
mm3): (a) with a deep guide notch; (b) with a shallow guide notch; and
(c) with no guide notch.
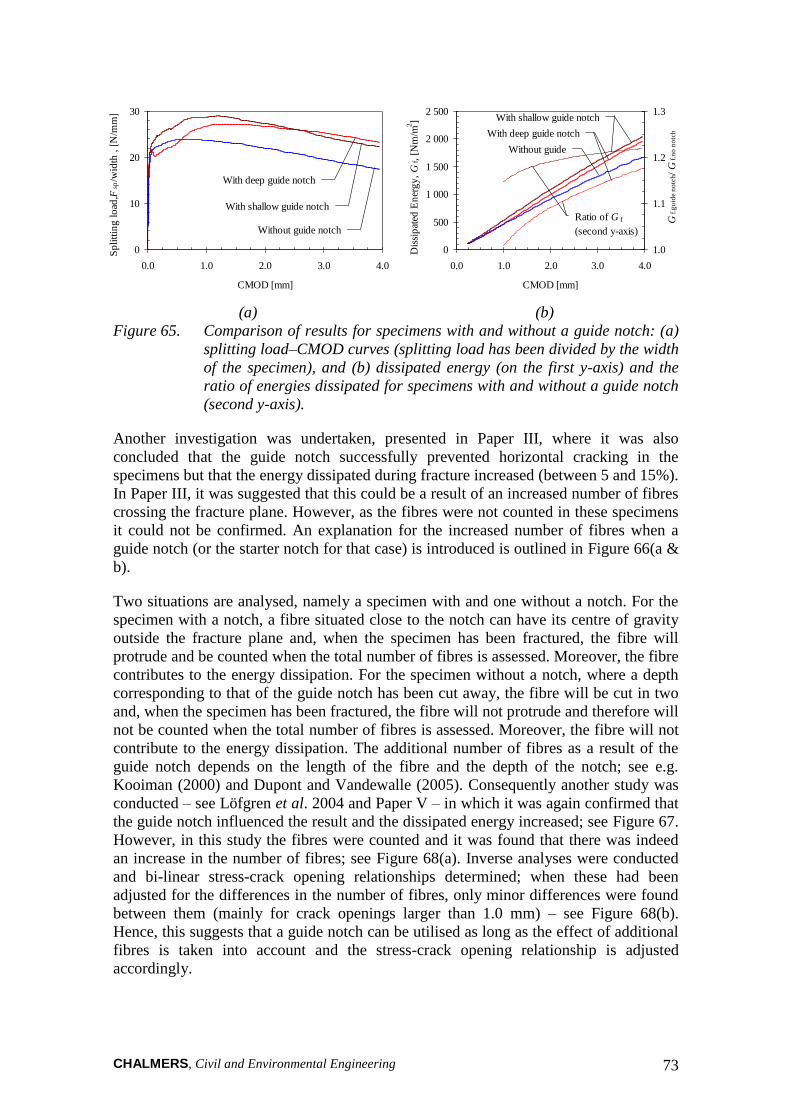
CHALMERS, Civil and Environmental Engineering 73
0
10
20
30
0.0 1.0 2.0 3.0 4.0
CMOD [mm]
Without guide notch
With shallow guide notch
With deep guide notch
Sp
litt
ing
lo
ad, F
sp/w
idth
, [
N/m
m]
0
500
1 000
1 500
2 000
2 500
0.0 1.0 2.0 3.0 4.0
CMOD [mm]
1.0
1.1
1.2
1.3
Gf.
gu
ide n
otc
h/
Gf.
no
no
tch
With shallow guide notch
With deep guide notch
Without guide
notch
Dis
sip
ated
En
erg
y,
Gf, [
Nm
/m2]
Ratio of G f
(second y-axis)
(a) (b)
Figure 65. Comparison of results for specimens with and without a guide notch: (a)
splitting load–CMOD curves (splitting load has been divided by the width
of the specimen), and (b) dissipated energy (on the first y-axis) and the
ratio of energies dissipated for specimens with and without a guide notch
(second y-axis).
Another investigation was undertaken, presented in Paper III, where it was also
concluded that the guide notch successfully prevented horizontal cracking in the
specimens but that the energy dissipated during fracture increased (between 5 and 15%).
In Paper III, it was suggested that this could be a result of an increased number of fibres
crossing the fracture plane. However, as the fibres were not counted in these specimens
it could not be confirmed. An explanation for the increased number of fibres when a
guide notch (or the starter notch for that case) is introduced is outlined in Figure 66(a &
b).
Two situations are analysed, namely a specimen with and one without a notch. For the
specimen with a notch, a fibre situated close to the notch can have its centre of gravity
outside the fracture plane and, when the specimen has been fractured, the fibre will
protrude and be counted when the total number of fibres is assessed. Moreover, the fibre
contributes to the energy dissipation. For the specimen without a notch, where a depth
corresponding to that of the guide notch has been cut away, the fibre will be cut in two
and, when the specimen has been fractured, the fibre will not protrude and therefore will
not be counted when the total number of fibres is assessed. Moreover, the fibre will not
contribute to the energy dissipation. The additional number of fibres as a result of the
guide notch depends on the length of the fibre and the depth of the notch; see e.g.
Kooiman (2000) and Dupont and Vandewalle (2005). Consequently another study was
conducted – see Löfgren et al. 2004 and Paper V – in which it was again confirmed that
the guide notch influenced the result and the dissipated energy increased; see Figure 67.
However, in this study the fibres were counted and it was found that there was indeed
an increase in the number of fibres; see Figure 68(a). Inverse analyses were conducted
and bi-linear stress-crack opening relationships determined; when these had been
adjusted for the differences in the number of fibres, only minor differences were found
between them (mainly for crack openings larger than 1.0 mm) – see Figure 68(b).
Hence, this suggests that a guide notch can be utilised as long as the effect of additional
fibres is taken into account and the stress-crack opening relationship is adjusted
accordingly.

CHALMERS, Civil and Environmental Engineering 74
Fracture
plane
Fibre with centre
of gravity outside
fracture plane
No guide notch
Fracture
plane
Fibre cut in two
when sawing
(a)
Guide notch
(b)
Figure 66. (a) Specimen with guide notch. (b) Specimen without guide notch, but
where a depth corresponding to that of the guide notch has been cut
away.
0
1 000
2 000
3 000
0.0 1.0 2.0 3.0 4.0
CMOD [mm]
Spec. with guide notch
Sp
littin
g lo
ad,
Fsp
, [N
]
Spec. without guide notch
0
200
400
600
800
0.0 1.0 2.0 3.0 4.0
CMOD [mm]
1.0
1.1
1.2
1.3
Spec. with guide notch
Dis
sip
ate
d e
nerg
y,
Gf ,
[Nm
/m2]
Spec. without guide notch
Gf.
guid
e n
otc
h/ G
f.n
o n
otc
h
Ratio of G f
(second y-axis)
(a) (b)
Figure 67. Comparison of results for specimens with and without a guide notch: (a)
splitting load–CMOD curves and (b) dissipated energy. See Löfgren et al.
(2004).
0.94
0.74
0.0
0.4
0.8
1.2
Without Guide
notch
With Guide
notch
No
. fi
bre
s /
cm
2
Max
Average
Min
0.0
0.5
1.0
1.5
2.0
2.5
0.0 0.5 1.0 1.5 2.0 2.5
Crack opening [mm]
Ten
sile
Str
ess
[M
Pa]
w/c 0.55 & 0.51% RC-65/35
WST 200
Spec. with a guide notch
Spec. without a guide notch
(a) (b)
Figure 68. Comparison of results for specimens with and without a guide notch: (a)
number of fibres and (b) stress-crack opening relationship (adjusted for
number of fibres). See Löfgren et al. (2004).
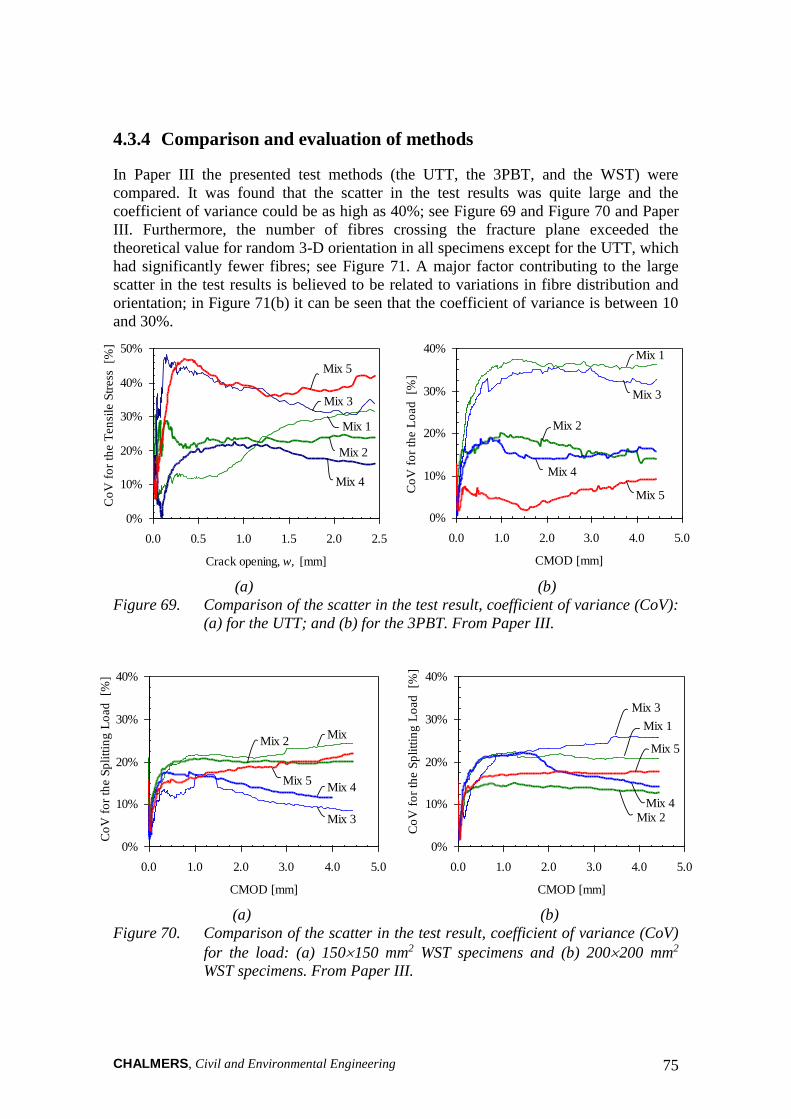
CHALMERS, Civil and Environmental Engineering 75
4.3.4 Comparison and evaluation of methods
In Paper III the presented test methods (the UTT, the 3PBT, and the WST) were
compared. It was found that the scatter in the test results was quite large and the
coefficient of variance could be as high as 40%; see Figure 69 and Figure 70 and Paper
III. Furthermore, the number of fibres crossing the fracture plane exceeded the
theoretical value for random 3-D orientation in all specimens except for the UTT, which
had significantly fewer fibres; see Figure 71. A major factor contributing to the large
scatter in the test results is believed to be related to variations in fibre distribution and
orientation; in Figure 71(b) it can be seen that the coefficient of variance is between 10
and 30%.
0%
10%
20%
30%
40%
50%
0.0 0.5 1.0 1.5 2.0 2.5
Crack opening, w, [mm]
Mix 3
Mix 5
Mix 2
Mix 4
Mix 1
Co
V f
or
the T
en
sile
Str
ess
[%
]
0%
10%
20%
30%
40%
0.0 1.0 2.0 3.0 4.0 5.0
CMOD [mm]
Mix 1
Mix 3
Mix 5
Mix 4
Mix 2
Co
V f
or
the L
oad
[%
]
(a) (b)
Figure 69. Comparison of the scatter in the test result, coefficient of variance (CoV):
(a) for the UTT; and (b) for the 3PBT. From Paper III.
0%
10%
20%
30%
40%
0.0 1.0 2.0 3.0 4.0 5.0
CMOD [mm]
Mix 3
Mix 4
Mix
Mix 5
Mix 2
Co
V f
or
the S
pli
ttin
g L
oad
[%
]
0%
10%
20%
30%
40%
0.0 1.0 2.0 3.0 4.0 5.0
CMOD [mm]
Mix 2
Mix 3
Mix 1
Mix 4
Mix 5
Co
V f
or
the S
pli
ttin
g L
oad
[%
]
(a) (b)
Figure 70. Comparison of the scatter in the test result, coefficient of variance (CoV)
for the load: (a) 150150 mm2 WST specimens and (b) 200200 mm2
WST specimens. From Paper III.

CHALMERS, Civil and Environmental Engineering 76
0.0
0.1
0.2
0.3
0.4
0.5
0.6
0.7
0.8
Mix 1 Mix 2 Mix 3 Mix 4 Mix 5
Fib
re e
ffic
ien
cy f
acto
r,
b.e
xp
, [-
]WST-S
WST-L
3PBT
UTT
b.3D = 0.5
b.2D = 0.64
0%
10%
20%
30%
40%
Mix 1 Mix 2 Mix 3 Mix 4 Mix 5
WST-S
WST-L
3PBT
UTT
Co
V f
or
nu
mb
er
of
fib
res
[%]
(a) (b)
Figure 71. Comparison of the experimental fibre efficiency factor for the specimens.
(b) The coefficient of variance, CoV, for the number of fibres. From
Paper III.
When comparing the -w relationship obtained from the inverse analyses and the UTT
– presented in Figure 72(a) to Figure 76(a) and in Paper III – it can be observed that
there are differences between the test methods and the agreement is poor for the UTT.
This poor agreement is partly due to the differences in the number of fibres, expressed
as the experimentally determined fibre efficiency factor. However, if the differences in
that factor are taken into account and the -w relationship is adjusted accordingly it can
be noticed that the agreement is improved; see Figure 72(b) to Figure 76(b). This
adjustment seems to give a better agreement for most mixes, except the 3PBT and
Mixes 2 and 4. With the modification, also the result from the UTT seems to give a
better agreement, although the number of fibres was probably too few and their
orientation may not have been representative to produce a stress crack-opening
relationship that could be adjusted. That the 3PBT does not always fit in and seems to
give higher bridging stresses may be due to the problems of diffuse and multiple
cracking in the specimens with a high fibre content (see Figure 77).
0.0
1.0
2.0
3.0
0.0 0.5 1.0 1.5 2.0 2.5
Crack opening [mm]
Ten
sile
Str
ess
[MP
a]
Mix 1 WST-S
Mix 1 WST-L
Mix 1 3PBT
Mix 1 UTT
Original curve
0.0
1.0
2.0
3.0
0.0 0.5 1.0 1.5 2.0 2.5
Crack opening [mm]
Ten
sile
Str
ess
[MP
a]
Mix 1 WST-S
Mix 1 WST-L
Mix 1 3PBT
Mix 1 UTT
Adjusted curve
(a) (b)
Figure 72. Comparison of the -w relationship: (a) original curve and (b) curve
adjusted by considering the number of fibres in the specimens.
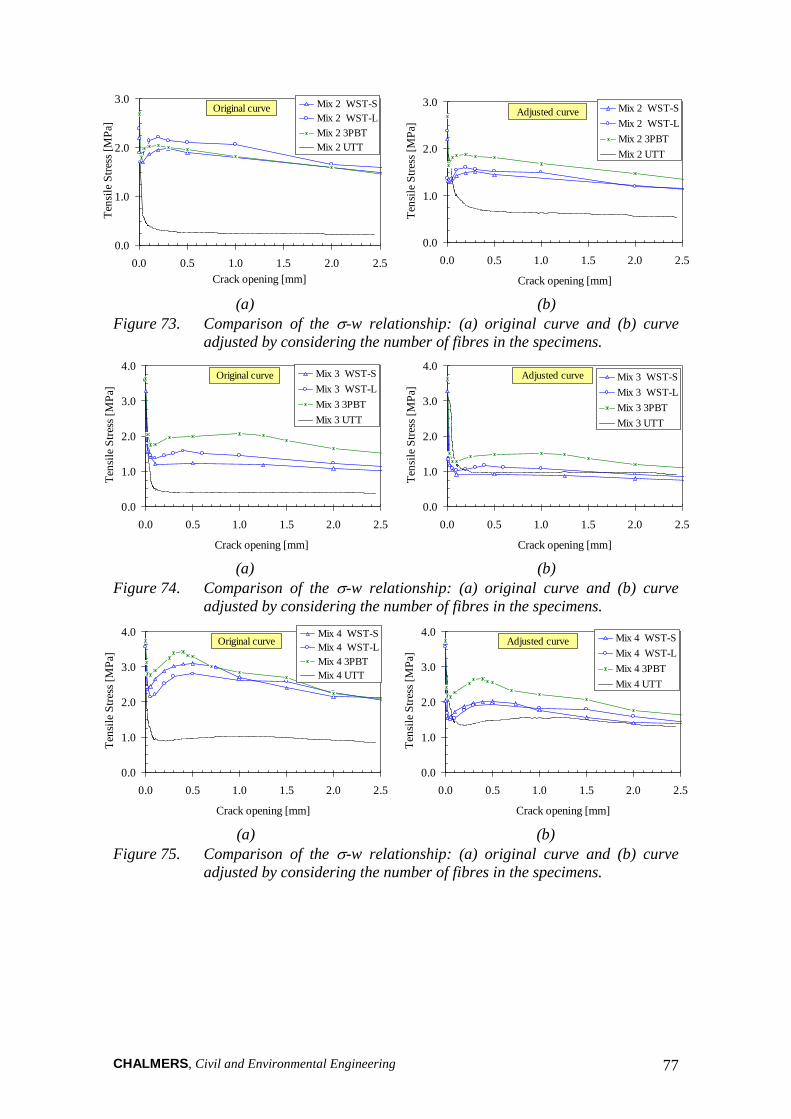
CHALMERS, Civil and Environmental Engineering 77
0.0
1.0
2.0
3.0
0.0 0.5 1.0 1.5 2.0 2.5
Crack opening [mm]
Ten
sile
Str
ess
[MP
a]Mix 2 WST-S
Mix 2 WST-L
Mix 2 3PBT
Mix 2 UTT
Original curve
0.0
1.0
2.0
3.0
0.0 0.5 1.0 1.5 2.0 2.5
Crack opening [mm]
Ten
sile
Str
ess
[MP
a]
Mix 2 WST-S
Mix 2 WST-L
Mix 2 3PBT
Mix 2 UTT
Adjusted curve
(a) (b)
Figure 73. Comparison of the -w relationship: (a) original curve and (b) curve
adjusted by considering the number of fibres in the specimens.
0.0
1.0
2.0
3.0
4.0
0.0 0.5 1.0 1.5 2.0 2.5
Crack opening [mm]
Ten
sile
Str
ess
[MP
a]
Mix 3 WST-S
Mix 3 WST-L
Mix 3 3PBT
Mix 3 UTT
Original curve
0.0
1.0
2.0
3.0
4.0
0.0 0.5 1.0 1.5 2.0 2.5
Crack opening [mm]
Ten
sile
Str
ess
[MP
a]
Mix 3 WST-S
Mix 3 WST-L
Mix 3 3PBT
Mix 3 UTT
Adjusted curve
(a) (b)
Figure 74. Comparison of the -w relationship: (a) original curve and (b) curve
adjusted by considering the number of fibres in the specimens.
0.0
1.0
2.0
3.0
4.0
0.0 0.5 1.0 1.5 2.0 2.5
Crack opening [mm]
Ten
sile
Str
ess
[MP
a]
Mix 4 WST-S
Mix 4 WST-L
Mix 4 3PBT
Mix 4 UTT
Original curve
0.0
1.0
2.0
3.0
4.0
0.0 0.5 1.0 1.5 2.0 2.5
Crack opening [mm]
Ten
sile
Str
ess
[MP
a]
Mix 4 WST-S
Mix 4 WST-L
Mix 4 3PBT
Mix 4 UTT
Adjusted curve
(a) (b)
Figure 75. Comparison of the -w relationship: (a) original curve and (b) curve
adjusted by considering the number of fibres in the specimens.
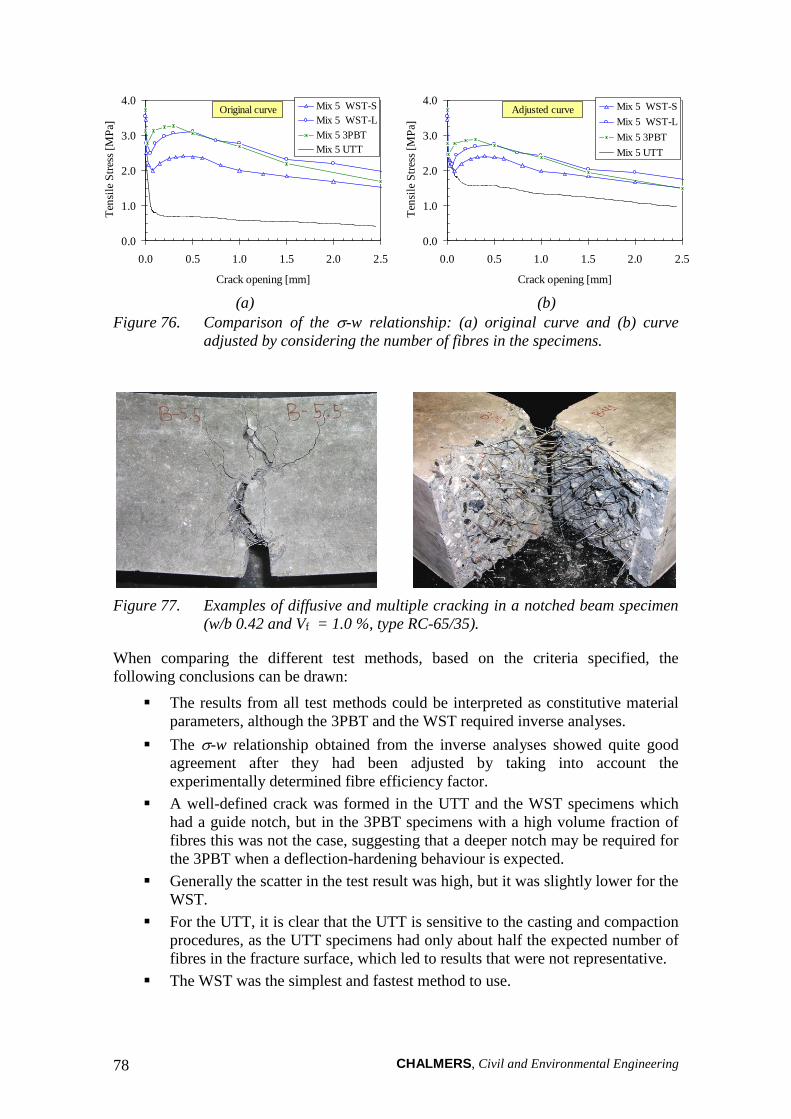
CHALMERS, Civil and Environmental Engineering 78
0.0
1.0
2.0
3.0
4.0
0.0 0.5 1.0 1.5 2.0 2.5
Crack opening [mm]
Ten
sile
Str
ess
[MP
a]Mix 5 WST-S
Mix 5 WST-L
Mix 5 3PBT
Mix 5 UTT
Original curve
0.0
1.0
2.0
3.0
4.0
0.0 0.5 1.0 1.5 2.0 2.5
Crack opening [mm]
Ten
sile
Str
ess
[MP
a]
Mix 5 WST-S
Mix 5 WST-L
Mix 5 3PBT
Mix 5 UTT
Adjusted curve
(a) (b)
Figure 76. Comparison of the -w relationship: (a) original curve and (b) curve
adjusted by considering the number of fibres in the specimens.
Figure 77. Examples of diffusive and multiple cracking in a notched beam specimen
(w/b 0.42 and Vf = 1.0 %, type RC-65/35).
When comparing the different test methods, based on the criteria specified, the
following conclusions can be drawn:
The results from all test methods could be interpreted as constitutive material
parameters, although the 3PBT and the WST required inverse analyses.
The -w relationship obtained from the inverse analyses showed quite good
agreement after they had been adjusted by taking into account the
experimentally determined fibre efficiency factor.
A well-defined crack was formed in the UTT and the WST specimens which
had a guide notch, but in the 3PBT specimens with a high volume fraction of
fibres this was not the case, suggesting that a deeper notch may be required for
the 3PBT when a deflection-hardening behaviour is expected.
Generally the scatter in the test result was high, but it was slightly lower for the
WST.
For the UTT, it is clear that the UTT is sensitive to the casting and compaction
procedures, as the UTT specimens had only about half the expected number of
fibres in the fracture surface, which led to results that were not representative.
The WST was the simplest and fastest method to use.
CHALMERS, Civil and Environmental Engineering 79
4.4 Concluding remarks
A test method approach was suggested which is based on the following three steps: (1) a
fracture-mechanics-based test method; (2) inverse analysis for determining the -w
relationship; and (3) adjustment of the -w relationship to take into account any
differences in fibre efficiency (the number of fibres) between the material test specimen
and random 3-D orientation or the specimen where the material is to be used. This
approach was investigated in a parametric study, using the wedge-splitting test (WST)
method for seven different volume fractions (0% Vf 1.0%), where the result seems
to confirm the approach and the assumptions made. The approach was also used in a
study where three different test methods were investigated for five different mixes; and
it was possible to adjust for some of the variations in fibre content, which always will be
present in material testing, and to obtain specimen-independent -w relationships.
A conclusion that can be drawn is that, when presenting test results for fibre-reinforced
concrete, it is recommended always to count and explicitly state the number of fibres
crossing the fracture plane and, if possible, to make a note of any significant variations
in the distribution of the fibres (e.g. whether there is any segregation or bundles of
fibres).
When comparing the three different test methods (the UTT, 3PBT, and WST), it was
found that there was a significant scatter in the test results for all methods, but that the
WST method overall showed less scatter. When counting the fibres in the specimens, it
became obvious that there were some variations in the number of fibres, but when this
was considered the -w relationships, obtained by inverse analysis, showed reasonable
agreement. Furthermore, recommendations for using the WST method were provided,
which is an attractive alternative test method for FRC as the small specimen size makes
it ideal for laboratory use, e.g. when developing and investigating new mixes or when
performing parametric studies.

CHALMERS, Civil and Environmental Engineering 80

CHALMERS, Civil and Environmental Engineering 81
5 Fracture-mechanics-based structural analysis
5.1 Introductory remarks
Gettu et al. (2000) suggest that a design approach, in order to be complete, should
consist of a methodology or strategy that includes: (1) a specification of the materials
testing, to obtaining the material parameters needed for the design, and a procedure for
interpreting the results; (2) the formulas or steps used for the design of structural
members; and (3) and indication of the limitations and reliability of the approach. For
analysis it is suitable to distinguish between structural analysis and sectional analysis.
The latter is performed to analyse a part of the structure – usually a critical section – and
to determine the response of this section, e.g. the relationship between applied moment
and curvature, strain or crack opening, etc., and the load resistance. The former is
performed to establish the global behaviour, e.g. the complete load–displacement
relationship for a beam, and to ensure that the structure or element behaves in a
satisfactory manner. The aim of design, on the other hand, is to ensure that a given
structural element is capable of sustaining the forces acting on it, forces which have
been determined from a structural analysis.
5.2 Design and analysis approaches
For fibre-reinforced concrete there are a number of different design and analysis
approaches available, some of which can be found in the following references: Maidl
(1995), Tan et al. (1995), Swedish Concrete Society (1995), Nanakorn and Horii
(1996), Lok and Pei (1998), Lok and Xiao (1999), Lin (1999 and 2000), Gossla (2000),
Gettu et al. (2000), Kooiman (2000), Silfwerbrand (2001), RILEM TC 162-TDF (2002a
and 2003a&b), Barragán (2002), Hemmy (2002), Rosenbuch (2003), Dupont (2003),
Pfyl (2003), Kanstad (2003), Ahmad et al. (2004). These design and analysis
approaches, which are readily available, are either analytical approaches, primarily
developed for performing cross-sectional analysis, or based on the finite element
method, for which a number of different methods and constitutive models are available
and can be used for both cross-sectional and structural analysis.
5.2.1 Finite element method
Examples where the finite element method has been used for analysing fibre-reinforced
concrete can be found, for example, in the Brite-EuRam Project BRPR-CT98-0813
(Test and Design Methods for Steel Fibre Reinforced Concrete); in this project different
FE programs and approaches were investigated (i.e. smeared and discrete cracking) –
see Hemmy et al. (2002). Another investigation, using the smeared crack concept, was
conducted by Kanstad and Døssland (2003), see also Kanstad and Døssland (2004), who
used DIANA but with ‘embedded’ reinforcement (see TNO, 2002). Embedded
reinforcement means that the reinforcements are embedded in structural elements and
do not have degrees of freedom of their own. Other applications and developments of

CHALMERS, Civil and Environmental Engineering 82
constitutive models for smeared cracking models can be found in e.g. Meda et al.
(2001), Guttema (2004), Belletti et al. (2004). Other approaches, based on strong
discontinuity, have been investigated and implemented by, among others, Simone
(2003) and Svahn (2005).
For the finite element method, the applicability to model fibre-reinforced concrete
depends on the capabilities of the FE program used, and it is outside the scope of this
work to describe all the different approaches that can be used. However, a brief
overview of the concepts and the program (DIANA, see TNO, 2002) used in this study
will be provided. Generally a distinction is made between the discrete crack approach
and the smeared crack concept. In the discrete crack approach, special interface
elements are used to model a crack and the material behaviour is described by the -w
relationship; see Figure 78(a). A drawback with this approach is that the crack path has
to be predefined, which makes it useful only in situations where this occurs e.g. for the
inverse analyses of a notched beam specimen or a WST specimen. The smeared crack
approach, on the other hand, requires no pre-defined cracks but it is assumed that the
deformation of one crack (the crack opening) can be smeared out over a characteristic
length lc; see Figure 78(b & c) as well as Roots (1988), Lundgren (1999) and Johansson
(2000). When modelling plain concrete, this characteristic length is approximately the
size of one element, h; when modelling reinforced concrete, and when slip is allowed
between the reinforcement and the concrete, it is also approximately the size of one
element. But, this means that the tensile stress versus strain used will depend on the size
of the element, and in some situation a different characteristic length may be required.
One such situation occurs when modelling reinforced concrete and assuming complete
interaction between the steel and the concrete (e.g. using embedded reinforcement in
DIANA; for this case, the deformation of one crack is smeared out over the mean crack
distance, s Figure 78(b & c). For fibre-reinforced concrete, the same assumptions
regarding the characteristic length can be used, but some extra considerations may be
required when modelling a combination of FRC and conventional reinforcement. In an
analysis, if the initial assumption is that the characteristic length is the size of one
element but the obtained crack pattern is unrealistic – e.g. cracks will not localise into
well-defined and distinct cracks, and instead elements in a large part of the beam may
be cracked: see Figure 78(b) – the characteristic length may have to be adjusted. The
consequence of an unrealistic crack pattern, with too many elements cracked, is that the
ductility and load resistance will be overestimated. If such a situation arises, the
characteristic length has to be chosen as the size of several elements, but should never
be more than the average expected crack spacing, and a new analysis has to be
performed with the new assumption. Situations where this problem may arise are, for
example, when the -w relationship has a relatively high stress level after cracking,
when the -w relationship has no steep initial drop, or when a high amount of
conventional reinforcement is used in combination with FRC.

CHALMERS, Civil and Environmental Engineering 83
1
wc
w
ctf
w
(a)
1
c = wc / lc
ctf
w
(c)
c = wc / (2 lc)
lc = h
(b)
s
lc = h ? lc = s
Figure 78. (a) Example showing a bi-linear -w relationship. (b) Localisation of
cracks and the choice of the characteristic length. (c) The transformation
to a - relationship.
5.2.2 Analytical approaches
The analytical models – for cross-sectional analysis – that are available are based on
different assumptions regarding kinematics (e.g. whether the crack surfaces remain
plane or not) and constitutive conditions (e.g. the stress-crack opening relationship in
tension and stress–strain relationship in compression); see RILEM TC 162-TDF (2002a
and 2003a). Depending on how the tensile response is represented, two approaches
exist, namely the stress–strain (-) approach and the stress-crack opening (-w)
approach; see Kooiman (2000) for a review of some approaches.
For the stress–strain approach, two possibilities exist: to use the uni-axial behaviour or
to represent the post-peak material behaviour with equivalent, or residual, flexural
tensile strengths, which can be determined from a three-point bending test (see e.g.
RILEM TC 162-TDF 2003a). In the - approach by RILEM TC 162-TDF (2003a) the
equivalent, or residual, flexural strength is used, and a size effect factor has been
introduced if the member depth is larger than the beam used for the materials testing.
On the other hand, when studying the literature there is no clear evidence for a size
effect. Kooiman (2000) investigated the energy absorption for different beam sizes
(ligament lengths 125, 250, and 375 mm) but found no evidence for any size effect.
Furthermore, di Prisco et al. (2004a) investigated size effects in thin plates and found
that there was a negligible size effect for the residual strength (i.e. post cracking) in
bending and suggests that the large scatter may instead support the Weibull’s theory of
statistical defects. Besides, it is not unlikely that the supposed size effect may partly be
explained by the fibre distribution and the fibre efficiency factor (see also Figure 14 and
Section 4.2.3). For example, the result presented by Erdem (2003) suggests that an
increased beam width has a similar effect as the height, although not as pronounced for
the investigated dimensions.
Cross-sectional analysis can also be carried out using fracture mechanics, using a -w
relationship, and by describing the cracked section as a non-linear hinge, as proposed by
Ulfkjær et al. (1995) and later by Pedersen (1996), Cassanova and Rossi (1997), and
Olesen (2001a). In addition, for determining the rotation capacity of reinforced concrete
beams, other type of models (e.g. plastic hinge models, crack block models) exist; see
e.g. CEB Bulletin 242, Rebentrost (2003), and Fantilli et al. (2005). An example of such

CHALMERS, Civil and Environmental Engineering 84
a fracture-mechanics-based approach is the Japanese design provision for steel fibre-
reinforced concrete (SFRC) tunnel linings (see Nanakorn and Horii 1996); in the design
of a tunnel lining, one of the limit states is the failure of a section after initiation and
propagation of a crack.
Many of the proposed analytical models focus entirely on sections without conventional
reinforcement; often the shape of the -w relationship is ignored and, to simplify
analysis, a plastic stress distribution is assumed. In addition, most of the suggested
models for reinforced FRC members are design models only aiming at predicting the
moment resistance, and thus do not provide much information on the crack propagation
stage; the possible negative/positive effects of a normal force acting on the cross section
are also neglected in several models. For fibre-reinforced beams without conventional
reinforcement, Olesen (2001a) developed a non-linear hinge model, using a bi-linear -
w relationship, covering the case with a normal force acting on the section. Olesen
(2001b) further developed the non-linear hinge model to cover sections containing
conventional reinforcement; in this model, the length of the hinge is set to the average
crack spacing, which is a function of the load and changes during analysis, and de-
bonding between reinforcement and concrete is also considered. The stress-crack
opening relationship adopted is a drop-constant, and in compression the concrete
behaves elastically. Barros and Figueiras (1999) proposed a layered approach for the
analysis of SFRC cross-sections under bending and axial forces. The model was based
on a stress–strain concept, with a bi-linear tension-softening relationship and a non-
linear stress–strain relationship in compression. The fracture energy, GF, together with
the average crack spacing, was used to determine the tension-softening relationship and
the tension-stiffening phenomenon was considered with a cracked reinforced concrete
tie stiffening the reinforcement.
5.3 Non-linear hinge model
The approach used in this thesis for studying the flexural behaviour of beams is based
on non-linear fracture mechanics and the non-linear hinge model. Generally, for beams,
slabs, and pipes without conventional reinforcement, cross-sectional analysis can be
carried out by describing a cracked section with a non-linear hinge (see Figure 79), as
proposed for example for Ulfkjær et al. (1995), Pedersen (1996), Casanova and Rossi
(1997), and Olesen (2001a & b). These models are based on different assumptions
regarding kinematic and constitutive conditions. But generally the different kinematic
assumptions for the stress-crack opening models can be described in the following way
(see RILEM TC 162-TDF, 2002a):
The crack surfaces remain plane and the crack opening angle equals the overall
angular deformation of the non-linear hinge.
The crack surfaces remain plane and the crack opening angle equals the overall
curvature of the non-linear hinge. Furthermore, the overall curvature of the
non-linear hinge, the curvature of the cracked part, and the curvature of the
elastic part are linked due to the assumption of parabolic variation of the
curvature; see e.g. Casanova and Rossi (1997) and Chanvillard (2000).
The crack surfaces do not remain plane; the deformation is governed by the
stress-crack opening relationship, the crack length and the overall angular
deformation of the non-linear hinge.
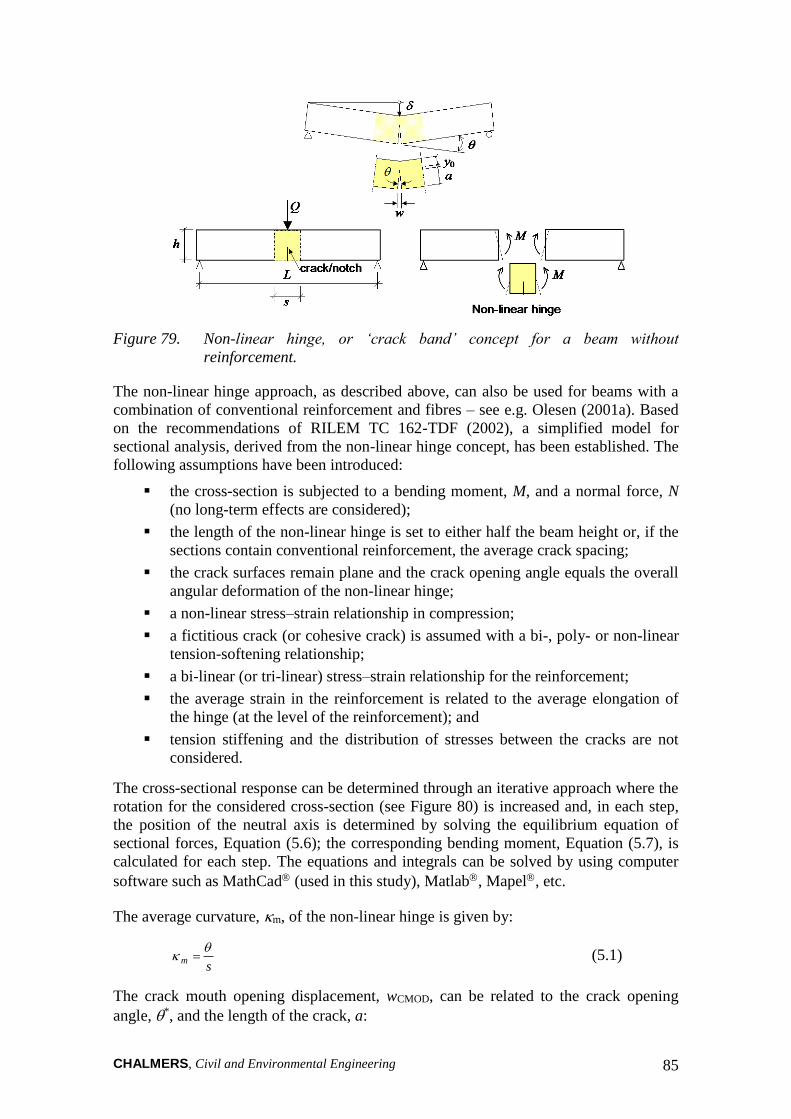
CHALMERS, Civil and Environmental Engineering 85
Figure 79. Non-linear hinge, or ‘crack band’ concept for a beam without
reinforcement.
The non-linear hinge approach, as described above, can also be used for beams with a
combination of conventional reinforcement and fibres – see e.g. Olesen (2001a). Based
on the recommendations of RILEM TC 162-TDF (2002), a simplified model for
sectional analysis, derived from the non-linear hinge concept, has been established. The
following assumptions have been introduced:
the cross-section is subjected to a bending moment, M, and a normal force, N
(no long-term effects are considered);
the length of the non-linear hinge is set to either half the beam height or, if the
sections contain conventional reinforcement, the average crack spacing;
the crack surfaces remain plane and the crack opening angle equals the overall
angular deformation of the non-linear hinge;
a non-linear stress–strain relationship in compression;
a fictitious crack (or cohesive crack) is assumed with a bi-, poly- or non-linear
tension-softening relationship;
a bi-linear (or tri-linear) stress–strain relationship for the reinforcement;
the average strain in the reinforcement is related to the average elongation of
the hinge (at the level of the reinforcement); and
tension stiffening and the distribution of stresses between the cracks are not
considered.
The cross-sectional response can be determined through an iterative approach where the
rotation for the considered cross-section (see Figure 80) is increased and, in each step,
the position of the neutral axis is determined by solving the equilibrium equation of
sectional forces, Equation (5.6); the corresponding bending moment, Equation (5.7), is
calculated for each step. The equations and integrals can be solved by using computer
software such as MathCad (used in this study), Matlab, Mapel, etc.
The average curvature, m, of the non-linear hinge is given by:
sm
(5.1)
The crack mouth opening displacement, wCMOD, can be related to the crack opening
angle, *, and the length of the crack, a:

CHALMERS, Civil and Environmental Engineering 86
awCMOD * (5.2)
The average strain in the reinforcement is calculated as:
01 yds
s
(5.3)
The compressive strain in the concrete is calculated as:
0yys
c
(5.4)
When the crack surfaces remain plane, the overall angular deformation of the hinge, ,
is equal to the crack opening angle, *. The crack mouth opening displacement, wCMOD,
can then be related to the depth of the neutral axis, y0, the overall angular deformation of
the hinge, , the tensile strength, ft, the modulus of elasticity, E, the normal force, N, the
cross-sectional area, A, and the length of the non-linear hinge, s, by:
EA
N
E
fsyhw t
CMOD 0 (5.5)
Based on these assumptions and the stress distribution in Figure 80, the sectional forces
can be written as:
ss
h
ah
f
ah
c Adyywdyyb
N
,,
0
(5.6)
22),(
2),( 1
0
hdAdy
hyywdy
hyy
b
Mss
h
ah
f
ah
c (5.7)
N
w
M
s
M
N
c (
,y)
y
y 0
s
d1
c (w
,y)
a
h /
2
h /
2
a
c (y)
s
wCMOD
*
/ 2
non-linear
springs
Concrete
Stress-strain
-110
-90
-70
-50
-30
-10
-5 -4 -3 -2 -1 0
Strain, c, [10-3
]
Str
ess,
c,
[M
Pa]
0
s
s fu
fy
y u
Ec
fct
()
1
wc w1
b2
a1
a2 w
ctf
w
Concrete
Stress-crack opening
Reinforcement
Stress-strain
Concrete
Stress-strain
Figure 80. Non-linear hinge, or ‘crack band’ concept for a beam with reinforcement
and examples of the material behaviour.
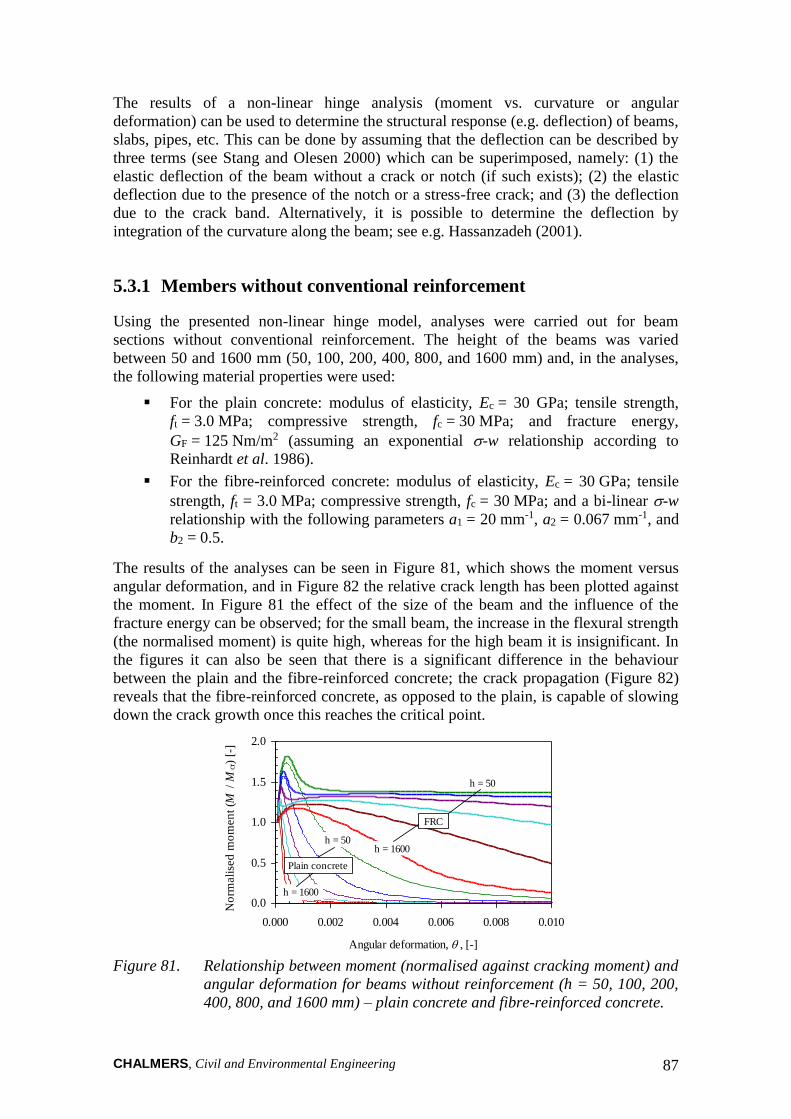
CHALMERS, Civil and Environmental Engineering 87
The results of a non-linear hinge analysis (moment vs. curvature or angular
deformation) can be used to determine the structural response (e.g. deflection) of beams,
slabs, pipes, etc. This can be done by assuming that the deflection can be described by
three terms (see Stang and Olesen 2000) which can be superimposed, namely: (1) the
elastic deflection of the beam without a crack or notch (if such exists); (2) the elastic
deflection due to the presence of the notch or a stress-free crack; and (3) the deflection
due to the crack band. Alternatively, it is possible to determine the deflection by
integration of the curvature along the beam; see e.g. Hassanzadeh (2001).
5.3.1 Members without conventional reinforcement
Using the presented non-linear hinge model, analyses were carried out for beam
sections without conventional reinforcement. The height of the beams was varied
between 50 and 1600 mm (50, 100, 200, 400, 800, and 1600 mm) and, in the analyses,
the following material properties were used:
For the plain concrete: modulus of elasticity, Ec = 30 GPa; tensile strength,
ft = 3.0 MPa; compressive strength, fc = 30 MPa; and fracture energy,
GF = 125 Nm/m2 (assuming an exponential -w relationship according to
Reinhardt et al. 1986).
For the fibre-reinforced concrete: modulus of elasticity, Ec = 30 GPa; tensile
strength, ft = 3.0 MPa; compressive strength, fc = 30 MPa; and a bi-linear -w
relationship with the following parameters a1 = 20 mm-1, a2 = 0.067 mm-1, and
b2 = 0.5.
The results of the analyses can be seen in Figure 81, which shows the moment versus
angular deformation, and in Figure 82 the relative crack length has been plotted against
the moment. In Figure 81 the effect of the size of the beam and the influence of the
fracture energy can be observed; for the small beam, the increase in the flexural strength
(the normalised moment) is quite high, whereas for the high beam it is insignificant. In
the figures it can also be seen that there is a significant difference in the behaviour
between the plain and the fibre-reinforced concrete; the crack propagation (Figure 82)
reveals that the fibre-reinforced concrete, as opposed to the plain, is capable of slowing
down the crack growth once this reaches the critical point.
0.0
0.5
1.0
1.5
2.0
0.000 0.002 0.004 0.006 0.008 0.010
Angular deformation, , [-]
FRC
h = 50
h = 1600
h = 50
h = 1600
Plain concrete
No
rmali
sed
mo
men
t (
M /
Mcr)
[-]
Figure 81. Relationship between moment (normalised against cracking moment) and
angular deformation for beams without reinforcement (h = 50, 100, 200,
400, 800, and 1600 mm) – plain concrete and fibre-reinforced concrete.

CHALMERS, Civil and Environmental Engineering 88
0.0
0.5
1.0
1.5
2.0
0.0 0.2 0.4 0.6 0.8 1.0
Normalised crack length, a/h , [-]
Plain
concrete
No
rmali
sed
mo
men
t (
M /
Mcr)
[-]
h = 1600
h = 50
0.0
0.5
1.0
1.5
2.0
0.0 0.2 0.4 0.6 0.8 1.0
Normalised crack length, a/h , [-]
h = 50
h = 1600
No
rmali
sed
mo
men
t (
M /
Mcr)
[-]
FRC
(a) (b)
Figure 82. Relationship between moment (normalised against cracking moment) and
the normalised crack length for beams without reinforcement (h = 50,
100, 200, 400, 800, and 1600 mm): (a) plain concrete and (b) fibre-
reinforced concrete.
5.3.2 Members with conventional reinforcement
Analyses were also carried out for beam sections with conventional reinforcement (see
Löfgren, 2003). A slab with a thickness of 250 mm thick, 1 m wide, and with the
reinforcement placed 225 mm from the top of the slab was analysed; see Figure 83. For
the concrete: tensile strength ft = 2.5 MPa, compressive strength fc = 38 MPa, and
modulus of elasticity Ec = 30 GPa. For the reinforcement: yield stress fy = 500 MPa,
tensile strength fu = 550 MPa (u = 6%), and the elastic modulus Es = 200 GPa.
Furthermore, the FRC was simulated by a bi-linear -w relationship in tension
according to Figure 83 with the following parameters: a1 = 10 mm-1, a2 = 0.033 mm-1,
and b2 = 0.5. The fibre-reinforced concrete had a longitudinal geometric reinforcement
ratio of 0.1% while the plain concrete had 0.2%. The properties of the reinforcement
were: modulus of elasticity Es = 200 GPa, yield strength fy = 500 MPa, ultimate strength
fu = 550 MPa (at a failure strain of 5%).
Concrete:
ft = 2.5 MPa
fc = 38 MPa
Ec = 30 GPa
1
wc w1
b2
a1
a2 w
ctf
w
-w relationship for FRC.
Parameters: a1, a2, and b2
b = 1000
d =
225
h =
250
Reinforcement: = 0.1% or for RC 0.2%
fy = 500 MPa (fu = 550 MPa)
Es = 200 GPa
Figure 83. Geometry of investigated slab and assumed material properties.
To check the results and the assumption of the hinge length s, results from non-linear
hinge analyses were compared with FE analyses based on non-linear fracture mechanics
(see Figure 84). The FE analyses were performed with the program DIANA (see TNO,

CHALMERS, Civil and Environmental Engineering 89
2002). In the analyses, a smeared crack approach was used and the characteristic length
(or the crack band width, h) was set to 12.5 and 25 mm for the FRC, which correspond
respectively to two and four elements as cracks tended to localise in more than one
element row. With this assumption, the bi-linear stress-crack opening relationship was
transformed into a stress–strain relationship by dividing the crack opening with the
crack bandwidth. Furthermore, the interaction between the concrete and the
reinforcement (the bond-slip) was modelled with interface elements, which were given a
bond-slip relationship according to the CEB-FIP MC90 (see CEB, 1993), assuming
confined concrete with good bond conditions.
Figure 84 shows the crack pattern obtained in one of the FE analyses with a spacing of
about 120-130 mm. Moreover, in Figure 85 a comparison is made between the two
models with different assumptions regarding the hinge length and crack bandwidth; as
can be seen, the non-linear hinge model seems to predict the overall behaviour fairly
well and the peak moment also corresponds. However, the FE-analyses show a
somewhat stiffer behaviour during the cracking stage, and yielding of the reinforcement
occurs at a smaller rotation. This is expected as tension stiffening was ignored in the
simplified non-linear hinge model. For the plain concrete, see Figure 85(b), the effect of
the tension stiffening is more pronounced and has a predominant influence during the
cracking stage. Furthermore, the differences at the first crack development were due to
convergence problems in the FE analyses.
M
/ 2
Figure 84. Detailed analysis of a beam segment for regional behaviour; the figure
shows the longitudinal strain in the concrete, and the red or (dark)
regions on the tensioned side indicate cracks.
0
10
20
30
40
50
60
70
0 0.004 0.008 0.012 0.016
Curvature [1/m]
Mo
men
t, M
, [k
Nm
/m]
FEM (h = 25 mm)
FEM (h = 12.5 mm)
s = 75 mm
s = 125 mm
s = 150 mm
0
10
20
30
40
50
60
70
0 0.004 0.008 0.012 0.016
Curvature [1/m]
Mo
men
t, M
, [k
Nm
/m]
FEM (h = 12.5 mm)
FEM (h = 6.25 mm)
s = 75 mm
s = 100 mm
s = 150 mm
s = 125 mm
(a) (b)
Figure 85. Comparison between the non-linear hinge model and FE-analysis, with
different hinge lengths and crack band widths: (a) for fibre-reinforced
concrete with 0.1% reinforcement, and (b) for normal reinforced concrete
with 0.2% reinforcement. From Löfgren (2003).

CHALMERS, Civil and Environmental Engineering 90
To further investigate the capabilities of the non-linear hinge model, another set of
analyses was conducted for different values of the b2 parameter. The same geometry as
in the example above was used, but for a concrete with the following properties: tensile
strength ft = 3.0 MPa, compressive strength fc = 40 MPa, and modulus of elasticity
Ec = 30 GPa. The reinforcement was assumed to have the following properties: a yield
stress fy = 500 MPa, a tensile strength fu = 550 MPa (u = 6%), and the elastic modulus
Es = 200 GPa. Furthermore, the FRC was simulated by a bi-linear -w relationship in
tension (according to Figure 83) with the following parameters: a1 = 20 mm-1,
a2 = 0.05 mm-1, and b2 = 0.2 to 0.9. Figure 86 shows the results of the analyses; Figure
86(a) shows the moment vs. curvature and (b) the moment versus crack opening.
Generally, the non-linear hinge seems to predict the response fairly well. For the
moment versus curvature, the hinge model shows better agreement for a high b2 value
than for a low; the reason is that, for the case with a low b2, tension stiffening is the
predominant mechanism for the behaviour – compare also with reinforced concrete in
Figure 85(b). The crack width seems to be predicted reasonably, but for large b2 values
a larger crack width is predicted by using the non-linear hinge model.
0
20
40
60
80
100
0.000 0.005 0.010 0.015 0.020 0.025
Curvature [1/m]
Mo
men
t [k
Nm
/m]
0.9
b 2 =0.2
0.3
0.5
0.7
0
20
40
60
80
100
0.0 0.2 0.4 0.6 0.8 1.0
Crack opening, w , [mm]
Mo
men
t [k
Nm
/m]
0.9
b 2 =
0.2
0.30.5
0.7
(a) (b)
Figure 86. Comparison of the non-linear hinge model (thin lines) and FE-analysis
(thick lines) for different b2 values: (a) moment vs. curvature and (b)
moment vs. crack opening.
The conclusion that can be drawn from these investigations is that with the non-linear
hinge it is possible to analyse the regional behaviour with quite realistic results when
compared to finite element analyses based on non-linear fracture mechanics. Moreover,
the non-linear hinge model is a fast and simple tool that can be used for cross-sectional
analyses, and the behaviour of simple structures can be determined (e.g. beams, slabs,
and pipes) by integration of the curvature. However, input regarding the crack spacing
is required, but as the result is not too sensitive (within reasonable deviations) to the
choice of hinge length this can be determined by using some of the available methods;
see e.g. Ibrahim and Luxmoore (1979), Tan et al. (1995), RILEM TC 162-TDF, Pfyl
(2003), and Dupont (2003). The finite element model, on the other hand, is a much
more general approach than the analytical model, as it is possible to take into account
the effects of bond-slip, cracking, multi-axial stress states, stress distribution between
cracks (tension stiffening), etc. Thus, the finite element method is better adapted for
more complex structures and loading conditions, as it can provide comprehensive
results regarding the structural behaviour (shear failure, crushing in the compressive
zone, long-term deflections, etc.) and the crack spacing is provided as an output. On the
other hand, for larger structures the analysis may become quite time-consuming.
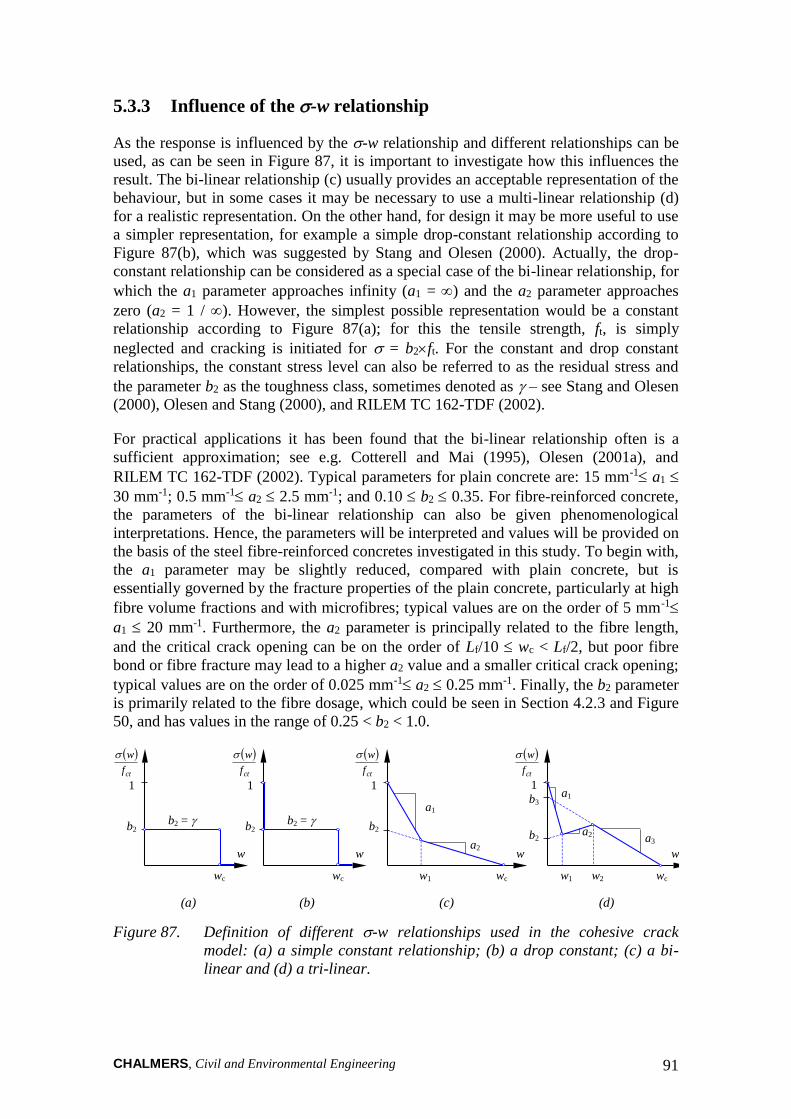
CHALMERS, Civil and Environmental Engineering 91
5.3.3 Influence of the -w relationship
As the response is influenced by the -w relationship and different relationships can be
used, as can be seen in Figure 87, it is important to investigate how this influences the
result. The bi-linear relationship (c) usually provides an acceptable representation of the
behaviour, but in some cases it may be necessary to use a multi-linear relationship (d)
for a realistic representation. On the other hand, for design it may be more useful to use
a simpler representation, for example a simple drop-constant relationship according to
Figure 87(b), which was suggested by Stang and Olesen (2000). Actually, the drop-
constant relationship can be considered as a special case of the bi-linear relationship, for
which the a1 parameter approaches infinity (a1 = ) and the a2 parameter approaches
zero (a2 = 1 / ). However, the simplest possible representation would be a constant
relationship according to Figure 87(a); for this the tensile strength, ft, is simply
neglected and cracking is initiated for = b2ft. For the constant and drop constant
relationships, the constant stress level can also be referred to as the residual stress and
the parameter b2 as the toughness class, sometimes denoted as – see Stang and Olesen
(2000), Olesen and Stang (2000), and RILEM TC 162-TDF (2002).
For practical applications it has been found that the bi-linear relationship often is a
sufficient approximation; see e.g. Cotterell and Mai (1995), Olesen (2001a), and
RILEM TC 162-TDF (2002). Typical parameters for plain concrete are: 15 mm-1 a1
30 mm-1; 0.5 mm-1 a2 2.5 mm-1; and 0.10 b2 0.35. For fibre-reinforced concrete,
the parameters of the bi-linear relationship can also be given phenomenological
interpretations. Hence, the parameters will be interpreted and values will be provided on
the basis of the steel fibre-reinforced concretes investigated in this study. To begin with,
the a1 parameter may be slightly reduced, compared with plain concrete, but is
essentially governed by the fracture properties of the plain concrete, particularly at high
fibre volume fractions and with microfibres; typical values are on the order of 5 mm-1
a1 20 mm-1. Furthermore, the a2 parameter is principally related to the fibre length,
and the critical crack opening can be on the order of Lf/10 wc < Lf/2, but poor fibre
bond or fibre fracture may lead to a higher a2 value and a smaller critical crack opening;
typical values are on the order of 0.025 mm-1 a2 0.25 mm-1. Finally, the b2 parameter
is primarily related to the fibre dosage, which could be seen in Section 4.2.3 and Figure
50, and has values in the range of 0.25 < b2 < 1.0.
1
wc w1
b2
a1
a2 w
ctf
w
(c)
1
b2
w
ctf
w
(b)
1
wc w1
b2
a1
a3
w
ctf
w
(d)
wc w2
a2
b3 1
b2
w
ctf
w
(a)
wc
b2 = b2 =
Figure 87. Definition of different -w relationships used in the cohesive crack
model: (a) a simple constant relationship; (b) a drop constant; (c) a bi-
linear and (d) a tri-linear.

CHALMERS, Civil and Environmental Engineering 92
Using the bi-linear relationship, a parametric study was conducted using the same
geometry and material properties as shown in Figure 83. Figure 88 to Figure 90 show
how the parameters of the bi-linear stress-crack opening influence the moment-
curvature relationship. As can be seen in Figure 88(a), a1 mainly has an influence on the
pre-peak stage until a critical value for a1 is reached (corresponding to low values of a1),
after which it also influences the maximum moment resistance of the cross-section, in
Figure 88(b). It is also interesting to see the effect that the a1 parameter has on the crack
propagation; for a low value the crack will propagate, but with increasing moment
resistance until it reaches a critical point where the moment suddenly decreases. Further,
a2 mainly influences the shape of the moment-curvature relationship after the maximum
moment of the cross-section is reached; see Figure 89(a). For low values, the moment
does not decrease with increasing rotation, but as a2 is increased the maximum moment
will be decreased and, in addition, the moment decreases with increased rotation. This
suggests that care should be taken for high values of the a2 parameter as it may have a
large impact on the moment redistribution in statically indeterminate systems. For the
crack propagation, which can be seen in Figure 89(b), the a2 parameter only influences
the behaviour once the peak moment has been reached. The b2 parameter has a large
influence on the maximum moment and the pre-peak part; as b2 increases the moment
resistance is increased, as can be seen in Figure 90(a). Moreover, for the crack
propagation, the b2 parameter influences the response first after the crack has reached a
critical length (corresponding to the crack opening w1 in Figure 87(c)); see Figure 90(b).
From the figures it can also be seen that the peak moment occurs at a crack length of
about 0.8 of the section depth.
0
20
40
60
80
0 0.02 0.04 0.06
Curvature [1/m]
Mo
men
t, M
, [k
Nm
/m]
a 1 = 1
M cr
a 1 = 2.5
a 1 = 5
a 1 = 10
a 1 = 20
0.0
0.5
1.0
1.5
2.0
2.5
3.0
0.0 0.2 0.4 0.6 0.8 1.0
Normalised crack length (a / h ) [-]
M
a
h
M
a 1 = 20
a 1 = 1
No
rmali
sed
mo
men
t (
M /
Mcr)
[-]
(a) (b)
Figure 88. Effect of a1 on the response (a1= 20, 10, 5, 2.5, and 1, with a2=0.025 and
b2=0.5): (a) the moment-curvature relationship; and (b) effect on the
crack propagation.

CHALMERS, Civil and Environmental Engineering 93
0
20
40
60
80
0 0.02 0.04 0.06
Curvature [1/m]
Mo
men
t, M
, [k
Nm
/m]
M cr
a 2 = 0.5
a 2 = 0.025
a 2 = 0.25
a 2 = 0.1
a 2 = 0.05
0.0
0.5
1.0
1.5
2.0
2.5
0.0 0.2 0.4 0.6 0.8 1.0
Normalised crack length (a / h ) [-]
N
orm
ali
sed
mo
men
t (
M /
Mcr)
[-]
M
a
h
M
a 2 = 0.5
a 2 = 0.025
(a) (b)
Figure 89. Effect of a2 on the response (a2= 0.5, 0.25, 0.1, 0.05, and 0.025, with
a1=10 and b2=0.5): (a) the moment-curvature relationship; and (b) effect
on the crack propagation.
0
20
40
60
80
0 0.02 0.04 0.06
Curvature [1/m]
Mo
men
t, M
, [k
Nm
/m]
M cr
b 2 = 0.25
b 2 = 0.4
b 2 = 0.5
b 2 = 0.6
b 2 = 0.75
0.0
0.5
1.0
1.5
2.0
2.5
3.0
0.0 0.2 0.4 0.6 0.8 1.0
Normalised crack length (a / h ) [-]
M
a
h
M
b 2 = 0.25
b 2 = 0.75
No
rmali
sed
mo
men
t (
M /
Mcr)
[-]
(a) (b)
Figure 90. Effect of b2 on the response (b2= 0.25, 0.4, 0.5, 0.6, and 0.75, with a1=10
and a2=0.025): (a) the moment-curvature relationship; and (b) effect on
the crack propagation.
The simpler relationships presented in Figure 87 were also compared with the bi-linear
in an analysis. The bi-linear -w relationship used in the analyses can be seen in Figure
91 together with the drop constant and the constant relationship. The b2 parameter for
the latter was determined so that the consumed energy up to a crack opening of 2 mm
should be equal to that of the bi-linear relationship. The analyses were conducted by
using the same geometry and reinforcement ratio as in the example above (see Figure
83) for a concrete with the following properties: tensile strength ft = 3.0 MPa,
compressive strength fc = 40 MPa, and modulus of elasticity Ec = 30 GPa. For the
reinforcement a yield stress fy = 500 MPa, a tensile strength fu = 550 MPa (u = 6%), and
an elastic modulus of Es = 200 GPa were assumed.
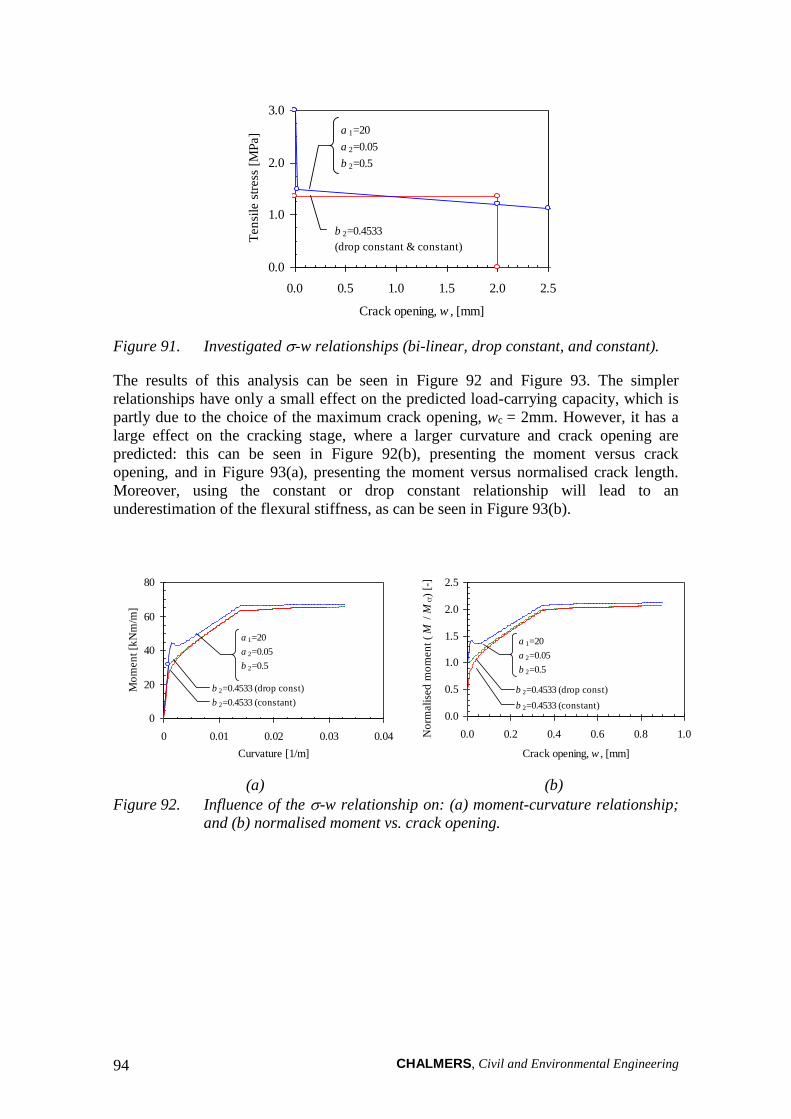
CHALMERS, Civil and Environmental Engineering 94
0.0
1.0
2.0
3.0
0.0 0.5 1.0 1.5 2.0 2.5
Crack opening, w , [mm]
Ten
sile
str
ess
[M
Pa] a 1=20
a 2=0.05
b 2=0.5
b 2=0.4533
(drop constant & constant)
Figure 91. Investigated -w relationships (bi-linear, drop constant, and constant).
The results of this analysis can be seen in Figure 92 and Figure 93. The simpler
relationships have only a small effect on the predicted load-carrying capacity, which is
partly due to the choice of the maximum crack opening, wc = 2mm. However, it has a
large effect on the cracking stage, where a larger curvature and crack opening are
predicted: this can be seen in Figure 92(b), presenting the moment versus crack
opening, and in Figure 93(a), presenting the moment versus normalised crack length.
Moreover, using the constant or drop constant relationship will lead to an
underestimation of the flexural stiffness, as can be seen in Figure 93(b).
0
20
40
60
80
0 0.01 0.02 0.03 0.04
Curvature [1/m]
a 1=20
a 2=0.05
b 2=0.5
b 2=0.4533 (drop const)Mo
men
t [k
Nm
/m]
b 2=0.4533 (constant)
0.0
0.5
1.0
1.5
2.0
2.5
0.0 0.2 0.4 0.6 0.8 1.0
Crack opening, w , [mm]
a 1=20
a 2=0.05
b 2=0.5
b 2=0.4533 (drop const)
No
rmali
sed
mo
men
t (
M /
Mcr)
[-]
b 2=0.4533 (constant)
(a) (b)
Figure 92. Influence of the -w relationship on: (a) moment-curvature relationship;
and (b) normalised moment vs. crack opening.

CHALMERS, Civil and Environmental Engineering 95
0.0
0.5
1.0
1.5
2.0
2.5
0.0 0.2 0.4 0.6 0.8 1.0
Normalised crack length (a / h ) [-]
a 1=20
a 2=0.05
b 2=0.5
b 2=0.4533 (drop const)
No
rmali
sed
mo
men
t (
M /
Mcr)
[-]
b 2=0.4533 (constant)
0.0
0.5
1.0
1.5
2.0
2.5
0.0 0.2 0.4 0.6 0.8 1.0
Normalised flexural stiffness (EI / EI cr) [-]
a 1=20
a 2=0.05
b 2=0.5
(drop const) b 2=0.4533
No
rmali
sed
mo
men
t (
M /
Mcr)
[-]
(constant) b 2=0.4533
(a) (b)
Figure 93. Influence of the -w relationship on: (a) normalised moment vs.
normalised crack length; and (b) normalised moment vs. normalised
flexural stiffness.
5.3.4 Effect of normal force
In many structural applications a design situation with only bending moment acting on a
member is not realistic, as normal forces often act simultaneously with bending
moment. A situation where this may arise is in suspended floor slabs in buildings with
stabilising units, which may restrain any shrinkage or thermal dilatation from occurring
and thus generating forces. A compressive force, on the other hand, has a positive
influence as it balances the bending moment and makes it possible to reduce the amount
of reinforcement or fibres. A typical structural application where this situation arises is
in concrete walls (e.g. basement walls with earth pressure). To instigate this, some
analyses were conducted, assuming the same geometry and reinforcement ratio as in the
example above (see Figure 83), for a concrete with the following properties: tensile
strength ft = 3.0 MPa, compressive strength fc = 40 MPa, and modulus of elasticity Ec =
30 GPa. For the reinforcement a yield stress fy = 500 MPa, a tensile strength fu = 550
MPa (u = 6%), and an elastic modulus of Es = 200 GPa were assumed. Furthermore, the
FRC was simulated by a bi-linear stress-crack opening relationship in tension
(according to Figure 87) with the following parameters: a1 = 20 mm-1, a2 = 0.05 mm-1,
and b2 = 0.5.
The normal forces were given the following values:
in tension N = 0.1 ft h b and N = 0.3 ft h b;
and in compression N = -0.1 ft h b and N = -0.3 ft h b.
The results from these analyses are presented in Figure 94 and Figure 95. As can be
seen in Figure 94(a), a compressive force leads to increased moment resistance, which
increases with the magnitude, while a tensile force leads to reduced moment resistance,
and the reduction becomes larger as the magnitude increases. In Figure 94(b) the effect
on the crack opening can be seen, and here the normal force has a similar influence. In
Figure 95(a) it is interesting to see the effect that the normal force has on the crack
propagation, which for a tensile normal force grows rapidly once cracking has been
initiated. This also has an effect on the flexural stiffness, as can be seen in Figure 95(b).

CHALMERS, Civil and Environmental Engineering 96
0
20
40
60
80
100
0 0.01 0.02 0.03 0.04
Curvature [1/m]
M
om
en
t [k
Nm
/m]
N = 0.3
N = 0.1
N = -0.1
N = -0.3
0
20
40
60
80
100
0.0 0.2 0.4 0.6 0.8 1.0
Crack opening, w , [mm]
M
om
en
t [k
Nm
/m]
N = 0.3
N = 0.1
N = -0.1
N = -0.3
(a) (b)
Figure 94. Effect of normal force on: (a) moment-curvature relationship; and (b)
moment vs. crack opening.
0
20
40
60
80
100
0.0 0.2 0.4 0.6 0.8 1.0
Normalised crack length, a / h , [-]
M
om
en
t [k
Nm
/m]
N = 0.3
N = 0.1
N = -0.1
N = -0.3
0
20
40
60
80
100
0.0 0.2 0.4 0.6 0.8 1.0
Normalised flexural stiffness, EI / EI cr, [-]
M
om
en
t [k
Nm
/m]
N = 0.3
N = 0.1
N = -0.1
N = -0.3
(a) (b)
Figure 95. Effect of normal force on: (a) moment vs. normalised crack length; and
(b) moment vs. normalised flexural stiffness.
5.3.5 Comparison of conventional RC- and FRC-members
One of the incentives for fibre-reinforced concrete, which has been brought up, is the
possibility to reduce the amount of conventional reinforcement. In Figure 96 and Figure
97 a comparison is made between a slab (having a geometry according to Figure 83)
with conventional concrete and with fibre-reinforced concrete. In the analyses, the
amount of reinforcement was chosen so that the slabs provided the same moment
resistance, and two different cases were investigated: reinforcement with yield strength
of either 500 or 600 MPa. For the concrete, the following properties were used: tensile
strength ft = 2.5 MPa, compressive strength fc = 38 MPa, and modulus of elasticity
Ec = 30 GPa. The slab with conventional concrete was analysed by considering the
fracture energy, GF. For the FRC, the following properties were used: a1 = 10 mm-1,
a2 = 0.033 mm-1, and b2 = 0.5.
As can be seen in Figure 96, the main differences between the conventional slab and the
FRC slab are the increased moment resistance and stiffness during the crack
propagation stage (the service state) as well as significantly smaller crack widths (see
Figure 96). It can be seen that after crack initiation, the crack propagates fast in the

CHALMERS, Civil and Environmental Engineering 97
conventional concrete (Figure 97(a)), to a height of 0.7 compared with 0.5 for the FRC.
Moreover, the flexural stiffness is larger for the FRC member, which would lead to less
deflection for a fibre-reinforced member; see Figure 97(b). Using reinforcement with
higher yield stress seems to be a good option for a FRC (as long as the fibre content is
sufficient) while for a plain concrete it leads to increased crack widths. In conclusion, it
appears that with the fibre-reinforced concrete investigated in this example, with
b2 = 0.5, it was possible to reduce the conventional reinforcement to half the amount
needed with a plain concrete. The properties of the FRC used in the analyses can be
compared with the results in Chapter 4 where b2 = 0.5 roughly corresponded to 40
kg/m3.
0
10
20
30
40
50
60
70
0 0.005 0.01 0.015 0.02 0.025
Curvature [1/m]
=0.18%, f y=600
=0.08%, f y=600
=0.1%, f y=500
=0.22%, f y=500
RC: G F=75
FRC: b 2 =0.5
Mo
men
t [k
Nm
/m]
0.0
0.5
1.0
1.5
2.0
2.5
0.0 0.2 0.4 0.6 0.8
Crack opening, w , [mm]
N
orm
ali
sed
mo
men
t (
M /
Mcr)
[-]
=0.1%, f y=500
FRC: b 2 =0.5
=0.08%, f y=600
=0.22%, f y=500
RC: G F=75
=0.18%, f y=600
(a) (b)
Figure 96. Comparison of reinforced FRC and plain concrete (RC): (a) moment vs.
curvature and (b) moment vs. crack opening.
0.0
0.5
1.0
1.5
2.0
2.5
0.0 0.2 0.4 0.6 0.8 1.0
Normalised crack length (a / h ) [-]
=0.1%, f y=500FRC: b 2 =0.5
=0.08%, f y=600
=0.22%, f y=500
RC: G F=75
=0.18%, f y=600
No
rmali
sed
mo
men
t (
M /
Mcr)
[-]
0.0
0.5
1.0
1.5
2.0
2.5
0.0 0.2 0.4 0.6 0.8 1.0
Normalised flexural stifness (EI / EI cr) [-]
=0.1%, f y=500
=0.08%, f y=600
FRC: b 2 =0.5
=0.22%, f y=500
RC: G F=75
=0.18%, f y=600
No
rmali
sed
mo
men
t (
M /
Mcr)
[-]
(a) (b)
Figure 97. Comparison of reinforced FRC and plain concrete (RC): (a) moment vs.
normalised crack length and (b) moment vs. normalised crack length.

CHALMERS, Civil and Environmental Engineering 98
5.4 Concluding remarks
A fracture-mechanics-based analysis model was presented, which is based on the
fictitious crack model (see Hillerborg et al., 1976) and the non-linear hinge concept.
With this simplified analytical model it is possible to analyse the flexural behaviour and
to investigate how the shape of the -w relationship, the material properties of the
concrete, the yield strength of the reinforcement, the reinforcement ratio, and a normal
force influence flexural behaviour. A comparison was made between conventional RC
members and FRC members; the main differences were found to be the increased
stiffness during the initial crack propagation and significantly reduced crack widths.
Moreover, it was shown that with fibres it is possible to significantly reduce the amount
of conventional reinforcement compared to a conventional concrete (to half the amount
in the considered case) and, at the same time, improve the structural performance
(reduced crack widths and increased flexural stiffness). When comparing the analytical
model with finite element analyses (based on non-linear fracture mechanics) it was
found that the behaviour was predicted with fairly good agreement.
It was shown that the shape of the -w relationship not only influences the maximum
moment, but also that the crack propagation stage is highly influenced. A consequence
is that, if a highly simplified/idealised -w relationship is used (e.g. a drop constant), it
will not be possible to accurately predict the service behaviour (crack widths and
flexural stiffness) – but fortunately, the predicted load resistance is not as sensitive to
this choice. Furthermore, a parametric investigation using a bi-linear stress-crack
opening relationship was conducted, and from this it can be concluded that:
The slope of the first part of the stress-crack opening relationship, a1, mainly
influences the crack propagation stage. This corresponds to the serviceability
limit state.
The slope of the second part of the stress-crack opening relationship, a2, mainly
influences the shape of the moment-curvature relationship after the peak
moment is reached. For higher values of a2 (corresponding to short fibres,
fibres breaking, or fibres with a poor pull-out behaviour) the maximum
moment is reached early and decreases with increased curvature. This is not a
preferred behaviour for continuous members where moment redistribution
takes place.
The parameter b2 (related to the volume fraction and efficiency of the fibres)
influences the moment level, i.e. a higher value leads to a higher moment
resistance. However, for high values it leads to an almost elastic plastic
behaviour.
CHALMERS, Civil and Environmental Engineering 99
6 Structural applications
6.1 Fracture behaviour of reinforced FRC beams
Full-scale experiments were conducted on reinforced concrete members made of self-
compacting fibre-reinforced concrete, having only a small amount of conventional
reinforcement. The post-cracking behaviour of the steel fibre-reinforced concrete was
determined through inverse analysis of results from wedge-splitting tests (WST). Using
the results from these experiments, the capabilities of the fracture-mechanics-based
approaches, presented in Chapters 4 and 5, for material testing and structural analysis
could be investigated. To briefly summarise and explain the approach, it can be said to
consist of the following steps:
Material testing, i.e. standard compressive strength test together with wedge-
splitting tests (WST) to determine the tensile post-cracking behaviour of the
steel fibre-reinforced concrete.
Inverse analysis for interpreting the test results from the WST (i.e. splitting
load vs. CMOD curves) as a -w relationship (outlined in Section 4.2.2).
Adjustment of the -w relationship by considering the differences in fibre
efficiency factor between the WST specimens and the beams (outlined in
Section 4.2.3).
Cross-sectional analyses of the beams, using the non-linear hinge model, to
obtain relationships between moment and curvature and between moment and
crack opening.
Structural analyses to predict the structural behaviour. For this purpose, the
finite element method can be used, but the response can also be predicted by
using the results from the cross-sectional analyses where the displacement is
obtained by integrating the curvature.
The approach and the steps are schematically illustrated in Figure 98.
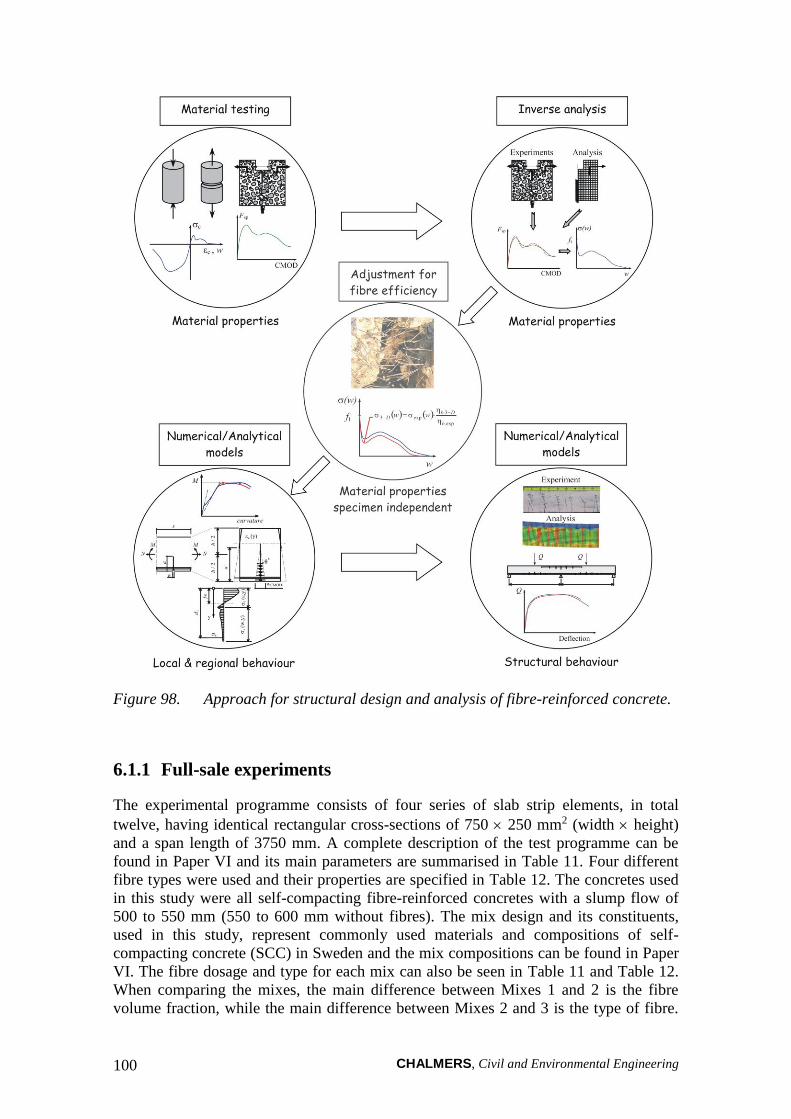
CHALMERS, Civil and Environmental Engineering 100
Figure 98. Approach for structural design and analysis of fibre-reinforced concrete.
6.1.1 Full-sale experiments
The experimental programme consists of four series of slab strip elements, in total
twelve, having identical rectangular cross-sections of 750 250 mm2 (width height)
and a span length of 3750 mm. A complete description of the test programme can be
found in Paper VI and its main parameters are summarised in Table 11. Four different
fibre types were used and their properties are specified in Table 12. The concretes used
in this study were all self-compacting fibre-reinforced concretes with a slump flow of
500 to 550 mm (550 to 600 mm without fibres). The mix design and its constituents,
used in this study, represent commonly used materials and compositions of self-
compacting concrete (SCC) in Sweden and the mix compositions can be found in Paper
VI. The fibre dosage and type for each mix can also be seen in Table 11 and Table 12.
When comparing the mixes, the main difference between Mixes 1 and 2 is the fibre
volume fraction, while the main difference between Mixes 2 and 3 is the type of fibre.

CHALMERS, Civil and Environmental Engineering 101
The fibres for Mixes 1 and 2 were standard fibres, but in Mix 3 the majority of the
fibres were high-performance fibres (i.e. high aspect ratio and tensile strength).
However, Mix 4 is slightly different in that one third of the fibres were steel microfibres
and, to improve the bond of these fibres, the amount of silica fume was increased.
Furthermore, to achieve a compressive and tensile strength comparable to the other
mixes, entrained air was used. All the concrete was produced by a ready-mix producer
(AB Färdig Betong) in batches of 4 m3 or 2 m3 using a central drum mixer with a
capacity of 6 m3.
Table 11. Summary of test program
Specimen Concrete Steel fibres Reinforcement (welded wire mesh)
Dosage (%) & Type
(see Table 12) – Spacing
[mm]
Nom. yield
strength
[%]
S1:1 6-150/700 Mix 1 0.25 type 1 & 2 6 - s 150 NPS 700 0.075
S1:2 7-150/700 Mix 1 0.25 type 1 & 2 7 - s 150 NPS 700 0.103
S1:3 7-150/500 Mix 1 0.25 type 1 & 2 7 - s 150 NPS 500 0.103
S1:4 6-100/500 Mix 1 0.25 type 1 & 2 6 - s 100 NPS 500 0.121
S2:1 6-150/700 Mix 2 0.5 type 1 & 0.25 type 2 6 - s 150 NPS 700 0.075
S2:2 7-150/700 Mix 2 0.5 type 1 & 0.25 type 2 7 - s 150 NPS 700 0.103
S2:3 7-150/500 Mix 2 0.5 type 1 & 0.25 type 2 7 - s 150 NPS 500 0.103
S2:4 6-100/500 Mix 2 0.5 type 1 & 0.25 type 2 6 - s 100 NPS 500 0.121
S3:1 6-150/700 Mix 3 0.5 type 3 & 0.25 type 1 6 - s 150 NPS 700 0.075
S3:2 7-150/700 Mix 3 0.5 type 3 & 0.25 type 1 7 - s 150 NPS 700 0.103
S4:1 6-150/700 Mix 4 0.25 type 2, 3, & 4 6 - s 150 NPS 700 0.075
S4:2 7-150/700 Mix 4 0.25 type 2, 3, & 4 7 - s 150 NPS 700 0.103
Table 12. Fibre specification.
Fibre type Supplier Brand
name
Aspect
ratio
Length
[mm]
Diameter
[mm]
Configuration Strength
[MPa]
1: RC 65/35 BN Bekaert Dramix 64 35 0.55 Hooked ends 1 100
2: RC 65/60 BN Bekaert Dramix 67 60 0.90 Hooked ends 1 100
3: RC 80/35 BP Bekaert Dramix 78 35 0.45 Hooked ends 2 300
4: OL 13/0.16 Bekaert 81 13 0.16 Straight
(Brass coated)
2 000
The slab strips were simply supported (rollers at both ends) with a span of 3750 mm and
subjected to a four-point load, according to Figure 99, with a distance between the loads
of 1250 mm. The tests were conducted with deflection control (at a rate of approx. 0.2
mm/min), and during the tests the following parameters were measured: load,
deflections and support settlements, and at two points the width and height of a crack.
The deflection was measured at mid-span and at four additional points between the
loads; at all measuring points, two displacement transducers were used (see Figure 99).

CHALMERS, Civil and Environmental Engineering 102
3750
4050
1250
Q Q
C L
250 250 250 250 Displacement
transducer
b=750
h=
250
d=
225
SECTION A-A ELEVATION
A
A
Wire mesh
125 Displacement
transducer 1250 1250
Roller Roller
Figure 99. Schematic picture of test set-up, with indication of the points of deflection
measurements, and details of the slab strips (units: mm).
The load versus deflection and moment versus crack opening curves obtained from the
tests can be seen in Paper VI. The initial response before cracking was almost
independent of the type of mix and type of reinforcement. After the formation of cracks,
all the beams exhibited a non-linear load vs. deflection characteristic. The peak-load and
post-peak behaviour was determined by a single crack, which continued to grow while
the other cracks closed. The final failure was caused by rupture of the reinforcement.
The higher fibre dosage for Mixes 2 to 4 leads to a stiffer behaviour after cracking, to
increased peak load, and to a larger deflection at the peak load. Comparing the different
mixes, Mix 4 resulted in the highest increase in the peak load but, as the mix contained
some short fibres, it showed a less ductile behaviour than Mix 3. In the figures
presented in Paper VI, it can be observed that the crack width depends on the type and
amount of reinforcement as well as on the efficiency of the fibres. Generally, at the peak
load the measured crack width was between 0.4 and 0.8 mm, which coincided with the
peak of the ascending part of the -w relationship (see Figure 115). Furthermore, in the
tests the primary flexural cracks had a spacing equal to the welded mesh spacing; see
Figure 100.
(a)
(b)
(c)
(d)
Figure 100. Photos of crack patterns for some of the tested beams (reinforcement 7-
s150 NPS 700): (a) Mix 1 – S1:1 7-150/700; (b) Mix 2 – S2:1 7-150/700;
(c) Mix 3 – S3:1 7-150/700; and (d) Mix 4 – S4:1 7-150/700.
CHALMERS, Civil and Environmental Engineering 103
6.1.2 Fibre quantity and distribution in specimens
The fibre quantity and distribution were investigated for Mixes 1 and 2 by performing
wash-out tests of the fresh concrete and by taking out cores from the slab specimens.
The wash-out tests were performed on the concrete used for measuring the air content,
which means that one sample was made and that it had a volume of 8 litres. For Mix 1
the measured fibre quantity was 35.3 kg/m3 (with C 65/35 18.6 kg/m3 and RC 65/60
16.7 kg/m3) and for Mix 2 it was 50.3 kg/m3 (with C 65/35 33.4 kg/m3 and RC 65/60
16.9 kg/m3). Hence, based on this spot test it seems that the fibre quantity was slightly
lower than the nominal dosage, about 90% for Mix 1 and 85% for Mix 2. However,
only one sample was taken for each mix and, as the variation is usually quite large, it is
not possible to state the quantity based on this.
After the slab specimens had been tested, cores were taken out in order to investigate
the distribution of fibres within the specimens. The cores were taken out at the end of
the specimens (approximately 500 to 750 mm from the ends) and these were cut into
three pieces and their volume was determined; after that they were crushed and the
weight of the fibres was determined. The result of the fibre distribution for Mixes 1 and
2 can be seen in Figure 101. For Mix 1 the average fibre content was 45.2 kg/m3 (CoV
8.4%) and for Mix 2 it was 61.8 kg/m3 (CoV 4.4%). It can be observed that for Mix 1
the distribution is fairly even over the height; see Figure 101(a), but that one specimen
has a significantly higher fibre quantity (S1:4 6-100/500). It should be noted that
specimen S1:4 6-100/500 was the first specimen to be cast and the concrete was not
entirely homogeneous (containing more aggregates) and did not flow as well as it did
for the other specimens. For Mix 2 there appears to be a little segregation, especially for
one of the cores (specimen S2:2 7-150/700); see Figure 101(b). Mix 2 had a slightly
higher superplasticizer dosage and, as a result, had a higher flowability and a lower
yield stress. Moreover, it can be seen that there appear to be more fibres than the
nominal dosage (for Mix 1 it was 39.3 and for Mix 2 it was 58.9 kg/m3).
Hence, there seems to be some contradiction between the wash-out tests and the cores;
the wash-out tests indicate a lower fibre quantity while the cores indicate a higher fibre
quantity than the nominal dosage. However, a possible explanation for some of this
difference for the cores could be that, in the mix design, the air content was assumed to
be much higher than was actually measured (5.5% as compared to 2.6-2.8%), which
may explain a difference of about 1.2 kg for Mix 1 and 1.8 kg for Mix 2. It is also
possible that the air content was further reduced when casting the slabs. However, this
can only explain a part of the difference.

CHALMERS, Civil and Environmental Engineering 104
0
83
167
250
30 40 50 60
Amount of fibres [kg/m3]
S1:1 6-150/700S1:2 7-150/700S1:2 7-150/700S1:3 7-150/500S1:4 6-100/500Average Mix 1
Dis
tance
fro
m b
ottom
of
slab
[m
m]
Mix 1
0
83
167
250
40 50 60 70 80
Amount of fibres [kg/m3]
S2:1 6-150/700S2:1 6-150/700S2:2 7-150/700
S2:3 7-150/500S2:4 6-100/500Average Mix 2
Dis
tance
fro
m b
ottom
of
slab
[m
m] Mix 2
(a) (b)
Figure 101. Distribution of fibres in the elements: (a) for Mix 1 and (b) for Mix 2.
6.1.3 Materials testing
The compressive strength of the fibre-reinforced concrete was determined by testing the
compressive strength, which was determined at 7 and 28 days on water-cured cube
specimens (150150150 mm3); it was also measured on cylinder specimens ( =
150 mm and h = 300 mm). The cylinder specimens were tested at the same time as the
full-scale tests were performed (at 50 to 55 days) and the cylinders were cured (under
plastic cover) together with the slab strip elements. The modulus of elasticity was
determined from three cylinders for each mix; two strain gauges were attached and the
strain was measured at a stress level of 0.45fcc. The results from the compressive
strength tests are listed in Table 13.
Table 13. Properties of the concrete.
Mix
Density
[kg/m3]
fc.cube 7d
[MPa]
fc.cube 28d
[MPa]
fc.cyl
[MPa]
Eci
[GPa]
Mix 1 2 330 39.2 52.4 55.4 32.7
Mix 2 2 344 41.7 54.3 57.4 33.1
Mix 3 2 384 42.5 54.9 54.3 31.7
Mix 4 2 353 38.6 55.1 55.5 31.3
The tensile fracture behaviour of the fibre-reinforced concretes was determined by
conducting wedge-splitting tests (WST), using six specimens (for each mix) having a
geometry according to Figure 102. The results from these tests can be seen in Figure
103, which shows the load versus CMOD and the dissipated energy versus CMOD, and
in Figure 104, presenting the scatter in the test results. When examining the results, the
following observations can be made: (1) Mix 1 has, as expected, the lowest energy
dissipation and the largest scatter; (2) Mix 2 performs less well than the other mixes
with the same amount of fibres, having only a slightly higher energy dissipation than
Mix 1 (but the peak splitting load is higher); and (3) there are only minor differences
between Mixes 3 and 4, but Mix 4 has less scatter. For Mix 2, fibre fracture is
responsible for the large decrease in the splitting load after the peak load, which also
resulted in increased scatter for the load (for CMOD > 4 mm). The cause of this
behaviour is that the bond between the fibre and the matrix was too good for these fibres

CHALMERS, Civil and Environmental Engineering 105
(the fibres used had a strength of 1100 MPa). In the other three mixes, fibres with a
higher strength were used for the majority of fibres.
Figure 102. Specimen geometry used in the experiments.
0
2 000
4 000
6 000
8 000
10 000
0 2 4 6 8 10
CMOD [mm]
Mix 1
Mix 2
Mix 3
Mix 4
Sp
litt
ing
Lo
ad
[N
]
0
2 000
4 000
6 000
8 000
0 2 4 6 8 10
CMOD [mm]
Mix 1
Mix 2
Mix 3
Mix 4D
issi
pate
d E
nerg
y [
Nm
/m2]
(a) (b)
Figure 103. Comparison of test results from the WST: (a) average splitting load vs.
CMOD curves and (b) the dissipated energy.
0%
5%
10%
15%
20%
25%
0 2 4 6 8 10
CMOD [mm]
Mix 1 Mix 2
Mix 3
Mix 4
Co
V f
or
Sp
litt
ing
Lo
ad
[%
]
0%
5%
10%
15%
20%
25%
0 2 4 6 8 10
CMOD [mm]
Mix 1
Mix 2
Mix 4
Mix 3
Co
V f
or
Dis
sip
ate
d E
nerg
y [
%]
(a) (b)
Figure 104. Comparison of the scatter in the results from the WST: (a) the splitting
load and (b) the dissipated energy.

CHALMERS, Civil and Environmental Engineering 106
6.1.4 Inverse analysis
Using the approaches presented in Paper V, inverse analyses were conducted by using
the finite element program DIANA (see TNO 2002) with a poly-linear relationship, and
through use of a Matlab program where a bi-linear relationship can be determined. The
Matlab program was developed at DTU by Østergaard (2003) and is based on the
cracked hinge model by Olesen (2001); see Østergaard and Olesen (2004). In these
wedge-splitting tests, the response was determined to be a CMOD of 10 mm. Following
the recommendations provided in Paper V, it is reasonable that the -w relationship can
be determined up to a crack opening of w = 2.5 mm.
The results from the inverse analysis using DIANA and a poly-linear relationship are
presented in Figure 105 to Figure 108, which show a comparison between the
experimentally obtained curves and the inverse analysis; in the figures, the ratio
between the experiment and analysis is shown (on the second y-axis). Furthermore, both
the measured splitting load and the calculated energy dissipation are accounted for. As
can be seen in these figures, the agreement between experiments and analyses is good –
the deviation is less than 5% – and the dissipated energy can be fitted very accurately.
0
2 000
4 000
6 000
0 2 4 6 8 10
CMOD [mm]
Splittin
g L
oad
, F
sp ,
[N]
0.95
1.00
1.05
Fsp
.In
v / F
sp.E
xp [
-]
F sp.Inv / F sp.Exp
Mix 1 (FEA)
0
1 000
2 000
3 000
4 000
5 000
0 2 4 6 8 10
CMOD [mm]
0.95
1.00
1.05
Gf.
Inv
/ G
f.E
xp
[-]
Mix 1 (FEA)
G f.Inv / G f.Exp
Dis
sipat
ed e
neg
y [
Nm
/m2]
(a) (b)
Figure 105. Comparison of results from WST and inverse analysis for Mix 1: (a) the
splitting load and (b) the dissipated energy.
0
2 000
4 000
6 000
8 000
0 2 4 6 8 10
CMOD [mm]
Splittin
g L
oad
, F
sp ,
[N]
0.95
1.00
1.05
Fsp
.In
v / F
sp.E
xp [
-]
F sp.Inv / F sp.Exp
Mix 2 (FEA)
0
2 000
4 000
6 000
0 2 4 6 8 10
CMOD [mm]
0.95
1.00
1.05
Gf.
Inv /
Gf.
Ex
p [
-]
Mix 2 (FEA)
G f.Inv / G f.Exp
Dis
sipat
ed e
neg
y [
Nm
/m2]
(a) (b)
Figure 106. Comparison of results from WST and inverse analysis for Mix 2: (a) the
splitting load and (b) the dissipated energy.

CHALMERS, Civil and Environmental Engineering 107
0
2 000
4 000
6 000
8 000
10 000
0 2 4 6 8 10
CMOD [mm]
Splittin
g L
oad
, F
sp ,
[N]
0.95
1.00
1.05
Fsp
.In
v / F
sp.E
xp [
-]
F sp.Inv / F sp.Exp
Mix 3 (FEA)
0
2 000
4 000
6 000
8 000
0 2 4 6 8 10
CMOD [mm]
0.95
1.00
1.05
Gf.
Inv /
Gf.
Ex
p [
-]
Mix 3 (FEA)
G f.Inv / G f.Exp
Dis
sipat
ed e
neg
y [
Nm
/m2]
(a) (b)
Figure 107. Comparison of results from WST and inverse analysis for Mix 3: (a) the
splitting load and (b) the dissipated energy.
0
2 000
4 000
6 000
8 000
10 000
0 2 4 6 8 10
CMOD [mm]
Splittin
g L
oad
, F
sp ,
[N]
0.95
1.00
1.05F
sp.I
nv / F
sp.E
xp [
-]
F sp.Inv / F sp.Exp
Mix 4 (FEA)
0
2 000
4 000
6 000
8 000
0 2 4 6 8 10
CMOD [mm]
0.95
1.00
1.05
GF
f.In
v /
Gf.
Ex
p [
-]
Mix 4 (FEA)
G f.Inv / G f.Exp
Dis
sipat
ed e
neg
y [
Nm
/m2]
(a) (b)
Figure 108. Comparison of results from WST and inverse analysis for Mix 4: (a) the
splitting load and (b) the dissipated energy.
The results from the inverse analysis using the Matlab program and a bi-linear
relationship are presented in Figure 109 to Figure 112, which show a comparison
between the experimentally obtained curves and the inverse analysis; in these figures
too, the ratio between the experiment and analysis is shown (on the second y-axis).
Furthermore, both the measured splitting-load and the calculated energy dissipation are
accounted for. As can be seen in these figures, the agreement between experiments and
analyses is not as good as for the poly-linear relationship – the deviation is higher than
5% – but the dissipated energy can be fitted with sufficient accuracy.

CHALMERS, Civil and Environmental Engineering 108
0
2 000
4 000
6 000
0 2 4 6 8 10
CMOD [mm]
Splittin
g L
oad
, F
sp ,
[N]
0.90
0.95
1.00
1.05
1.10
Fsp
.In
v / F
sp.E
xp [
-]
F sp.Inv / F sp.Exp
Mix 1 (Bi-lin)
0
1 000
2 000
3 000
4 000
5 000
0 2 4 6 8 10
CMOD [mm]
0.95
1.00
1.05
Gf.
Inv /
Gf.
Ex
p [
-]
Mix 1 (Bi-lin)
G f.Inv / G f.ExpDis
sipat
ed e
neg
y [
Nm
/m2]
(a) (b)
Figure 109. Comparison of results from WST and inverse analysis for Mix 1: (a) the
splitting load and (b) the dissipated energy.
0
2 000
4 000
6 000
8 000
0 2 4 6 8 10
CMOD [mm]
Splittin
g L
oad
, F
sp ,
[N]
0.90
0.95
1.00
1.05
1.10F
sp.I
nv / F
sp.E
xp [
-]
F sp.Inv / F sp.Exp
Mix 2 (Bi-lin)
0
2 000
4 000
6 000
0 2 4 6 8 10
CMOD [mm]
0.95
1.00
1.05
Gf.
Inv /
Gf.
Ex
p [
-]
Mix 2 (Bi-lin)
G f.Inv / G f.Exp
Dis
sipat
ed e
neg
y [
Nm
/m2]
(a) (b)
Figure 110. Comparison of results from WST and inverse analysis for Mix 2: (a) the
splitting load and (b) the dissipated energy.
0
2 000
4 000
6 000
8 000
10 000
0 2 4 6 8 10
CMOD [mm]
Splittin
g L
oad
, F
sp ,
[N]
0.90
0.95
1.00
1.05
1.10
Fsp
.In
v / F
sp.E
xp [
-]
F sp.Inv / F sp.Exp
Mix 3 (Bi-lin)
0
2 000
4 000
6 000
8 000
0 2 4 6 8 10
CMOD [mm]
0.95
1.00
1.05G
f.In
v /
Gf.
Ex
p [
-]
Mix 3 (Bi-lin)
G f.Inv / G f.Exp
Dis
sipat
ed e
neg
y [
Nm
/m2]
(a) (b)
Figure 111. Comparison of results from WST and inverse analysis for Mix 3: (a) the
splitting load and (b) the dissipated energy.

CHALMERS, Civil and Environmental Engineering 109
0
2 000
4 000
6 000
8 000
10 000
0 2 4 6 8 10
CMOD [mm]
Splittin
g L
oad
, F
sp ,
[N]
0.90
0.95
1.00
1.05
1.10
Fsp
.In
v / F
sp.E
xp [
-]
F sp.Inv / F sp.Exp
Mix 4 (Bi-lin)
0
2 000
4 000
6 000
8 000
0 2 4 6 8 10
CMOD [mm]
0.95
1.00
1.05
Gf.
Inv /
Gf.
Ex
p [
-]
Mix 4 (Bi-lin)
G f.Inv / G f.ExpDis
sipat
ed e
neg
y [
Nm
/m2]
(a) (b)
Figure 112. Comparison of results from WST and inverse analysis for Mix 4: (a) the
splitting load and (b) the dissipated energy.
The tensile strength and the stress-crack opening relationship were determined by
conducting inverse analysis using the results from the wedge-splitting tests, and the
results are presented in Table 14 and Figure 113.
Table 14. Estimated tensile strength of the concrete.
Mix fct.FEA
[MPa]
fct.Bi-lin
[MPa]
Mix 1 3.3 3.2
Mix 2 3.3 3.6
Mix 3 3.3 3.8
Mix 4 3.3 3.8
0.0
1.0
2.0
3.0
4.0
0.0 0.5 1.0 1.5 2.0 2.5
Crack opening [mm]
Ten
sile
str
ess
[M
Pa]
Mix 3
Mix 1
(V f = Mix 2
Mix 4
0.0
1.0
2.0
3.0
4.0
0.0 0.5 1.0 1.5 2.0 2.5
Crack opening [mm]
Ten
sile
str
ess
[M
Pa]
Mix 3
Mix 1
(V f = Mix 2
Mix 4
(a) (b)
Figure 113. The -w relationships for WST specimens determined by inverse analysis:
(a) the multi-linear relationship and (b) the bi-linear relationship.

CHALMERS, Civil and Environmental Engineering 110
6.1.5 Adjustment of the -w relationship for fibre efficiency
As pointed out in Chapter 4, it is imperative that the -w relationship be adjusted for
any differences in fibre efficiency between the material test specimen and the element
where the material is to be used. Hence, the approach suggested in Chapter 4 was used;
all the fibres were counted in the fractured specimens and the experimental fibre
efficiency factor, b.exp, was determined, which is presented in Figure 114 together with
a figure showing the scatter. The fibre efficiency factor for the slab strip elements was
determined by considering the dimensions and the fibre geometry and nominal dosage;
for this purpose an approach suggested by Dupont and Vandewalle (2005) was used.
Following this approach, the factor was calculated to be b.slab = 0.52, and it can be seen
in Figure 114 together with the WST specimens. Evidently the WST specimens in all
mixes had a higher value, thus indicating more fibres being pulled out. For the slab strip
elements, the dimensions (in relation to the length of the fibres) are such that the fibre
orientation is close to, but slightly higher than, the random 3-D orientation.
0.60
0.52 0.52 0.52
0.59
0.63
0.55
0.52
0.45
0.50
0.55
0.60
0.65
Mix 1 Mix 2 Mix 3 Mix 4
Fib
re e
ffic
ien
cy
facto
r,
b.e
xp, [-
]
b.2D = 0.64
b.3D = 0.5
WST
Slab strip
12.4%
6.6%
11.2%
4.3%
0%
5%
10%
15%
20%
Mix 1 Mix 2 Mix 3 Mix 4
CO
V
b.e
xp
[%]
(a) (b)
Figure 114. (a) The average experimental fibre efficiency factor for the WST
specimens (at right) compared to the theoretical value for the slab strips
(at left) and random 2D- and 3D-orientation. (b) The coefficient of
variance for the fibre efficiency factor.
To account for the differences in fibre efficiency factor between the WST specimens
and the slab strip elements, the stress-crack opening relationship obtained from the
inverse analyses (see Figure 113) was reduced by the ratio between the two fibre
efficiency factors, according to:
exp.
.exp..
b
slabbbslabb ww
The adjusted -w relationship is presented in Figure 115. Comparing the different
mixes, it can be seen that Mix 1, with the low dosage, has the lowest stress level after
cracking. Furthermore, when comparing Mixes 2 to 4 (which had the same dosage) it
can be observed that Mix 2 does not perform as well as the other two mixes, and that at
0.5 mm the stress descends more rapidly (due to fibre fracture). Comparing Mixes 3 and
4, they have almost the same behaviour but Mix 4 is more effective for crack openings
smaller than 0.2 mm. The main difference between these mixes is the type of fibres that
were used, but for Mix 4 a small modification of the mix composition was also made. In
Mixes 1 and 2, a standard fibre was used (having an aspect ratio of about 65 and a

CHALMERS, Civil and Environmental Engineering 111
tensile strength of 1100 MPa), while in Mix 3 a high-performance fibre (having an
aspect ratio of about 80 and a tensile strength of 2300 MPa) was used in combination
with a small amount (1/3 of the total amount) of the standard fibre. Moreover, in Mix 4
steel microfibres were used in combination with two other fibre types, and the mix
composition had been slightly adjusted by increasing the silica fume dosage and adding
an air entertainer. See Table 12 for a full specification of the fibres, and Paper VI for the
mix composition.
0.0
1.0
2.0
3.0
4.0
0.0 0.5 1.0 1.5 2.0
Crack opening [mm]
Ten
sile
str
ess
[M
Pa]
Mix 3
Mix 1Mix 2
Materials test spec. => Structure
Adjusted for fibre efficiency
Mix 4
0.0
1.0
2.0
3.0
4.0
0.0 0.1 0.2 0.3 0.4 0.5
Crack opening [mm]T
en
sile
str
ess
[M
Pa]
Mix 2
Mix 1Mix 3
Materials test spec. => Structure
Adjusted for fibre efficiency
Mix 4
(a) (b)
Figure 115. -w relationships adjusted for fibre efficiency: (a) the complete
relationship and (b) for small crack openings.
6.1.6 Analysis of experiments
To achieve a deeper understanding of the structural and fracture behaviour, non-linear
fracture mechanics was applied, using the finite element method. The general finite
element program Diana was used in all analyses; see TNO (2002). The concrete was
modelled with four-node quadrilateral isoparametric plane stress elements, with an
element size of 12.5 mm (20 elements over the height of the section). For the
reinforcement, two different approaches were investigated (for some of the elements):
with truss elements, where the interaction between the reinforcement and the concrete
was modelled by using special interface elements describing the bond-slip relation; and
with the concept of ‘embedded’ reinforcement (see TNO, 2002). For the case where the
bond-slip was considered, its relationship was chosen according to CEB-FIP MC90 (see
CEB 1993), and confined concrete with good bond conditions was assumed. In addition,
the analytical approach presented in Chapter 5 was used.
In all FE analyses of the experiments, a constitutive model based on non-linear fracture
mechanics, using a rotating crack model based on total strain, was used for the concrete;
see TNO (2002). For the case where the bond-slip was considered, the deformation of
one crack was smeared over a length corresponding to the size of the localised area. The
size of the localised area was: for Mix 1 two elements (25 mm); for Mix 2 four elements
(50 mm); and for Mixes 3 and 4 six elements (75 mm). For the case with ‘embedded’
reinforcement, the deformation of one crack was smeared over the crack spacing
obtained in the experiments, i.e. the spacing of the reinforcement mesh. For the tension
softening, the multi-linear curves obtained from inverse analysis were used; see Figure

CHALMERS, Civil and Environmental Engineering 112
116 and Figure 117. Furthermore, the values used for compressive strength and modulus
of elasticity were according to the values determined on the cylinders (see Table 14).
The hardening in compression was described by the expression of Thorenfeldt et al.
(1987). The constitutive behaviour of the welded-mesh steel was modelled by the Von
Mises yield criterion with associated flow and isotropic hardening. The values used for
the different welded meshes are shown in Table 15.
For the non-linear hinge model, the bi-linear -w relationships (determined through
inverse analyses) were used as well as tri-linear relationships; these can be seen in
Figure 116 and Figure 117.
Table 15. Properties of the welded mesh reinforcement.
– Spacing
[mm]
fy,nom
[MPa]
fy,act
[MPa]
fu
[MPa] u
[%]
Es
[GPa]
6 - s 150 700 743 856 6.4 193
7 - s 150 700 737 853 7.0 194
7 - s 150 500 555 690 5.1 194
6 - s 100 500 497 623 6.3 193
0.0
1.0
2.0
3.0
4.0
0.0 0.5 1.0 1.5 2.0
Crack opening [mm]
Mix 1: Bi-lin
Ten
sile
str
ess
[M
Pa]
Mix 1: Tri-lin
0.0
1.0
2.0
3.0
4.0
0.0 0.5 1.0 1.5 2.0
Crack opening [mm]
Mix 2: Bi-lin
Ten
sile
str
ess
[M
Pa] Mix 2: Tri-lin
(a) (b)
Figure 116. Stress-crack opening relationships used in analysis (bi- and tri-linear):
(a) for Mix 1 and (b) for Mix 2.
0.0
1.0
2.0
3.0
4.0
0.0 0.5 1.0 1.5 2.0
Crack opening [mm]
Mix 3: Tri-lin
Ten
sile
str
ess
[M
Pa]
Mix 3: Bi-lin
0.0
1.0
2.0
3.0
4.0
0.0 0.5 1.0 1.5 2.0
Crack opening [mm]
Mix 4: Tri-lin
Ten
sile
str
ess
[M
Pa]
Mix 4: Bi-lin
(a) (b)
Figure 117. Stress-crack opening relationships used in analysis (bi- and tri-linear):
(a) for Mix 3 and (b) for Mix 4.

CHALMERS, Civil and Environmental Engineering 113
Table 16 summarises the peak loads obtained in the experiments and the corresponding
results from the different models. Moreover, Figure 118 shows plots where the
experimental results have been plotted against model results. It appears that the peak
load can be predicted fairly accurately, and there is a good correlation between
experimental and model results. The best agreement is achieved for the finite element
model. The analytical model seems also to give a reasonable agreement; however, it
seems that better agreement is obtained by using the bi-linear relationship, as with the
tri-linear relationship the peak load is somewhat overestimated. On the other hand, the
bi-linear relationship has a slightly poorer correlation and the variation is larger.
However, it should be pointed out that the adjustment of the -w relationship was done
by assuming the nominal fibre volume fraction, and not the measured content in the
cores that were taken out from the slabs, as this result was not complete until after all
the analyses had been performed. The consequence of increased fibre content (if that is
the case) would have led to a slightly higher predicted peak load if it had been
considered.
Table 16. Comparison of maximum load from experiments and the analyses (the
finite element analyses and the non-linear model, using tri- and bi-linear
relationships).
Specimen
QExp.
[kN]
QFEA
[kN]
QTri-lin
[kN]
QBi-lin
[kN]
QFEA / QExp. QTri-lin / QExp. QBi-lin / QExp.
S1:1 6-150/700 -35.3 -36.6 -39.8 -37.6 1.04 1.13 1.06
S1:2 7-150/700 -43.9 -44.6 -45.8 -43.7 1.02 1.04 1.00
S1:3 7-150/500 -38.9 -39.1 -41.7 -39.0 1.01 1.07 1.00
S1:4 6-100/500 -42.3 -41.5 -43.0 -40.1 0.98 1.02 0.95
S2:1 6-150/700 -43.0 -43.9 -49.6 -46.8 1.02 1.15 1.09
S2:2 7-150/700 -52.8 -55.0 -56.0 -52.8 1.04 1.06 1.00
S2:3 7-150/500 -51.5 -51.3 -50.6 -47.6 1.00 0.98 0.92
S2:4 6-100/500 -47.8 -49.6 -52.6 -49.2 1.04 1.10 1.03
S3:1 6-150/700 -49.2 -50.2 -55.5 -46.9 1.02 1.13 0.95
S3:2 7-150/700 -55.1 -55.2 -61.7 -52.7 1.00 1.12 0.96
S4:1 6-150/700 -51.9 -52.0 -56.3 -53.5 1.00 1.08 1.05
S4:2 7-150/700 -58.3 -57.6 -62.5 -59.5 0.99 1.07 1.04
Average:
CoV [%]:
Correlation:
1.01
1.93%
0.99
1.08
4.61%
0.95
1.00
5.09%
0.94
R2 = 0.982
-80
-60
-40
-20
0
-80-60-40-200
FE analyses
Q E
xp
. [k
N]
Q Model [kN]
R2 = 0.905
-80
-60
-40
-20
0
-80-60-40-200
Tri-linear
Q E
xp
. [k
N]
Q Model [kN]
R2 = 0.882
-80
-60
-40
-20
0
-80-60-40-200
Bi-linear
Q E
xp
. [k
N]
Q Model [kN]
(a) (b) (c)
Figure 118. Comparison of maximum load from experiments and models: (a) for the
FE analyses using a poly-linear relationship; (b) for a tri-linear -w
relationship; and (c) for a bi-linear -w relationship.

CHALMERS, Civil and Environmental Engineering 114
In Figure 119 and Figure 120, a comparison is made between the load versus deflection
curves obtained in the experiments and the FE analyses. In general, in most cases
compared with the experimental results, the FE models predict a stiffer response and it
was difficult to follow the post-peak response, as multiple cracking and localised
crushing made the numerical solution unstable in several of the analyses. Also the non-
linear hinge model predicted a stiffer response than the experimental results, as can be
seen in Figure 121(a). The difference in the predicted peak load between the two
modelling approaches used in the FE analyses was generally small; see Figure 121(b).
However, the FE model considering the bond-slip worked better for the specimens with
the low fibre content (Mix 1), where cracks localise with a crack spacing similar to the
ones observed in the experiments, than for the specimens with the high fibre content
(Mixes 2 to 4) where cracking occurs over a large region and, as a result, the material
behaviour in the form of the tensile stress–strain relationship had to be adjusted. On the
other hand, the FE model with the ‘embedded’ reinforcement predicted the overall
structural behaviour well for all mixes, but it was not capable of providing a realistic
crack pattern (not even for the mixes with the low fibre content); see Figure 121(b).
-60
-40
-20
0
0 10 20 30 40 50
Mid-span deflection [mm]
Lo
ad
[k
N]
S1:1 6-150/700Mix 1 & 2
S2:1 6-150/700
-60
-40
-20
0
0 10 20 30 40 50
Mid-span deflection [mm]
Lo
ad
[k
N]
S3:1 6-150/700
Mix 3 & 4
S4:1 6-150/700
(a) (b)
Figure 119. Comparison of load vs. deflection for the FE analyses (thin lines
represent analysis): (a) for Mixes 1 & 2 and (b) for Mixes 3 & 4.
-60
-40
-20
0
0 10 20 30 40 50
Mid-span deflection [mm]
Lo
ad
[k
N]
S2:2 7-150/700
Mix 1 & 2
S1:2 7-150/700
-60
-40
-20
0
0 10 20 30 40 50
Mid-span deflection [mm]
Lo
ad
[k
N]
S3:2 7-150/700
Mix 3 & 4
S4:2 7-150/700
(a) (b)
Figure 120. Comparison of load vs. deflection for the FE analyses (thin lines
represent analysis): (a) for Mixes 1 & 2 and (b) for Mixes 3 & 4.

CHALMERS, Civil and Environmental Engineering 115
-50
-40
-30
-20
-10
0
0 10 20 30 40
Mid-span deflection [mm]
Lo
ad
[k
N]
FE bond-slip
FE embedded
reinforcement
Analytical
Experiment
S1:2 7-150/700
(Mix 1)
Experiment
FE ‘bond-slip’
FE ‘embedded’
(a) (b)
Figure 121. Comparison of experiments and analyses for specimen S1:2 7-150/700:
(a) the load vs. deflection curve and (b) crack pattern (the red or dark
regions indicate cracked areas).
The measured deflections in experiments have been used to determine the average
curvature in the region with constant moment. The curvature was determined by
piecewise fitting of circular arcs using the five points at which the deflections were
measured; see e.g. Ooi and Ramsey (2003). The curvatures, from experiments and
analyses, are presented in Figure 122 and Figure 123 and it can be seen that this seems
to correspond reasonably. The measured and the calculated crack opening can be seen in
Figure 124 to Figure 126 and when comparing these it seems to be quite good
agreement for most of the tested beams. Furthermore, the difference using a bi-linear or
the tri-linear relationship is rather small. However, it can also be seen that the moment
versus curvature relationship demonstrates a softening behaviour, and that in many
cases there is no distinct yield plateau, characteristic of conventional reinforce concrete;
a similar observation was made by Pfyl (2003). To avoid this type of behaviour, two
possibilities exist: (1) the -w relationship should exhibit a negligible stress decrease
between two critical crack openings (for the bi-linear relationship this translates to a low
a2 value); and (2) a reinforcement with a different hardening behaviour, e.g. a higher
ratio between the yield strength and the tensile strength, could be used.

CHALMERS, Civil and Environmental Engineering 116
0
15
30
45
60
75
90
0.00 0.01 0.02 0.03 0.04
Curvature [1/m]
6-s150, 700
Mix 1 & 2
S2:1 6-150/700
S1:1 6-150/700Mo
men
t [k
Nm
]
0
15
30
45
60
75
90
0.00 0.01 0.02 0.03 0.04
Curvature [1/m]
6-s150, 700
Mix 3 & 4
S3:1 6-150/700
S4:1 6-150/700
Mo
men
t [k
Nm
]
(a) (b)
Figure 122. Comparison of moment vs. curvature using the bi-linear -w relationship
and the analytical model (thin lines represent analysis): (a) for Mixes 1 &
2 and (b) for Mixes 3 & 4.
0
15
30
45
60
75
90
0.00 0.01 0.02 0.03 0.04
Curvature [1/m]
7-s150, 700
Mix 1 & 2
S1:2 7-150/700
S2:2 7-150/700
Mo
men
t [k
Nm
]
0
15
30
45
60
75
90
0.00 0.01 0.02 0.03 0.04
Curvature [1/m]
7-s150, 700
Mix 3 & 4
S3:2 6-150/700
S4:2 6-150/700
Mo
men
t [k
Nm
]
(a) (b)
Figure 123. Comparison of moment vs. curvature using the bi-linear -w relationship
and the analytical model (thin lines represent analysis): (a) for Mixes 1 &
2 and (b) for Mixes 3 & 4.
0
15
30
45
60
75
90
0.0 0.2 0.4 0.6 0.8 1.0
Crack opening [mm]
Mix 2
S2:2 7-150/700
S2:1 6-150/700
Mom
ent [k
Nm
]
0
15
30
45
60
75
90
0.0 0.2 0.4 0.6 0.8 1.0
Crack opening [mm]
Mix 2
S2:2 7-150/700
S2:1 6-150/700Mo
men
t [k
Nm
]
(a) (b)
Figure 124. Comparison of moment vs. crack opening for the analytical model (Mix
2): (a) bi-linear -w relationship and (b) tri-linear -w relationship.
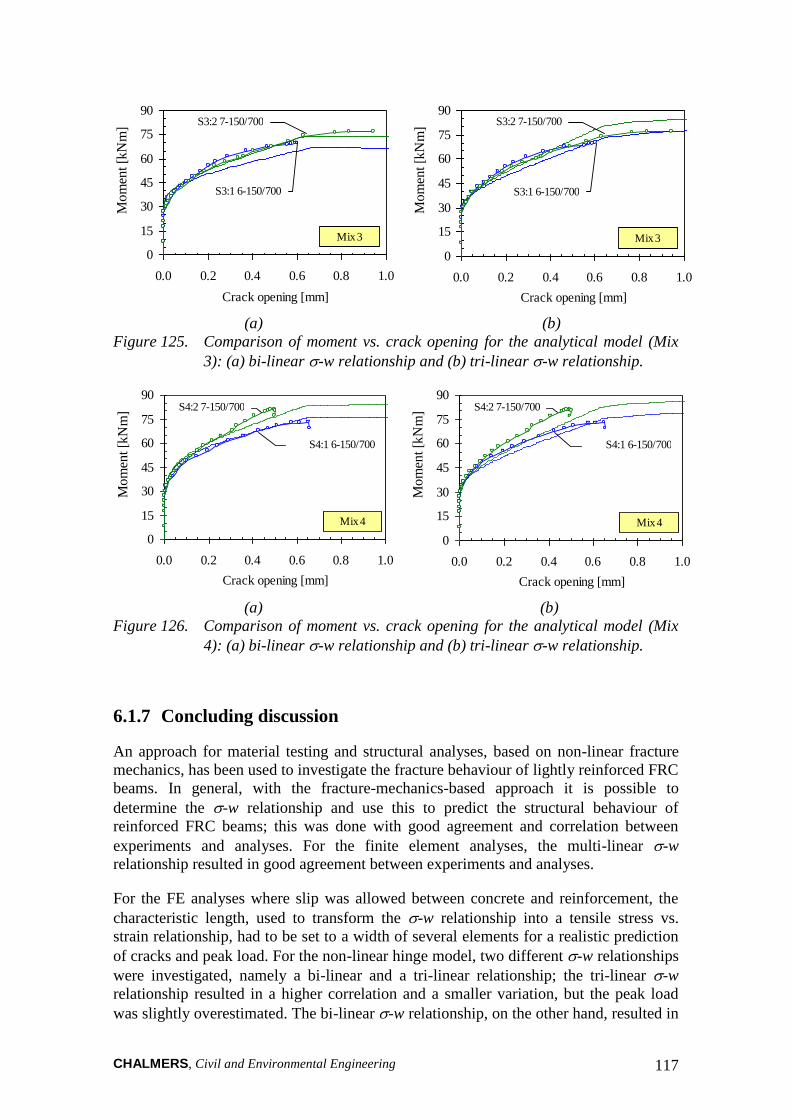
CHALMERS, Civil and Environmental Engineering 117
0
15
30
45
60
75
90
0.0 0.2 0.4 0.6 0.8 1.0
Crack opening [mm]
Mix 3
S3:2 7-150/700
S3:1 6-150/700
Mo
men
t [k
Nm
]
0
15
30
45
60
75
90
0.0 0.2 0.4 0.6 0.8 1.0
Crack opening [mm]
Mix 3
S3:2 7-150/700
S3:1 6-150/700
Mom
ent [k
Nm
]
(a) (b)
Figure 125. Comparison of moment vs. crack opening for the analytical model (Mix
3): (a) bi-linear -w relationship and (b) tri-linear -w relationship.
0
15
30
45
60
75
90
0.0 0.2 0.4 0.6 0.8 1.0
Crack opening [mm]
Mix 4
S4:1 6-150/700
S4:2 7-150/700
Mo
men
t [k
Nm
]
0
15
30
45
60
75
90
0.0 0.2 0.4 0.6 0.8 1.0
Crack opening [mm]
Mix 4
S4:1 6-150/700
S4:2 7-150/700M
om
ent [k
Nm
]
(a) (b)
Figure 126. Comparison of moment vs. crack opening for the analytical model (Mix
4): (a) bi-linear -w relationship and (b) tri-linear -w relationship.
6.1.7 Concluding discussion
An approach for material testing and structural analyses, based on non-linear fracture
mechanics, has been used to investigate the fracture behaviour of lightly reinforced FRC
beams. In general, with the fracture-mechanics-based approach it is possible to
determine the -w relationship and use this to predict the structural behaviour of
reinforced FRC beams; this was done with good agreement and correlation between
experiments and analyses. For the finite element analyses, the multi-linear -w
relationship resulted in good agreement between experiments and analyses.
For the FE analyses where slip was allowed between concrete and reinforcement, the
characteristic length, used to transform the -w relationship into a tensile stress vs.
strain relationship, had to be set to a width of several elements for a realistic prediction
of cracks and peak load. For the non-linear hinge model, two different -w relationships
were investigated, namely a bi-linear and a tri-linear relationship; the tri-linear -w
relationship resulted in a higher correlation and a smaller variation, but the peak load
was slightly overestimated. The bi-linear -w relationship, on the other hand, resulted in
CHALMERS, Civil and Environmental Engineering 118
a slightly lower correlation and a higher variation, but generally led to better agreement
for the predicted peak load. However, it was pointed out that the adjustment of the -w
relationship was done by assuming the nominal fibre volume fraction, not the measured
content in the cores that was taken out from the slabs, and that this would have slightly
increased the predicted peak load if it had been considered.
For the investigated reinforced FRC beams, the following conclusions can be made:
The self-compacting fibre-reinforced concrete generally performed well; no
major fibre segregation was observed. However, some fibre fracture occurred
for the standard fibres, indicating too high a bond strength.
A low reinforcement ratio can be used, as long as the fibres provide enough
resistance and distribute the cracks.
The type of fibre and dosage had a significant effect on the structural
behaviour, the peak load, and crack widths. Moreover, for the standard fibres
the bond was too good, resulting in fibre fracture.
High-strength reinforcement steel can be utilised without impairing the
ductility or crack widths.
The peak-load and post-peak behaviour was determined by a single crack.
The moment versus curvature relationship demonstrates a softening behaviour
and in many cases there is no distinct yield plateau, characteristic of
conventional reinforced concrete; a similar observation was made by Pfyl
(2003). However, to avoid this type of behaviour two possibilities exist: (1) the
-w relationship should exhibit a negligible stress decrease between two
critical crack openings (for the bi-linear relationship this translates to a low a2
value); and (2) a reinforcement with a different hardening behaviour, e.g. a
higher ratio between the yield strength and the tensile strength, could be used.
6.2 The lattice girder system - an application study
The lattice girder system was presented in Chapter 2, and can be seen in Figure 7. A
natural stage in development is to improve a characteristic performance. In this case it
would primarily involve stiffness and load resistance during the construction stage. It
may also include the weight of the element, to simplify transportation and handling of
the elements. From the contractor’s point of view, there is a desire to increase the
spacing of props. This would lead to less congestion and disturbance on site, and
minimise the need for temporary works and the associated costs. From the
manufacturers’ point of view, there is a desire to minimise transportation costs, by
reducing the weight and the thickness of the elements. Reduced weight could also be
beneficial for the contractor since this could enable the use of a smaller crane or a better
lifting range. However, at present, engineers have the following design parameters to
work with: the number of trusses, the truss height, the diameter of the top chord, the
slab thickness, and prestressing (not considered in this study). But how the concrete
contributes to the structural behaviour is less well known, and this may limit progress.
For example, can the concrete be allowed to crack and, if so, how does this affect the
structural behaviour? How should it be considered in the analysis and, in this context,
how should other types of concrete, such as fibre-reinforced concrete, be treated? In
sum, there is a desire to optimise and refine the system, e.g. reduce the weight and
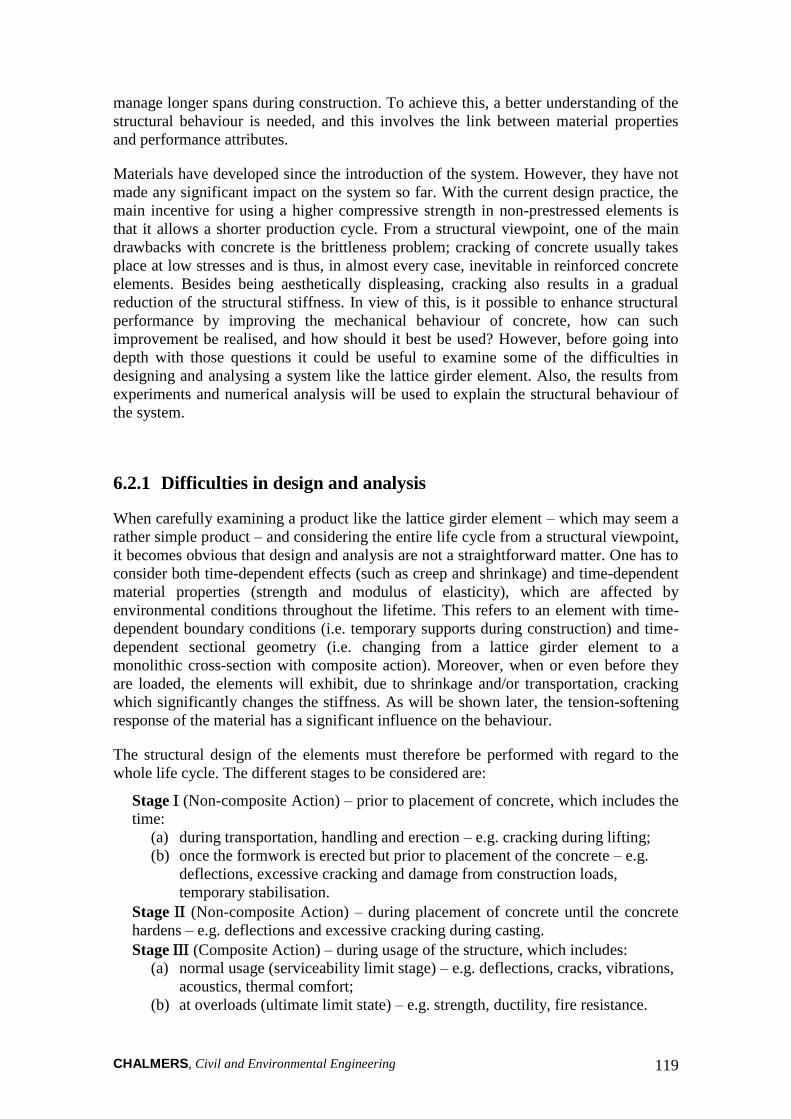
CHALMERS, Civil and Environmental Engineering 119
manage longer spans during construction. To achieve this, a better understanding of the
structural behaviour is needed, and this involves the link between material properties
and performance attributes.
Materials have developed since the introduction of the system. However, they have not
made any significant impact on the system so far. With the current design practice, the
main incentive for using a higher compressive strength in non-prestressed elements is
that it allows a shorter production cycle. From a structural viewpoint, one of the main
drawbacks with concrete is the brittleness problem; cracking of concrete usually takes
place at low stresses and is thus, in almost every case, inevitable in reinforced concrete
elements. Besides being aesthetically displeasing, cracking also results in a gradual
reduction of the structural stiffness. In view of this, is it possible to enhance structural
performance by improving the mechanical behaviour of concrete, how can such
improvement be realised, and how should it best be used? However, before going into
depth with those questions it could be useful to examine some of the difficulties in
designing and analysing a system like the lattice girder element. Also, the results from
experiments and numerical analysis will be used to explain the structural behaviour of
the system.
6.2.1 Difficulties in design and analysis
When carefully examining a product like the lattice girder element – which may seem a
rather simple product – and considering the entire life cycle from a structural viewpoint,
it becomes obvious that design and analysis are not a straightforward matter. One has to
consider both time-dependent effects (such as creep and shrinkage) and time-dependent
material properties (strength and modulus of elasticity), which are affected by
environmental conditions throughout the lifetime. This refers to an element with time-
dependent boundary conditions (i.e. temporary supports during construction) and time-
dependent sectional geometry (i.e. changing from a lattice girder element to a
monolithic cross-section with composite action). Moreover, when or even before they
are loaded, the elements will exhibit, due to shrinkage and/or transportation, cracking
which significantly changes the stiffness. As will be shown later, the tension-softening
response of the material has a significant influence on the behaviour.
The structural design of the elements must therefore be performed with regard to the
whole life cycle. The different stages to be considered are:
Stage (Non-composite Action) – prior to placement of concrete, which includes the
time:
(a) during transportation, handling and erection – e.g. cracking during lifting;
(b) once the formwork is erected but prior to placement of the concrete – e.g.
deflections, excessive cracking and damage from construction loads,
temporary stabilisation.
Stage (Non-composite Action) – during placement of concrete until the concrete
hardens – e.g. deflections and excessive cracking during casting.
Stage (Composite Action) – during usage of the structure, which includes:
(a) normal usage (serviceability limit stage) – e.g. deflections, cracks, vibrations,
acoustics, thermal comfort;
(b) at overloads (ultimate limit state) – e.g. strength, ductility, fire resistance.
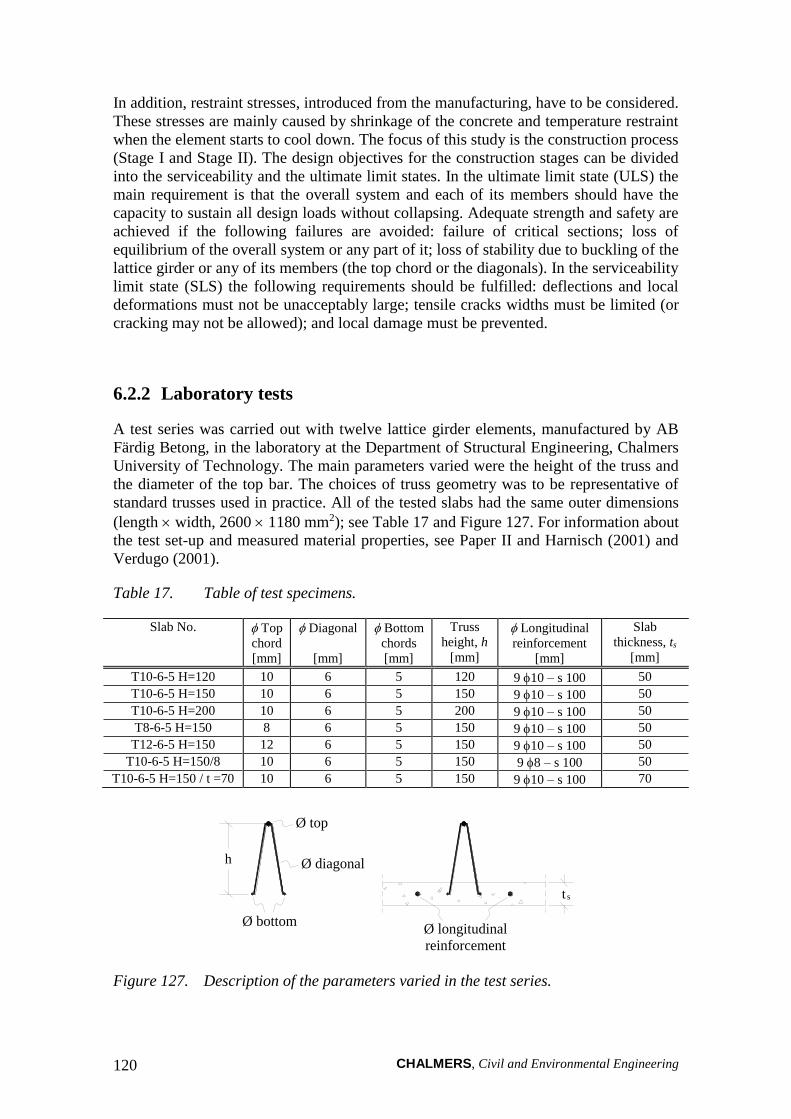
CHALMERS, Civil and Environmental Engineering 120
In addition, restraint stresses, introduced from the manufacturing, have to be considered.
These stresses are mainly caused by shrinkage of the concrete and temperature restraint
when the element starts to cool down. The focus of this study is the construction process
(Stage I and Stage II). The design objectives for the construction stages can be divided
into the serviceability and the ultimate limit states. In the ultimate limit state (ULS) the
main requirement is that the overall system and each of its members should have the
capacity to sustain all design loads without collapsing. Adequate strength and safety are
achieved if the following failures are avoided: failure of critical sections; loss of
equilibrium of the overall system or any part of it; loss of stability due to buckling of the
lattice girder or any of its members (the top chord or the diagonals). In the serviceability
limit state (SLS) the following requirements should be fulfilled: deflections and local
deformations must not be unacceptably large; tensile cracks widths must be limited (or
cracking may not be allowed); and local damage must be prevented.
6.2.2 Laboratory tests
A test series was carried out with twelve lattice girder elements, manufactured by AB
Färdig Betong, in the laboratory at the Department of Structural Engineering, Chalmers
University of Technology. The main parameters varied were the height of the truss and
the diameter of the top bar. The choices of truss geometry was to be representative of
standard trusses used in practice. All of the tested slabs had the same outer dimensions
(length width, 2600 1180 mm2); see Table 17 and Figure 127. For information about
the test set-up and measured material properties, see Paper II and Harnisch (2001) and
Verdugo (2001).
Table 17. Table of test specimens.
Slab No. Top
chord
[mm]
Diagonal
[mm]
Bottom
chords
[mm]
Truss
height, h
[mm]
Longitudinal
reinforcement
[mm]
Slab
thickness, ts
[mm]
T10-6-5 H=120 10 6 5 120 9 10 – s 100 50
T10-6-5 H=150 10 6 5 150 9 10 – s 100 50
T10-6-5 H=200 10 6 5 200 9 10 – s 100 50
T8-6-5 H=150 8 6 5 150 9 10 – s 100 50
T12-6-5 H=150 12 6 5 150 9 10 – s 100 50
T10-6-5 H=150/8 10 6 5 150 9 8 – s 100 50
T10-6-5 H=150 / t =70 10 6 5 150 9 10 – s 100 70
Ø bottom
Ø diagonal
Ø top
Ø longitudinal
reinforcement
t s
h
Figure 127. Description of the parameters varied in the test series.

CHALMERS, Civil and Environmental Engineering 121
6.2.3 Numerical analysis
Numerical analysis (e.g. finite element analysis) provides possibilities to analyse
complex problems. It may also supply additional information that is difficult to observe
in experiments, and it offers the possibility to change parameters that are difficult to
control in an experiment. A finite element model was set up in the program DIANA.
The elements and material models to be used in the analysis should be able to represent
the non-linear phenomena of buckling (geometric non-linearity), cracking (material
non-linearity), and slip of the reinforcement. Description of the finite element model
(element types, material models, etc.) can be found in Paper II. The model is shown in
Figure 128.
Symmetry lines
Line load, Q/4
Support
1180/2
200
700
400
Figure 128. Finite element model representing a lattice girder element (due to
symmetry, only a quarter of the slab needs to be modelled).
6.2.4 Structural behaviour
What can be concluded is that the structural behaviour – in the ultimate limit state – is
primarily dependent on geometrical parameters (i.e. the geometry of the truss and the
slenderness of the top chord as well as the thickness of the slab), as can be seen in
Figure 129 and Figure 130. In Figure Figure 129(a), the influence of truss height can be
seen. The truss height increases both the peak load and the stiffness. In Figure 129(b)
the influence of truss top chord diameter can be seen. The influence of the stiffness is
barely notable before crack initiation, but it becomes notable after cracking. The effect
on the peak load is notable; an increased bar diameter is less slender and thus is able to
resist a larger compression stress before buckling.

CHALMERS, Civil and Environmental Engineering 122
0
5
10
15
20
25
30
35
40
45
0 5 10 15 20 25
mid-span deflection [mm]
Q [kN]
T10-6-5 H=200
T10-6-5 H=150
T10-6-5 H=120
0
5
10
15
20
25
30
35
40
45
0 5 10 15 20 25
mid-span deflection [mm]
Q [kN]
T12-6-5 H=150
T10-6-5 H=150
T8-6-5 H=150
Figure 129. Load versus mid-span deflection. (a) Influence of the truss height.
(b) Influence of the top chord diameter.
In Figure 130(a) the influence of slab thickness can be seen. The slab thickness
increases both the peak load and the stiffness. The initial stiffness is increased, but as
soon as the crack load is reached the effect is reduced. The effect on the peak load is
mainly an effect of the increased compression zone. In Figure 130(b) the influence of
slab reinforcement is seen; the reinforcement has been reduced from 10-s100 to 8-
s100 (a reduction of 36%). The influence of the stiffness is not notable, either before or
after cracking. However, it was noted that it has some effect at large deflections.
0
5
10
15
20
25
30
35
40
45
0 5 10 15 20 25
Q [kN]
T10-6-5 H=150 / t=70
T10-6-5 H=150 / t=50
mid-span deflection [mm]
0
5
10
15
20
25
30
35
40
45
0 5 10 15 20 25
Q [kN]
T10-6-5 H=150 / 10
T10-6-5 H=150 / 8
mid-span deflection [mm]
Figure 130. Load versus mid-span deflection. (a) Influence of slab thickness.
(b) Influence of slab reinforcement.
An interesting observation is that relatively small reinforcement strains and small crack
widths are introduced. This is due to the geometrical configuration with the
reinforcement placed in the middle of the concrete slab. The crack widths are relatively
small, typically < 0.2 mm, and are not visible until about 60 percent of the peak load.
The measured strains are typically on the order of 500-1000×10-6 at peak load, and less
than 300×10-6 at 60 percent of the peak load. This explains why the amount of
embedded reinforcement in the slab does not seem to have any considerable effect on
the stiffness; see Figure 130(b). As a result of the relatively small reinforcement strains,
the ability of concrete to carry tensile stresses after cracking plays a significant role for
the tension-stiffening effect in the service stage. In conclusion, the tension softening and
tension stiffening may play a vital role in the serviceability limit state. For larger crack
widths, closer to peak load, the concrete’s ability to transfer tensile stresses could also

CHALMERS, Civil and Environmental Engineering 123
influence the load-carrying resistance. However, this requires another type of concrete –
for example a fibre-reinforced concrete, which also could influence the tension-
stiffening effect in the serviceability limit stage.
As mentioned, the lattice girder element presents several difficulties for the numerical
analysis. Since cracking plays such a significant role in the degradation of the stiffness,
this must be captured correctly throughout the entire loading process. Hence, a correct
crack pattern is needed (number of cracks and their spacing). Since no direct
measurement was made of the tensile strength of the concrete, a reasonable value had to
be assumed. Based on empirical correlations between tensile strength and the
compressive strength and splitting tensile strength, the concrete was assumed to have a
tensile strength, fct, of 2.6-3.0 MPa. However, it was realised that the crack-load also
was affected by shrinkage; hence an analysis was conducted to investigate the effect of
shrinkage and the magnitude of the shrinkage-induced stresses. The result of the
shrinkage analysis is shown in Figure 131. The shrinkage-induced stresses are on the
order of 0.4 MPa in the bottom of the slab and 1.0 MPa at the top of the slab. Hence, to
capture the cracking load, an effective tensile strength of 2.5 MPa was used in the
analysis instead of the earlier estimated value of 2.6-3.0 MPa.
Shrinkage Stresses in Concrete Slab - Longitudinal variation
0.0
0.20
0.40
0.60
0.80
1.00
1.20
0.0 0.2 0.4 0.6 0.8 1.0 1.2
Length coordinate, x [m]
Str
ess,
cs
[M
Pa]
Top Surface
Bottom Surface
sym
met
ry l
ine
Figure 131. Shrinkage-induced tensile stresses, from numerical analysis.
In the analysis, the peak load was represented accurately. However, the numerical
model showed too stiff behaviour, mainly due to insufficient crack localisation. The
buckling phenomenon was predicted in a satisfactory manner. The analysis became
numerically unstable at crack initiation, and convergence problems occurred in some
load steps. In Figure 132, a comparison is made between the numerical and
experimental load–deflection curves for slab T10-6-5 H=150. In the numerical analysis,
two different load step sizes were chosen; for FEM-1 an automatic adaptation was used,
and in FEM-2 explicitly specified step sizes were used. As can be seen, the different
step sizes give slightly deviating results; the adaptive load steps give a stiffer response
but, on the other hand, give a shorter computational time. The conclusion is that the
model is seemingly able to simulate the structural behaviour, even though the response
is a little too stiff, and can thus be used to investigate and simulate different material
behaviour.
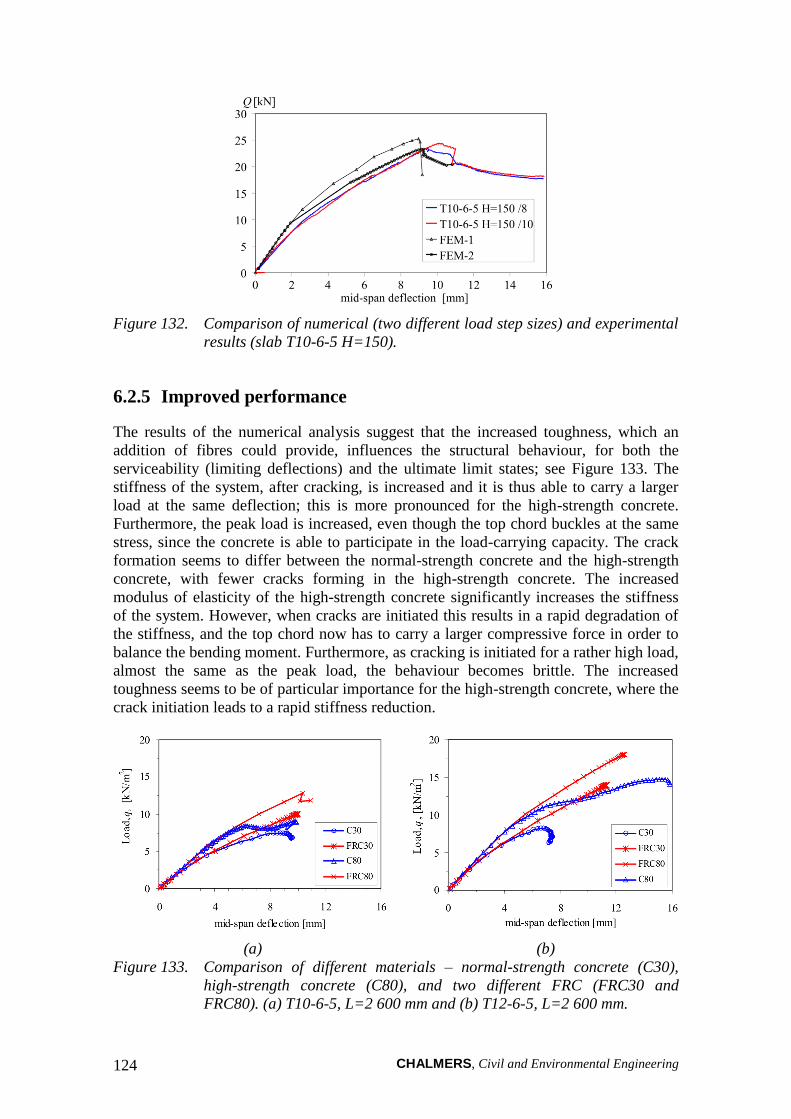
CHALMERS, Civil and Environmental Engineering 124
Figure 132. Comparison of numerical (two different load step sizes) and experimental
results (slab T10-6-5 H=150).
6.2.5 Improved performance
The results of the numerical analysis suggest that the increased toughness, which an
addition of fibres could provide, influences the structural behaviour, for both the
serviceability (limiting deflections) and the ultimate limit states; see Figure 133. The
stiffness of the system, after cracking, is increased and it is thus able to carry a larger
load at the same deflection; this is more pronounced for the high-strength concrete.
Furthermore, the peak load is increased, even though the top chord buckles at the same
stress, since the concrete is able to participate in the load-carrying capacity. The crack
formation seems to differ between the normal-strength concrete and the high-strength
concrete, with fewer cracks forming in the high-strength concrete. The increased
modulus of elasticity of the high-strength concrete significantly increases the stiffness
of the system. However, when cracks are initiated this results in a rapid degradation of
the stiffness, and the top chord now has to carry a larger compressive force in order to
balance the bending moment. Furthermore, as cracking is initiated for a rather high load,
almost the same as the peak load, the behaviour becomes brittle. The increased
toughness seems to be of particular importance for the high-strength concrete, where the
crack initiation leads to a rapid stiffness reduction.
(a) (b)
Figure 133. Comparison of different materials – normal-strength concrete (C30),
high-strength concrete (C80), and two different FRC (FRC30 and
FRC80). (a) T10-6-5, L=2 600 mm and (b) T12-6-5, L=2 600 mm.
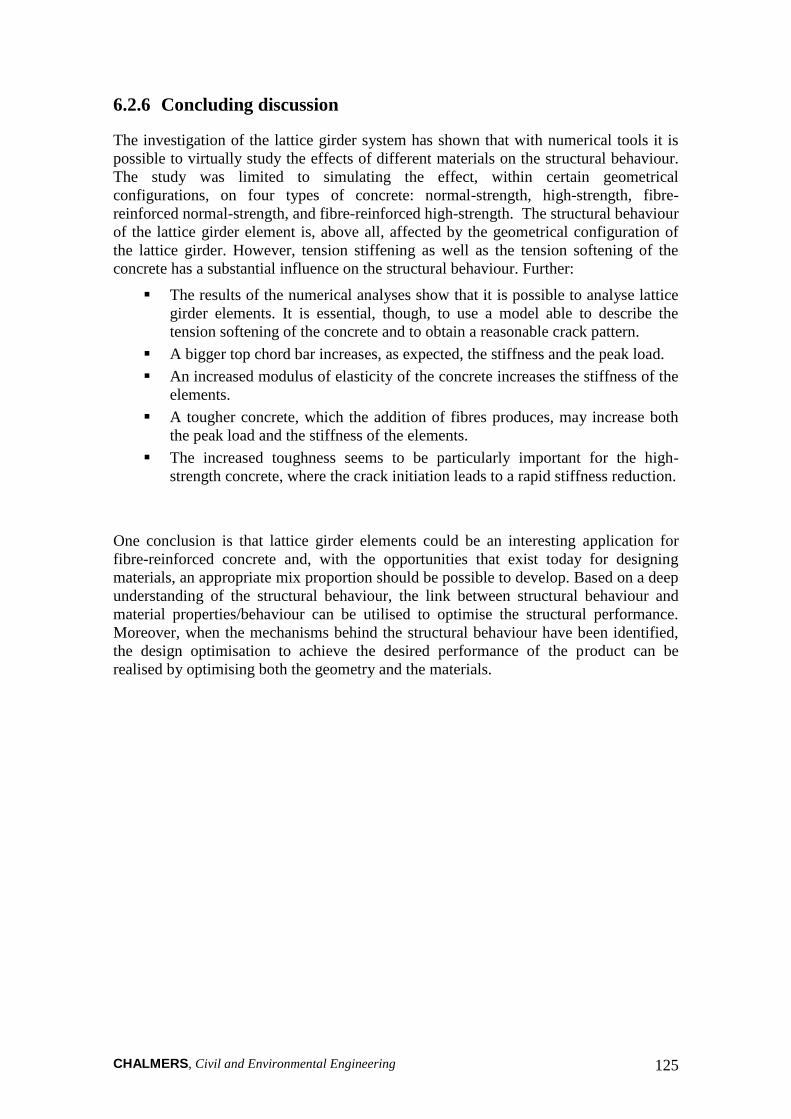
CHALMERS, Civil and Environmental Engineering 125
6.2.6 Concluding discussion
The investigation of the lattice girder system has shown that with numerical tools it is
possible to virtually study the effects of different materials on the structural behaviour.
The study was limited to simulating the effect, within certain geometrical
configurations, on four types of concrete: normal-strength, high-strength, fibre-
reinforced normal-strength, and fibre-reinforced high-strength. The structural behaviour
of the lattice girder element is, above all, affected by the geometrical configuration of
the lattice girder. However, tension stiffening as well as the tension softening of the
concrete has a substantial influence on the structural behaviour. Further:
The results of the numerical analyses show that it is possible to analyse lattice
girder elements. It is essential, though, to use a model able to describe the
tension softening of the concrete and to obtain a reasonable crack pattern.
A bigger top chord bar increases, as expected, the stiffness and the peak load.
An increased modulus of elasticity of the concrete increases the stiffness of the
elements.
A tougher concrete, which the addition of fibres produces, may increase both
the peak load and the stiffness of the elements.
The increased toughness seems to be particularly important for the high-
strength concrete, where the crack initiation leads to a rapid stiffness reduction.
One conclusion is that lattice girder elements could be an interesting application for
fibre-reinforced concrete and, with the opportunities that exist today for designing
materials, an appropriate mix proportion should be possible to develop. Based on a deep
understanding of the structural behaviour, the link between structural behaviour and
material properties/behaviour can be utilised to optimise the structural performance.
Moreover, when the mechanisms behind the structural behaviour have been identified,
the design optimisation to achieve the desired performance of the product can be
realised by optimising both the geometry and the materials.

CHALMERS, Civil and Environmental Engineering 126
CHALMERS, Civil and Environmental Engineering 127
7 CONCLUSIONS
7.1 General conclusions
Fibre reinforcement extends the versatility of concrete as a construction material by
overcoming the otherwise intrinsic brittleness and by improving the structural behaviour
(crack propagation, flexural stiffness, etc.), but also by the potential it has to simplify
the construction process. When FRC is combined with self-compacting concrete, a
significant step towards industrial construction has been taken. However, a barrier to
this development has been a lack of general design guidelines for FRC, which take into
account the material properties characteristic of FRC materials, i.e. the -w relationship.
In this thesis, different test methods have been investigated and, through inverse
analyses, -w relationships have been determined for a number of fibre-reinforced
concretes. Moreover, a systematic approach has been suggested for the material testing,
aiming at determining the -w relationship. With this approach it is possible to adjust
for differences in fibre efficiency between the material test specimen and the structural
element considered, or the case of random 3-D orientation. The approach has been
demonstrated by investigating a number of different mixes and determining the
correlation between fibre efficiency (number of fibres) and -w relationship. The
approach has also been demonstrated in an application study of structural members
where full-scale experiments were conducted. In addition, an existing model for
analysing the flexural behaviour of reinforced FRC members, based on the non-linear
hinge, has been further developed and results using the approach have been compared
with detailed finite element analyses and full-scale experiments. Based on these studies,
a fracture-mechanics-based approach to material testing and structural analysis has been
presented. To briefly summarise and explain the approach, it consists of the following
steps:
Material testing, i.e. standard compressive strength test together with wedge-
splitting tests (WST) to determine the tensile post-cracking behaviour of the
steel fibre-reinforced.
Inverse analysis for interpreting the test results from the WST (i.e. splitting
load vs. CMOD curves) as a -w relationship (outlined in Section 4.2.2).
Adjustment of the -w relationship by considering the differences in fibre
efficiency factor between the WST specimens and the beams (outlined in
Section 4.2.3).
Cross-sectional analyses of the beams, using the non-linear hinge model, to
obtain relationships between moment and curvature and between moment and
crack opening (outlined in Section 5.3).
Structural analyses to predict the structural behaviour, which can be based on
the finite element method or on using the results from the cross-sectional
analyses where the displacement can be obtained by integrating the curvature.
The general conclusions that can be drawn, based on the presented work, are that fibre
reinforcement improves the fracture behaviour of concrete, exemplified in Section 5.3.5
and by the investigated structural applications. It was also demonstrated that the wedge-
splitting test method can be used as a fracture test for steel fibre-reinforced concrete,

CHALMERS, Civil and Environmental Engineering 128
which is useful since the specimens are much smaller than traditional beam specimens
(e.g. 3PBT according to RILEM TC 162-TDF) and is thus better suited for laboratory
investigations and for development and optimisation of mixes. It was shown that
through inverse analysis it is possible to determine realistic -w relationships as long as
the initial part of the -w relationship and the tensile strength is estimated realistically.
To determine a -w relationship which is realistic for a structural member, it is possible,
and also recommended, to adjust for any difference in fibre efficiency between the
material test specimen and a structural element; for this purpose it is necessary to count
the number of fibres in the fracture specimens. With the conducted full-scale
experiments it was demonstrated that the -w relationship, obtained from material
testing and inverse analysis, could be used to predict the flexural behaviour of
reinforced FRC members, using the analytical model as well as finite element analyses.
For the finite element method, the structural behaviour could be predicted with good
agreement by using the multi-linear -w relationship. For the non-linear hinge model,
the bi-linear -w relationship resulted in better agreement than a tri-linear -w
relationship.
The investigation of the fracture behaviour reinforced FRC beams showed that the type
of fibre and dosage had a significant effect on the structural behaviour, the peak load,
and crack widths. Moreover, for the standard fibres the bond was to good and resulted
in fibre fracture. The combination of welded mesh and steel fibres as reinforcement
seems to be promising as it allows use of reinforcement with smaller diameters ( 8
mm) than those normally used, which is beneficial since welded mesh is available in
standardised units for these dimensions. In addition, a low reinforcement ratio can be
used, as long as the fibres provide enough resistance and distribute the cracks, and high-
strength reinforcement steel can be utilised without impairing the ductility or crack
widths. In the experiments, it was observed that the peak-load and post-peak behaviour
was determined by a single crack, the moment versus curvature relationship
demonstrated a softening behaviour, and there was no distinct yield plateau which is
characteristic of conventional reinforced concrete.
The investigation of the lattice girder system showed that with numerical tools it is
possible to virtually study the effects of different materials on the structural behaviour.
The structural behaviour of the lattice girder element is, above all, affected by the
geometrical configuration of the lattice girder. However, tension stiffening as well as
the tension softening of the concrete has a substantial influence on the structural
behaviour. Further, it was concluded that the lattice girder elements could be one
interesting application for fibre-reinforced concrete and, with the opportunities that exist
today for designing materials, an appropriate mix proportion should be possible to
develop. Based on a deep understanding of the structural behaviour, the link between
structural behaviour and material properties/behaviour can be utilised to optimise the
structural performance. Moreover, when the mechanisms behind the structural
behaviour have been identified, the design optimisation to achieve the desired
performance of the product can be realised by optimising both the geometry and the
materials.

CHALMERS, Civil and Environmental Engineering 129
7.2 Suggestions for future research
Although the research literature on fibre-reinforced concrete is extensive there is still
need for further studies. A significant step forward would be the development of general
design guidelines based on the fracture-mechanics-based approach and development of
design software and tools that practising engineers can use. Further developments of
inverse analysis approaches are needed and, preferably, there should be a development
towards standardisation of these methods so that they can be used in conjunction with
standard test methods as a natural step to determine material properties – as for example
proposed by JCI (Japan Concrete Institute); see Kitsutaka et al. (2001). The validity of
the suggested approach for adjusting the -w relationship should be investigated further.
The presented fracture-mechanics-based approach to material testing and structural
analysis needs additional study, e.g. by investigating beams of different dimensions,
different amounts of conventional reinforcement and fibre volume fractions, as well as
combinations of bending moment and normal forces. Time-dependent effects such as
shrinkage, creep, relaxation, etc., which may influence the crack propagation and the
structural behaviour, should be addressed so that they can be incorporated into the non-
linear hinge model. Situations involving multi-axial stress states and mixed-mode crack
propagation (shear, torsion, etc.) are also an area requiring attention.
While extensive research has been carried out in the field of fibre-reinforced concrete,
few studies have been conducted where the material behaviour and the structural
performance have been systematically linked, e.g. through accurate determination of the
-w relationship and fracture-mechanics-based analyses. In addition, little effort has
been given to optimisation of the fibre-reinforced concrete so that it suits the application
which was investigated; this should be systematically examined for potential structural
applications, using a performance-based approach where the failure mode (e.g. stiffness,
crack widths, bending failure, shear failure, etc.) governing the performance should be
specified for each type of application, together with how the material properties
influence the performance and the possibilities and opportunities that exist.
Furthermore, investigations of different types of reinforcement materials, with a more
optimal performance for FRC, could lead to more effective and economical structures.
For analysing the structural behaviour of reinforced FRC members using the finite
element method, other approaches such as X-FEM (extended finite element method)
should be investigated. One of the appealing aspects of X-FEM is that the fictitious
crack model (see Hillerborg et al. 1986) can be directly implemented and the -w
relationship can be used to describe the fracture process without having to transform
this into a stress vs. strain relationship or having to introduce predefined crack paths,
which is necessary with the discrete crack approach; see Svahn (2005).

CHALMERS, Civil and Environmental Engineering 130

CHALMERS, Civil and Environmental Engineering 131
8 References Aarre, T. (1992): Tensile characteristics of FRC with special emphasis on its applicability in a continuous
pavement, Ph.D. thesis, Department of Structural Engineering, Technical University of Denmark,
Serie R, No. 301, 1992, 167 pp.
Abdalla, H.M. and Karihaloo, B.L. (2003): Determination of size-independent specific fracture energy of
concrete from three-point bend and wedge splitting tests, Magazine of Concrete Research, Vol. 55,
No. 2, April 2003, pp. 133-141.
ACI Committee 544 (1988): Measurement of properties of fiber reinforced concrete. ACI Materials
Journal 85 (1988), pp. 583-593.
ACI 544 (1994): Design Considerations for Steel Fiber Reinforced Concrete, ACI Committee 544 Report
544.4R-88, American Concrete Institute, Detroit.
ACI 544 (1996): State-of-the-Art Report on Fibre Reinforced Concrete, ACI Committee 544, Report
544.1R-96, American Concrete Institute, Detroit.
Ahmad, S., di Prisco, M., Meyer, C., Plizzari, G.A., and Shah, S. (Eds.) (2004): Fibre Reinforced
Concrete from Theory to Practice, International Workshop on Advances in Fiber Reinforced
Concrete, Bergamo, Italy, Sept. 24-25, 2004.
Aïtcin, P-C. (2000): Cements of yesterday and today – Concrete of tomorrow. Cement and Concrete
Research, Vol. 30 (2000), pp. 1349-1359.
Allos, A.E. (1989): Shear transfer in fibre reinforced concrete. In Fibre Reinforced Cements and
Concretes – Recent Developments, eds. R.N. Swamy and B. Barr, Elsevier Science Publishers, pp.
146-156.
Alwan, J.M., Naaman, A.E, and Guerrero, P. (1999): Effect of mechanical clamping on the pull-out
response of hooked steel fibers embedded in cementitious matrices, Concrete Science and
Engineering, Vol. 1, March 1999, pp. 15-25.
Alwan, J.M., Naaman, A.E, and Hansen, W. (1991): Pull-Out Work of Steel Fibres From Cementitious
Composites: Analytical Investigation. Cement & Concrete Composites, Vol. 13 (1991), pp. 247-
255.
ASTM 1550-02 (2003): Standard Test Method for Flexural Toughness of Fiber Reinforced Concrete
(Using Centrally Loaded Round Panel). American Society for Testing and Materials Standard,
West Conshohoken.
ASTM C 1018: Standard Test Method for Flexural Toughness and First-Crack Strength of Fiber-
Reinforced Concrete (Using Beam With Third-Point Loading). ASTM, West Conshohocken, Pa.,
1997.
Aveston, J., and Kelly, A. (1973): Theory of Multiple Fracture of Fibrous Composites, Journal of
Materials Science, Vol. 8, pp. 352-362.
Ay, L. (2004): Steel Fibrous Cement Based Composites. Ph.D. thesis, Dept. of Civil and Architectural
Engineering, Royal Institute of Technology, 2004, Stockholm, 234 pp.
Bache, H.H. (1989): Fracture mechanics in integrated design of new, ultra-strong materials and structures.
In Fracture Mechanics of Concrete Structures – From theory to applications, ed. L. Elfgren,
Chapman and Hall, London 1989, pp. 382-398.
Balaguru, P.N. and Shah, S.P. (1992): Fiber Reinforced Cement Composites. McGraw Hill, New York,
530 pp.
Banthia, N. (1998): Fibre reinforced concrete: Present and the future. In Fibre reinforced concrete –
Present and future, eds. Banthia, N., Bentur, A., and Mufti, A. The Canadian Society for Civil
Engineering, Montreal, 1998, pp. 1-20.
Banthia, N. and Mindess, S. (eds.) (1995): Fiber Reinforced Concrete – Modern Developments. The
Second University-Industry Workshop on Fibre Reinforced Concrete and Other Composites held
in Toronto, Canada, March 26-29, 1995.
CHALMERS, Civil and Environmental Engineering 132
Banthia, N., and Trottier, J.-F. (1995): Test methods for flexural toughness characterization of fiber
reinforced concrete: Some concerns and a proposition, ACI Materials Journal, Vol. 92, No. 1, pp.
48-57.
Banthia, N., Bentur, A., and Mufti, A. (eds.) (1998): Fibre reinforced concrete – Present and future. The
Canadian Society for Civil Engineering, Montreal, 1998.
Barr B., Gettu R., Al-Oraimi S.K.A., and Bryars L.S. (1996): Toughness measurement – the need to think
again. Cem. & Concrete Composites 18 (1996), pp. 281-297.
Barragán, B.E. (2002): Failure and toughness of steel fiber reinforced concrete under tension and shear,
Ph.D. Thesis, Universitat Politécnica de Catalunya, Barcelona, Spain.
Barragán, B.E, Gettu, R., Martín, M.A., and Zerbino, R.L. (2003): Uniaxial tension test for steel fibre
reinforced concrete––a parametric study, Cement & Concrete Composites 25 (2003), pp. 767-777.
Barros, J.A.O. and Figueiras, J.A. (1999): Flexural Behavior of SFRC: Testing and Modeling. Journal of
Materials in Civil Engineering, Vol. 11, No. 4, Nov. 1999, pp. 331-339.
Barros, J. and Antunes, J. (2003): Experimental characterization of the flexural behaviour of steel fibre
reinforced concrete according to RILEM TC 162-TDF Recommendations. In Test and Design
Methods for Steel Fibre Reinforced Concrete – Background and Experiences, Proceedings of the
RILEM TC 162-TDF Workshop, eds. Schnütgen and Vandevalle. pp. 77-89.
Barros, J., Pereira, E., Ribeiro, A., Chuna, V., and Antunes, J. (2004): Self-compacting steel fibre
reinforced concrete for precasted sandwich panels – experiments and numerical research. In Fibre
Reinforced Concrete from Theory to Practice, eds. S. Ahmad, M. di Prisco, C. Meyer, G.A.
Plizzari, S. Shah, International Workshop on Advances in Fiber Reinforced Concrete, Bergamo,
Italy, Sept. 24-25, 2004, pp. 135-148.
Barros, J.A.O., Chuna, V.M.C.F., Riberio, A.F., and Antunes, J.A.B. (2005): Post-cracking behaviour of
steel fibre reinforced concrete. Materials and Structures, Vol. 38 No. 275, January-February 2005,
pp. 47-56.
Bartos, P. (1981): Review paper: Bond in fibre reinforced cements and concretes. International Journal of
Cement Composites, Vol. 3, No. 3 (1981), pp. 159-177.
Bartos, P.J.M. and Duris, M. (1994): Inclined tensile strength of steel fibres in a cement-based composite.
Composites, Vol. 25, No. 10 (1994), pp. 945-952.
Bažant, Z. P. & Oh, B. H. (1983): Crack band theory for fracture of concrete, Materials and Structures,
Vol. 16, pp. 155-177.
Beddar, M. (2004): Fibre-reinforced concrete – Past, present and future, Concrete, April 2004 (38) 4,
ABI/INFORM Trade & Industry, pp. 47-49.
Belletti, B., Cerioni, R., Meda, A., and Plizzari, G.A. (2004): Experimental and numerical analyses of
FRC slabs on grade. In Fracture Mechanics of Concrete Structures, Vol 2, Li et al. (eds.),
Proceedings of FRAMCOS-5, Vail, Colorado, U S A, April 2004, pp. 973-980.
Bennett, D. (2002): Innovation in concrete. Thomas Telford Publishing, London, 2002.
Bentur A. and Mindess S. (1990). Fibre Reinforced Cementitious Composites. Elsevier Science Publ. Ltd.
England, UK., 1990.
Bentur, A. (1991): Microstructure, interfacial effects and micromechanics of cementitious composites, in
Advances in Cementitious Materials (ed. S. Mindess), The American Ceramic Society, USA, pp.
523-547.
Bentur, A. (2002): Cementitious Materials – Nine Millennia and A New Century: Past, Present, and
Future. Journal of Materials in Civil Engineering, Vol. 14, No. 1, February 1, 2002, pp. 2-22.
Bentur, A., Mindess, S., and Diamond, S. (1985): Pull out processes in steel fiber reinforced cement.
International Journal of Cement Composites & Lightweight Concrete, Vol. 7, No. 1, pp. 29-38.
Bentur, A., Wu, S.T, Banthia, N., Baggott, R., Hansen, W., Katz, A., Leung, C.K.Y., Li, V.C., Mobasher,
B., Naaman, A.E., Robertson, R., Soroushian, P., Stang, H., and Taerwe, L.R. (1995): Fibre-matrix
interfaces. In High Performance Fibre Reinforced Cementitious Composites, eds. Naaman and
Reinhardt. Chapman and Hall, London, 1995, pp. 149-191.

CHALMERS, Civil and Environmental Engineering 133
Betongbanken (2000): Construction data compiled by the Swedish Ready-Mix Association – received on
02-05-00 from Frank Johansson.
Betterman, L.R., Ouyang, C., Shah, S.P. (1995): Fiber-matrix interaction in microfiber-reinforced mortar,
Advanced Cement Based Materials, 2, 1995, pp. 53-61
Bolzon G., Fedele R., and Maier G. (2002): Parameter identification of a cohesive crack model by
Kalman filter. Comput. Methods Appl. Mech. Eng. 191 (2002), pp. 2847-2871.
Brandt, A.M. (1985): On the optimal direction of short metal fibres in brittle matrix composites. Journal
of Material Science, Vol. 20, pp. 3831-3841.
Brandt, A.M. (1995): Cement-Based Composites – Materials, Mechanical Properties and Performance,
Spon, London, 1995.
Brandt, A.M. and Kucharska (1999): Developments in Cement-Based Composites. In Extending the
Performance of Concrete Structures, eds. R.K. Dhir and P.A.J. Tittle, Proceedings of the
international seminar held at the University of Dundee, Scotland, UK, on Sept. 7 1999, Thomas
Telford Publishing, pp. 17-32.
BRE (2000): Concreting for improved speed and efficiency, Best Practice Guides for In-situ Concrete
Frame Buildings, Building Research Establishment, (downloadable at www.rcc-info.org.uk).
BRE (2000): Improved rebar information and supply, Best Practice Guides for In-situ Concrete Frame
Buildings, Building Research Establishment, (downloadable at www.rcc-info.org.uk).
BRE (2000): Improving concrete frame construction, Best Practice Guides for In-situ Concrete Frame
Buildings, Building Research Establishment, (downloadable at www.rcc-info.org.uk).
BRE (2000): Rationalisation of flat slab reinforcement, Best Practice Guides for In-situ Concrete Frame
Buildings, Building Research Establishment, (downloadable at www.rcc-info.org.uk).
BRE (2001): Early age strength assessment of concrete on site, Best Practice Guides for In-situ Concrete
Frame Buildings, Building Research Establishment, (downloadable at www.rcc-info.org.uk).
BRE (2001): Early striking and improved backpropping, Best Practice Guides for In-situ Concrete Frame
Buildings, Building Research Establishment, (downloadable at www.rcc-info.org.uk).
BRE (2001): Flat slabs for efficient concrete construction, Best Practice Guides for In-sity Concrete
Frame Buildings, Building Research Establishment, (downloadable at www.rcc-info.org.uk).
BRE (2001): Prefabricated punching shear reinforcement for reinforced concrete flat slabs, Best Practice
Guides for In-situ Concrete Frame Buildings, Building Research Establishment, (downloadable at
www.rcc-info.org.uk).
Brühwiler, E. and Wittmann, F.H. (1990): The wedge splitting test, a new method of performing stable
fracture mechanics test. Eng. Fracture Mech. 35(1/2/3), pp. 117-125.
Burwick, M. (1998): Betongbyggande med kvarsittande gjutformar – en jämförande studie.
Examensarbete 334, Avd. för byggandets organisation och ekonomi, KTH. Stockholm, 1998. (In
Swedish.)
Buyukozturk, O. and Hearing, B. (1998): Crack propagation in concrete composites influenced by
interface fracture parameters, Int. Journal of Solids and Structures, Vol. 35, Nos. 31-32, Elsevier,
pp. 4055-4066.
Camellerie, J.F. (1985): Construction Methods and Equipment. Handbook of concrete engineering. Edited
by Fintel. Van Nostrand Reinhold, New York, 1985, pp. 793-819.
Cassanova, P. and Rossi, P. (1997): Analysis and design of steel fiber reinforced concrete beams. ACI
Structural J. 94(5) (1997), pp. 595-602.
CEB (1993): CEB-FIP Model Code 1990. Bulletin d'Information 213/214, Lausanne, Switzerland, 1993,
437 pp.
CEB Bulletin 242 (1998): Ductillity of Reinforced Concrete Structures, Lausanne, Switzerland, 332 pp.
CEB Bulletin d’Information 222: Application of High Performance Concrete, Lausanne, 1994.
CEMBUREAU (2000): Annual Report 2000, Published by CEMBUREAU The European Cement
Association, Brussels.
CHALMERS, Civil and Environmental Engineering 134
Chan, Y.W. and Li, V.C. (1997): Effects of Transition Zone Densification On Fiber/Cement Paste Bond
Strength Improvement, Advanced Cement Based Materials, 1997 (5), pp. 8-17.
Chanvillard, G. (1999): Modeling the pull-out of wire-drawn steel fibers. Cement and Concrete Research
29(1999), pp. 1027–1037.
Chanvillard, G. (2000): Characterisation of fibre reinforced concrete mechanical properties: A review. In
Fibre-Reinforced Concretes (FRC), Proceedings of the Fifth International RILEM symposium,
BEFIB 2000. Eds. P. Rossi and G. Chanvillard, PRO 15, RILEM Publications S.A.R.L, Bagneaux,
pp. 29-50.
Chanvillard, G. and Aïtcin, P.C. (1996): Pull-Out Behavior of Corrugated Steel Fibers – Qualitative and
Statistical Analysis. Advanced Cement Based Materials, 1996 (4), pp. 28-41.
Chawla, K.K. (2001): Fibrous Reinforcements for Composites: Overview, in Encyclopedia of Materials:
Science and Technology, Elsevier Science Ltd., pp. 3160-3167.
Chong, K.P. and Garboczi, E.J. (2002): Smart and designer structural material systems, Prog. Struct.
Engng Mater. 2002, No. 4, pp. 417-430.
Cnudde, M. (1991): Lack of quality in construction – economic losses. European Symposium on
Management, Quality and Economics in Housing and Other Building Sectors, Lisbon, September
30 – October 4, 1991. Proceedings, pp. 508-515.
Constantinesco, G. (1943): Reinforced concrete, British Patent No. 2,677,955, Feb. 10, 1948.
Cook, J. & Gordon, J. E. (1964): A mechanism for the control of crack propagation in all brittle systems,
Proc. Roy. Soc. 282A, pp. 508–520.
Cornelissen, H. A. W., Hordijk, D. A., and Reinhardt, H. W. (1986): Experimental determination of crack
softening characteristics of normalweight and lightweight concrete. Heron 31, 2 (1986).
Cotterell, B. and Mai, Y.W. (1996): Fracture Mechanics of Cementitious Materials. Blackie Academic &
Professional, Chapman & Hall, 294 pp.
Cox, H.L. (1952): The elasticity and strength of paper and other fibrous materials. British Journal of
Applied Physics, Vol. 3, March 1952, pp. 72-79.
Curbach et al. (1998): New building material – Textile Concrete. Betonwerk + Fertigteil-Technik, BFT
6/1998, pp 45-56.
DAfStbUA SFB N 0146 (2005): DAfStb-Richtlinie Stahlfaserbeton (21. Entwurf), Ergänzung zu DIN
1045, Teile 1 bis 4 (07/2001), Deutscher Ausschuss für Stahlbeton – DAfStb, Berlin. (In german)
Darwin, D., Barham, S., Kozul, R., and Luan, S. (2001): Fracture energy of high-strength concrete, ACI
Materials Journal, Vol. 98, No. 5, Sept-Oct 2001, pp. 410-417.
de Larrard, F. (1999): Concrete Mixture Proportioning – a Scientific Approach, E & FN Spon, London,
1999, 421 pp.
de Place Hansen, E.J., Hansen, E.A., Hassanzadeh, M., and Stang, H. (1998): Determination of the
Fracture Energy of Concrete: A comparison of the Three-Point Bend Test on Notched Beam and
the Wedge-Splitting Test. NORDTEST Project No 1327-97. SP Swedish National Testing and
Research Institute, Building Technology, SP Report 1998:09, Borås, Sweden, p. 87.
di Prisco, M., Felicetti, R., Lamperti, M.G.L, and Menotti, G. (2004a): On size effect in tension of SFRC
thin plates. In Fracture Mechanics of Concrete Structures, Vol. 2, Li et al. (eds.), Proceedings of
FRAMCOS-5, Vail, Colorado, USA, April 2004, pp. 1075-1082.
di Prisco, M., Toniolo, G., Plizzari, G.A., Cangiano, S., Failla, C. (2004b): Italian guidelines on SFRC. In
Fibre Reinforced Concrete from Theory to Practice, International Workshop on Advances in Fiber
Reinforced Concrete, Bergamo, Italy, Sept. 24-25, 2004, pp. 39-72.
di Prisco, M., Felicetti, R., and Plizzari, G.A. (eds.) (2004c): Fibre-Reinforced Concretes – BEFIB 2004 –
Proceedings of the Sixth RILEM symposium. Varenna, Italy, 20th-22nd September 2004. PRO 39,
RILEM Publications S.A.R.L, Bagneaux.
Dubey, A. (1999): Fiber Reinforced Concrete: Characterization of flexural toughness & some studies on
fibre-matrix bond-slip interaction. Ph.D. thesis, University of British Columbia, Department of
Civil Engineering, 1999.
CHALMERS, Civil and Environmental Engineering 135
Dupont D. (2003): Modelling and experimental validation of the constitutive law (-) and cracking
behaviour of fibre reinforced concrete. Ph.D. thesis, Katholieke Universiteit Leuven, 2003.
Dupont, D., and Vandewalle, L. (2005): Distribution of steel fibres in rectangular sections. Cement and
Concrete Composites, 27, 2005, pp. 391-398.
Døssland, Å. (2003): Beams of ordinary and self-compacting concrete reinforced with steel fibres and
ordinary reinforcement tested in moment and shear. In Design Rules for Steel Fibre Reinforced
Concrete Structures (ed. T. Kanstad), Proc. Nordic miniseminar, Oslo, October 2003. The
Norwegian Concrete Association, Oslo, pp. 99-106.
EFNARC (1996): European Specification for Sprayed Concrete, European Federation of Producers and
Applicators of Specialist Products for Structures – see www.efnarc.org.
Elser M., Tschegg E.K., Finger N., and Stanzl-Tschegg S.E. (1996): Fracture Behaviour of
Polypropylene-Fibre Reinforced Concrete: an experimental investigation. Comp. Science and
Technology 56 (1996), pp. 933-945.
EN 206-1 (2000): Concrete Part 1: Specification, performance, production and conformity, Ref. No. EN
206-1: 2000 E, CEN European Committee for Standardization, Brussels.
Erdem, E. (2003): The flexural behaviour of SFRC beams and slabs: bending with - method. In Test
and Design Methods for Steel Fibre Reinforced Concrete – Background and Experiences,
Proceedings of the RILEM TC 162-TDF Workshop, eds. Schnütgen and Vandevalle, pp. 67-76.
Esping, O. and Löfgren, I. (2005): Cracking due to plastic and autogenous shrinkage – Investigation of
early age deformation of self-compacting concrete – Experimental study. P-2005:11. Publication
05:11, Department of Civil and Environmental Engineering, Chalmers University of Technology,
95 pp.
Ezeldin, A.S. and Balaguru, P.N. (1992): Normal and high strength fiber reinforced concrete under
compression. Journal of Materials in Civil Engineering, 1992, 4(4), pp. 415-427.
Fantilli, A.P., Ferretti, D., and Rosati, G. (2005): Effect of Bar Diameter on the Behavior of Lightly
Reinforced Concrete Beams. Journal of Materials in Civil Engineering, Vol. 17, No. 1, February
1, 2005, pp. 10-18.
fib Bulletin 8 (2000): Lightweight Aggregate Concrete, Recommended extension to Model Code 90.
Lausanne, 2000.
Flaga, K. (2000): Advances in materials applied in civil engineering, Journal of Materials Processing
Technology, 106 (2000), pp. 173-183, Elsevier.
Gartner, E.M., Young, J.F., Damidot, D.A., and Jawed, I. (2002): Hydration of portland cement. Chapter
3 in Structure and performance of cements (eds. Bensted and Barnes) Spoon Press, London, 2002.
Gettu, R. and Barragán, B.E. (2003): Direct tension test and interpretation. In Test and Design Methods
for Steel Fibre Reinforced Concrete – Background and Experiences, Proceedings of the RILEM
TC 162-TDF Workshop, eds. Schnütgen and Vandevalle, pp. 15-30.
Gettu, R., Schnütgen, B., Erdem, E., and Stang, H. (2000): Design Methods for Steel Fiber Reinforced
Concrete: A State-of-the-Art Report, Report of Sub-task 1.2 Test and Design Methods for Steel
Fiber Reinforced Concrete Brite-EuRam Project BRPR-CT98-0813 (DG12-BRPR), 55 p.
Giaccio, G. and Zerbino, R. (1997): Combined Effects of Coarse Aggregates and Strength Level,
Advanced Cem Bas Mat, 7 (1998), Elsevier, pp. 41-48.
Girmscheid, G. & Hofmann, E. (2000): Industrielles Bauen – Fertigungstechnologie oder
Managementkonzept? Bauingenieur, Band 75, September 2000, pp. 586-592. Springer Verlag. (In
german)
Glavind, M. (1992): Evaluation of the Compressive Behaviour of Fibre Reinforced High Strength
Concrete. PhD. thesis, Technical University of Denmark, Department of Structural Engineering,
Serie R No. 302, 144 pp.
Gopalaratnam V.S. and Gettu R. (1995): On the characterization of flexural toughness in fiber reinforced
concretes. Cem. & Concrete Composites 17 (1995), pp. 239-254.

CHALMERS, Civil and Environmental Engineering 136
Gopalaratnam, V.G., Shah, S.P., Batson, G.B., Criswell, M.E., Ramakrishnan, V., and Wecharatana, M.
(1991): Fracture Toughness of Fiber Reinforced Concrete. ACI Materials Journal, Vol. 88, No. 4,
July-August 1991, pp. 339-353.
Gopalaratnam, V.S. and Shah, S.P. (1987): Tensile Failure of Steel Fiber-Reinforced Concrete, Journal of
Engineering Mech., ASCE, Vol. 113, No. 5, pp. 635-652.
Gossla, U. (2000): Tragverhalten und Sicherheit kombiniert bewehrter Stahlfaserbetonbauteile”
(structural safety of combined steel fibre reinforced concrete members), Heft 501, Deutscher
Ausschuss für Stahlbeton, Beuth Verlag Berlin, Wien, Zürich, 2000. (In German)
Gossla, U. and Pepin, R. (2004): Decken aus selbstverdichtendem Stahlfaserbeton, Braunschweiger
Bauseminar 2004, 11. u. 12. November, pp. 147-154.
Grauers, M. (1998): Rational production and improved working environment through using self
compacting concrete. Brite-EuRam project BRPR-CT96-0366, 1998.
Gray, C. (1995): In Situ Concrete Frames. The Reading Production Engineering Group. University of
Reading, 1995.
Gray, R.J. (1984a): Analysis of Effect of Embedded Fibre Length on Fibre Debonding and Pull-Out from
an Elastic Matrix; Part 1, Review of Theories, Journal of Materials Science, Vol. 19, No. 3, pp.
861-870.
Gray, R.J. (1984b): Analysis of Effect of Embedded Fibre Length on Fibre Debonding and Pull-Out from
an Elastic Matrix; Part 2, Application to Steel Fibre-Cementitious Matrix Composite System,
Journal of Materials Science, Vol. 19, No. 5, pp. 1680-1691.
Gray, R.J., and Johnston, C.D., (1984): Effect of Matrix Composition of Fiber/Matrix Interfacial Bond
Shear Strength in Fiber Reinforced Mortar, Cement and Concrete Research, Vol. 14, pp: 285-296.
Griffith, A.A. (1920): The Phenomena of Rupture and Flow in Solids, Philosophical transaction of the
Royal Society of London, Series A, Physical sciences and engineering, 221, pp. 163-198.
Groth, P. (2000): Fibre Reinforced Concrete – Fracture Mechanics Methods Applied on Self-Compacting
Concrete and Energetically Modified Binders. Ph.D. thesis, Luleå University of Technology,
Sweden.
Grünewald, S. (2004): Performance-based design of self-compacting fibre reinforced concrete. Ph.D.
thesis, Department of Structural and Building Engineering, Delft University of Technology, 2004.
Guerrini, G.L. (2000): Applications of High-Performance Fibre-reinforced Cement-Based Composites,
Applied Composite Materials, 7, Kluwer Academic Publisher, pp. 195-207.
Guse, U. and Müller, H.S (2000): Forschungsergebnisse und Ausblick ins neue Jahrtausend, Betonwerk +
Fertigteil-Technik, BFT 1/2000, pp. 32-45. (In German)
Guttema, T.B. (2004): Constritutive modeling of reinforced steel fiber concrete composite material. In
Vol 2, ed Li et al., Proceedings of FRAMCOS-5, Vail, Colorado, U S A, April 2004, Li et. al.
(eds), 2004, pp. 981-988.
Gylltoft, K. (1983): Fracture Mechanics Models for Fatigue in Concrete Structures. Doctoral Thesis.
Division of Structural Engineering, Luleå University of Technology, Luleå, Sweden, 210 pp.
Hanna, A.S. (1998): Concrete Formwork Systems. Marcel Dekker Incorporated, New York, USA, 1998.
Harnisch, J. (2001): Comparative Studies on Lattice Girder Elements (Full-scale tests and a finite
element simulation), Master’s Thesis 01:13, Dept. of Structural Engineering – Concrete Structures,
Chalmers University of Technology, Göteborg, Sweden, 2001, 81 pp.
Harryson, P. (2002): Industrial bridge construction – merging developments of process, productivity and
products with technical solutions. Publication 02:1, Dept. Of Structural Engineering – Concrete
Structures, Chalmers University of Technology, Göteborg, Sweden, 2002, 90 pp.
Hassanzadeh, M. (2001): Flexural Behaviour of Steel-Fibre-Reinforced High-Performance Concrete, In
the Design of Steel Fibre Reinforced Concrete Structures, Proceedings of the Workshop,
Stockholm, June 12, 2001, The Nordic Concrete Federation, pp. 113-122.
Hearle, J.W.S (ed.) (2001): High-performance Fibres. Woodhead Publishing Ltd, Cambridge, 2001.
CHALMERS, Civil and Environmental Engineering 137
Hemmy, O., Dupont, D., Vandewalle, L., and Stang, H. (2002): Recommendations for Finite Element
Analysis of SFRC. Report of Sub-task 3.5 Test and Design Methods for Steel Fiber Reinforced
Concrete Brite-EuRam Project BRPR-CT98-0813 (DG12-BRPR).
Hillerborg, A. (1980): Analysis of Fracture by Means of the Fictitious Crack Model, Particularly for Fibre
Reinforced Concrete. The Int. J. Cem. Comp. 2 (1980), pp. 177-184.
Hillerborg, A., Modéer, M., and Petersson, P. E. (1976): Analysis of crack formation and crack growth in
concrete by means of fracture mechanics and finite elements, Cement and Concrete Research, Vol.
6, pp. 773-782.
Hilsdorf, H.K. (1995): Concrete, in Concrete Structures Euro-Design Handbook, ed. J. Eible, Ernst &
Sohn, Berlin, 1995.
Hongu, T. and Phillips, G. O. (1997): New Fibers, Second ed., Woodhead Publishing Ltd, Cambridge,
1997.
Hordijk, D. (1991): Local Approach to Fatigue of Concrete, Ph.D. thesis, Technical University of Delft.
Ibrahim, O.T. and Luxmoore, A.R. (1976): Control of crack width by inclusion of fibres in conventionally
reinforced concrete, Cement Composites, Vol. 1, No. 2, July 1976, pp. 77-89.
JCI-SF (1984): JCI Standards for Test Methods of Fiber Reinforced Concrete, Japan Concrete Institute.
Johansson, M. (2000): Structural Behaviour in Concrete Frame Corners of Civil Defence Shelters. Ph.D
thesis, Chalmers University of Technology, Publication 00:2, Göteborg, March 2000. 220 pp.
Johnston, D. W. (1997): Design and Construction of Concrete Formwork, in Concrete Construction
Engineering Handbook, edited by E.G Nawy, CRC Press.
Kanstad, T. (ed.) (2003): Design Rules for Steel Fibre Reinforced Concrete Structures, Proc. Nordic
miniseminar, Oslo, October 2003. The Nordic Concrete Federation, Oslo.
Kanstad, T. and Døssland, Å. (2003): Moment capacity of beams with different cross section height and
steel fibre content: Results from tests, simplified calculations and FE analysis. In Design Rules for
Steel Fibre Reinforced Concrete Structures (ed. T. Kanstad), Proc. Nordic miniseminar, Oslo,
October 2003. The Norwegian Concrete Association, Oslo, pp. 129-139.
Kanstad, T. and Døssland, Å. (2004): Testing and Modelling of Steel Fibre Reinforced Concrete Beams
Designed for Moment Failure. In Fracture Mechanics of Concrete Structures, Vol 2, Li et al.
(eds.), Proceedings of FRAMCOS-5, Vail, Colorado, U S A, April 2004, pp. 1171-1178.
Karihaloo, B. L. (1995): Fracture Mechanics & Structural Concrete, Concrete Design and Construction
Series, Longman Scientific & Technical, Essex, England.
Karihaloo, B.L, Xiao, Q.Z., and Abdalla, H.M. (2004): Strength size effect in quasi-brittle structures. In
Fracture Mechanics of Concrete Structures, Vol 1, eds. Li et al., pp. 163-171, Proceedings of
FRAMCOS-5, Vail, Colorado, USA, April 2004.
Kim J.-K. and Kim Y.-Y. (1999): Fatigue crack growth of high-strength concrete in wedge-splitting test.
Cem. and Concrete Research 29 (1999), pp. 705–712.
Kim, J-K. and Mai, Y-W. (1998): Engineered interfaces in fiber reinforced composites. Elsevier, Oxford,
1998.
Kitsutaka, Y. (1995): Fracture parameters of concrete based on poly-linear approximation analysis of
tension softening diagrams. In Fracture Mechanics of Concrete Structures, ed. Wittman, F.H.,
Aedificatio Publisher, Freiburg, Germany, pp. 199-208.
Kitsutaka, Y. (1997): Fracture parameters by polylinear tension-softening analysis. J. of Eng. Mechanics
123(5), pp. 444-450.
Kitsutaka, Y., Uchida, Y., Mihashi, H., Kaneko, Y., Nakamura, S., and Kurihara, N. (2001): Draft on the
JCI Standard Test Method for Determining Tension Softening Properties of Concrete. In Fracture
Mechanics of Concrete Structures, eds. de Borst et al., Swets & Zeitlinger, Lisse, the Netherlands.
Kooiman, A.G. (2000): Modelling Steel Fibre Reinforced Concrete for Structural Design. Ph.D. Thesis,
Department of Structural and Building Engineering, Delft University of Technology.

CHALMERS, Civil and Environmental Engineering 138
Koskela, Lauri (1992): Application of the new Production Philosophy to Construction. Technical Report
#72. Centre for Integrated Facility Engineering. Department of Civil Engineering. Stanford.
Koskela, Lauri (2000): An exploration towards a production theory and its application to construction.
VTT Publications 408. Technical Research Centre of Finland, Espoo.
Krenchel, H. (1964): Fibre Reinforcement – Theoretical and practical investigations of the elasticity and
strength of fibre-reinforced materials. Ph.D. thesis, Laboratory of Structural Research, Technical
University of Denmark. Akademisk Forlag, Copenhagen.
Krenchel, H. (1974): Fiber Reinforced Brittle Matrix Materials, In Fiber Reinforced Concrete,
Publication SP-44, American Concrete Institute, Detroit, pp. 45-68.
Krenchel, H. (1975): Fibre Spacing and Specific Fibre Surface. In Fibre-Reinforced Cement and
Concrete, ed. Neville, The Construction Press, UK, pp. 69-79.
Kullaa, J: (1994): Constitutive modelling of fibre-reinforced concrete under uniaxial tensile loading,
Composites, Vol. 25. No. 10, pp. 935-944.
Lambrechts, A.N. (2004): The variation of steel fibre characteristics – Study on toughness results 2002-
2003. In Fibre Reinforced Concrete from Theory to Practice, eds. S. Ahmad, M. di Prisco, C.
Meyer, G.A. Plizzari, S. Shah, International Workshop on Advances in Fiber Reinforced Concrete,
Bergamo, Italy, Sept. 24-25, 2004, pp. 135-148.
Lawler, J.S., Wilhelm, T., Zampini, D., and Shah, S.P. (2003): Fracture processes of hybrid fiber-
reinforced mortar. Materials and Structures, Vol. 36, April 2003, pp. 197-208.
Leite J.P. de B., Slowik V. and Mihashi H. (2004): Mesolevel models for simulation of fracture behaviour
of fibre reinforced concrete. In Fibre-Reinforced Concrete, Proceedings of the Sixth International
RILEM Symposium, eds. di Prisco et al.
Leung, C.K.Y. and Chi, J. (1995): Crack-bridging force in random ductile fibre brittle matrix composites.
Journal of Engineering Mechanics, Vol. 121, No. 2, December 1995, pp. 1315-1324.
Leung, C.K.Y. and Li, V.C. (1991): New strength-based model for debonding of continuous fibres in an
elastic matrix. Journal of Material Science, 26 (1991), pp. 5996-6010.
Leung, C.K.Y. and Li, V.C. (1992): Effect of fibre inclination on crack bridging stress in brittle fiber
reinforced matrix composites. Journal of Mech. Phys. Solids, Vol. 40, No. 6, pp. 1333-1362.
Li, F. (1998): Fracture Characterization of Fiber Reinforced Concrete in Direct Uniaxial Tension. Ph.D.
thesis, the Hong Kong University of Science and Technology, 1998.
Li, V.C. (1989): Technological Implications of Concrete Fracture Research – An Overview of Tensile
Failure in Cementitious Materials and Structures, in Fracture Mechanics: Application to Concrete,
Eds. V.C. Li and Z. Bazant, ACI SP-118, pp. 1-16.
Li, V. C. (1993): From Micromechanics to Structural Engineering – The design of cementitious
composites for civil engineering applications, Structural Eng. / Earthquake Eng., Vol. 10, No. 2,
July 1993, pp. 37-48.
Li, V.C. (1995): New Construction Materials Proliferate in Japan, Civil Engineering, August 1995.
Li, V.C. (2002): Large volume, high-performance applications of fibers in civil engineering, Journal of
Applied Polymer Science, Vol. 83, John Wiley & Sons, pp. 660-686.
Li, V.C. and Maalej, M. (1996a): Toughening in Cement Based Composites. Part I: Cement, Mortar, and
Concrete, Cement & Concrete Composites 18 (1996), pp. 223-237.
Li, V.C. and Maalej, M. (1996b): Toughening in Cement Based Composites. Part II: Fiber Reinforced
Cementitious Composites, Cement & Concrete Composites 18 (1996), pp. 239-249.
Li, V.C. and Stang, H. (1997): Interface Property Characterization and Strengthening Mechanisms in
Fibre Reinforced Cement Based Composites. Journal of Advanced Cement Based Materials,
1997(6), pp. 1-20.
Li, V.C. and Stang, H. (2001): Meso: Averaging, In Mechanics of Fibre Reinforced Cement Based
Composites, International Graduate Research School in Applied Mechanics, course material,
Lyngby, Denmark 2001.

CHALMERS, Civil and Environmental Engineering 139
Li, V.C., Stang, H., and Krenchel, H. (1993): Micromechanics of crack bridging in fibre-reinforced
concrete, Materials and Structures, 1993, 26, pp. 486-494.
Li, V.C., Wang, Y., and Backer, S. (1990): Effect of inclining angle, bundling and surface treatment on
synthetic fiber pull-out from cement matrix, Composites 21(2), pp.132–140.
Lin, Y-Z. (1999): Tragverhalten von Stahlfaserbeton, Deutscher Ausschuss für Stahlbeton, Heft 494,
Berlin, 1999. (In German)
Lin, Y-Z. (2000): Method of dimensioning for stress caused by bending and perpendicular force,
Betonwerk + Fertigteil-Technik, BFT 3/2000, pp. 64-70.
Linsbauer, H.N. and Tschegg, E.K. (1986): Fracture energy determination of concrete with cube shaped
specimens, Zement und Beton 31, pp. 38-40.
Locher, F.W., Richartz, W. and Sprung, S. (1976): Erstarren von Zement (in German), Zement Kalk Gips
29(10), pp. 435-442.
Lok, T.-S. and Pei, J.-S. (1998): Flexural Behaviour of Steel Fiber Reinforced Concrete, Journal of
Materials in Civil Engineering, Vol. 10 No. 2, May 1998, pp. 86-97.
Lok, T.-S. and Xiao, J.R. (1999): Flexural Strength Assessment of Steel Fiber Reinforced Concrete,
Journal of Materials in Civil Engineering, Vol. 11 No. 3, August 1999, pp. 188-196.
Low, N.M.P., Beaudoin, J.J. (1993): Flexural strength and microstructure of cement binders reinforced
with wollastonite micro-fibers, Cement and Concrete Research, 23, 1993, pp. 905-916.
Lundgren, K, Helgesson, J, and Sylvén R. (2005): Joints in lattice girder structures. Chalmers University
of Technology, Department of Civil and Environmental Engineering, Structural Engineering -
Concrete Structures, Report 2005:9, Göteborg, 68 pp.
Lundgren, K. (1999): Three-Dimensional Modelling of Bond in Reinforced Concrete. Theoretical Model,
Experiments and Applications. Ph.D. thesis Chalmers University of Technology, Publication 99:1,
Göteborg, November 1999. 129 pp.
Löfgen, I. (2002): In-situ concrete building systems – developments for industrial construction. Licentiate
thesis, Publication No. 02:2, Dept. of Structural Engineering, Chalmers University of Technology,
138 pp.
Löfgren, I. (2004): The wedge splitting test – a test method for assessment of fracture parameters of FRC?
In Fracture Mechanics of Concrete Structures, Vol. 2, Li et al. (eds.), Proceedings of FRAMCOS-
5, Vail, Colorado, USA, April 2004, pp. 1155-1162.
Löfgren, I. and Gylltoft, K. (2001): In-situ cast concrete building: Important aspects of industrialised
construction, Nordic Concrete Research, 1/2001, 2001, pp. 61-81.
Löfgren, I., Olesen J.F., and Flansbjer, M. (2004a): Application of WST-method for fracture testing of
fibre-reinforced concrete. Report 04:13, Department of Structural Engineering and Mechanics,
Chalmers University of Technology, Göteborg 2004, 52 pp.
Löfgren, I., Stang, H. and Olesen, J.F. (2004b): Wedge splitting test – a test to determine fracture
properties of FRC. In Fibre-Reinforced Concretes - BEFIB 2004 –Proceedings of the Sixth RILEM
symposium. Eds. M.di Prisco, R. Felicetti, and G.A. Plizzari. Varenna, Italy, 20th-22nd September
2004. PRO 39, RILEM Publications S.A.R.L, Bagneaux, pp. 379-388.
Maidl, B.R. (1995): Steel fibre reinforced concrete, Ernst & Sohn, Berlin 1995, p. 292.
Mandel, J.A., Wei, S., and Said, S., (1987): Studies of the Properties of The Fiber Matrix Interface in
Steel Fiber Reinforced Mortar, ACI Material Journal, March-April, pp. 101-109.
Markovic, I., Walraven, J.C., and van Mier J.G.M. (2004): Tensile behaviour of high performance hybrid
fibre concrete. In Fracture Mechanics of Concrete Structures, Vol 2, eds Li et al., Proceedings of
FRAMCOS-5, Vail, Colorado, USA, April 2004, pp. 1113-1120.
Marti, P., Pfyl, T., Sigrist, V., and Ulaga, T. (1999): Harmonized Test Procedures for Steel Fiber-
Reinforced Concrete. ACI Materials Journal, Vol. 96, No. 6, Nov.-Dec. 1999, pp. 676-685.
Martin, G.C (1927): Method of forming pipes, US Patent No. 1,633,219, 17 Dec. 1926.

CHALMERS, Civil and Environmental Engineering 140
Meda A., Plizzari G.A. and Slowik V. (2001): Fracture of fiber reinforced concrete slabs on grade. In
Fracture Mechanics of Concrete Structures, FRAMCOS-4, ed. De Borst et al., Swets & Zeitlinger,
Lisse, the Netherlands. pp.1013-1020.
Meda, A., Plizzari, G.A., and Sorelli, L. (2004): Uni-axial and bending test for the determination of
fracture properties of fiber reinforced concrete. In Fracture Mechanics of Concrete Structures,
Vol. 2, eds. Li et al., Proceedings of FRAMCOS-5, Vail, Colorado, USA, April 2004, pp. 1163-
1170.
Mindess, S. (1995): Fibre Reinforced Concrete: Challenges and Prospects. In Fiber Reinforced Concrete
– Modern Developments, Banthia, N. and Mindess, S. (eds.). The second University-Industry
Workshop on Fibre Reinforced Concrete and Other Composites held in Toronto, Canada, March
26-29, 1995, pp. 1-11.
Mindess, S., Taerwe, L., Lin, Y-Z., Ansari, F., and Batson, G. (1996): Standard testing, In High
Performance Fiber einforced Cement Composites 2. Eds A.E. Naaman and H.W. Reinhardt, E &
FN Spon, London 1996, pp. 383-421.
Mindess, S., Young, J.F., and Darwin, D (2003): Concrete, 2nd ed. Prentice Hall, Upper Saddle River
New Jersey, 2002.
Mohamed, A.R. and Hansen, W. (1999): Micromechanical modeling of crack-aggregate interaction in
concrete materials, Cement & Concrete Composites, 21 (1999), Elsevier, pp. 349-359.
Müller, J. P. (1991): Element or Lattice Girder Floors – Conventionally Reinforced and Prestressed –
with Costing Examples, Betonwerk + Fertigteil-Technik, BFT 4/1991, pp. 44-50.
Naaman, A.E. (1985): Fiber Reinforcement for Concrete, Concrete International, March 1985, pp. 21-25.
Naaman, A.E. (2003): Engineered Steel Fibers with Optimal Properties for Reinforcement of Cement
Composites, Journal of Advanced Concrete Technology, Vol. 1, No. 3, pp. 241-252.
Naaman, A.E. and Shah, S.P. (1976): Pull-Out Mechanism in Steel Fibre-Reinforced Concrete. Journal of
the Structural Division, ASCE, 102(ST8), pp. 1537-1548.
Naaman, A.E., Wongtanakitcharoen, T., and Hauser, G. (2005): Influence of Different Fibres on Plastic
Shrinkage Cracking of Concrete. ACI Materials Journal, V. 102, No. 1, Jan-Feb 2005, pp. 49-58.
Namur, G.G. and Naaman, A.E., (1989): A Bond Stress Model for Fiber Reinforced Concrete Based on
Bond Stress Slip Relationship, ACI Material Journal, Vol. 86, No. 1, pp. 45-57.
Nanakorn, P. and Horii, H. (1996): A fracture-Mechanics-Based Design Method for SFRC Tunnel
Linings. Tunnelling and Underground Space Technology, Vol 11, No 1 (1996). pp. 39-43.
Nanakorn P. and Horii H. (1996b): Back analysis of tension-softening relationship of concrete. J.
Materials, Conc. Struct., Pavements 32(544), pp. 265-275.
Nelson, P.K, Li, V.C, and Kamada, T. (2002): Fracture Toughness of Microfiber Reinforced Cement
Composites, Journal of Materials in Civil Engineering, September/October 2002, pp. 384–391.
Nemegeer D., Vanbrabant J. and Stang H. (2003): Brite Euram Program on Steel Fibre Concret Subtask:
Durability: Corrosion Resistance of Cracked Fibre Reinforced Concrete. In Test and Design
Methods for Steel Fibre Reinforced Concrete – Background and Experiences, Proceedings of the
RILEM TC 162-TDF Workshop, eds. Schnütgen and Vandevalle, pp. 47-66.
Neville, A. M. (1997): Aggregate Bond and Modulus of Elasticity of Concrete, ACI Materials Journal,
January-February 1997, pp. 71-74.
Neville, A.M. (2000): Properties of Concrete, fourth edition. Pearson Educion Limited.
Olesen, J. F. (2001a): Fictitious crack propagation on fibre-reinforced concrete beams. ASCE, J. of Eng.
Mech. 127(3) 2001, pp. 272-280.
Olesen, J.F. (2001b): Cracks in reinforced FRC beams subjected to bending and axial load. in Fracture
Mechanics of Concrete Structures. eds. de Borst et al. FRAMCOS-4. A.A. Balkema Publishers
(2001) pp. 1027-1033.
Olesen, J.F., Østergaard, L., and Stang, H. (2004): Nonlinear Fracture Mechanics and Plasticity
Modelling of the Split Cylinder Test, In Proceedings of the International Symposium “Brittle
Matrix Composites 7”, ZTUREKRSI and Woodhead Publishing, Warsaw, pp. 467-476.

CHALMERS, Civil and Environmental Engineering 141
Olson P.C. (1994): Some comments on the bending strength of concrete beams. Mag. of Concrete
Research, 1994:46, pp. 209-214.
Ooi, P.S.K. and Ramsey, T.L. (2003): Curvature and Bending Moments from Inclinometer Data,
International Journal of Geomechanics, ASCE, Vol. 3, No. 1, September 1, 2003, pp. 64-74.
Otsuka, K. and Date H. (2000): Fracture process zone in concrete tension specimen, Engineering
Fracture Mechanics, 65(2000), pp. 111-131.
Ozawa K., Maekawa K. and Okamura H (1992): Development of High Performance Concrete, Journal of
the Faculty of Engineering, the University of Tokyo, Vol. XLI, No. 3 (1992), Tokyo, pp. 381-439.
Patrick M. (1998): The Application of Structural Steel Decking in Commercial and Residental Buildings.
Malaysian Structural Steel Association, Convention 1998.
Pedersen, C. (1996): New production processes, materials and calculation techniques for fibre reinforced
concrete pipes. PhD thesis Dep. of Structural Eng. and Materials, Technical University of
Denmark, Series R, no. 14, 1996.
Petersson, P.E. (1981): Crack growth and development of fracture zones in plain concrete and similar
materials. PhD-thesis, Report TVBM-1006, Division of Building Materials, Lund Institute of
Technology, 174 pp.
Pfyl, T. (2003): Tragverhalten von Stahlfaserbeton. Ph.D. dissertation, ETH, Zürich, 2003. (In German)
Planas J., Elices M., and Guinea G.V. (1992): Measurement of the fracture energy using three-point-bend
tests: 2 Influence of bulk energy dissipation. Materials and Structures, 1992:25, pp. 305-312.
Planas J., Guinea G.V., and Elices M. (1999): Size effect and inverse analysis in concrete fracture,
International Journal of Fracture 95(1999), pp. 367-378.
prEN 14889-1 DRAFT (2004): Fibres for concrete - Part 1: Steel fibres. Definition, specifications and
conformity, Ref. No. prEN 14889-1:2004: E, CEN European Committee for Standardization,
Brussels.
prEN 14889-2 DRAFT (2004): Fibres for concrete - Part 2: Polymer fibres - Definition, specification
and conformity, Ref. No. prEN 14889-2:2004: E, CEN European Committee for Standardization,
Brussels.
Que, N.S. and Tin-Loi, F. (2002): Numerical evaluation of cohesive fracture parameters from a wedge
splitting test, Engineering Fracture Mechanics 69(2002), pp. 1269-1286.
Rao, C.V.S.K (1979): Effectiveness of random fibres in composites. Cement and Concrete Research, Vol.
9, pp. 685-693.
Rasmussen, T.V. (1997): Time Dependent Interfacial Parameters in Cementitious Composite Materials.
PhD-thesis, Department of Structural Engineering and Materials, Technical University of
Denmark, No 33, 1997.
Rebentrost, M. (2003): Deformation Capacity and Moment Redistribution of Partially Prestressed
Concrete Beams, Ph.D. dissertation, Department of Civil and Environmental Engineering,
Adelaide University, Australia.
Reinhardt H.W. and A. E. Naaman (eds) (1992): High Performance Fiber Reinforced Cement Composites
1, E & FN Spon, London.
Reinhardt H.W. and A. E. Naaman (eds) (1996): High Performance Fiber Reinforced Cement Composites
2, E & FN Spon, London.
Reinhardt, H.W. (1984): Fracture mechanics of an elastic softening material like concrete. Heron 29, 2.
Reinhardt, H.W., Cornelissen, H.A.W., and Hordijk, D.A. (1986): Tensile tests and failure analysis of
concrete, Journal of Structural Engineering, ASCE, 112(5), pp. 448-464.
RILEM Recommendation AAC13.1 (1994): Determination of the specific fracture energy and strain
softening of AAC, RILEM Technical Recommendations for the testing and use of construction
materials, E & FN Spon, 1994, pp. 156–158.
RILEM Report 5 (1991): Fracture Mechanics Test Methods for Concrete. Edited by S.P. Shah and A.
Carpinteri. Chapman and Hall, London, 1991.

CHALMERS, Civil and Environmental Engineering 142
RILEM TC 162- TDF (2000): Test and design methods for steel fibre reinforced concrete: -- Design
Method, (Chairlady L. Vandewalle), Materials and Structures, Vol. 33 March 2000, pp. 75-81.
RILEM TC 162-TDF (2001): Test and design methods for steel fibre reinforced concrete.
Recommendations for uni-axial tension test. Materials and Structures 34, Jan-Feb 2001, pp. 3-6.
RILEM TC 162- TDF (2002): Design of steel fibre reinforced concrete using the -w method - principles
and applications, (Chairlady L. Vandewalle), Materials and Structures, Vol. 35 June 2002, pp.
262-278.
RILEM TC 162-TDF (2002a): Test and design methods for steel fibre reinforced concrete. Bending test –
Final Recommendation. Materials and Structures 35, Nov 2002, pp. 579-582.
RILEM TC 162-TDF (2002b): Brite Euram Project nr: BE 97-4163, Test and Design Methods for Steel
Fibre Reinforced Concrete, ISBN 90-5682-358-2, June 2002.
RILEM TC 162- TDF (2003a): Test and design methods for steel fibre reinforced concrete: -- Design
Method Final Recommendation, (Chairlady L. Vandewalle), Materials and Structures, Vol. 36
October 2003, pp. 560-567.
RILEM TC 162-TDF (2003b): Test and design methods for steel fibre reinforced concrete: Background
and Experiences. Proceedings of the RILEM TC 162-TDF Workshop, eds. B. Schnütgen and L.
Vandewalle. PRO 31, RILEM Publications S.A.R.L., Bagneaux, 2003.
RILEM TC 89-FMT (1991): Fracture Mechcanics Test Methods for Concrete, Report of Technical
Committee 89-FMT, Eds. S.P. Shah and A. Carpinteri, RILEM Report 5, Chapman and Hall,
Cambridge, 1991.
Roelfstra P.E. and Wittmann F.H. (1986): Numerical method to link strain softening with failure of
concrete. In Fracture Toughness and Fracture Energy of Concrete, Elsevier, pp. 163-175.
Rokugo, K., Iwasa, M., Seko, S., and Koyanagi, W. (1989): Tension-softening diagrams of steel fiber
reinforced concrete, In: Fracture of Concrete and Rock, Recent Developments, Eds. Shah, S.P.,
Swartz, S.E., and Barr, B., Elsevier, New York, pp. 513-522.
Romualdi, J.P. and Batson, G.B. (1963): Mechanics of crack arrest in concrete. Proceedings, American
Society of Civil Engineers, Journal, Engineering Mechanics Division, Vol. 89, EM3, June 1963,
pp. 147-68.
Romualdi, J.P. and Mandel, J.A. (1964): Tensile strength of concrete affected by uniformly distributed
and closely spaced short lengths of wire reinforcement. ACI J. Proc. 61(6) 1964, pp. 657-671.
Rosenbuch, J. (2003): Zur Querkrafttragfähigkeit von Balken aus stahlfaseverstärktem Stahlbeton. PhD
thesis, Fachbereich Bauingenieurwesen der Technischen Universität Corolo-Wilhelmina zu
Braunschweig. (In German)
Rossi, P. (1997): High performance multimodal fiber reinforced cement composites (HPMFRCC): The
LCPC experience, ACI Materials Journal, V. 94, No. 6, pp. 478-483.
Rossi P., Acker, P., and Malier, P. (1987): Effect of steel fibres at two different stages: the material and
the structure, Materials and Structures, Vol. 20, pp. 436-439.
Rossi, P. and Chanvillard, G. (eds.) (2000): Fibre-Reinforced Concretes (FRC), Proceedings of the Fifth
International RILEM symposium, BEFIB 2000. PRO 15, RILEM Publications S.A.R.L, Bagneaux,
pp. 29-50.
Rots, J.G. (1988): Computational modeling of concrete fracture. PhD thesis Delft University of
Technology, Delft, The Netherlands.
Sarja, A. (1998): Open and Industrialised Building. CIB Publication 222, Report of Working Commission
W24. E & FN Spon. London, 1998, pp. 3-94 &159-184.
Schumacher, P., Den Ujil, J.A., Walraven, J.C. (2003): Fracture energy determined from three point
bending tests on self-compacting steel fiber reinforced concrete, Stevin-report 25.5-03-18,
Department of Structural and Building Engineering, Delft University of Technology.
Shah, S. P. (1991): Do Fibers Increase the Tensile Strength of Cement-Based Matrixes? ACI Material
Journal, V. 88, No. 6, Nov-Dec 1991, pp. 595-602.
CHALMERS, Civil and Environmental Engineering 143
Shah, S.P. and Ahmad, S.H. (eds.) (1994): High Performance Concretes and Applications. Edward
Arnold.
Shah S.P, Ouyang C. and Swartz S.E. (1995): Fracture mechanics of concrete: Applications of fracture
mechanics to concrete, rock, and other brittle materials. John Wiley and Sons, New York.
Silfwerbrand, J. (2001): The Design of Steel Fibre Reinforced Concrete Structures, Proc. Nordic
miniseminar, Stockholm, June 12, 2001. The Nordic Concrete Federation, Oslo.
Simone, A. (2003): Continuous-Discontinuous Modelling of Failure, Ph.D. thesis, Faculty of Civil
Engineering, Delft University of Technology, 2004, 198 pp.
Soroushian, P. and Lee, C-D. (1990): Distribution and Orientation of Fibers in Steel Fiber Reinforced
Concrete, ACI Material Journal, V. 87, No. 5, Sept-Oct 1990, pp. 433-439.
SOU 2000:44: Från byggsekt till byggsektorn. Byggkostnadsdelegationen, 2000. (In Swedish.)
(http://www.regeringen.se/propositioner/sou/index.htm)
Sousa, J.L.A.O, Gettu, R., and Barragán, B.E. (2002): Obtaining the –w curve from the inverse analysis
of the notched beam response. In Annex D of Barragán, B.E. (2002) ‘Failure and toughness of
steel fiber reinforced concrete under tension and shear’, Ph.D. Thesis, Universitat Politécnica de
Catalunya, Barcelona, Spain, 2002.
Sousa, J.L.A.O. and Gettu R. (2004): Inverse analysis of notched-beam test data for obtaining tensile
stress-crack opening relation of fiber reinforced concrete. In BEFIB 2004 - Sixth RILEM
symposium on fibre reinforced concrete (FRC), Varenna, Italy, 20th-22nd September 2004. PRO
39, RILEM Publications S.A.R.L, Bagneaux, pp. 809-818.
Stang, H. (1987): A double inclusion model for microcrack arrest in fibre reinforced brittle materials. J.
Mech. Phys. Solids Vol. 35, No. 3, pp. 325-342.
Stang, H. (1992): Evaluation of properties of cementitious fiber composite materials, in H. W. Reinhardt
& A. E. Naaman (eds), High Performance Fiber Reinforced Cement Composites, Vol. 1, E & FN
Spon, London, pp. 388–406.
Stang, H. (1996): Significance of shrinkage-induced clamping pressure in fiber-matrix bonding in
cementitious composite materials, Advanced Cement Based Materials, 4, pp. 106–115.
Stang, H (2004): Toughness in testing and design, the FRC experience. In Fracture Mechanics of
Concrete Structures, Vol 1, eds. Li et al., Proceedings of FRAMCOS-5, Vail, Colorado, USA,
April 2004, pp. 61-69.
Stang, H. and Bendixen S. (1998): A simple model for uniaxial testing of fiber reinforced concrete. In
Experimental Mechanics, Advances in Design, Testing and Analysis. (Ed. I. M. Allison.) AA.
Balkema. Rotterdam, Brookfield, pp. 887-892.
Stang, H., Gettu, R., and Barr, B. (2000): Test Methods for the Characterization of Steel Fiber Reinforced
Concrete - A State-of-the-Art Report. Report of Sub-task 1.1 Test and Design Methods for Steel
Fiber Reinforced Concrete Brite-EuRam Project BRPR-CT98-0813 (DG12-BRPR), 51 pp.
Stang, H. and Li, V.C. (2001): Mechanics of Fibre Reinforced Cement Based Composites, International
Graduate Research School in Applied Mechanics, course material, Lyngby, Denmark 2001.
Stang, H and Li, V.C. (2004): Classification of fibre reinforced cementitious materials for structural
applications. In BEFIB 2004 – Sixth RILEM symposium on fibre reinforced concrete (FRC),
Varenna, Italy, 20th-22nd September 2004. PRO 39, RILEM Publications S.A.R.L, Bagneaux,
pp197-218.
Stang, H. and Shah, S.P. (1990): Pull-out problem: Stress Versus Fracture Mechanical Approach. ASCE J.
Eng. Mech., Vol 116, No 10, pp. 2136-2150.
Stang, H. and Olesen, J.F. (2000): A fracture mechanics based design approach to FRC, In Fibre-
Reinforced Concretes (FRC), BEFIB’ 2000, eds. P. Rossi & G. Chanvillard, RILEM Publications
S.A.R.L., Cachan Cedex, France. Proceedings of the Fifth International RILEM Symposium, pp.
315–324.
Stang, H., and Olesen, J.F. (1998): On the interpretation of bending tests on FRC-materials. In Fracture
Mechanics of Concrete Structures (eds. Mihashi and Rokugo), Proceedings FRAMCOS-3, Vol. 1,
D-79104 Freiburg, Germany, 1998. Aedificatio Publishers, pp. 511-520.
CHALMERS, Civil and Environmental Engineering 144
Sujivorakul, C., Waas, A.M., and Naaman, A.E. (2000): Pull-out response of a smooth fiber with an end
anchorage. Journal of Engineering Mechanics / September 2000, pp. 986-993.
Svahn, P.-O. (2005): Dynamic Behaviour of Reinforced Concrete Structures – Analyses with a Strong
Discontinuity Approach. Ph.D. thesis, Department of Civil and Environmental Engineering,
Chalmers University of Technology.
Swedish Concrete Society (1997): Betongrapport nr. 4. Stålfiberbetong – rekommendationer för
konstruktion, utförande och provning, Utgåva 2, Svenska Betongföreningen, Stockholm, Nov.
1997, 135 pp.
Taerwe, L. and Van Gysel, A. (1996a): Influence of steel fibres on design stress–strain curve for
highstrength concrete. Journal of Engineering Mechanics, 1996, 122, No. 8, pp. 695-704.
Taerwe, L. and van Gysel, A. (1996b): Effect of Steel Fibers on the Design Stress-Strain Curve for High
Strength Concrete Subjected to Axial Compression, Mechanics of Composite Materials, V. 32, No.
2, pp. 122-129.
Tan, K.-H., Paramasivam, P., and Tan, K.-C. (1995): Cracking Characteristics of Reinforced Steel Fiber
Concrete Beams under Short- and Long-Term Loadings, Advanced Cement Based Materials, pp.
127-137.
Tasderi and Karihaloo (2001): Effect of type and volume fraction of aggregate on the fracture properties
of concrete, in Fracture Mechanics of Concrete Structures, de Borst et al. (eds), Swets &
Zeitlinger, Lisse, 2001, pp. 123-129.
Taylor, M., Lyndon, F.D., and Barr, B.I.G. (1997): Toughness Measurements on Steel Fibre-reinforced
High Strength Concrete. Cement and Concrete Composites, Vol. 19 (1997), pp. 329-340.
Tennis, P.D. and Jennings, H.M. (2000): A Model for Two Types of Calcium Silicate Hydrate in the
Microstructure of Portland Cement Pastes, Cement and Concrete Research, June 2000, pp. 855-
863.
Thorenfeld, T.E., Tomaszewicz, A., and Jensen, J.J. (1987): Mechanical Properties of High-Strength
Concrete and Application in Design. Utilization of High Strength Concrete, Symposium in
Stavanger, Norway, 1987. Tapir N-7034 Trondheim.
Tijssens, M.G.A., Sluys, L.J., and van der Giessen, E. (2001): Simulation of cementitious composites
with explicit modeling of microstructural features, Engineering Fracture Mechanics, 68 (2001),
Pergamon, pp. 1245-1263.
TNO (2002): DIANA Finite Element Analysis, User's Manual, release 8.1. TNO Building and
Construction Research, 2002.
Trunk, B., Schober, G., and Wittmann, F.H. (1999): Fracture mechanics parameters of autoclaved aerated
concrete. Cement and Concrete Research 29 (1999), pp. 855-859.
Trygstad, S. (2001): Structural Behaviour of Post Tensioned Concrete Structures: Flat Slab. Slabs on
Ground. Ph.D. thesis, Norwegian University of Science and Technology, 279 pp.
Uchida, Y. and Barr, B.I.G (1998): Tension softening curves of concrete determined from different test
specimen geometries, In Fracture Mechanics of Concrete Structures, FRAMCOS-3, eds. Mihashi,
H. and Rokugo, K., Aedificato Publisher, Freiburg, Germany, pp. 387-398.
Uchida, Y., Kurihara, N., Rokugo, K., and Koyanagi, W. (1995): Determination of tension softening
diagrams of various kinds of concrete by means of numerical analysis. In Fracture Mechanics of
Concrete Structures, FRAMCOS-2, ed. F.H. Wittmann, pp. 17-30.
Ulfkjær, J.P., Krenk, S., and Brinckner, R. (1995): Analytical model for fictitious crack propagation in
concrete beams. ASCE, J. Eng. Mech., 121(1) (1995), pp. 7-15.
van Gysel, A. (1999): A pull-out model for hooked end steel fibres. In High Performance Fiber
Reinforced Cement Composites – HPFRCC 3, RILEM Proceedings, PRO 6, RILEM Publications
S.A.R.L., Cachan, France, pp. 351-359.
van Mier, J.G.M. (1991): Mode I fracture of concrete: Discontinuous crack growth and crack interface
grain bridging, Cement and Concrete Research, 21 (1991), Pergamon, pp. 1-15.
van Mier, J.G.M. (1997): Fracture processes of concrete, CRC Press, Boca Raton, Florida.

CHALMERS, Civil and Environmental Engineering 145
van Mier, J.G.M. (2004): Reality Behind Fictitious Cracks? In Fracture Mechanics of Concrete
Structures, Vol 1, eds. Li et al., Proceedings of FRAMCOS-5, Vail, Colorado, USA, April 2004,
pp. 11-30.
van Mier, J.G.M. and van Vliet, M.R.A. (1999): Experimentation, numerical simulation and the role of
engineering judgement in the fracture mechanics of concrete and concrete structures, Construction
and Building Materials, 13(1999), Elsevier, pp. 3-14.
Vecchio, F. J. and Collins, M. P. (1993): Compression Response of Cracked Reinforced Concrete. J. Str.
Eng., ASCE 119, 12 (1993), pp. 3590-3610.
Verdugo, G. (2001): Full-scale Tests and Analytical Model for Lattice Girder Elements, Master’s Thesis
01:11, Dept. of Structural Engineering – Concrete Structures, Chalmers University of Technology,
Göteborg, Sweden, 2001, 53 pp.
Villmann, B., Villmann, T., and Slowik, V. (2004): Determination of softening curves by backward
analyses of experiments and optimization using an evolutionary algorithm. In Fracture Mechanics
of Concrete Structures, FRAMCOS-5, eds. Li et al., Proceedings of FRAMCOS-5, Vail, Colorado,
USA, April 2004, pp. 439-445.
Vonk, R. A. (1992): Softening of concrete loaded in compression. Ph.D. thesis, Technical University of
Eindhoven.
Voo, J.Y.L. and Foster, S.J. (2003): Variable engagement model for fibre reinforced concrete in tension,
UNICIV Report R-420, School of Civil and Environmental Engineering, University of New South
Wales, Australia, 2003.
Walraven J. (1999): The evolution of concrete. Structural Concrete – Journal of the fib, No. 1, March,
Thomas Telford, pp. 3-11.
Walter, R., Østergaard, L., Olesen, J.F., and Stang, H. (2005): Wedge splitting test for a steel–concrete
interface. Journal of Engineering Fracture Mechanics, Vol. 72, Issue 17, pp. 2565–2583.
Wang, Y., Li, V.C., and Backer, S. (1989): Modelling of Fibre Pull-Out from a Cement Matrix.
International Journal of Cement Composites & Lightweight Concrete, Vol. 10, No. 3, pp. 143-149.
Wang, Y., Li, C.V. and Backer, S. (1990a): Tensile Properties of Synthetic Fiber Reinforced Mortar,
Cement and Concrete Composites, Vol. 12, pp. 29-40.
Wang, Y., Li, C.V. and Backer, S. (1990b): Experimental Determination of Tensile Behavior of Fiber
Reinforced Concrete, ACI Materials Journals, Vol. 87, No. 5, Sept-Oct, pp. 461-468.
Warner, R.F., Rangan, B.V., Hall, A.S., and Faulkes, K.A. (1998): Concrete Structures, Longman,
Melbourne, 1998.
Warszawski, A. (1999): Industrialized and Automated Building Systems – A managerial approach, E &
FN Spon, London, 1999.
Wongtanakitcharoen, T. and Naaman, A.E. (2004): Early age bond strength development of fibres in FRC
composites. In Fibre-Reinforced Concretes, Proceedings of the Sixth International RILEM
Symposium, Varenna, Italy, 20-22 September 2004, pp. 431-442.
Wu, K-R, Chen, B., Yao, W., and Zhang, D. (2001): Effect of coarse aggregate type on mechanical
properties of high-performance concrete, Cement and Concrete Research, 31 (2001), Pergamon,
pp. 1421-1425.
Zheng, Z. and Feldman, D. (1995): Synthetic Fibre-Reinforced Concrete, Prog. Polym. Sci., Vol. 20, pp.
185-210.
Zilch, K. (2000): Innovationen und Entwicklungen im Massivbau, Bauingenieur, Band 75, August 2000,
pp. 537-546. (In German)
Zitkevic, N. (1939): Improvements in reinforced concretes, British Patent No. 51,003, May 1939.
Zollo, R.F. (1997): Fiber-reinforced Concrete: an Overview after 30 Years of Development, Cement and
Concrete Composites, Vol. 19, Issue 2, pp. 107-122.
Østergaard and Olesen (2004): Comparative study of fracture mechanical test methods for concrete. In
Fracture Mechanics of Concrete Structures, FRAMCOS-5, eds. Li et al., Proceedings of
FRAMCOS-5, Vail, Colorado, USA, April 2004, pp. 455-462.
CHALMERS, Civil and Environmental Engineering 146
Østergaard, L. (2003): Early-Age Fracture Mechanics and Cracking of Concrete – Experiments and
Modelling. Ph.D. thesis, Department of Civil Engineering, Technical University of Denmark.