Embed Size (px)
Citation preview
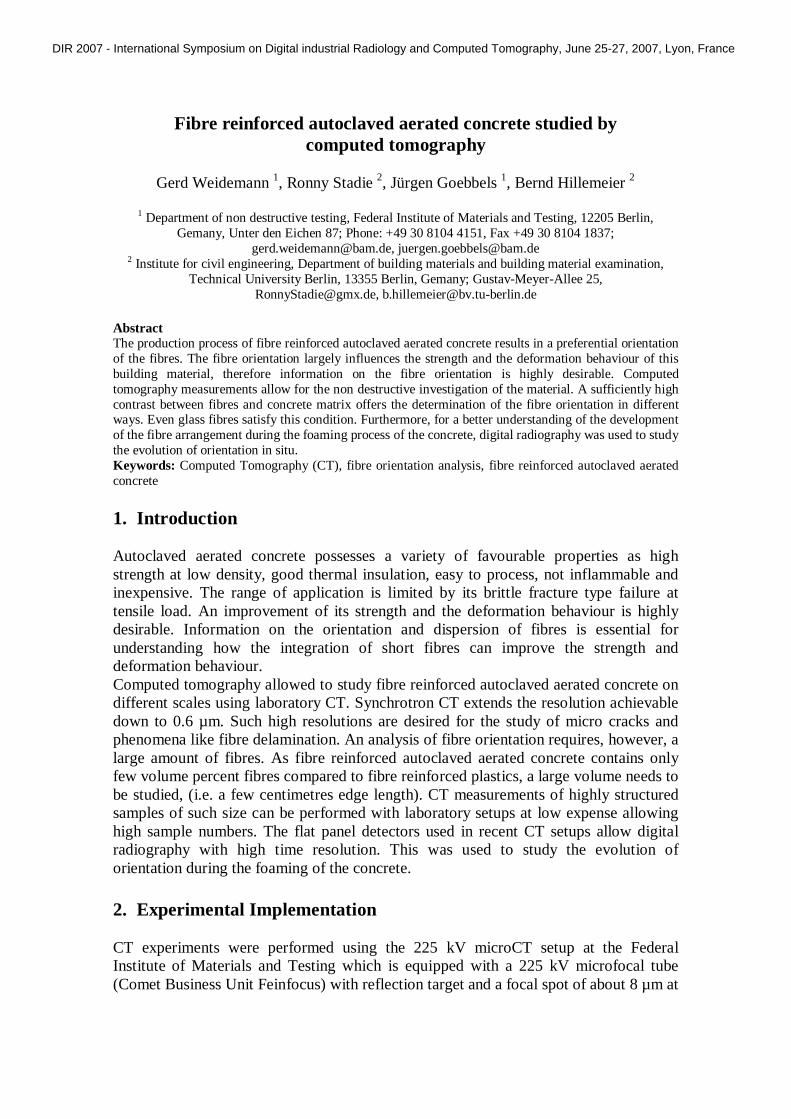
Fibre reinforced autoclaved aerated concrete studied by computed tomography
Gerd Weidemann 1, Ronny Stadie 2, Jürgen Goebbels 1, Bernd Hillemeier 2
1 Department of non destructive testing, Federal Institute of Materials and Testing, 12205 Berlin,
Gemany, Unter den Eichen 87; Phone: +49 30 8104 4151, Fax +49 30 8104 1837; [email protected], [email protected]
2 Institute for civil engineering, Department of building materials and building material examination, Technical University Berlin, 13355 Berlin, Gemany; Gustav-Meyer-Allee 25,
[email protected], [email protected] Abstract The production process of fibre reinforced autoclaved aerated concrete results in a preferential orientation of the fibres. The fibre orientation largely influences the strength and the deformation behaviour of this building material, therefore information on the fibre orientation is highly desirable. Computed tomography measurements allow for the non destructive investigation of the material. A sufficiently high contrast between fibres and concrete matrix offers the determination of the fibre orientation in different ways. Even glass fibres satisfy this condition. Furthermore, for a better understanding of the development of the fibre arrangement during the foaming process of the concrete, digital radiography was used to study the evolution of orientation in situ. Keywords: Computed Tomography (CT), fibre orientation analysis, fibre reinforced autoclaved aerated concrete 1. Introduction Autoclaved aerated concrete possesses a variety of favourable properties as high strength at low density, good thermal insulation, easy to process, not inflammable and inexpensive. The range of application is limited by its brittle fracture type failure at tensile load. An improvement of its strength and the deformation behaviour is highly desirable. Information on the orientation and dispersion of fibres is essential for understanding how the integration of short fibres can improve the strength and deformation behaviour. Computed tomography allowed to study fibre reinforced autoclaved aerated concrete on different scales using laboratory CT. Synchrotron CT extends the resolution achievable down to 0.6 µm. Such high resolutions are desired for the study of micro cracks and phenomena like fibre delamination. An analysis of fibre orientation requires, however, a large amount of fibres. As fibre reinforced autoclaved aerated concrete contains only few volume percent fibres compared to fibre reinforced plastics, a large volume needs to be studied, (i.e. a few centimetres edge length). CT measurements of highly structured samples of such size can be performed with laboratory setups at low expense allowing high sample numbers. The flat panel detectors used in recent CT setups allow digital radiography with high time resolution. This was used to study the evolution of orientation during the foaming of the concrete. 2. Experimental Implementation CT experiments were performed using the 225 kV microCT setup at the Federal Institute of Materials and Testing which is equipped with a 225 kV microfocal tube (Comet Business Unit Feinfocus) with reflection target and a focal spot of about 8 µm at
DIR 2007 - International Symposium on Digital industrial Radiology and Computed Tomography, June 25-27, 2007, Lyon, France
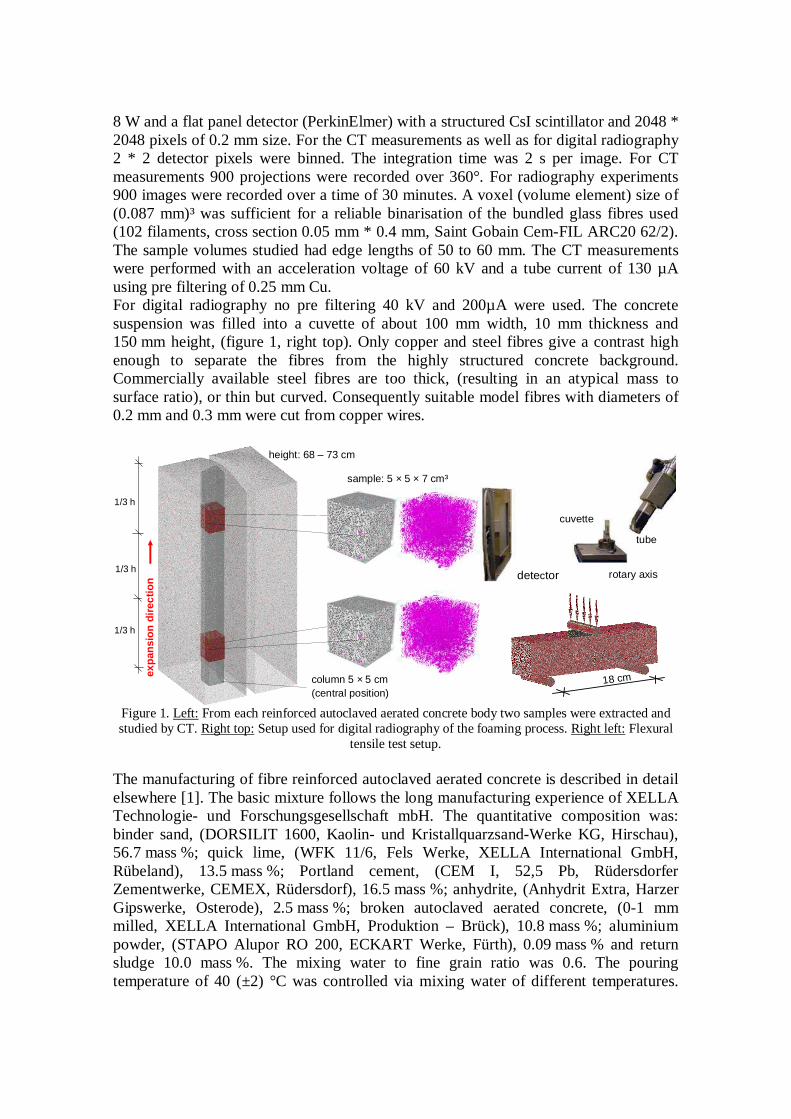
8 W and a flat panel detector (PerkinElmer) with a structured CsI scintillator and 2048 * 2048 pixels of 0.2 mm size. For the CT measurements as well as for digital radiography 2 * 2 detector pixels were binned. The integration time was 2 s per image. For CT measurements 900 projections were recorded over 360°. For radiography experiments 900 images were recorded over a time of 30 minutes. A voxel (volume element) size of (0.087 mm)³ was sufficient for a reliable binarisation of the bundled glass fibres used (102 filaments, cross section 0.05 mm * 0.4 mm, Saint Gobain Cem-FIL ARC20 62/2). The sample volumes studied had edge lengths of 50 to 60 mm. The CT measurements were performed with an acceleration voltage of 60 kV and a tube current of 130 µA using pre filtering of 0.25 mm Cu. For digital radiography no pre filtering 40 kV and 200µA were used. The concrete suspension was filled into a cuvette of about 100 mm width, 10 mm thickness and 150 mm height, (figure 1, right top). Only copper and steel fibres give a contrast high enough to separate the fibres from the highly structured concrete background. Commercially available steel fibres are too thick, (resulting in an atypical mass to surface ratio), or thin but curved. Consequently suitable model fibres with diameters of 0.2 mm and 0.3 mm were cut from copper wires.
h1/3
h1/3
h1/3
exp
ansi
on
dir
ecti
on
column 5 × 5 cm(central position)
height: 68 – 73 cm
sample: 5 × 5 × 7 cm³
18 cm
rotary axis
tube
cuvette
detector
Figure 1. Left: From each reinforced autoclaved aerated concrete body two samples were extracted and studied by CT. Right top: Setup used for digital radiography of the foaming process. Right left: Flexural
tensile test setup. The manufacturing of fibre reinforced autoclaved aerated concrete is described in detail elsewhere [1]. The basic mixture follows the long manufacturing experience of XELLA Technologie- und Forschungsgesellschaft mbH. The quantitative composition was: binder sand, (DORSILIT 1600, Kaolin- und Kristallquarzsand-Werke KG, Hirschau), 56.7 mass %; quick lime, (WFK 11/6, Fels Werke, XELLA International GmbH, Rübeland), 13.5 mass %; Portland cement, (CEM I, 52,5 Pb, Rüdersdorfer Zementwerke, CEMEX, Rüdersdorf), 16.5 mass %; anhydrite, (Anhydrit Extra, Harzer Gipswerke, Osterode), 2.5 mass %; broken autoclaved aerated concrete, (0-1 mm milled, XELLA International GmbH, Produktion – Brück), 10.8 mass %; aluminium powder, (STAPO Alupor RO 200, ECKART Werke, Fürth), 0.09 mass % and return sludge 10.0 mass %. The mixing water to fine grain ratio was 0.6. The pouring temperature of 40 (±2) °C was controlled via mixing water of different temperatures.
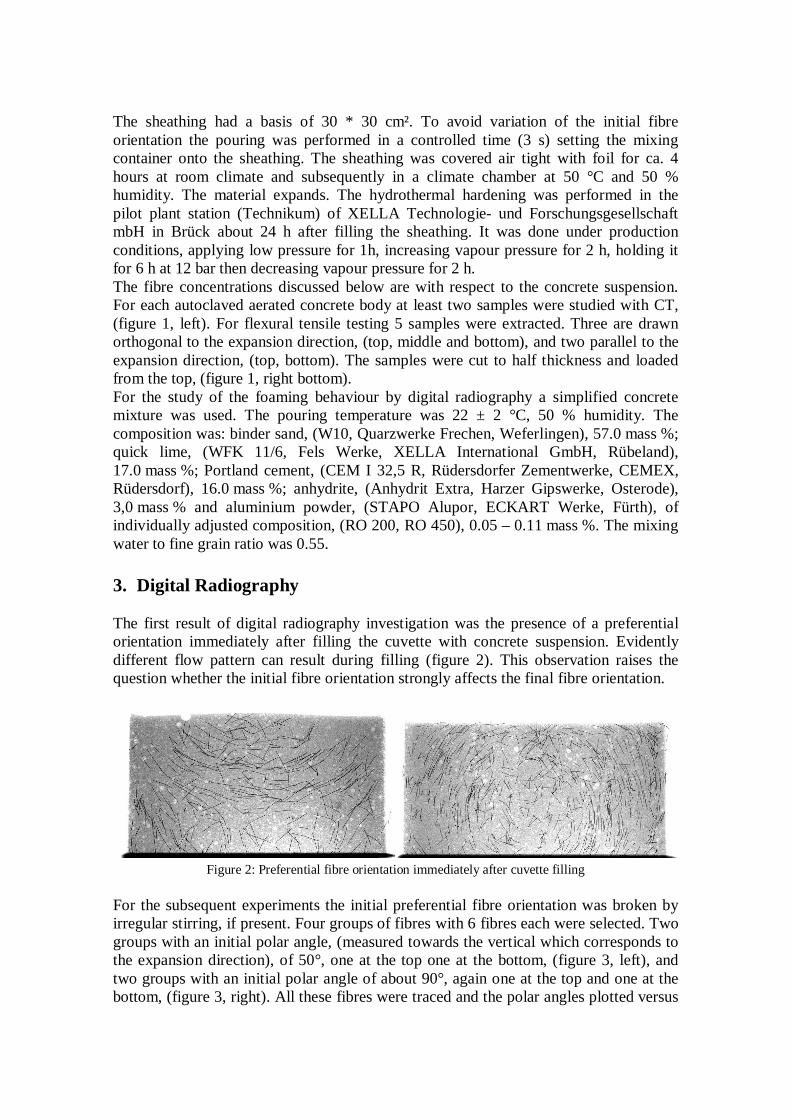
The sheathing had a basis of 30 * 30 cm². To avoid variation of the initial fibre orientation the pouring was performed in a controlled time (3 s) setting the mixing container onto the sheathing. The sheathing was covered air tight with foil for ca. 4 hours at room climate and subsequently in a climate chamber at 50 °C and 50 % humidity. The material expands. The hydrothermal hardening was performed in the pilot plant station (Technikum) of XELLA Technologie- und Forschungsgesellschaft mbH in Brück about 24 h after filling the sheathing. It was done under production conditions, applying low pressure for 1h, increasing vapour pressure for 2 h, holding it for 6 h at 12 bar then decreasing vapour pressure for 2 h. The fibre concentrations discussed below are with respect to the concrete suspension. For each autoclaved aerated concrete body at least two samples were studied with CT, (figure 1, left). For flexural tensile testing 5 samples were extracted. Three are drawn orthogonal to the expansion direction, (top, middle and bottom), and two parallel to the expansion direction, (top, bottom). The samples were cut to half thickness and loaded from the top, (figure 1, right bottom). For the study of the foaming behaviour by digital radiography a simplified concrete mixture was used. The pouring temperature was 22 ± 2 °C, 50 % humidity. The composition was: binder sand, (W10, Quarzwerke Frechen, Weferlingen), 57.0 mass %; quick lime, (WFK 11/6, Fels Werke, XELLA International GmbH, Rübeland), 17.0 mass %; Portland cement, (CEM I 32,5 R, Rüdersdorfer Zementwerke, CEMEX, Rüdersdorf), 16.0 mass %; anhydrite, (Anhydrit Extra, Harzer Gipswerke, Osterode), 3,0 mass % and aluminium powder, (STAPO Alupor, ECKART Werke, Fürth), of individually adjusted composition, (RO 200, RO 450), 0.05 – 0.11 mass %. The mixing water to fine grain ratio was 0.55. 3. Digital Radiography The first result of digital radiography investigation was the presence of a preferential orientation immediately after filling the cuvette with concrete suspension. Evidently different flow pattern can result during filling (figure 2). This observation raises the question whether the initial fibre orientation strongly affects the final fibre orientation.
Figure 2: Preferential fibre orientation immediately after cuvette filling
For the subsequent experiments the initial preferential fibre orientation was broken by irregular stirring, if present. Four groups of fibres with 6 fibres each were selected. Two groups with an initial polar angle, (measured towards the vertical which corresponds to the expansion direction), of 50°, one at the top one at the bottom, (figure 3, left), and two groups with an initial polar angle of about 90°, again one at the top and one at the bottom, (figure 3, right). All these fibres were traced and the polar angles plotted versus
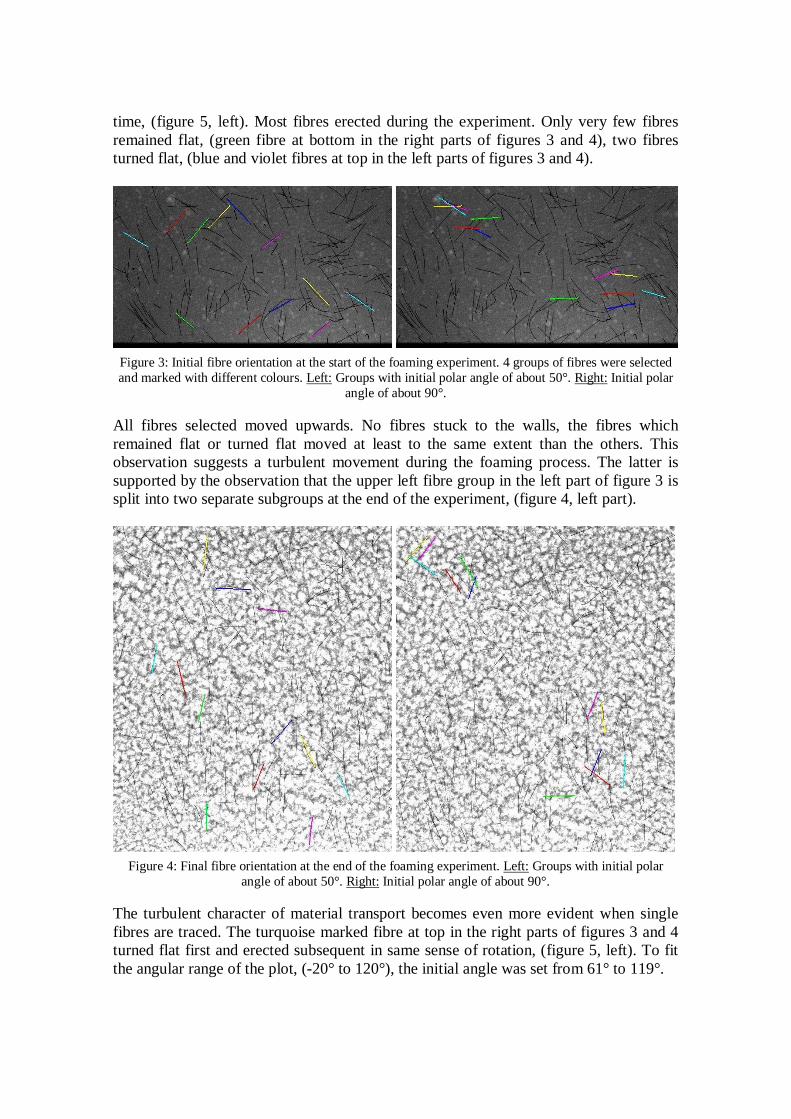
time, (figure 5, left). Most fibres erected during the experiment. Only very few fibres remained flat, (green fibre at bottom in the right parts of figures 3 and 4), two fibres turned flat, (blue and violet fibres at top in the left parts of figures 3 and 4).
Figure 3: Initial fibre orientation at the start of the foaming experiment. 4 groups of fibres were selected and marked with different colours. Left: Groups with initial polar angle of about 50°. Right: Initial polar
angle of about 90°.
All fibres selected moved upwards. No fibres stuck to the walls, the fibres which remained flat or turned flat moved at least to the same extent than the others. This observation suggests a turbulent movement during the foaming process. The latter is supported by the observation that the upper left fibre group in the left part of figure 3 is split into two separate subgroups at the end of the experiment, (figure 4, left part).
Figure 4: Final fibre orientation at the end of the foaming experiment. Left: Groups with initial polar
angle of about 50°. Right: Initial polar angle of about 90°.
The turbulent character of material transport becomes even more evident when single fibres are traced. The turquoise marked fibre at top in the right parts of figures 3 and 4 turned flat first and erected subsequent in same sense of rotation, (figure 5, left). To fit the angular range of the plot, (-20° to 120°), the initial angle was set from 61° to 119°.
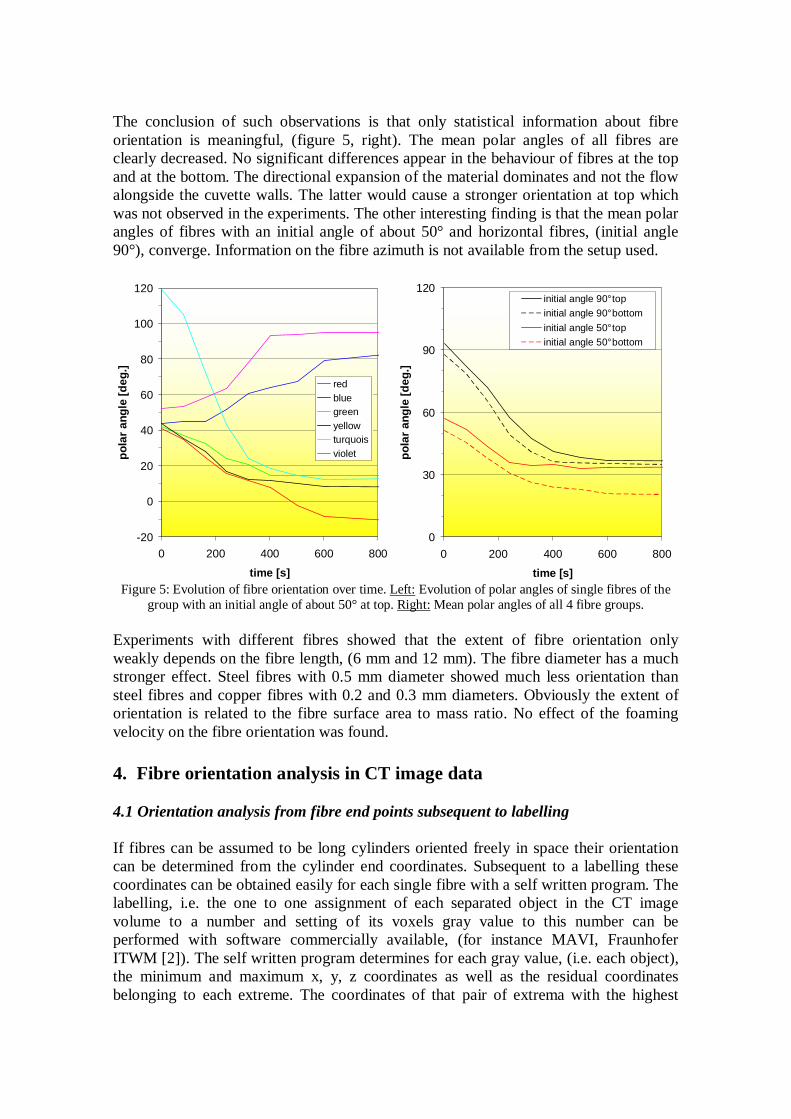
The conclusion of such observations is that only statistical information about fibre orientation is meaningful, (figure 5, right). The mean polar angles of all fibres are clearly decreased. No significant differences appear in the behaviour of fibres at the top and at the bottom. The directional expansion of the material dominates and not the flow alongside the cuvette walls. The latter would cause a stronger orientation at top which was not observed in the experiments. The other interesting finding is that the mean polar angles of fibres with an initial angle of about 50° and horizontal fibres, (initial angle 90°), converge. Information on the fibre azimuth is not available from the setup used.
-20
0
20
40
60
80
100
120
0 200 400 600 800
time [s]
pol
ar a
ngle
[deg
.]
redbluegreenyellowturquoisviolet
0
30
60
90
120
0 200 400 600 800
time [s]
pol
ar a
ngle
[deg
.]
initial angle 90° topinitial angle 90° bottom
initial angle 50° topinitial angle 50° bottom
Figure 5: Evolution of fibre orientation over time. Left: Evolution of polar angles of single fibres of the
group with an initial angle of about 50° at top. Right: Mean polar angles of all 4 fibre groups. Experiments with different fibres showed that the extent of fibre orientation only weakly depends on the fibre length, (6 mm and 12 mm). The fibre diameter has a much stronger effect. Steel fibres with 0.5 mm diameter showed much less orientation than steel fibres and copper fibres with 0.2 and 0.3 mm diameters. Obviously the extent of orientation is related to the fibre surface area to mass ratio. No effect of the foaming velocity on the fibre orientation was found. 4. Fibre orientation analysis in CT image data 4.1 Orientation analysis from fibre end points subsequent to labelling If fibres can be assumed to be long cylinders oriented freely in space their orientation can be determined from the cylinder end coordinates. Subsequent to a labelling these coordinates can be obtained easily for each single fibre with a self written program. The labelling, i.e. the one to one assignment of each separated object in the CT image volume to a number and setting of its voxels gray value to this number can be performed with software commercially available, (for instance MAVI, Fraunhofer ITWM [2]). The self written program determines for each gray value, (i.e. each object), the minimum and maximum x, y, z coordinates as well as the residual coordinates belonging to each extreme. The coordinates of that pair of extrema with the highest
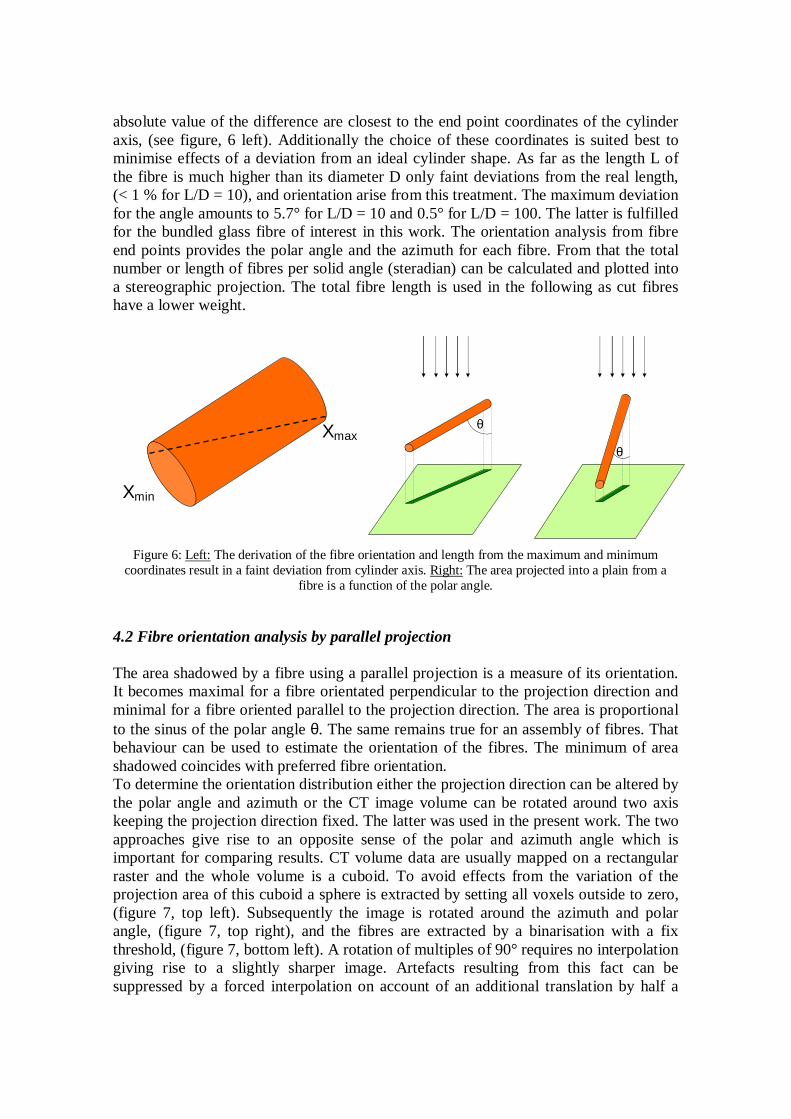
absolute value of the difference are closest to the end point coordinates of the cylinder axis, (see figure, 6 left). Additionally the choice of these coordinates is suited best to minimise effects of a deviation from an ideal cylinder shape. As far as the length L of the fibre is much higher than its diameter D only faint deviations from the real length, (< 1 % for L/D = 10), and orientation arise from this treatment. The maximum deviation for the angle amounts to 5.7° for L/D = 10 and 0.5° for L/D = 100. The latter is fulfilled for the bundled glass fibre of interest in this work. The orientation analysis from fibre end points provides the polar angle and the azimuth for each fibre. From that the total number or length of fibres per solid angle (steradian) can be calculated and plotted into a stereographic projection. The total fibre length is used in the following as cut fibres have a lower weight.
Figure 6: Left: The derivation of the fibre orientation and length from the maximum and minimum
coordinates result in a faint deviation from cylinder axis. Right: The area projected into a plain from a fibre is a function of the polar angle.
4.2 Fibre orientation analysis by parallel projection The area shadowed by a fibre using a parallel projection is a measure of its orientation. It becomes maximal for a fibre orientated perpendicular to the projection direction and minimal for a fibre oriented parallel to the projection direction. The area is proportional to the sinus of the polar angle θ. The same remains true for an assembly of fibres. That behaviour can be used to estimate the orientation of the fibres. The minimum of area shadowed coincides with preferred fibre orientation. To determine the orientation distribution either the projection direction can be altered by the polar angle and azimuth or the CT image volume can be rotated around two axis keeping the projection direction fixed. The latter was used in the present work. The two approaches give rise to an opposite sense of the polar and azimuth angle which is important for comparing results. CT volume data are usually mapped on a rectangular raster and the whole volume is a cuboid. To avoid effects from the variation of the projection area of this cuboid a sphere is extracted by setting all voxels outside to zero, (figure 7, top left). Subsequently the image is rotated around the azimuth and polar angle, (figure 7, top right), and the fibres are extracted by a binarisation with a fix threshold, (figure 7, bottom left). A rotation of multiples of 90° requires no interpolation giving rise to a slightly sharper image. Artefacts resulting from this fact can be suppressed by a forced interpolation on account of an additional translation by half a
Xmax
Xmin
θ
θ

voxel length along each axis. The image is projected along the z-axis into the x-y-plane by summing up all voxels with same the x and y position. Subsequently the voxels with a value of zero are counted. For each combination of polar angle and azimuth the normalised number of zero valued voxels is plotted into a stereographic projection, (figure 8, right). As the sense of the rotation angles is opposite to the polar angle and azimuth of a fibre and the endpoints of a fibre are exchangeable the latter can be derived by maintaining the polar angle and calculating the azimuth from the azimuthal rotation angle φ as 360° - φ + 180°, (where values exceeding 360° have to be reduced by 360°).
Figure 7: Top left: All voxels outside a sphere are set to zero, fibres, (voxels with a gray value > 80), are marked red. Top right: CT volume rotated by the azimuth and polar angle. Bottom left: Binarised data, (voxels > 80), from a rotated CT volume. Bottom right: Fibres projected along the z axis into the x-y-
plane binarised with a value of 1. The black pixels are a measure of orientation.

4.3 Comparison of both methods The projection method gives no sharp optimum of orientation due to the sin θ dependance of the shaded area. This can clearly be shown for model data of parallel ideal fibres tilted by 45° to the normal with an azimuth of 135°, (Figure 8). The preferred orientation is easy to determine using the projection method. A quantitative analysis of fibre orientation is difficult. The main advantage is that no segmentation of fibres is required. Furthermore, no assumptions about the fibres are needed, making the method universally applicable as far as the gray value of fibres allows a threshold operation to select mainly fibre material. Length and shape of fibres do not influence the analysis. For high fibre concentrations either the analysis of small partial volumes can be required to get enough pixels with a value of zero. Alternatively the counting of pixels with values below a certain threshold, (i.e. pixel shadowed by only few fibres), could give good results.
Figure 8: Left: 3D view of the model fibre dataset. Right: Orientation distribution of the model dataset derived by projection. The normalised number of zero valued pixels in the projection is plotted into a
stereographic projection. The azimuth is plotted circumferential, the polar angle radial. If a segmentation of fibres is possible and fibres are rod like the other method of orientation analysis is more suitable. Commercial software, (MAVI, Fraunhofer ITWM [2]), needs less than 1 min for the labelling of a CT volume of 500 * 500 * 500 voxels. This method is much faster than the projection method. The subsequent analysis of fibre orientation from the end point coordinates needs even less time. Moreover this method gives additional information about the centre of mass, length and other fibre features and the fibre orientation distribution shows much more detail, (figure 9). A total of 19 samples with fibre concentrations ranging from 0.5 vol.% to 2.0 vol.%, (with respect to the initial concrete suspension), are studied, three with steel fibres and 16 with bundled glass fibre of different lengths, (6 mm and 12 mm). The fibre orientation distribution was analysed using both methods. The maximums of the distribution were largely the same, (figure 9).

Figure 9: Stereographic projection of the orientation distribution of the upper sample with 1.5 vol.%
bundled glass fibres, (6 mm). Left: Derived from fibre end points. Right: Derived by projection. 5. Results of fibre orientation in autoclaved aerated concrete
All samples studied exhibit a distinct preferential fibre orientation. The three samples with steel fibres show a maximum of the orientation distribution deviating by less than 20° from the vertical, (i.e. expansion direction). Some samples reinforced with bundled glass fibres show stronger deviations of up to 40°, (figure 11, left).
Figure 10: Stereographic projection of the orientation distribution derived from the fibre end points. Left: Lower sample with 0.5 vol.% 6 mm fibres. Right: Lower sample with 1.5 vol.% 6 mm fibres
Four samples show a preferred fibre orientation with deviations more than 30° from the vertical, whereas 11 samples show a fibre orientation maximum deviation less than 20° from the vertical. The orientation distribution of some samples show distinct side maxima which are separated by more than 20° in 4 samples, (figure 10, left). Only five samples out of the 16 samples studied have a comparable tight fibre orientation distribution like the sample with 1.5 vol.% of 6 mm fibres, (figure 10, right), which is centred within 20° to the vertical. The broadest orientation distributions, (each
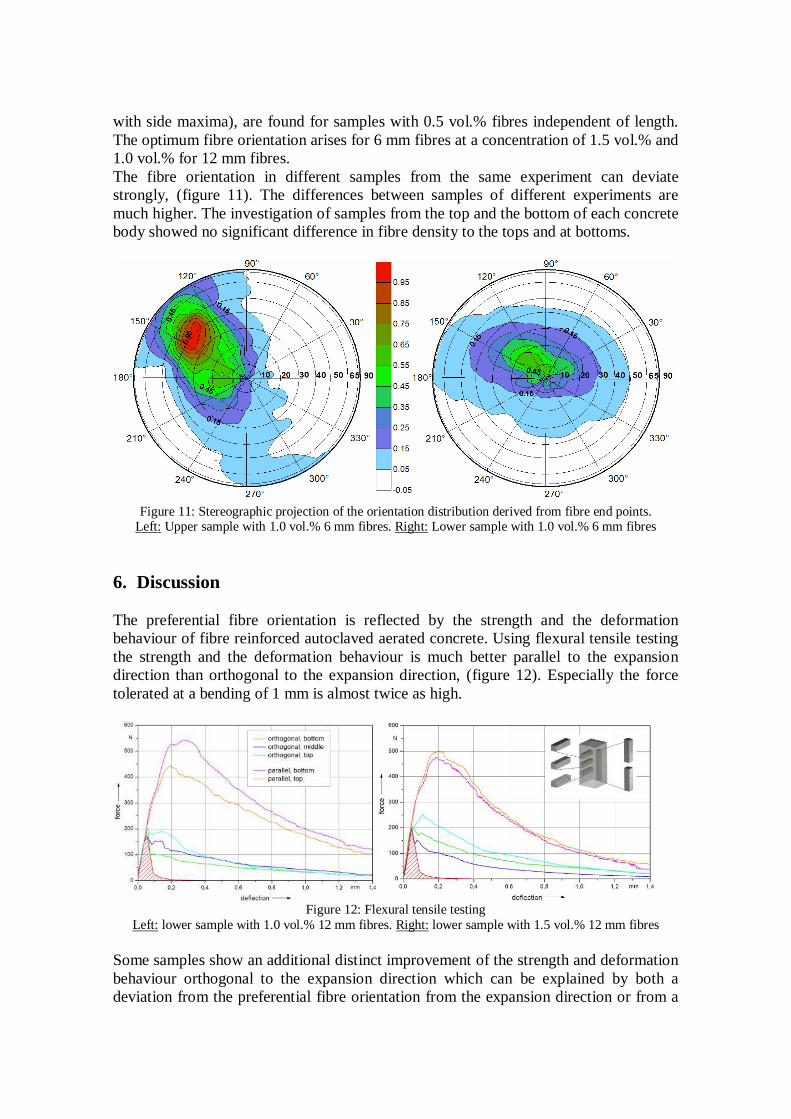
with side maxima), are found for samples with 0.5 vol.% fibres independent of length. The optimum fibre orientation arises for 6 mm fibres at a concentration of 1.5 vol.% and 1.0 vol.% for 12 mm fibres. The fibre orientation in different samples from the same experiment can deviate strongly, (figure 11). The differences between samples of different experiments are much higher. The investigation of samples from the top and the bottom of each concrete body showed no significant difference in fibre density to the tops and at bottoms.
Figure 11: Stereographic projection of the orientation distribution derived from fibre end points. Left: Upper sample with 1.0 vol.% 6 mm fibres. Right: Lower sample with 1.0 vol.% 6 mm fibres
6. Discussion
The preferential fibre orientation is reflected by the strength and the deformation behaviour of fibre reinforced autoclaved aerated concrete. Using flexural tensile testing the strength and the deformation behaviour is much better parallel to the expansion direction than orthogonal to the expansion direction, (figure 12). Especially the force tolerated at a bending of 1 mm is almost twice as high.
Figure 12: Flexural tensile testing
Left: lower sample with 1.0 vol.% 12 mm fibres. Right: lower sample with 1.5 vol.% 12 mm fibres Some samples show an additional distinct improvement of the strength and deformation behaviour orthogonal to the expansion direction which can be explained by both a deviation from the preferential fibre orientation from the expansion direction or from a

broad orientation distribution. This becomes evident from the fact that samples orthogonal to the expansion direction from an experiment with a wider distributed fibre orientation, (figure 13, right), show a better strength and deformation behaviour, (figure 12, right), than those from an experiment with better orientation. On the contrary, the samples parallel to the expansion direction show a better strength and deformation behaviour for the sample with better orientation even when the fibre concentration is lower.
Figure 13: Stereographic projection of the orientation distribution derived from fibre end points. Left: lower sample with 1.0 vol.% 12 mm fibres. Right: lower sample with 1.5 vol.% 12 mm fibres
A compression strength increasing parallel to the expansion direction was found in addition to the improved flexural tensile strength. To understand this finding, a smaller sample was studied with higher resolution, (12.3 µm voxel size, 40 kV acceleration voltage 200 µA tube current, no pre filtering). Five isolated fibres were selected and the subvolumes containing the fibres were orientated parallel to the fibre axis. The fibre voxels, (gray value > 65), were set to the mean concrete gray value (65). Subsequently the gray values were integrated along the fibre axis, (figure 14, left).
Figure 14: Left: Fibre surrounding integrated over 410 CT-slices. The bar represents 1 mm. The bright patches in the centre and at the edge are fibres. Right: Mean gray value as a function of radial density,
(average of 5 fibres).
A region of increased material density around the fibres was detected. Obviously the macro pores are aligned by the fibre due to the action of surface tension during the foaming of the concrete. A plot of the mean gray value as a function of radial distance
20
30
40
50
60
70
0,0 0,2 0,4 0,6 0,8 1,0 1,2radial distance [mm]
gra
y va
lue

from the fibre centre shows first a region of increased gray value, (corresponding to an increased density), followed by a minimum at about 0.95 mm radial distance associated with the centres of a ring of macro pores surrounding the fibres, (figure 14, right). The rise of gray value with further increasing distance is related to the next fibre coordination. The alignment of macro pores results in rods of higher density which can account for the increased compression strength. The findings on the influence of the fibre orientation on the flexural tensile strength allow for a specific optimisation of the fibre reinforced autoclaved aerated concrete. If a higher maximal strength in one direction is required a sharp orientation distribution is desirable. For an isotropic strengthening an orientation distribution as broad as possible is desired. Acknowledgements The authors thank XELLA Technologie- und Forschungsgesellschaft mbH, (Technologie- und Forschungszentrum Brück, Gregor-von-Brück-Ring 9A, 14822 Brück), for the support in sample preparation, (hydrothermal hardening), and the supply of materials for the experiments. References 1. Ronny Stadie, 'Festigkeits- und Verformungsverhalten von kurzfaserverstärktem
Porenbeton', Dissertation, work in progress, TU Berlin, presumably 2007. 2. Fraunhofer Institut für Techno- und Wirtschaftsmathematik, MAVI - Modulare
Algorithmen für Volumenbilder, Fraunhofer-Platz 1, 67663 Kaiserslautern, Germany, http://www.itwm.fhg.de/mab/projects/MAVI/MAVI_Manual.pdf.