Embed Size (px)
Citation preview

Fracture Mechanics of Concrete and Concrete Structures -High Performance, Fiber Reinforced Concrete, Special Loadings and Structural Applications- B. H. Oh, et al. (eds)
ⓒ 2010 Korea Concrete Institute, ISBN 978-89-5708-182-2
Fiber reinforced concrete characterization through round panel test - Part II: analytical and numerical study
F. Minelli & G.A. Plizzari University of Brescia, Italy ABSTRACT: The round determinate panel according to ASTM was found to be a reliable, consistent and re-peatable test method for the measurement of the energy absorption in Fiber Reinforced Concrete (FRC) com-posites. A smaller panel was proposed and experimentally investigated by the authors in the Part I of the pre-sent paper. The results of several tests on about 100 round panels (ASTM and small panels) evidenced a lower scatter, as in the larger ASTM panels, with significant advantages. In fact, small round panels are easier to place and handle and their weight is only 40 kg, if compared to the 91 kg of the ASTM panel. Given this broad experimental database, an analytical approach is herein reported toward the definition of a suitable simplified cohesive stress-crack width constitutive law for FRC, determined from round panel tests according to the re-quirements of the main structural codes. To this aim, crack development was measured during the tests. In ad-dition, a kinematic approach was proposed to determine the constitutive laws from the load point displacement of the slab.
1 INTRODUCTION
A standardized Round Determinate Panel (RDP) test is nowadays available and published by ASTM (2004) for the measurements of the energy absorp-tion at 40 mm displacement, for characterizing Fiber Reinforced Concrete (FRC) elements with special emphasis on sprayed concrete in tunneling applica-tions. It is a statically determinate test, with round shape slab having a diameter (φ) of 800 mm and a thickness of 75 mm, supported in three points at 120 degrees. The standard test is rather straightforward and only requires load and displacement measure-ment. The specimen weight is 91 kg.
In the first part of this investigation, the authors demonstrated that a smaller round panel with a di-ameter of 600 mm and a thickness of 60 mm is char-acterized by a similar scatter in results, which is much lower compared to the classical tests on small notched beams (Minelli & Plizzari 2007 and 2009). Moreover, the three crack measurements could be also included in the test, as the crack pattern is re-peatable and predictable; therefore, the post-cracking material properties can be adequately determined. In addition, handling and placing such a specimen is easier as compared to the classical panel since its weight is only 40 kg. Finally, standard servo-controlled loading machines generally fit with the ge-ometry of the small panel, allowing for a proper crack controlled tests with a close-loop system.
In order to use this test procedure for characteriz-ing FRC, which means determining fracture proper-
ties such as toughness indexes, residual post cracking strengths and equivalent post-cracking stresses, one should be able to find sufficient information from the experiments. The procedures adopted in many stan-dards for beam tests (UNI 2003, RILEM 2003 & CEN 2005) are based on the determination of a stress-crack width curve, in which: -the stress can be derived from theory of elasticity, i.e. the flexural stress is just the moment over the re-sistance modulus. This is a rather rough simplifica-tion but it allows for the definition of suitable post-cracking strengths or toughness indexes without any non-linear analysis, which is difficult to perform; -the crack width is measured and monitored (Crack Tip Opening Displacement – CTOD), especially while dealing with notched beams.
Stresses causing cracks (i.e. normal stresses along the crack line) and crack width records are therefore needed if the procedure well recognized for beams is to be transferred to round panels.
The virtual energy-based yield line method (Jo-hansen 1972) in which the uniaxial flexural capacity of the material upon cracking is used together with an assumed pattern of failure to predict the point load capacity, might be also used to determine a sim-ple crack width as a function of the point load dis-placement (Bernard 2000, 2002 and 2006). How-ever, the yield line method was originally developed for nominally plastic materials; therefore, its applica-tion for the prediction of load capacity in structures made of lightly reinforced concrete exhibiting brittle behavior might be questionable.

The present investigation focuses on the applica-bility of round panel tests in defining a simplified and easy-to-use constitutive law for FRC material. Nu-merical elastic analyses and yield line method will be both utilized to this aim. In particular, the latter ap-proach will be examined and evaluated as far as the prediction of cracking is concerned and compared against the experimental results.
2 ANALYTICAL STUDY
As diffusely reported in Part I of this paper, more than 100 experiments on round panels were carried out in the last 4 years at the University of Brescia. Based on this broad experimentation, an analytical model was then developed to the aim of: -determining local stress-crack opening cohesive law from round panels, similarly to the procedure well acknowledged for beams; -defining suitable equivalent post-cracking strength directly from panel tests, in the same way as for beam tests.
First of all, appropriate general relations, accord-ing to the thin plate theory, were determined for de-scribing the maximum tangential stress (as well as the radial and tangential stress pattern, as shown in Fig. 1 and Fig. 2) and the displacement at the load point. An elastic finite element analysis, through the com-mercial software STRAUS7 (2004) with two dimen-sional elements (plates) was performed with the fol-lowing results:
2001816.0t
DPt
⋅=σ (1)
3
3
000429.0tEDP
RPS ⋅⋅=η (2)
where P is the external load in the center (a unit load of 10 kN was applied), D is the diameter of the panel measured from the supports (550 mm in the case of small round panel), t is the panel thickness (60 mm), E and ν are Young’s and Poisson’s modulus of con-crete, respectively. All units are defined according to SI unit system.
The elastic analysis was also able to predict the distribution of radial and tangential stresses along the line of crack formation (i.e., the radial bisector be-tween each pair of pivot supports), as depicted in Figure 3. Note that the elastic solution is an easy-to-use tool that allows a simplified calculation of the equivalent post-cracking strength being feasible for practical and design applications, in the same way as it is done for beam tests.
The results show that the peak tensile stresses oc-cur near the loading point and a broad area of
Figure 1. radial stresses σr on a small round panel, elastic analysis with FE program Straus7 (2004).
Figure 2. tangential stresses σt on a small round panel, elastic analysis with FE program Straus7 (2004).
0.0
0.2
0.4
0.6
0.8
1.0
1.2
0 50 100 150 200 250 300
Str
ess
σr /σ
r,max
and
σt/σ
t,max
[MP
a]
Radial Coordinate r [mm]
Comparison distribution σr(r)/σr,max-σt(r)/σt,max, Small Round Panel
Serie1Serie1
y
z
xs t(r)s r(r)r
t
Support Point
Figure 3. Elastic radial and tangential stresses along the line of crack formation (radial coordinate).
heightened tensile stress arose along the crack line. While the radial and tangential stresses have the same magnitude at the center, they diverge toward the edge of the panel along each radial bisector, the ra-
Proceedings of FraMCoS-7, May 23-28, 2010
hThD ∇−= ),(J (1)
The proportionality coefficient D(h,T) is called moisture permeability and it is a nonlinear function of the relative humidity h and temperature T (Bažant & Najjar 1972). The moisture mass balance requires that the variation in time of the water mass per unit volume of concrete (water content w) be equal to the divergence of the moisture flux J
J•∇=∂
∂−
t
w (2)
The water content w can be expressed as the sum
of the evaporable water we (capillary water, water vapor, and adsorbed water) and the non-evaporable (chemically bound) water wn (Mills 1966, Pantazopoulo & Mills 1995). It is reasonable to assume that the evaporable water is a function of relative humidity, h, degree of hydration, αc, and degree of silica fume reaction, αs, i.e. we=we(h,αc,αs) = age-dependent sorption/desorption isotherm (Norling Mjonell 1997). Under this assumption and by substituting Equation 1 into Equation 2 one obtains
nscw
s
ew
c
ew
hh
Dt
h
h
ew
&&& ++∂
∂
∂
∂
=∇•∇+∂
∂
∂
∂
− αα
αα
)(
(3)
where ∂we/∂h is the slope of the sorption/desorption isotherm (also called moisture capacity). The governing equation (Equation 3) must be completed by appropriate boundary and initial conditions.
The relation between the amount of evaporable water and relative humidity is called ‘‘adsorption isotherm” if measured with increasing relativity humidity and ‘‘desorption isotherm” in the opposite case. Neglecting their difference (Xi et al. 1994), in the following, ‘‘sorption isotherm” will be used with reference to both sorption and desorption conditions. By the way, if the hysteresis of the moisture isotherm would be taken into account, two different relation, evaporable water vs relative humidity, must be used according to the sign of the variation of the relativity humidity. The shape of the sorption isotherm for HPC is influenced by many parameters, especially those that influence extent and rate of the chemical reactions and, in turn, determine pore structure and pore size distribution (water-to-cement ratio, cement chemical composition, SF content, curing time and method, temperature, mix additives, etc.). In the literature various formulations can be found to describe the sorption isotherm of normal concrete (Xi et al. 1994). However, in the present paper the semi-empirical expression proposed by Norling Mjornell (1997) is adopted because it
explicitly accounts for the evolution of hydration reaction and SF content. This sorption isotherm reads
( ) ( )( )
( ) ( )⎥⎥
⎦
⎤
⎢⎢
⎣
⎡
⎥⎥⎥
⎦
⎤
⎢⎢⎢
⎣
⎡
−
−∞
+
−∞
−=
1110
,1
110
11,
1,,
hcc
ge
scK
hcc
ge
scG
sch
ew
αα
αα
αα
αααα
(4)
where the first term (gel isotherm) represents the physically bound (adsorbed) water and the second term (capillary isotherm) represents the capillary water. This expression is valid only for low content of SF. The coefficient G1 represents the amount of water per unit volume held in the gel pores at 100% relative humidity, and it can be expressed (Norling Mjornell 1997) as
( ) ss
s
vgkc
c
c
vgk
scG αααα +=,1
(5)
where k
cvg and k
svg are material parameters. From the
maximum amount of water per unit volume that can fill all pores (both capillary pores and gel pores), one can calculate K1 as one obtains
( )1
110
110
11
22.0188.00
,1
−⎟⎠
⎞⎜⎝
⎛−∞
⎥⎥⎥
⎦
⎤
⎢⎢⎢
⎣
⎡⎟⎠
⎞⎜⎝
⎛−∞
−−+−
=
hcc
ge
hcc
geGs
ssc
w
scK
αα
αα
αα
αα
(6)
The material parameters k
cvg and k
svg and g1 can
be calibrated by fitting experimental data relevant to free (evaporable) water content in concrete at various ages (Di Luzio & Cusatis 2009b).
2.2 Temperature evolution
Note that, at early age, since the chemical reactions associated with cement hydration and SF reaction are exothermic, the temperature field is not uniform for non-adiabatic systems even if the environmental temperature is constant. Heat conduction can be described in concrete, at least for temperature not exceeding 100°C (Bažant & Kaplan 1996), by Fourier’s law, which reads
T∇−= λq (7)
where q is the heat flux, T is the absolute temperature, and λ is the heat conductivity; in this

dial stress dropping to zero for meeting the boundary condition at the edge (see also Bernard 2006).
By using the above equations for the determina-tion of the local tangential maximum tensile stress along the yield line, it is possible to come up with a σ-w cohesive law and compare it with those deter-mined from beam tests, whereby w defines the ex-perimental measured crack widths.
As an alternative, without direct measurement of the crack width, a kinematic approach based on the yield line theory (more properly defined as virtual en-ergy-based yield line method, Johansen 1972) could be adopted to calculate the crack width, as also done by Bernard (2002), Tran et al. (2001) and Lam-brechts (2004). In a yield line analysis of a round panel, the governing mode of failure is taken to com-prise three symmetrical yield lines-cracks emanating from the center of the face opposite the point load and running radially to the edge while bisecting each sector between adjacent pivot supports.
P
B
CQ
Zero Displacement Hinge Line
Pivot Lines
Central Load Point
Yeld Line
Support Pivot
Figure 4. Yield Line Approach for the determination of crack width.
The crack width was experimentally measured at a
distance from the point load of 120 mm (point Q in Fig. 4). Based on geometry consideration, it can be written that:
QRPS
BQBCδη
= (3)
where CQ=120 mm (in the present experiments) whereas B is the zero displacement point, ηRPS and δQ are the vertical displacements at points C and Q, re-spectively. From trigonometry, one can derive that:
⇒=QRPS
BQrδη
2⎟⎠⎞
⎜⎝⎛⋅=
rBQ RPS
Q 2ηδ
(4)
with r =275 mm. The rotation at the support αP is equal to:
PQPQ ⋅= αδ (5) By substituting PQ and δq one can obtain:
32BQ
rBQ P
RPS ⋅=⎟⎠⎞
⎜⎝⎛⋅ αη (6)
The rotation at the support P therefore yields:
rRPS
Pηα
23= (7)
The rotation in Q, at the point of experimental
crack measurement, can be derived as:
rRPS
PRPSηαϕ ⋅=⋅= 32 (8)
The corresponding bottom crack opening (Fig. 5)
is therefore given by:
⎟⎟⎠
⎞⎜⎜⎝
⎛⋅=⎟
⎠⎞
⎜⎝⎛⋅=
rtgttgtw RPSRPS
mηϕ
232
22 (9)
where r is the radius (r = 275 mm) and t is the panel thickness (t = 60 mm).
It is worth noticing that the crack opening ob-tained using Equation 9 is constant along the radius, for a given value of panel displacement. However, in the actual case, the crack width will increase from the external surface to the load point.
2t tg( /2)
/2
t
Figure 5. 3D representation of the failure mode of a round panel (a) (Bernard, 2006). Crack width, bottom surface of a round panel (b).
Figure 6 shows the comparison between experi-
mental and analytical crack width: the experimental curve was calculated from a linear regression of all test results available. It is a bilinear curve, with a first constant line with zero crack representing the un-cracked phase, in which the vertical displacement in-creases prior to cracking (up to a value of around η0=0.54-0.63 mm, in which the lowest value is ap-propriate for normal strength concretes while the highest is more suitable for high strength concretes), and a second linear branch, showing a quite good fit-ting of the experiments (R2=0.99). The difference be-tween the two curves (with the experimental showing
Proceedings of FraMCoS-7, May 23-28, 2010
hThD ∇−= ),(J (1)
The proportionality coefficient D(h,T) is called moisture permeability and it is a nonlinear function of the relative humidity h and temperature T (Bažant & Najjar 1972). The moisture mass balance requires that the variation in time of the water mass per unit volume of concrete (water content w) be equal to the divergence of the moisture flux J
J•∇=∂
∂−
t
w (2)
The water content w can be expressed as the sum
of the evaporable water we (capillary water, water vapor, and adsorbed water) and the non-evaporable (chemically bound) water wn (Mills 1966, Pantazopoulo & Mills 1995). It is reasonable to assume that the evaporable water is a function of relative humidity, h, degree of hydration, αc, and degree of silica fume reaction, αs, i.e. we=we(h,αc,αs) = age-dependent sorption/desorption isotherm (Norling Mjonell 1997). Under this assumption and by substituting Equation 1 into Equation 2 one obtains
nscw
s
ew
c
ew
hh
Dt
h
h
ew
&&& ++∂
∂
∂
∂
=∇•∇+∂
∂
∂
∂
− αα
αα
)(
(3)
where ∂we/∂h is the slope of the sorption/desorption isotherm (also called moisture capacity). The governing equation (Equation 3) must be completed by appropriate boundary and initial conditions.
The relation between the amount of evaporable water and relative humidity is called ‘‘adsorption isotherm” if measured with increasing relativity humidity and ‘‘desorption isotherm” in the opposite case. Neglecting their difference (Xi et al. 1994), in the following, ‘‘sorption isotherm” will be used with reference to both sorption and desorption conditions. By the way, if the hysteresis of the moisture isotherm would be taken into account, two different relation, evaporable water vs relative humidity, must be used according to the sign of the variation of the relativity humidity. The shape of the sorption isotherm for HPC is influenced by many parameters, especially those that influence extent and rate of the chemical reactions and, in turn, determine pore structure and pore size distribution (water-to-cement ratio, cement chemical composition, SF content, curing time and method, temperature, mix additives, etc.). In the literature various formulations can be found to describe the sorption isotherm of normal concrete (Xi et al. 1994). However, in the present paper the semi-empirical expression proposed by Norling Mjornell (1997) is adopted because it
explicitly accounts for the evolution of hydration reaction and SF content. This sorption isotherm reads
( ) ( )( )
( ) ( )⎥⎥
⎦
⎤
⎢⎢
⎣
⎡
⎥⎥⎥
⎦
⎤
⎢⎢⎢
⎣
⎡
−
−∞
+
−∞
−=
1110
,1
110
11,
1,,
hcc
ge
scK
hcc
ge
scG
sch
ew
αα
αα
αα
αααα
(4)
where the first term (gel isotherm) represents the physically bound (adsorbed) water and the second term (capillary isotherm) represents the capillary water. This expression is valid only for low content of SF. The coefficient G1 represents the amount of water per unit volume held in the gel pores at 100% relative humidity, and it can be expressed (Norling Mjornell 1997) as
( ) ss
s
vgkc
c
c
vgk
scG αααα +=,1
(5)
where k
cvg and k
svg are material parameters. From the
maximum amount of water per unit volume that can fill all pores (both capillary pores and gel pores), one can calculate K1 as one obtains
( )1
110
110
11
22.0188.00
,1
−⎟⎠
⎞⎜⎝
⎛−∞
⎥⎥⎥
⎦
⎤
⎢⎢⎢
⎣
⎡⎟⎠
⎞⎜⎝
⎛−∞
−−+−
=
hcc
ge
hcc
geGs
ssc
w
scK
αα
αα
αα
αα
(6)
The material parameters k
cvg and k
svg and g1 can
be calibrated by fitting experimental data relevant to free (evaporable) water content in concrete at various ages (Di Luzio & Cusatis 2009b).
2.2 Temperature evolution
Note that, at early age, since the chemical reactions associated with cement hydration and SF reaction are exothermic, the temperature field is not uniform for non-adiabatic systems even if the environmental temperature is constant. Heat conduction can be described in concrete, at least for temperature not exceeding 100°C (Bažant & Kaplan 1996), by Fourier’s law, which reads
T∇−= λq (7)
where q is the heat flux, T is the absolute temperature, and λ is the heat conductivity; in this
larger cracks for the same vertical displacement) is probably due to the fact that a little elastic deforma-tion is always measured by the LVDTs in the ex-periments (150 mm gauge length) and, most impor-tantly, their location is at 120 mm from the load point, while the yield line theory would match better with a measurement at r/2 from the load point (i.e., 137.5 mm).
Figure 6. Crack width at bottom surface of a small round panel.
This procedure allows for the definition of a con-
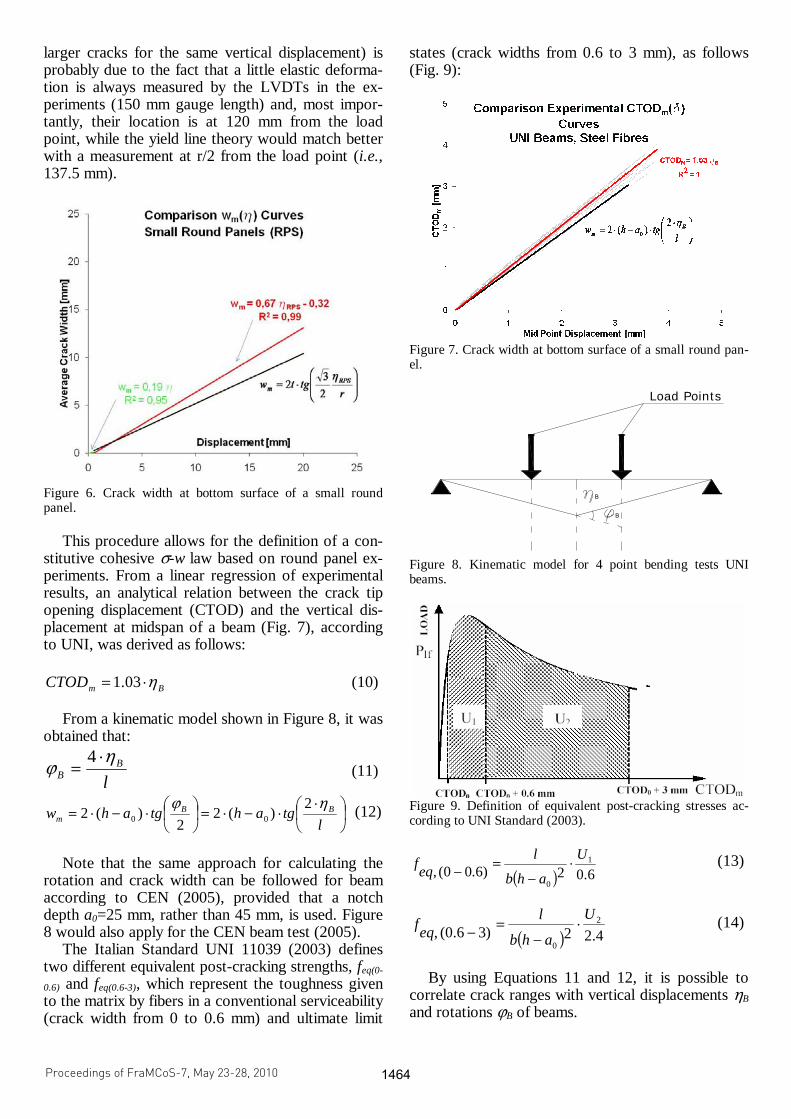
stitutive cohesive σ-w law based on round panel ex-periments. From a linear regression of experimental results, an analytical relation between the crack tip opening displacement (CTOD) and the vertical dis-placement at midspan of a beam (Fig. 7), according to UNI, was derived as follows:
BmCTOD η⋅= 03.1 (10)
From a kinematic model shown in Figure 8, it was
obtained that:
lB
Bηϕ ⋅
=4
(11)
⎟⎠⎞
⎜⎝⎛ ⋅
⋅−⋅=⎟⎠⎞
⎜⎝⎛⋅−⋅=
ltgahtgahw BB
mηϕ 2
)(22
)(2 00 (12)
Note that the same approach for calculating the
rotation and crack width can be followed for beam according to CEN (2005), provided that a notch depth a0=25 mm, rather than 45 mm, is used. Figure 8 would also apply for the CEN beam test (2005).
The Italian Standard UNI 11039 (2003) defines two different equivalent post-cracking strengths, feq(0-
0.6) and feq(0.6-3), which represent the toughness given to the matrix by fibers in a conventional serviceability (crack width from 0 to 0.6 mm) and ultimate limit
states (crack widths from 0.6 to 3 mm), as follows (Fig. 9):
Figure 7. Crack width at bottom surface of a small round pan-el.
Load Points
B
B
Figure 8. Kinematic model for 4 point bending tests UNI beams.
Figure 9. Definition of equivalent post-cracking stresses ac-cording to UNI Standard (2003).
( ) 6.02)6.00(,1
0
U
ahb
leqf ⋅
−=−
(13)
( ) 4.22)36.0(,2
0
U
ahb
leqf ⋅
−=− (14)
By using Equations 11 and 12, it is possible to
correlate crack ranges with vertical displacements ηB and rotations ϕB of beams.
Proceedings of FraMCoS-7, May 23-28, 2010
hThD ∇−= ),(J (1)
The proportionality coefficient D(h,T) is called moisture permeability and it is a nonlinear function of the relative humidity h and temperature T (Bažant & Najjar 1972). The moisture mass balance requires that the variation in time of the water mass per unit volume of concrete (water content w) be equal to the divergence of the moisture flux J
J•∇=∂
∂−
t
w (2)
The water content w can be expressed as the sum
of the evaporable water we (capillary water, water vapor, and adsorbed water) and the non-evaporable (chemically bound) water wn (Mills 1966, Pantazopoulo & Mills 1995). It is reasonable to assume that the evaporable water is a function of relative humidity, h, degree of hydration, αc, and degree of silica fume reaction, αs, i.e. we=we(h,αc,αs) = age-dependent sorption/desorption isotherm (Norling Mjonell 1997). Under this assumption and by substituting Equation 1 into Equation 2 one obtains
nscw
s
ew
c
ew
hh
Dt
h
h
ew
&&& ++∂
∂
∂
∂
=∇•∇+∂
∂
∂
∂
− αα
αα
)(
(3)
where ∂we/∂h is the slope of the sorption/desorption isotherm (also called moisture capacity). The governing equation (Equation 3) must be completed by appropriate boundary and initial conditions.
The relation between the amount of evaporable water and relative humidity is called ‘‘adsorption isotherm” if measured with increasing relativity humidity and ‘‘desorption isotherm” in the opposite case. Neglecting their difference (Xi et al. 1994), in the following, ‘‘sorption isotherm” will be used with reference to both sorption and desorption conditions. By the way, if the hysteresis of the moisture isotherm would be taken into account, two different relation, evaporable water vs relative humidity, must be used according to the sign of the variation of the relativity humidity. The shape of the sorption isotherm for HPC is influenced by many parameters, especially those that influence extent and rate of the chemical reactions and, in turn, determine pore structure and pore size distribution (water-to-cement ratio, cement chemical composition, SF content, curing time and method, temperature, mix additives, etc.). In the literature various formulations can be found to describe the sorption isotherm of normal concrete (Xi et al. 1994). However, in the present paper the semi-empirical expression proposed by Norling Mjornell (1997) is adopted because it
explicitly accounts for the evolution of hydration reaction and SF content. This sorption isotherm reads
( ) ( )( )
( ) ( )⎥⎥
⎦
⎤
⎢⎢
⎣
⎡
⎥⎥⎥
⎦
⎤
⎢⎢⎢
⎣
⎡
−
−∞
+
−∞
−=
1110
,1
110
11,
1,,
hcc
ge
scK
hcc
ge
scG
sch
ew
αα
αα
αα
αααα
(4)
where the first term (gel isotherm) represents the physically bound (adsorbed) water and the second term (capillary isotherm) represents the capillary water. This expression is valid only for low content of SF. The coefficient G1 represents the amount of water per unit volume held in the gel pores at 100% relative humidity, and it can be expressed (Norling Mjornell 1997) as
( ) ss
s
vgkc
c
c
vgk
scG αααα +=,1
(5)
where k
cvg and k
svg are material parameters. From the
maximum amount of water per unit volume that can fill all pores (both capillary pores and gel pores), one can calculate K1 as one obtains
( )1
110
110
11
22.0188.00
,1
−⎟⎠
⎞⎜⎝
⎛−∞
⎥⎥⎥
⎦
⎤
⎢⎢⎢
⎣
⎡⎟⎠
⎞⎜⎝
⎛−∞
−−+−
=
hcc
ge
hcc
geGs
ssc
w
scK
αα
αα
αα
αα
(6)
The material parameters k
cvg and k
svg and g1 can
be calibrated by fitting experimental data relevant to free (evaporable) water content in concrete at various ages (Di Luzio & Cusatis 2009b).
2.2 Temperature evolution
Note that, at early age, since the chemical reactions associated with cement hydration and SF reaction are exothermic, the temperature field is not uniform for non-adiabatic systems even if the environmental temperature is constant. Heat conduction can be described in concrete, at least for temperature not exceeding 100°C (Bažant & Kaplan 1996), by Fourier’s law, which reads
T∇−= λq (7)
where q is the heat flux, T is the absolute temperature, and λ is the heat conductivity; in this

Table 1. Midspan displacements and rotations corresponding to the CTODm defined by the UNI standard 11039 (2003).
CTODm [mm]
ηB [mm] ϕB
0.6 0.58 0.052 3 2.91 0.0259
For round panels, it was experimentally found that (Fig. 6):
32.067.0 −⋅= RPSmw η (15)
By imposing the rotation of round panels to be
equal to the one of beams, according to the yield line theory, using Equation 8 one can first determine the vertical displacement at the point load ηRPS, and then the crack width corresponding to the rotation given (Equation 15). The crack width values then define two ranges that allow the definition of two equivalent post-cracking strengths, relevant for serviceability and ultimate limit states, respectively. The results of this procedure are reported in Table 2.
Table 2. Vertical displacement and crack width values corre-sponding to the same yield line rotation between panels and beams.
ϕRPS=ϕB ηRPS [mm]
wm [mm]
0.0052 0.82 0.55 0.0259 4.11 2.75
Therefore one can define two crack width ranges
and determine the corresponding equivalent post-cracking strengths, which are:
feq,1 from w0 to w0 + w1; feq,2 from w0 + w1 to w0 + w2.
being w0 the crack width at first cracking, w1=0.55 mm and w2=2.75 mm (Table 2). The two equivalent post-cracking strengths can therefore be defined as:
1
12
21 w
Ut
Dkfeq ⋅⋅
= (16)
12
22
22 ww
Ut
Dkfeq −
⋅⋅
= (17)
where:
feq,1 is the equivalent post-cracking strength rele-vant for serviceability limit states, corresponding to feq(0-0.6) of UNI beams;
feq,2 is the equivalent post-cracking strength rele-vant for serviceability limit states, corresponding to feq(0.6-3) of UNI beams;
U1 is the area under the P-w experimental graph calculated in the crack range from w0 to w0 + w1 (Fig. 10);
U2 is the area under the P-w experimental graph calculated in the crack range from w0 + w1 to w0 + w2 (Fig. 10);
k2 = 0.001816 mm-1 is the constant already calcu-lated throughout the elastic analysis previously shown.
U2U1
wm
Car
ic
w0 w0 + w1 w0 + w2
Load
Figure 10. Load-crack width curve for small round panels de-picting areas U1 and U2.
This approach can be used to determine average
values, standard deviations and characteristic values of the toughness parameters defined, taking a signifi-cant advantage from the lower scatter of panel tests over beams (see Conti and Flelli 2009).
Figure 11. Typical Load-w curve for a small round panel de-fining areas E1 and E2.
A similar approach can be derived starting from
the load-displacement curve of panels (Fig. 11), ne-glecting the crack width measurements (often not provided). In such circumstances, one can define suitable displacement ranges for the definition of feq1 and feq2. The displacement ranges, calculated from Equation 14, are incorporated into the definition of the two equivalent post-cracking strengths as:
1
12
21 η
Et
Dkfeq ⋅⋅= (18)
12
22
22 ηη −
⋅⋅= Et
Dkfeq (19)
Proceedings of FraMCoS-7, May 23-28, 2010
hThD ∇−= ),(J (1)
The proportionality coefficient D(h,T) is called moisture permeability and it is a nonlinear function of the relative humidity h and temperature T (Bažant & Najjar 1972). The moisture mass balance requires that the variation in time of the water mass per unit volume of concrete (water content w) be equal to the divergence of the moisture flux J
J•∇=∂
∂−
t
w (2)
The water content w can be expressed as the sum
of the evaporable water we (capillary water, water vapor, and adsorbed water) and the non-evaporable (chemically bound) water wn (Mills 1966, Pantazopoulo & Mills 1995). It is reasonable to assume that the evaporable water is a function of relative humidity, h, degree of hydration, αc, and degree of silica fume reaction, αs, i.e. we=we(h,αc,αs) = age-dependent sorption/desorption isotherm (Norling Mjonell 1997). Under this assumption and by substituting Equation 1 into Equation 2 one obtains
nscw
s
ew
c
ew
hh
Dt
h
h
ew
&&& ++∂
∂
∂
∂
=∇•∇+∂
∂
∂
∂
− αα
αα
)(
(3)
where ∂we/∂h is the slope of the sorption/desorption isotherm (also called moisture capacity). The governing equation (Equation 3) must be completed by appropriate boundary and initial conditions.
The relation between the amount of evaporable water and relative humidity is called ‘‘adsorption isotherm” if measured with increasing relativity humidity and ‘‘desorption isotherm” in the opposite case. Neglecting their difference (Xi et al. 1994), in the following, ‘‘sorption isotherm” will be used with reference to both sorption and desorption conditions. By the way, if the hysteresis of the moisture isotherm would be taken into account, two different relation, evaporable water vs relative humidity, must be used according to the sign of the variation of the relativity humidity. The shape of the sorption isotherm for HPC is influenced by many parameters, especially those that influence extent and rate of the chemical reactions and, in turn, determine pore structure and pore size distribution (water-to-cement ratio, cement chemical composition, SF content, curing time and method, temperature, mix additives, etc.). In the literature various formulations can be found to describe the sorption isotherm of normal concrete (Xi et al. 1994). However, in the present paper the semi-empirical expression proposed by Norling Mjornell (1997) is adopted because it
explicitly accounts for the evolution of hydration reaction and SF content. This sorption isotherm reads
( ) ( )( )
( ) ( )⎥⎥
⎦
⎤
⎢⎢
⎣
⎡
⎥⎥⎥
⎦
⎤
⎢⎢⎢
⎣
⎡
−
−∞
+
−∞
−=
1110
,1
110
11,
1,,
hcc
ge
scK
hcc
ge
scG
sch
ew
αα
αα
αα
αααα
(4)
where the first term (gel isotherm) represents the physically bound (adsorbed) water and the second term (capillary isotherm) represents the capillary water. This expression is valid only for low content of SF. The coefficient G1 represents the amount of water per unit volume held in the gel pores at 100% relative humidity, and it can be expressed (Norling Mjornell 1997) as
( ) ss
s
vgkc
c
c
vgk
scG αααα +=,1
(5)
where k
cvg and k
svg are material parameters. From the
maximum amount of water per unit volume that can fill all pores (both capillary pores and gel pores), one can calculate K1 as one obtains
( )1
110
110
11
22.0188.00
,1
−⎟⎠
⎞⎜⎝
⎛−∞
⎥⎥⎥
⎦
⎤
⎢⎢⎢
⎣
⎡⎟⎠
⎞⎜⎝
⎛−∞
−−+−
=
hcc
ge
hcc
geGs
ssc
w
scK
αα
αα
αα
αα
(6)
The material parameters k
cvg and k
svg and g1 can
be calibrated by fitting experimental data relevant to free (evaporable) water content in concrete at various ages (Di Luzio & Cusatis 2009b).
2.2 Temperature evolution
Note that, at early age, since the chemical reactions associated with cement hydration and SF reaction are exothermic, the temperature field is not uniform for non-adiabatic systems even if the environmental temperature is constant. Heat conduction can be described in concrete, at least for temperature not exceeding 100°C (Bažant & Kaplan 1996), by Fourier’s law, which reads
T∇−= λq (7)
where q is the heat flux, T is the absolute temperature, and λ is the heat conductivity; in this

being η1=0.82 mm and η2=4.11 mm (Table 2). According to the Italian Guidelines for the Design,
Construction and Production Control of Fibre Rein-forced Concrete Structures (CNR, 2006), once suit-able beam tests are performed and the corresponding values of feq1 and feq2 (also indicated as feq(0-0.6) and feq(0.6-3) if the aforementioned UNI test is considered), it is possible to define a simplified stress-crack width constitutive cohesive law as follows:
145.0 eqFts ff ⋅= (20)
( ) 02.05.0 122
≥⎥⎦
⎤⎢⎣
⎡⋅+⋅−⋅−⋅= eqeqFts
i
uFtsFtu fff
ww
fkf (21)
where:
k is a coefficient equal to 0.7 for uncracked sec-tions under tension and equal to 1 in the other cases k=1 in this case;
wi2 is the average of the crack width values for which feq2 is calculated. In this case wi2=1.8 mm (av-erage value between 0.6 and 3 mm according to UNI 11039);
wu is the greatest value of the crack range for which feq2 is calculated. In this case wu=3 mm (ac-cording to UNI 11039);
Figure 12 depicts a typical linear constitutive law obtained from the equivalent post-cracking stresses calculated from beam test.
i2
σ t
fFts
w w u w
f Ftu 0.5f eq2 eq1 -0.2f
Figure 12. Typical σ-w simplified cohesive constitutive law according to CNR DT 204/2006.
One can notice that, to the aim of coming up with
a simplified and easy-to-use constitutive law, the standard neglects the first branch from the tensile strength to the value fFts. Moreover, the σ-w indi-cated in the picture refers to a strain-softening mate-rial under tension.
Figure 13 and Figure 14 report, as an example, the characteristic values of equivalent post-cracking stresses calculated by using the procedure proposed herein for small round panels and the classical method included in UNI 11039 (2003) for beams.
The exemplification refers to a normal strength con-crete with two different contents of steel fibers, 30 and 60 kg/m3, according to Conti and Flelli (2009).
The advantage concerns the significantly smaller dispersion of experimental results that means higher characteristic values and, therefore, an improved stress-crack width cohesive law, as depicted in Figure 15. The fracture energy, as the area under the σ-w diagram, is around 25% larger in the two round panel diagrams plotted, which refer to the character-istic values shown in Figure 13 and Figure 14. The constitutive law related to Beam 1, in the plot, has the only advantage to show the best performance for high crack widths, exceeding all other laws depicted. This evidence comes from the fact that the two equivalent characteristic post-cracking stresses are rather similar and then, in the calculation the subtra-hend would be lower (Equation 21). This would also suggest that there is a need to further corroborate and validate the proposal included in CNR (2006) against a broader set of experimental data.
2.38
2.09
2.91
3.31
0
1
2
3
4[M
Pa]
Comparison feq(0-0.6),k - feq1,kSteel Fibres; NSC
Properties determined at SLS
30 kg/m3 60 kg/m3
UNI UNIRPS RPS
feq,RPS / feq,B= 1.22
feq,RPS / feq,B= 1.58
Figure 13. Analytical calculation of equivalent post-cracking stresses from experiments. NSC beams and panels from identi-cal concrete batch (Conti and Flelli, 2009).
1.62
1.931.86
2.56
0
1
2
3
4
[MP
a]
Comparison feq(0.6-3),k - feq2,kSteel Fibres; NSC
Properties determined at ULS
30 kg/m3 60 kg/m3
UNI UNIRPS RPS
feq,RPS / feq,B = 1.14
feq,RPS / feq,B = 1.32
Figure 14. Analytical calculation of equivalent post-cracking stresses from experiments. NSC beams and panels from identi-cal concrete batch (Conti and Flelli, 2009).
Proceedings of FraMCoS-7, May 23-28, 2010
hThD ∇−= ),(J (1)
The proportionality coefficient D(h,T) is called moisture permeability and it is a nonlinear function of the relative humidity h and temperature T (Bažant & Najjar 1972). The moisture mass balance requires that the variation in time of the water mass per unit volume of concrete (water content w) be equal to the divergence of the moisture flux J
J•∇=∂
∂−
t
w (2)
The water content w can be expressed as the sum
of the evaporable water we (capillary water, water vapor, and adsorbed water) and the non-evaporable (chemically bound) water wn (Mills 1966, Pantazopoulo & Mills 1995). It is reasonable to assume that the evaporable water is a function of relative humidity, h, degree of hydration, αc, and degree of silica fume reaction, αs, i.e. we=we(h,αc,αs) = age-dependent sorption/desorption isotherm (Norling Mjonell 1997). Under this assumption and by substituting Equation 1 into Equation 2 one obtains
nscw
s
ew
c
ew
hh
Dt
h
h
ew
&&& ++∂
∂
∂
∂
=∇•∇+∂
∂
∂
∂
− αα
αα
)(
(3)
where ∂we/∂h is the slope of the sorption/desorption isotherm (also called moisture capacity). The governing equation (Equation 3) must be completed by appropriate boundary and initial conditions.
The relation between the amount of evaporable water and relative humidity is called ‘‘adsorption isotherm” if measured with increasing relativity humidity and ‘‘desorption isotherm” in the opposite case. Neglecting their difference (Xi et al. 1994), in the following, ‘‘sorption isotherm” will be used with reference to both sorption and desorption conditions. By the way, if the hysteresis of the moisture isotherm would be taken into account, two different relation, evaporable water vs relative humidity, must be used according to the sign of the variation of the relativity humidity. The shape of the sorption isotherm for HPC is influenced by many parameters, especially those that influence extent and rate of the chemical reactions and, in turn, determine pore structure and pore size distribution (water-to-cement ratio, cement chemical composition, SF content, curing time and method, temperature, mix additives, etc.). In the literature various formulations can be found to describe the sorption isotherm of normal concrete (Xi et al. 1994). However, in the present paper the semi-empirical expression proposed by Norling Mjornell (1997) is adopted because it
explicitly accounts for the evolution of hydration reaction and SF content. This sorption isotherm reads
( ) ( )( )
( ) ( )⎥⎥
⎦
⎤
⎢⎢
⎣
⎡
⎥⎥⎥
⎦
⎤
⎢⎢⎢
⎣
⎡
−
−∞
+
−∞
−=
1110
,1
110
11,
1,,
hcc
ge
scK
hcc
ge
scG
sch
ew
αα
αα
αα
αααα
(4)
where the first term (gel isotherm) represents the physically bound (adsorbed) water and the second term (capillary isotherm) represents the capillary water. This expression is valid only for low content of SF. The coefficient G1 represents the amount of water per unit volume held in the gel pores at 100% relative humidity, and it can be expressed (Norling Mjornell 1997) as
( ) ss
s
vgkc
c
c
vgk
scG αααα +=,1
(5)
where k
cvg and k
svg are material parameters. From the
maximum amount of water per unit volume that can fill all pores (both capillary pores and gel pores), one can calculate K1 as one obtains
( )1
110
110
11
22.0188.00
,1
−⎟⎠
⎞⎜⎝
⎛−∞
⎥⎥⎥
⎦
⎤
⎢⎢⎢
⎣
⎡⎟⎠
⎞⎜⎝
⎛−∞
−−+−
=
hcc
ge
hcc
geGs
ssc
w
scK
αα
αα
αα
αα
(6)
The material parameters k
cvg and k
svg and g1 can
be calibrated by fitting experimental data relevant to free (evaporable) water content in concrete at various ages (Di Luzio & Cusatis 2009b).
2.2 Temperature evolution
Note that, at early age, since the chemical reactions associated with cement hydration and SF reaction are exothermic, the temperature field is not uniform for non-adiabatic systems even if the environmental temperature is constant. Heat conduction can be described in concrete, at least for temperature not exceeding 100°C (Bažant & Kaplan 1996), by Fourier’s law, which reads
T∇−= λq (7)
where q is the heat flux, T is the absolute temperature, and λ is the heat conductivity; in this

0.00
0.50
1.00
1.50
2.00
2.50
3.00
0 0.5 1 1.5 2 2.5 3
Stre
ss [M
pa]
Crack Width [mm]
Cohesive σ-w constitutive LawBeams vs. Round Panels
BEAM 1ROUND PANEL 1BEAM 2ROUND PANEL 2
Figure 15. σ-w laws according to CNR DT 204/2006. Beam test v. Panel test. NSC beams and panels from identical con-crete batch (Conti & Flelli, 2009).
3 CONCLUDING REMARKS
In the present paper, numerical elastic and the yield line approach were adopted to come up with simpli-fied cohesive constitutive laws from round panel small tests.
Panel test is quite appropriate for representing the actual behaviour of FRC materials. It can be consid-ered as a complete test for the characterization of FRC: suitable range of crack widths were defined and the corresponding equivalent (or residual) post-cracking strengths were derived (from σ-w plots) fol-lowing the same procedure as done for beam tests.
The kinematic approach for calculating crack width turned out to be simple, effective and rather accurate if compared against experiments.
Panel test can become a very promising test method for the characterization of FRC composites, as it is relatively easy to perform and it is not expen-sive, it might require only one vertical displacement transducer and, last but not least, it is characterized by a very low scatter.
Further studies are actually going on at the Uni-versity of Brescia for supplementary refine and vali-date the proposed calculation.
Among the open issues for further studies, the fol-lowing key-points should be kept in mind: - the position of the crack measurements: the crack width varies along the crack line, and changes in a different way before and after cracking. Moreover, we should also recall that tangential stresses have to be considered with radial stresses, which are non zero for a length of 2/3 of the crack line. One should think at measuring crack close to the pivot support, where radial stresses are negligible, but then the crack width would be lower and, more notably, the
stress disturbance of the pivot support might affect the record. - The 60 mm thickness of the small round panel should be well evaluated especially with longer fibers (longer than 50 mm). Suitable limitations should be defined concerning maximum allowable fiber length for which the small round panel test can be consid-ered significant. Similar limitation, however, should be defined also for classical round panels, where the thickness is only slightly higher (75 mm). - The thin plate geometry might cause a 2D orienta-tion, which should be well evaluated and compared with that of beam tests and samples taken directly from the field structural application.
4 ACKNOWLEDGMENTS
The authors would like to sincerely thank Engineers Moira Conti, Giovanni Flelli & Nicola Vezzoli for their assistance in data processing and in performing numerical and analytical studies.
REFERENCES
ASTM C1550-04, “Standard test method for flexural tough-ness of fiber reinforced concrete (using centrally loaded round panel), pp. 9, 2004.
Bernard, E.S. 2000 Behaviour of round steel fibre reinforced concrete panels under point loads, Materials and Struc-tures/Matériaux et Constructions, Vol. 33, April 2000, pp 181-188
Bernard, E.S. 2002 Correlations in the behaviour of fibre rein-forced shotcrete beam and panel specimens, Materials and Structures/Matériaux et Constructions, Vol. 35, April 2002, pp 156-164
Bernard, E.S. 2006 Influence of Toughness on the Apparent Cracking Load of Fiber-Reinforced Concrete Slabs, Journal of Structural Engineering, Vol. 132, No. 12, December 1, 2006.
CEN 2005 “Precast Concrete Products – Test method for me-tallic fibre concrete – Measuring the flexural tensile strength”, Europ. Standard EN 14651, pp.18.
CNR DT 204/2006. 2006. “Guidelines for the Design, Con-struction and Production Control of Fibre Reinforced Con-crete Structures", National Research Council of Italy.
Conti, M. & Flelli, G. 2009 “Caratterizzazione del calcestruzzo fibrorinforzato attraverso prove su piastre sottili”, M.Sc. Thesis, Department DICATA; University of Brescia, March 2009, only in Italian.
Johansen, K.W. 1972. Yield line theory, Cement and Concrete Association, U.K.
Lambrechts, A.N., “The variation of steel fibre concrete char-acteristics. Study on toughness results 2002-2003”, Pro-ceeding of the International Workshop “Fiber Reinforced Concrete. From theory to practice”, Bergamo, September 24-25, 2004, pp. 135-148.
Marinoni, Y. et al.: “Prove di frattura su calcestruzzi fibrorinforzati in accordo con le principali normative internazionali”, Technical Report, University of Brescia, Department DICATA, 2007.
Minelli, F. & Plizzari, G.A. (2007), “Fibre Reinforced Con-crete characterization: Round Panel vs. beam test toward a
Proceedings of FraMCoS-7, May 23-28, 2010
hThD ∇−= ),(J (1)
The proportionality coefficient D(h,T) is called moisture permeability and it is a nonlinear function of the relative humidity h and temperature T (Bažant & Najjar 1972). The moisture mass balance requires that the variation in time of the water mass per unit volume of concrete (water content w) be equal to the divergence of the moisture flux J
J•∇=∂
∂−
t
w (2)
The water content w can be expressed as the sum
of the evaporable water we (capillary water, water vapor, and adsorbed water) and the non-evaporable (chemically bound) water wn (Mills 1966, Pantazopoulo & Mills 1995). It is reasonable to assume that the evaporable water is a function of relative humidity, h, degree of hydration, αc, and degree of silica fume reaction, αs, i.e. we=we(h,αc,αs) = age-dependent sorption/desorption isotherm (Norling Mjonell 1997). Under this assumption and by substituting Equation 1 into Equation 2 one obtains
nscw
s
ew
c
ew
hh
Dt
h
h
ew
&&& ++∂
∂
∂
∂
=∇•∇+∂
∂
∂
∂
− αα
αα
)(
(3)
where ∂we/∂h is the slope of the sorption/desorption isotherm (also called moisture capacity). The governing equation (Equation 3) must be completed by appropriate boundary and initial conditions.
The relation between the amount of evaporable water and relative humidity is called ‘‘adsorption isotherm” if measured with increasing relativity humidity and ‘‘desorption isotherm” in the opposite case. Neglecting their difference (Xi et al. 1994), in the following, ‘‘sorption isotherm” will be used with reference to both sorption and desorption conditions. By the way, if the hysteresis of the moisture isotherm would be taken into account, two different relation, evaporable water vs relative humidity, must be used according to the sign of the variation of the relativity humidity. The shape of the sorption isotherm for HPC is influenced by many parameters, especially those that influence extent and rate of the chemical reactions and, in turn, determine pore structure and pore size distribution (water-to-cement ratio, cement chemical composition, SF content, curing time and method, temperature, mix additives, etc.). In the literature various formulations can be found to describe the sorption isotherm of normal concrete (Xi et al. 1994). However, in the present paper the semi-empirical expression proposed by Norling Mjornell (1997) is adopted because it
explicitly accounts for the evolution of hydration reaction and SF content. This sorption isotherm reads
( ) ( )( )
( ) ( )⎥⎥
⎦
⎤
⎢⎢
⎣
⎡
⎥⎥⎥
⎦
⎤
⎢⎢⎢
⎣
⎡
−
−∞
+
−∞
−=
1110
,1
110
11,
1,,
hcc
ge
scK
hcc
ge
scG
sch
ew
αα
αα
αα
αααα
(4)
where the first term (gel isotherm) represents the physically bound (adsorbed) water and the second term (capillary isotherm) represents the capillary water. This expression is valid only for low content of SF. The coefficient G1 represents the amount of water per unit volume held in the gel pores at 100% relative humidity, and it can be expressed (Norling Mjornell 1997) as
( ) ss
s
vgkc
c
c
vgk
scG αααα +=,1
(5)
where k
cvg and k
svg are material parameters. From the
maximum amount of water per unit volume that can fill all pores (both capillary pores and gel pores), one can calculate K1 as one obtains
( )1
110
110
11
22.0188.00
,1
−⎟⎠
⎞⎜⎝
⎛−∞
⎥⎥⎥
⎦
⎤
⎢⎢⎢
⎣
⎡⎟⎠
⎞⎜⎝
⎛−∞
−−+−
=
hcc
ge
hcc
geGs
ssc
w
scK
αα
αα
αα
αα
(6)
The material parameters k
cvg and k
svg and g1 can
be calibrated by fitting experimental data relevant to free (evaporable) water content in concrete at various ages (Di Luzio & Cusatis 2009b).
2.2 Temperature evolution
Note that, at early age, since the chemical reactions associated with cement hydration and SF reaction are exothermic, the temperature field is not uniform for non-adiabatic systems even if the environmental temperature is constant. Heat conduction can be described in concrete, at least for temperature not exceeding 100°C (Bažant & Kaplan 1996), by Fourier’s law, which reads
T∇−= λq (7)
where q is the heat flux, T is the absolute temperature, and λ is the heat conductivity; in this

harmonization”, Proceedings of the 3rd Central European Congress on Concrete Engineering CCC 2007 – Visegrád, Hungary, 17-18 September 2007. G.L. Balázs & S.G. Nehme (eds), Publishing Company of Budapest University of Technology and Economics, pp. 213-220.
Minelli, F. & Plizzari, G. A. 2009 “Round panel vs. beam tests toward a comprehensive and harmonic characterization of FRC materials”, Proceedings of the BMC-9 Conference, Warsaw, Poland, 25-28 October 2009, A.M. Brandt et al. (eds.), pp. 23-32.
RILEM Final Recommendation TC-162-TDF, “Test and De-sign Methods for Steel Fibre Reinforced Concrete; σ−ε De-sign Method”, Materials and Structures, Vol 36, October 2003, pp. 560-567.
Straus7. 2004. Finite Element Analysis System, www.strand7.com www.straus7.com.
Tran, V.G. et al. 2001. The applica-tion of Yield Line Theory to Round Determinate Panels, Shotcrete: Engineering De-velopments, Bernard (ed.), pp 245-254, Swets & Zeitlin-ger, Lisse.
UNI 11039, “Steel Fiber Reinforced Concrete - Part I: Defini-tions, Classification Specification and Conformity - Part II: Test Method for Measuring First Crack Strength and Duc-tility Indexes”, Italian Board for Standardization, 2003.
Proceedings of FraMCoS-7, May 23-28, 2010
hThD ∇−= ),(J (1)
The proportionality coefficient D(h,T) is called moisture permeability and it is a nonlinear function of the relative humidity h and temperature T (Bažant & Najjar 1972). The moisture mass balance requires that the variation in time of the water mass per unit volume of concrete (water content w) be equal to the divergence of the moisture flux J
J•∇=∂
∂−
t
w (2)
The water content w can be expressed as the sum
of the evaporable water we (capillary water, water vapor, and adsorbed water) and the non-evaporable (chemically bound) water wn (Mills 1966, Pantazopoulo & Mills 1995). It is reasonable to assume that the evaporable water is a function of relative humidity, h, degree of hydration, αc, and degree of silica fume reaction, αs, i.e. we=we(h,αc,αs) = age-dependent sorption/desorption isotherm (Norling Mjonell 1997). Under this assumption and by substituting Equation 1 into Equation 2 one obtains
nscw
s
ew
c
ew
hh
Dt
h
h
ew
&&& ++∂
∂
∂
∂
=∇•∇+∂
∂
∂
∂
− αα
αα
)(
(3)
where ∂we/∂h is the slope of the sorption/desorption isotherm (also called moisture capacity). The governing equation (Equation 3) must be completed by appropriate boundary and initial conditions.
The relation between the amount of evaporable water and relative humidity is called ‘‘adsorption isotherm” if measured with increasing relativity humidity and ‘‘desorption isotherm” in the opposite case. Neglecting their difference (Xi et al. 1994), in the following, ‘‘sorption isotherm” will be used with reference to both sorption and desorption conditions. By the way, if the hysteresis of the moisture isotherm would be taken into account, two different relation, evaporable water vs relative humidity, must be used according to the sign of the variation of the relativity humidity. The shape of the sorption isotherm for HPC is influenced by many parameters, especially those that influence extent and rate of the chemical reactions and, in turn, determine pore structure and pore size distribution (water-to-cement ratio, cement chemical composition, SF content, curing time and method, temperature, mix additives, etc.). In the literature various formulations can be found to describe the sorption isotherm of normal concrete (Xi et al. 1994). However, in the present paper the semi-empirical expression proposed by Norling Mjornell (1997) is adopted because it
explicitly accounts for the evolution of hydration reaction and SF content. This sorption isotherm reads
( ) ( )( )
( ) ( )⎥⎥
⎦
⎤
⎢⎢
⎣
⎡
⎥⎥⎥
⎦
⎤
⎢⎢⎢
⎣
⎡
−
−∞
+
−∞
−=
1110
,1
110
11,
1,,
hcc
ge
scK
hcc
ge
scG
sch
ew
αα
αα
αα
αααα
(4)
where the first term (gel isotherm) represents the physically bound (adsorbed) water and the second term (capillary isotherm) represents the capillary water. This expression is valid only for low content of SF. The coefficient G1 represents the amount of water per unit volume held in the gel pores at 100% relative humidity, and it can be expressed (Norling Mjornell 1997) as
( ) ss
s
vgkc
c
c
vgk
scG αααα +=,1
(5)
where k
cvg and k
svg are material parameters. From the
maximum amount of water per unit volume that can fill all pores (both capillary pores and gel pores), one can calculate K1 as one obtains
( )1
110
110
11
22.0188.00
,1
−⎟⎠
⎞⎜⎝
⎛−∞
⎥⎥⎥
⎦
⎤
⎢⎢⎢
⎣
⎡⎟⎠
⎞⎜⎝
⎛−∞
−−+−
=
hcc
ge
hcc
geGs
ssc
w
scK
αα
αα
αα
αα
(6)
The material parameters k
cvg and k
svg and g1 can
be calibrated by fitting experimental data relevant to free (evaporable) water content in concrete at various ages (Di Luzio & Cusatis 2009b).
2.2 Temperature evolution
Note that, at early age, since the chemical reactions associated with cement hydration and SF reaction are exothermic, the temperature field is not uniform for non-adiabatic systems even if the environmental temperature is constant. Heat conduction can be described in concrete, at least for temperature not exceeding 100°C (Bažant & Kaplan 1996), by Fourier’s law, which reads
T∇−= λq (7)
where q is the heat flux, T is the absolute temperature, and λ is the heat conductivity; in this