Embed Size (px)
Citation preview
Fetal ECG Subspace Estimation Based on
Cyclostationarity
Miao Zhang1, Michel Haritopoulos2, Asoke K. Nandi1,3
1Department of Electronic and Computer Engineering, Brunel University, Uxbridge, Middlesex, UK 2Univ. Orléans, ENSI de Bourges, PRISME Laboratory, EA 4229, F28000, Chartres, France
3College of Electronic and Information Engineering, Tongji University, Shanghai, China
Abstract—In this paper, we propose a strategy to estimate a
Fetal Electrocardiogram (FECG) subspace from a set of mixed
ECG recordings from the thoracic and abdominal electrodes
attached on a pregnant woman. The ECGs from an expectant
woman contain FECG that can provide valuable information for
fetal health monitoring, such as the fetal heart rate (FHR). After
applying blind source separation (BSS) methods to mixed ECG,
independent components are obtained. The main purpose of this
paper is to classify an FECG group from all of these components
which can be classified as FECG, MECG and noise according to
the features of signals. Inspired by the concept of multidimensional
independent component analysis (MICA) and to automate the
classification task, we propose a procedure based on
cyclostationarity of FECGs, in particular, an integrated Cyclic
Coherence. The method is validated on real world DaISy dataset
and the results are promising.
Keywords—Fetal Electrocardiogram; Fetal Heart Rate;
Cyclostationarity; Cyclic Coherence; Blind Source Separation;
Multidimensional Independent Component Analysis
I. INTRODUCTION
Fetal Electrocardiogram (FECG) is an important tool to indicate the health state of a fetus. Non-invasive FECG measurement can be utilized to prevent diseases and complications caused by heart defects before a baby is delivered. Basically, FECG is obtained from electrodes attached on the mother’s skin. When mixed ECGs signals are sampled via several electrodes from thoracic and abdominal regions, some separating algorithms are used to extract FECGs from the mixed ECGs. This is not an easy task because voltage amplitude of an FECG is very low compared to a maternal ECG (MECG). Moreover, other noise cannot be neglected. They may come from mother, such as Electromyogram (EMG) or respiration. And they may also be from instruments and power grid, such as baseline wandering and thermal noise, etc.
Research on FECG extraction methods are very popular in recent decades and a variety of processing techniques emerged. They can be classified on different categories according to their principle, such as blind source separation (BSS) [21] [24] [25] methods, adaptive filter [3], wavelet transform [4] [5], artificial intelligence techniques [6], etc. Adaptive filtering based approaches, such as Bayesian filter [7], Kalman filter [8] (specifically for linear model assumption), extract FECG through a training with the help of MECG and recordings from
maternal chest as cancellation reference signals. Wavelet transform [4] is utilized to find MECG with noise. Then FECG is obtained by removing this noisy MECG from the mixed signals. Wavelet transform is also a good pre-processing tool for denoising [5] before FECG is separated. The key point for wavelet transform is to choose a suitable mother wavelet with good position and scale parameters. Artificial intelligence, such as adaptive linear neural network [9], needs sufficient training of weights to obtain MECG and some distinctive noise such as baseline wondering, which are later subtracted from abdominal ECG to get FECG. The training need much time, generally.
BSS methods, such as principal component analysis (PCA), independent component analysis (ICA), singular value decomposition (SVD) [10], separate mixed signals without or using little prior information. ICA [11] [22] [23] is a separation algorithm that is based on higher-order statistics. After optimizing, signals with maximum statistic properties are the components that we need. After separated, FECG, MECG and noise can be displayed by different time series. It is necessary to find out which ones are in an FECG group for a further diagnosing of fetus heart state. For an FECG subspace estimation, our paper focuses on the separation via ICA BSS algorithms and makes use of the concept of multidimensional ICA (MICA) [12].
In Section II, the basic BSS model used for FECG estimation as well as the concept of MICA are presented. Next, in Section III, we introduce a criterion based on the cyclostationary properties of an FECG to figure out whether an independent component can be classified in an FECG group or not. We propose our new criterion and procedure for an automatic classification in Section IV. The experiments and results are displayed in Section V. Finally, a conclusion is presented in Section VI.
II. SEPARATION MODEL OF BSS AND MULTIDIMENSIONAL ICA
A. Blind Source Separation and ICA
BSS was first proposed in [1] and [2] by Jutten et al. It can be described as obtaining a set of “pure” or source signals from a set of observations with little priori knowledge or information and few assumptions. In general, BSS is described as a linear, time invariant and instantaneous model.
2016 24th European Signal Processing Conference (EUSIPCO)
978-0-9928-6265-7/16/$31.00 ©2016 IEEE 2060
Let us consider a set of M observation signals 𝐱(𝑡) =[𝑥1(𝑡) ⋯ 𝑥𝑀(𝑡)]𝑇; and a set of N unknown source signals 𝐬(𝑡) = [𝑠1(𝑡) ⋯ 𝑠𝑁(𝑡)]𝑇 , 𝑁 ≤ 𝑀, where t denotes a time index and T is a transpose operator. Thus, the linear instantaneous BSS model can be stated as:
𝐱(𝑡) = 𝐀𝐬(𝑡) (1)
where A is an unknown 𝑀 × 𝑁 mixing matrix and it should be full column rank as 𝑀 ≥ 𝑁.
In addition, as a basic condition of ICA, it is usually assumed source signals are mutually statistically independent and there is at most one Gaussian distribution source in 𝐬(𝑡).
B. MICA
Author of [12] generalized the notion of ICA to that of multidimensional ICA (also referred to as independent subspace analysis); to do this, the starting point was rewriting model of eq. (1) as a sum of M 1-dimensional independent vectors 𝑥1, … , 𝑥𝑀, transforming the original multiplicative model into an additive one. Thus, instead of separating independent components (ICs), the MICA concept aims at separating independent subspaces. The main advantage of MICA over ICA methods is that ICs of the same group may be dependent to each other but independent from ICs grouped in different estimated subspaces. For bioelectric signals processing, the MICA decomposition can be performed by a two steps procedure: first, estimate ICs from the observed signals using an ICA algorithm and, then, group together those which are part of the same multidimensional component (in this work, the criterion for automatic classification is based on the inherent cyclostationary properties of the ECG signal and will be detailed in Section IV).
A theoretical study on the uniqueness of the MICA problem but limited to the case where the estimated subspaces have the same size is given in [27]. Also, some applications of the MICA concept in the biomedical research field exist in the literature. For example, in [28], authors aimed at classifying the estimated independent components into ventricular activity (VA) and atrial activity (AA) subspaces using data from a single ECG electrode and in [29] the MECG component is estimated from abdominal recordings and cleaned from any FECG contribution before being considered as an extra input to MICA together with recordings from electrodes positioned at the mother’s thoracic region.
III. FECG CLASSIFICATION CRITERION BASED ON
CYCLOSTATIONARITY
A. Cyclostationary Property
From the waveforms of FECGs and MECGs, we can assume that the heartbeats of fetuses and mothers are both repeated, which means they have their own relative stable periods. Although they are not strictly periodic, they are cyclostationary signals. Signal with cyclostationarity can be extracted directly by only knowing the cyclic frequency as a prior information [26]. In [13], this assumption is demonstrated to be valid and promising for extracting fetal PQRST wave. And it also gives an a priori estimation of the fundamental cyclic frequency of the fetus.
In the following of this paper, a classification criterion based on cyclostationarity is introduced. It will tell which of the independent components that are separated via ICA belong to an FECG subspace. Hence, the remaining estimated components should be grouped into MECG and noise subspaces.
B. Cyclic Coherence Criterion
In order to measure the correlation degree between cyclostationary signals as well as themselves, we use Cyclic Coherence (CC) [14]. It is a form of simple coherence [15] in frequency domain. Suppose 𝑥(𝑡) denotes a signal in time domain. The transform of 𝑥(𝑡) is 𝑋(𝑓), where f is a frequency variable. Thus, the CC has the form below:
𝐶𝑥𝛼(𝑓) =
𝐸[𝑋(𝑓)𝑋∗(𝑓−𝛼)]
(𝐸[|𝑋(𝑓)|2]𝐸[|𝑋(𝑓−𝛼)|2])1 2⁄
In this formula, the CC criterion is normalized, so the value of CC 𝐶𝑥
𝛼(𝑓) ∈ [−1,1]. The more close to 1 the |CC| is, the more strong coherent between components of signal 𝑥(𝑡) at frequency f and 𝑓 − 𝛼 is.
IV. INTEGRATED CYCLIC COHERENCE AND AUTOMATIC
CLASSIFICATION PROCEDURE
The 𝐶𝑥𝛼(𝑓) is a bivariate function of which variables are 𝛼
and f, respectively. We can plot it as an image and the colour of each pixel stands for the value at a specific point (𝑓0, 𝛼0). In order to make CC more reasonable to use for classification and according to the property of CC, we present a criterion named integrated Cyclic Coherence (iCC) which can be defined as follows:
𝑖𝐶𝐶(𝛼) = ∑ 𝐶𝑥𝛼(𝑓)𝑓∈[𝑓𝑚𝑖𝑛,𝑓𝑚𝑎𝑥] , 𝛼 ∈ [𝛼𝑚𝑖𝑛 , 𝛼𝑚𝑎𝑥]
where [𝑓𝑚𝑖𝑛 , 𝑓𝑚𝑎𝑥] and [𝛼𝑚𝑖𝑛 , 𝛼𝑚𝑎𝑥] are ranges of f and 𝛼, respectively. They are rough ranges that can be determined according to the physical truths of FECG and MECG. The choice of these ranges will be described in the experiments and results section.
The strategy of classifying the FECG group from a set of separated components from the mixed ECGs is:
1) The starting point is a set of raw ECG recordings which
are a mixture of fetal and maternal ECGs. A BSS algorithm is
used to separate these into independent components (IC).
2) For each independent component, both the cyclic
coherence and the integrated cyclic coherence are calculated.
3) The fundamental cyclic frequency of FECG can be found
either from plots of CC on a plane of cyclic frequency vs.
frequency, as can be seen from Fig. 3-a), or from plots of
(𝑚𝑎𝑥(𝑖𝐶𝐶) − 𝑖𝐶𝐶) vs. cyclic frequency, as can be seen from
Fig. 4.
4) The independent components are considered to be
FECGs if the kurtosis values of their corresponding iCCs are
above a threshold value.
In the next section, three BSS algorithms are applied to real world data in order to test the criterion we proposed.
2016 24th European Signal Processing Conference (EUSIPCO)
2061
V. EXPERIMENTS AND RESULTS
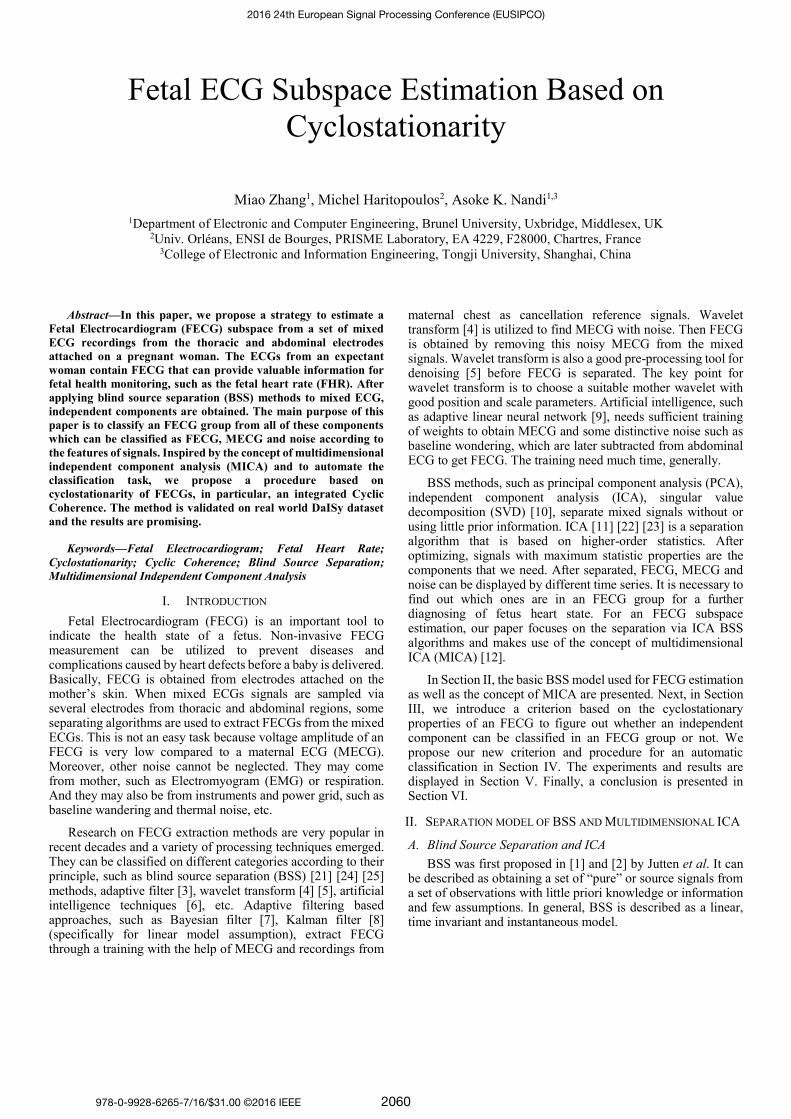
In this section, we use JADE [16], SOBI [17] and FastICA [18] as the BSS methods to separate raw ECG. The well-known DaISy database [19] is tested in this paper. The signals in DaISy is a real world data that came from eight electrodes attached on a pregnant woman. The dataset signals are displayed in Fig. 1. All signals have a 500Hz sampling rate with a total sampling time of 5 sec. The first five channel (from top to bottom) recordings come from abdominal regions and the other three from thoracic regions. All signals are sampled simultaneously. We first test the proposed strategy under the JADE method.
Fig. 1 Eight channel recordings of a pregment woman from DaISy database
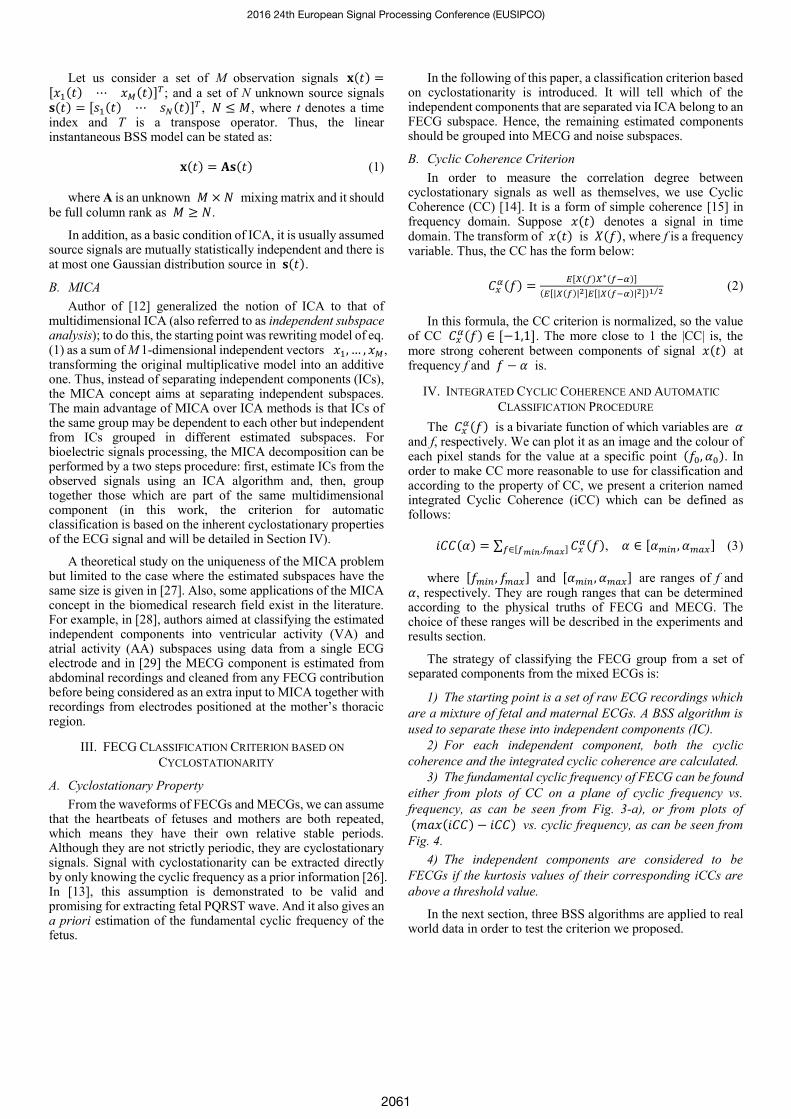
Fig. 2 Independent components extracted by JADE from DaISy
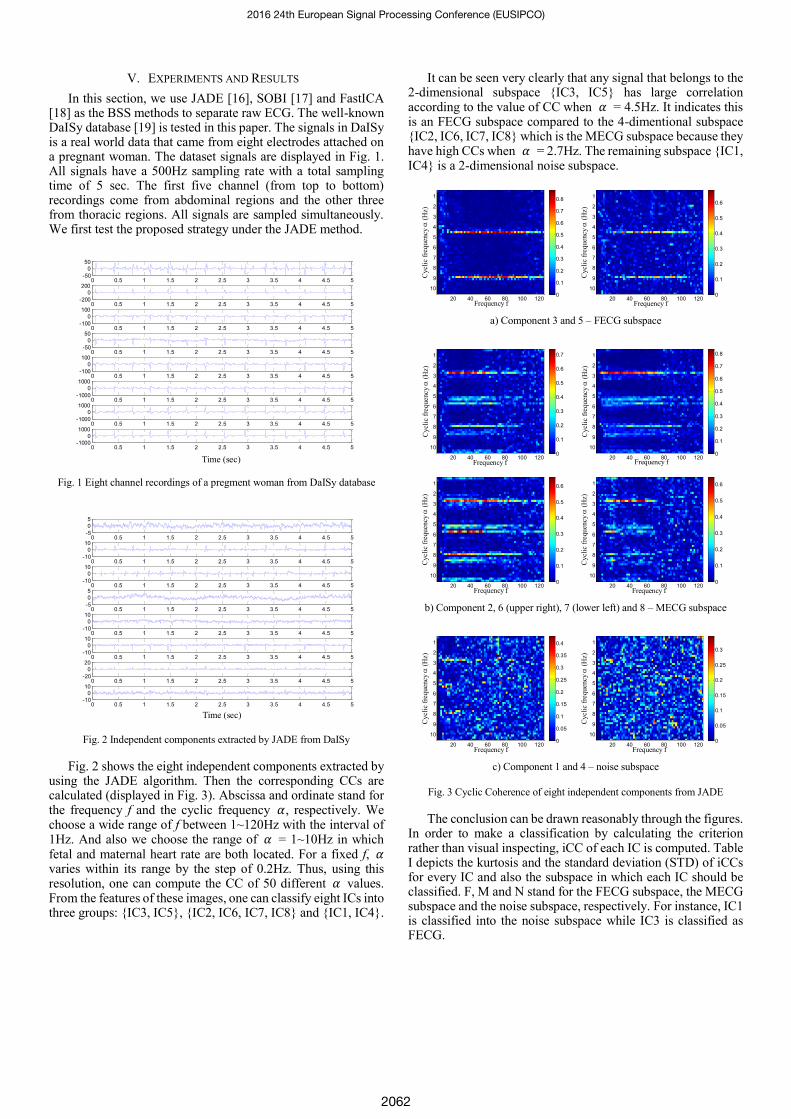
Fig. 2 shows the eight independent components extracted by using the JADE algorithm. Then the corresponding CCs are calculated (displayed in Fig. 3). Abscissa and ordinate stand for the frequency f and the cyclic frequency 𝛼, respectively. We choose a wide range of f between 1~120Hz with the interval of 1Hz. And also we choose the range of 𝛼 = 1~10Hz in which fetal and maternal heart rate are both located. For a fixed f, 𝛼 varies within its range by the step of 0.2Hz. Thus, using this resolution, one can compute the CC of 50 different 𝛼 values. From the features of these images, one can classify eight ICs into three groups: {IC3, IC5}, {IC2, IC6, IC7, IC8} and {IC1, IC4}.
It can be seen very clearly that any signal that belongs to the 2-dimensional subspace {IC3, IC5} has large correlation according to the value of CC when 𝛼 = 4.5Hz. It indicates this is an FECG subspace compared to the 4-dimentional subspace {IC2, IC6, IC7, IC8} which is the MECG subspace because they have high CCs when 𝛼 = 2.7Hz. The remaining subspace {IC1, IC4} is a 2-dimensional noise subspace.
a) Component 3 and 5 – FECG subspace
b) Component 2, 6 (upper right), 7 (lower left) and 8 – MECG subspace
c) Component 1 and 4 – noise subspace
Fig. 3 Cyclic Coherence of eight independent components from JADE
The conclusion can be drawn reasonably through the figures. In order to make a classification by calculating the criterion rather than visual inspecting, iCC of each IC is computed. Table I depicts the kurtosis and the standard deviation (STD) of iCCs for every IC and also the subspace in which each IC should be classified. F, M and N stand for the FECG subspace, the MECG subspace and the noise subspace, respectively. For instance, IC1 is classified into the noise subspace while IC3 is classified as FECG.
0 0.5 1 1.5 2 2.5 3 3.5 4 4.5 5-50
0
50
0 0.5 1 1.5 2 2.5 3 3.5 4 4.5 5-200
0
200
0 0.5 1 1.5 2 2.5 3 3.5 4 4.5 5-100
0
100
0 0.5 1 1.5 2 2.5 3 3.5 4 4.5 5-50
0
50
0 0.5 1 1.5 2 2.5 3 3.5 4 4.5 5-100
0
100
0 0.5 1 1.5 2 2.5 3 3.5 4 4.5 5-1000
0
1000
0 0.5 1 1.5 2 2.5 3 3.5 4 4.5 5-1000
0
1000
0 0.5 1 1.5 2 2.5 3 3.5 4 4.5 5-1000
0
1000
Time (sec)
0 0.5 1 1.5 2 2.5 3 3.5 4 4.5 5-5
0
5
0 0.5 1 1.5 2 2.5 3 3.5 4 4.5 5-10
0
10
0 0.5 1 1.5 2 2.5 3 3.5 4 4.5 5-10
0
10
0 0.5 1 1.5 2 2.5 3 3.5 4 4.5 5-5
0
5
0 0.5 1 1.5 2 2.5 3 3.5 4 4.5 5-10
0
10
0 0.5 1 1.5 2 2.5 3 3.5 4 4.5 5-10
0
10
0 0.5 1 1.5 2 2.5 3 3.5 4 4.5 5-20
0
20
0 0.5 1 1.5 2 2.5 3 3.5 4 4.5 5-10
0
10
Time (sec)
Frequency f
Cycli
c f
requency
(H
z)
20 40 60 80 100 120
1
2
3
4
5
6
7
8
9
100
0.1
0.2
0.3
0.4
0.5
0.6
0.7
0.8
Frequency f
Cycli
c f
requency
(H
z)
20 40 60 80 100 120
1
2
3
4
5
6
7
8
9
100
0.1
0.2
0.3
0.4
0.5
0.6
Frequency f
Cycli
c f
requency
(H
z)
20 40 60 80 100 120
1
2
3
4
5
6
7
8
9
100
0.1
0.2
0.3
0.4
0.5
0.6
0.7
Frequency f
Cycli
c f
requency
(H
z)
20 40 60 80 100 120
1
2
3
4
5
6
7
8
9
100
0.1
0.2
0.3
0.4
0.5
0.6
0.7
0.8
Frequency f
Cycli
c f
requency
(H
z)
20 40 60 80 100 120
1
2
3
4
5
6
7
8
9
100
0.1
0.2
0.3
0.4
0.5
0.6
Frequency fC
ycli
c f
requency
(H
z)
20 40 60 80 100 120
1
2
3
4
5
6
7
8
9
100
0.1
0.2
0.3
0.4
0.5
0.6
Frequency f
Cycli
c f
requency
(H
z)
20 40 60 80 100 120
1
2
3
4
5
6
7
8
9
100
0.05
0.1
0.15
0.2
0.25
0.3
0.35
0.4
Frequency f
Cycli
c f
requency
(H
z)
20 40 60 80 100 120
1
2
3
4
5
6
7
8
9
100
0.05
0.1
0.15
0.2
0.25
0.3
2016 24th European Signal Processing Conference (EUSIPCO)
2062
In our paper, we focus on the kurtosis of iCC to classify the FECG subspace. It is obvious that a high threshold of kurtosis (e.g. kurtosis ≥ 30) is reasonable to divide ICs into the FECG group from other groups. In the previous work [20], the authors point out that an independent component can be classified into a noise subspace when STD of iCC is low enough (e.g. threshold is 1). The classification of maternal (M), fetal (F) and noise (N) subspace in Table I is completed based on this paper and the previous work [20].
Table I. Kurtosis and Standard Deviation of integrated Cyclic Coherence of eight independent components from JADE. F, M and N are classification
results for subspaces of FECG, MECG and noise, respectively
IC 1 2 3 4 5 6 7 8
Kurtosis 7.27 16.57 36.11 -0.26 34.24 24.88 15.20 25.75
Subspace N M F N F M M M
STD 0.71 3.78 5.53 0.62 2.53 4.64 4.80 2.08
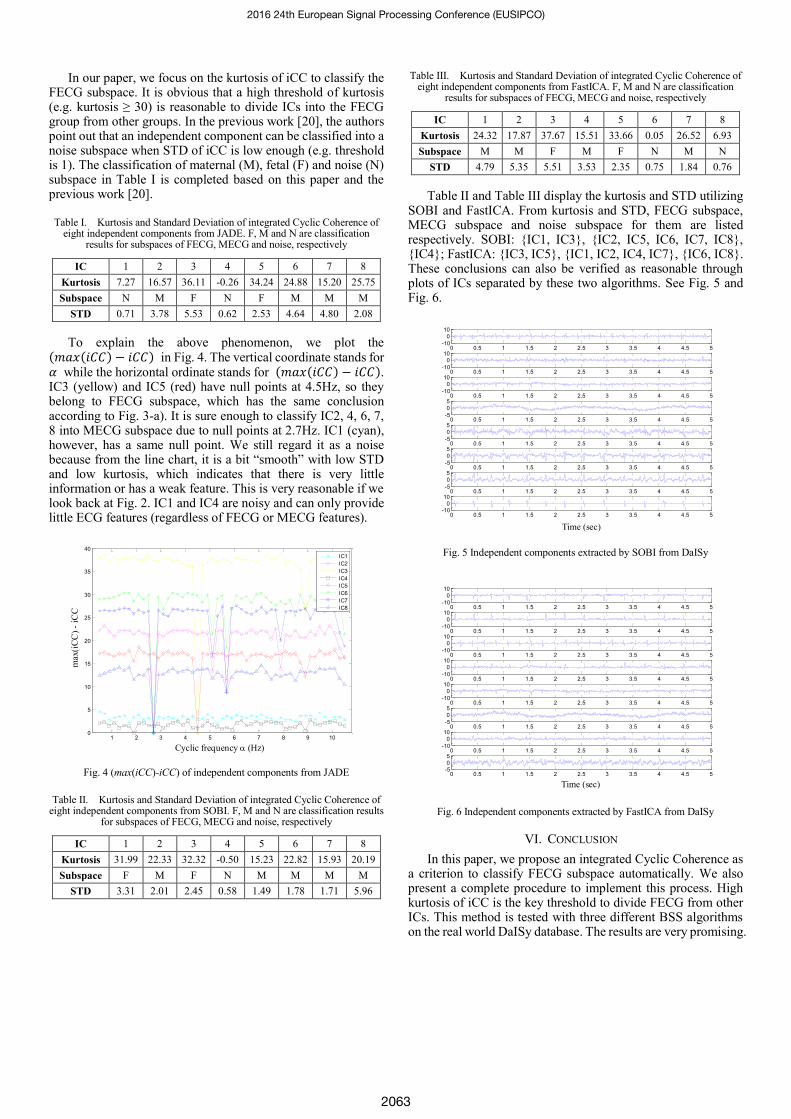
To explain the above phenomenon, we plot the (𝑚𝑎𝑥(𝑖𝐶𝐶) − 𝑖𝐶𝐶) in Fig. 4. The vertical coordinate stands for 𝛼 while the horizontal ordinate stands for (𝑚𝑎𝑥(𝑖𝐶𝐶) − 𝑖𝐶𝐶). IC3 (yellow) and IC5 (red) have null points at 4.5Hz, so they belong to FECG subspace, which has the same conclusion according to Fig. 3-a). It is sure enough to classify IC2, 4, 6, 7, 8 into MECG subspace due to null points at 2.7Hz. IC1 (cyan), however, has a same null point. We still regard it as a noise because from the line chart, it is a bit “smooth” with low STD and low kurtosis, which indicates that there is very little information or has a weak feature. This is very reasonable if we look back at Fig. 2. IC1 and IC4 are noisy and can only provide little ECG features (regardless of FECG or MECG features).
Fig. 4 (max(iCC)-iCC) of independent components from JADE
Table II. Kurtosis and Standard Deviation of integrated Cyclic Coherence of eight independent components from SOBI. F, M and N are classification results
for subspaces of FECG, MECG and noise, respectively
IC 1 2 3 4 5 6 7 8
Kurtosis 31.99 22.33 32.32 -0.50 15.23 22.82 15.93 20.19
Subspace F M F N M M M M
STD 3.31 2.01 2.45 0.58 1.49 1.78 1.71 5.96
Table III. Kurtosis and Standard Deviation of integrated Cyclic Coherence of eight independent components from FastICA. F, M and N are classification
results for subspaces of FECG, MECG and noise, respectively
IC 1 2 3 4 5 6 7 8
Kurtosis 24.32 17.87 37.67 15.51 33.66 0.05 26.52 6.93
Subspace M M F M F N M N
STD 4.79 5.35 5.51 3.53 2.35 0.75 1.84 0.76
Table II and Table III display the kurtosis and STD utilizing SOBI and FastICA. From kurtosis and STD, FECG subspace, MECG subspace and noise subspace for them are listed respectively. SOBI: {IC1, IC3}, {IC2, IC5, IC6, IC7, IC8}, {IC4}; FastICA: {IC3, IC5}, {IC1, IC2, IC4, IC7}, {IC6, IC8}. These conclusions can also be verified as reasonable through plots of ICs separated by these two algorithms. See Fig. 5 and Fig. 6.
Fig. 5 Independent components extracted by SOBI from DaISy
Fig. 6 Independent components extracted by FastICA from DaISy
VI. CONCLUSION
In this paper, we propose an integrated Cyclic Coherence as a criterion to classify FECG subspace automatically. We also present a complete procedure to implement this process. High kurtosis of iCC is the key threshold to divide FECG from other ICs. This method is tested with three different BSS algorithms on the real world DaISy database. The results are very promising.
1 2 3 4 5 6 7 8 9 100
5
10
15
20
25
30
35
40
max(i
CC
) -
iCC
Cyclic frequency (Hz)
IC1
IC2
IC3
IC4
IC5
IC6
IC7
IC8
0 0.5 1 1.5 2 2.5 3 3.5 4 4.5 5-10
0
10
0 0.5 1 1.5 2 2.5 3 3.5 4 4.5 5-10
0
10
0 0.5 1 1.5 2 2.5 3 3.5 4 4.5 5-10
0
10
0 0.5 1 1.5 2 2.5 3 3.5 4 4.5 5-5
0
5
0 0.5 1 1.5 2 2.5 3 3.5 4 4.5 5-5
0
5
0 0.5 1 1.5 2 2.5 3 3.5 4 4.5 5-5
0
5
0 0.5 1 1.5 2 2.5 3 3.5 4 4.5 5-5
0
5
0 0.5 1 1.5 2 2.5 3 3.5 4 4.5 5-10
0
10
Time (sec)
0 0.5 1 1.5 2 2.5 3 3.5 4 4.5 5-10
0
10
0 0.5 1 1.5 2 2.5 3 3.5 4 4.5 5-10
0
10
0 0.5 1 1.5 2 2.5 3 3.5 4 4.5 5-10
0
10
0 0.5 1 1.5 2 2.5 3 3.5 4 4.5 5-10
0
10
0 0.5 1 1.5 2 2.5 3 3.5 4 4.5 5-10
0
10
0 0.5 1 1.5 2 2.5 3 3.5 4 4.5 5-5
0
5
0 0.5 1 1.5 2 2.5 3 3.5 4 4.5 5-10
0
10
0 0.5 1 1.5 2 2.5 3 3.5 4 4.5 5-5
0
5
Time (sec)
2016 24th European Signal Processing Conference (EUSIPCO)
2063
In combination with the previous work [20], we can now divide ICs into FECG, noise and MECG groups. Next, we will focus on robustness of our method.
REFERENCES
[1] C. Jutten, J. Herault, “Blind separation of sources, part I: An adaptive algorithm based on neuromimetic architecture,” Signal Processing, vol. 24(1), pp. 1-10, 1991.
[2] C. Jutten, J. Herault, “Blind separation of sources, part II: Problems statement,” Signal Processing, vol. 24(1), pp. 11-20, 1991.
[3] N. J. Outram, E. C. Ifeachor, P. W. J. Van Eetvelt, J. S. H. Curnow, “Techniques for optimal enhancement and feature extraction of fetal electrocardiogram,” IEE Proceedings - Science, Measurement and Technology, vol. 142(6), pp. 482-489, 1995.
[4] Datian Ye, Xuemei Ouyang, “Application of wavelet analysis in detection of fetal ECG,” 18th Annual Intel national Conference of the IEEE Engineering in Medicine and Biology Society, vol. 3, pp. 1043-1044, 1996.
[5] V. Vigneron, A. Paraschiv-Ionescu, A. Azancot, O. Sibony, C. Jutten, “Fetal electrocardiogram extraction based on non-stationary ICA and wavelet denoising,” 7th International Symposium on Signal Processing and Its Applications, vol. 2, pp. 69-72, 2003
[6] C. Kezi Selva Vijila, P. Kanagasabapathy, S. Johnson, K. Rajasekaran, “Interference Cancellation in FECG using Artificial Intelligence Techniques,” 4th International Conference on Intelligent Sensing and Information Processing (ICISIP), pp. 174-177, 2006.
[7] J. Behar, F. Andreotti, J. Oster, G. D. Clifford, “A Bayesian Filtering Framework for accurate extracting of the non-invasive FECG morphology,” Computing in Cardiology Conference (CinC), pp. 53-56, Sep. 2014.
[8] M. Niknazar, B. Rivet, C. Jutten, “Fetal ECG Extraction by Extended State Kalman Filtering Based on Single-Channel Recordings,” IEEE Transactions on Biomedical Engineering, vol. 60(5), pp. 1345-1352, 2013.
[9] M. S. Amin, Md. Mamun, F. H. Hashim and H. Husain, “Separation of fetal electrocardiography (ECG) from composite ECG using adaptive linear neural network for fetal monitoring,” International Journal of the Physical Sciences, vol. 6(24), pp. 5871 -5876, 2011.
[10] P. P. Kanjilal, S. Palit, G. Saha, “Fetal ECG extraction from single-channel maternal ECG using singular value decomposition,” IEEE Transactions on Biomedical Engineering, vol. 44(1), pp. 51-59, 1997.
[11] P. Comon, “Independent component analysis, A new concept?” Signal Processing, Special Issue on Higher Order Statistics, vol. 36(3), pp. 287-314, 1994.
[12] J. Cardoso, “Multidimensional independent component analysis,” Proceedings of the 1998 IEEE International Conference on Acoustics, Speech and Signal Processing (ICASSP), vol. 4, pp. 1941-1944, 1998.
[13] M. Haritopoulos, C. Capdessus, A. K. Nandi, “Foetal PQRST extraction from ECG recordings using cyclostationarity-based source separation method,” Annual International Conference of the IEEE Engineering in Medicine and Biology Society (EMBC), pp. 1910-1913, 2010.
[14] H. L. Hurd, “An investigation of periodically correlated stochastic processes,” PhD thesis in Duke University, 1970.
[15] J. Max, J. L. Lacoume, “Méthodes et techniques de traitement du signal et application aux mesures physiques,” Tome 1: Principes généraux et méthodes classiques, fifth ed, 1996.
[16] J. F. Cardoso, A. Souloumiac, “Blind beamforming for non-Gaussian signals,” IEE Proceedings F in Radar and Signal Processing, vol. 140(6), pp. 362-370, 1993.
[17] A. Belouchrani, K. Abed-Meraim, J. Cardoso, E. Moulines, “A Blind Source Separation Technique Using Second-Order Statistics,” IEEE Transactions on Signal Processing, vol. 45(2), pp. 434 – 444, 1997.
[18] A. Hyvarinen, “Fast and robust fixed-point algorithms for independent component analysis,” IEEE Transactions on Neural Networks, vol. 3(10), pp. 626-634, 1999.
[19] K. U. Leuven. DaISy, ESAT/SISTA, 1999, Database for the Identification of Systems at http://homes.esat.kuleuven.be/~smc/daisy/
[20] M. Haritopoulos, J. Roussel, C. Capdessus, A. K. Nandi, “Cyclostationarity-Based Estimation of the Foetus Subspace Dimension from ECG Recordings,” XIII Mediterranean Conference on Medical and Biological Engineering and Computing, series IFMBE Proceedings, vol. 41, pp. 726-729, 2013.
[21] V. Zarzoso, A. K. Nandi, E. Bacharakis, “Maternal and foetal ECG separation using blind source separation density function,” IMA Journal of Mathematics Applied in Medicine & Biology, vol. 14(3), pp. 207-225, 1997.
[22] S. Abrar, A. K. Nandi, “Independent component analysis: Jacobi-like diagonalization of optimized composite-order cumulants,” Proceedings of the Royal Society A, vol. 465(2105), pp. 1393-1411, 2009.
[23] V. Zarzoso, J. J. Murillo-Fuentes, R. Boloix-Tortosa; A. K. Nandi, “Optimal Pairwise Fourth-Order Independent Component Analysis,” IEEE Transactions on Signal Processing, vol. 54(8), pp. 3049-3063, 2006.
[24] V. Zarzoso, A. K. Nandi, “Blind separation of independent sources for virtually any source probability density function,” IEEE Transactions on Signal Processing, vol. 47(9), pp. 2419-2432, 1999.
[25] A. K. Nandi, V. Zarzoso, “Fourth-order cumulant based blind source separation,” IEEE Signal Processing Letters, vol. 3(12), pp. 312-314, 1996.
[26] C. Capdessus, A. K. Nandi, “Extraction of a cyclostationary source using a new cost function without pre-whitening,” Signal Processing, vol. 91(11), pp. 2497-2505, 2011.
[27] F. J. Theis, “Multidimensional independent component analysis using characteristic funtions,” Proceedings of the 13th European Signal Processing Conference (EUSIPCO 2005), Sept. 4-8, Antalaya, Turkey, pp. 1-4, 2005.
[28] F. Castells, C. Mora, J. Millet, J. J. Rieta, C. Sanchez, J. M. Sanchis, “Multidimensional ICA for the Separation of Atrial and Ventricular Activities from Single Lead ECGs in Paroxysmal Atrial Fibrillation Episodes,” Proceedings of the Fifth International Conference on Independent Component Analsysi and Blind Signal Separation (ICA 2004), Sept. 22-24, Granada, Spain, pp. 1230-1236.
[29] J. L. Camargo-Olivares, R. Martin-Clemente, S. Hornillo-Mellado, M. M. Elena, I. Roman, “The Maternal Abdominal ECG as Input to MICA in the Fetal ECG Extraction Problem,” IEEE Signal Processing Letters, vol. 18(3), pp. 161-164, 2011.
2016 24th European Signal Processing Conference (EUSIPCO)
2064


![Fetal ECG Subspace Estimation Based on Cyclostationarity · 2016. 9. 9. · approaches, such as Bayesian filter [7], Kalman filter [8] (specifically for linear model assumption),](https://img.dokumen.tips/doc/110x75/5fe2f83e36218a2f820501e2/fetal-ecg-subspace-estimation-based-on-cyclostationarity-2016-9-9-approaches.jpg)


![[2] Statistical Tests for Presence of Cyclostationarity](https://img.dokumen.tips/doc/110x75/552684c54a7959dc0b8b4572/2-statistical-tests-for-presence-of-cyclostationarity.jpg)