Embed Size (px)
Citation preview
Ferrel cell
Ferrel cell
Ferrel cell
Hadley cell
Ferrel cell
Polar cell
The Physical Environment
Image from NASA
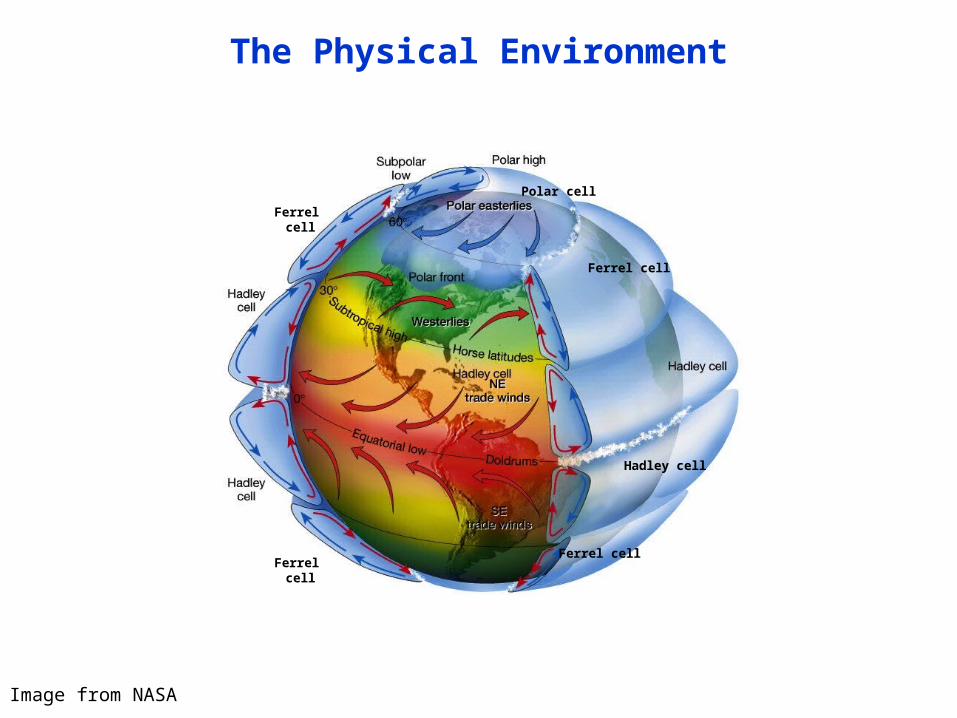
Joseph GrinnellGrinnellian Niche “Habitat”
“The niche relationships of the California Thrasher” (1917)
“The ultimate distributional unit within which each species is held by its structural and instinctive limitations" (1928)
The Ecological Niche
Photos of Grinnell and California Thrasher from Wikimedia Commons
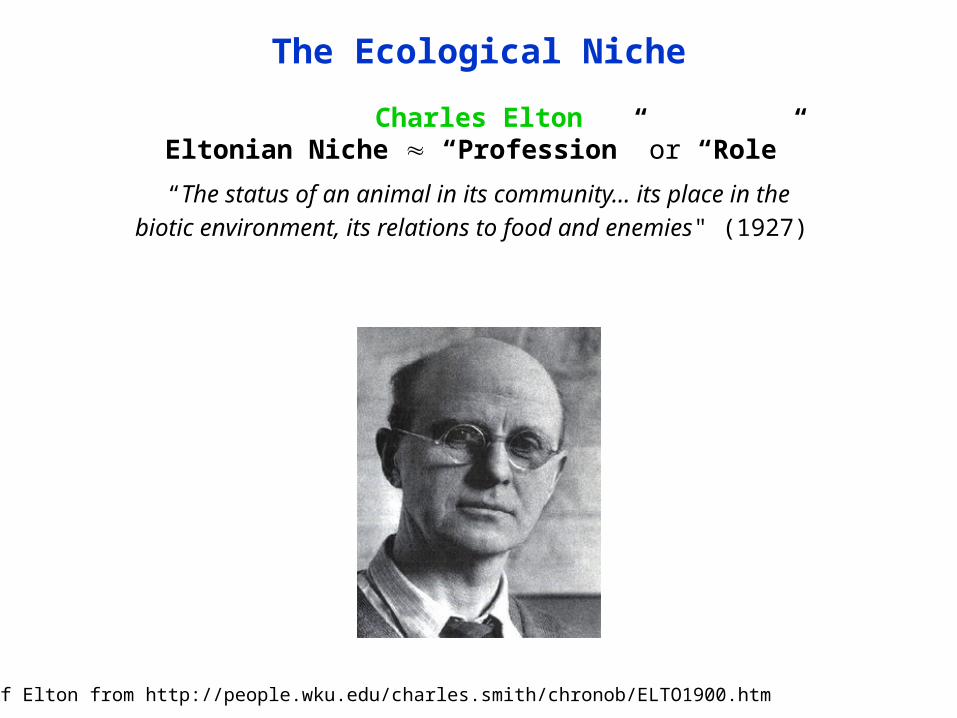
Charles EltonEltonian Niche “Profession” or “Role”
“The status of an animal in its community… its place in the
biotic environment, its relations to food and enemies" (1927)
The Ecological Niche
Photo of Elton from http://people.wku.edu/charles.smith/chronob/ELTO1900.htm
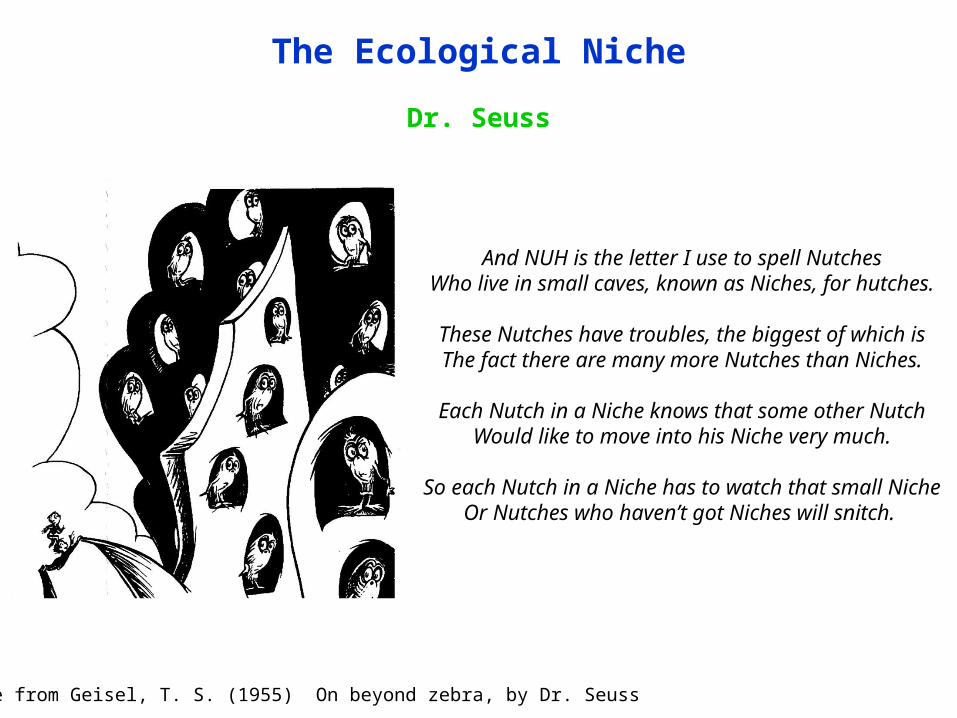
Dr. Seuss
The Ecological Niche
And NUH is the letter I use to spell NutchesWho live in small caves, known as Niches, for hutches.
These Nutches have troubles, the biggest of which isThe fact there are many more Nutches than Niches.
Each Nutch in a Niche knows that some other NutchWould like to move into his Niche very much.
So each Nutch in a Niche has to watch that small NicheOr Nutches who haven’t got Niches will snitch.
Image from Geisel, T. S. (1955) On beyond zebra, by Dr. Seuss

G. Evelyn HutchinsonHutchinsonian Niche = “n-dimensional hypervolume”
“an n-dimensional hypervolume… defined on axes [representing] all of the ecological factors relative to [the species]… [and] every point in which
corresponds to a state of the environment which [permits]…the species… to exist indefinitely” (1958)
The Ecological Niche
Photo of Hutchinson from http://peabody.yale.edu/collections/archives/biography/g-evelyn-hutchinsonFigure image from http://www.eplantscience.com/index/general_zoology/environment_and_the_niche.php
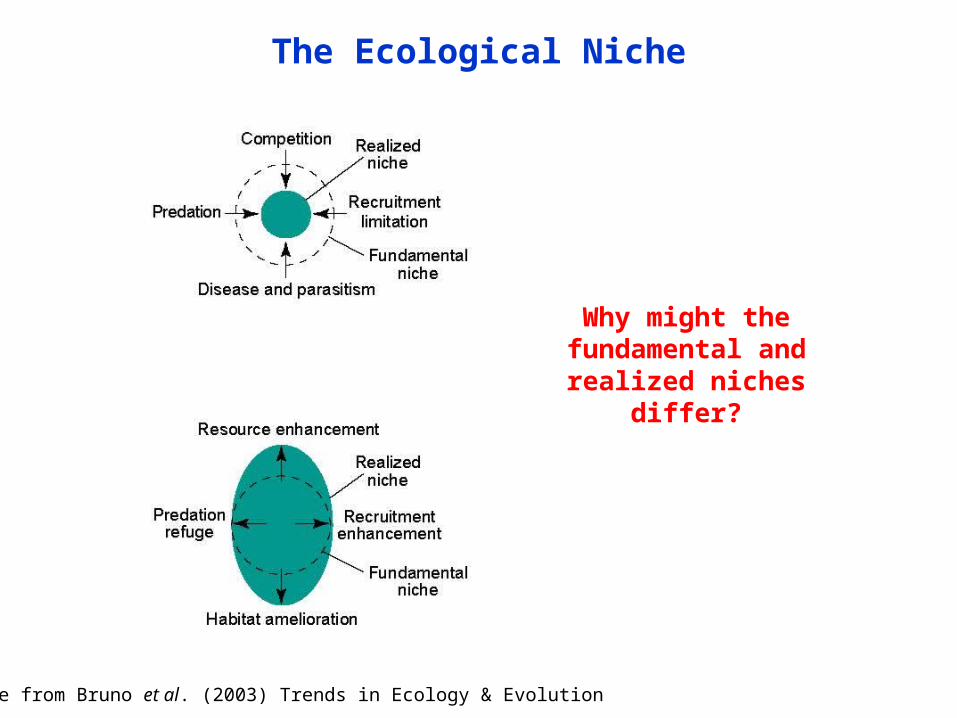
The Ecological Niche
Figure from Bruno et al. (2003) Trends in Ecology & Evolution
Why might the fundamental and
realized niches differ?
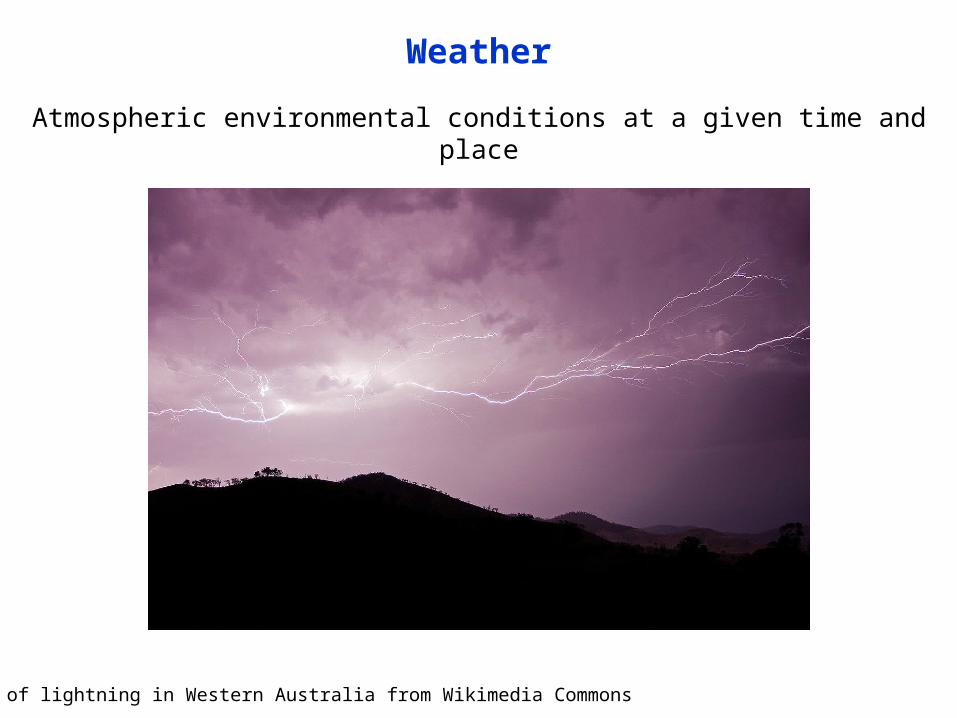
Atmospheric environmental conditions at a given time and place
Weather
Photo of lightning in Western Australia from Wikimedia Commons
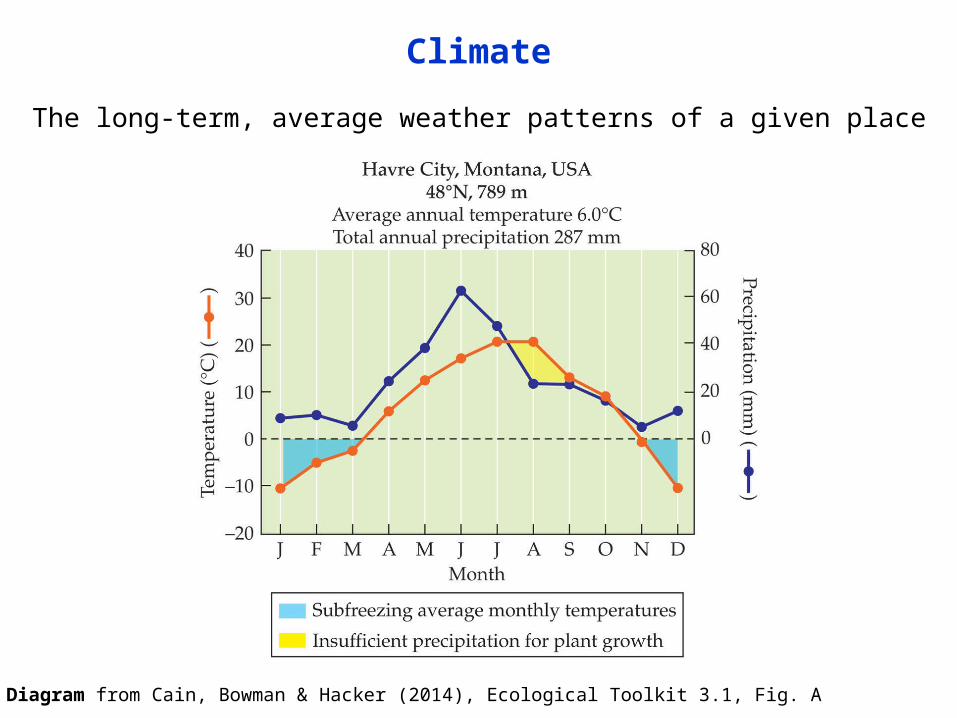
The long-term, average weather patterns of a given place
Climate
Climate Diagram from Cain, Bowman & Hacker (2014), Ecological Toolkit 3.1, Fig. A
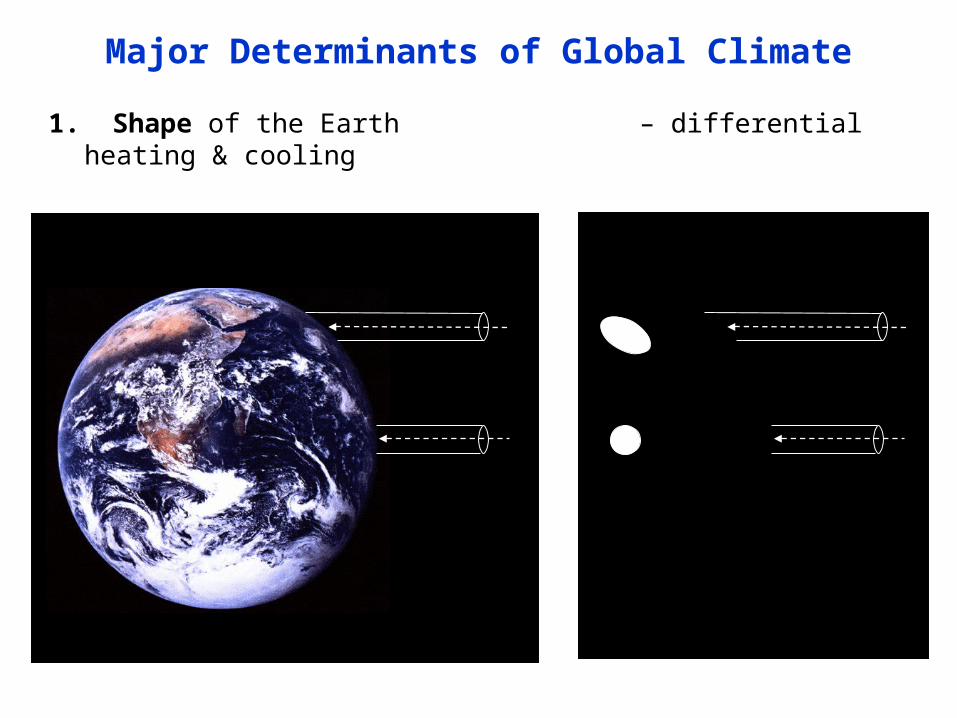
– differential heating & cooling1. Shape of the Earth
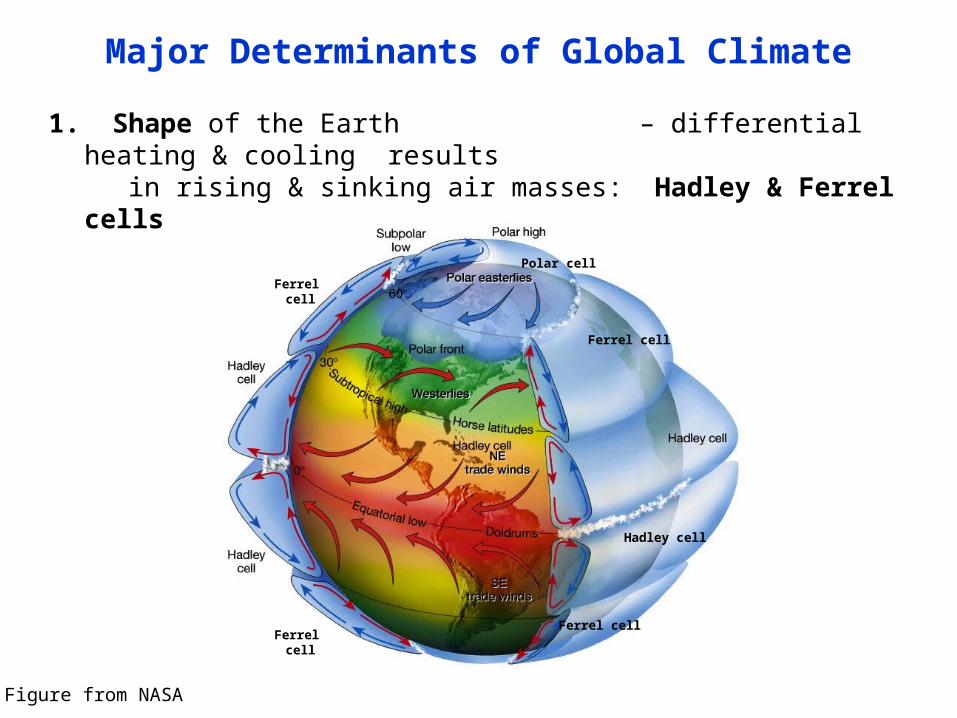
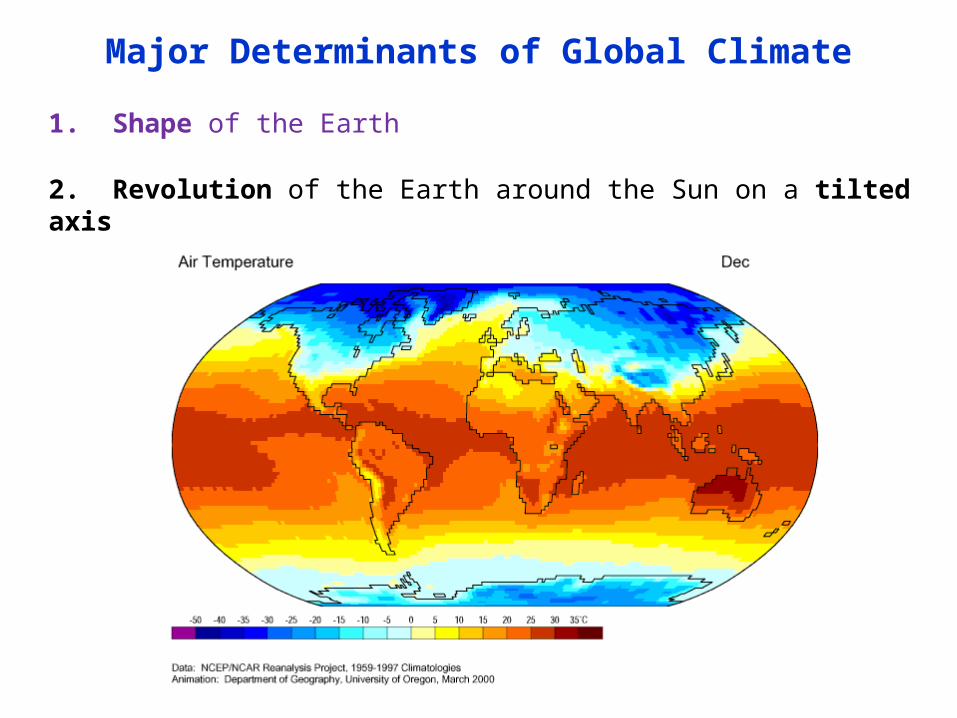
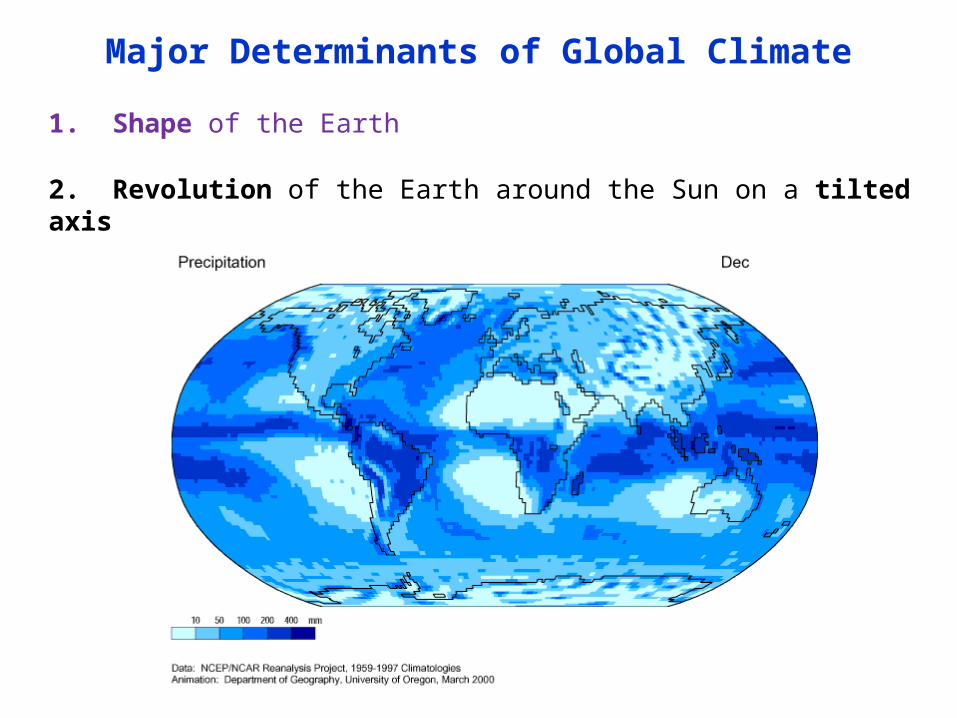
Major Determinants of Global Climate
1. Shape of the Earth
Ferrel cell
Ferrel cell
Ferrel cell
Hadley cell
Ferrel cell
Polar cell
– differential heating & cooling results in rising & sinking air masses: Hadley & Ferrel cells
Major Determinants of Global Climate
Figure from NASA
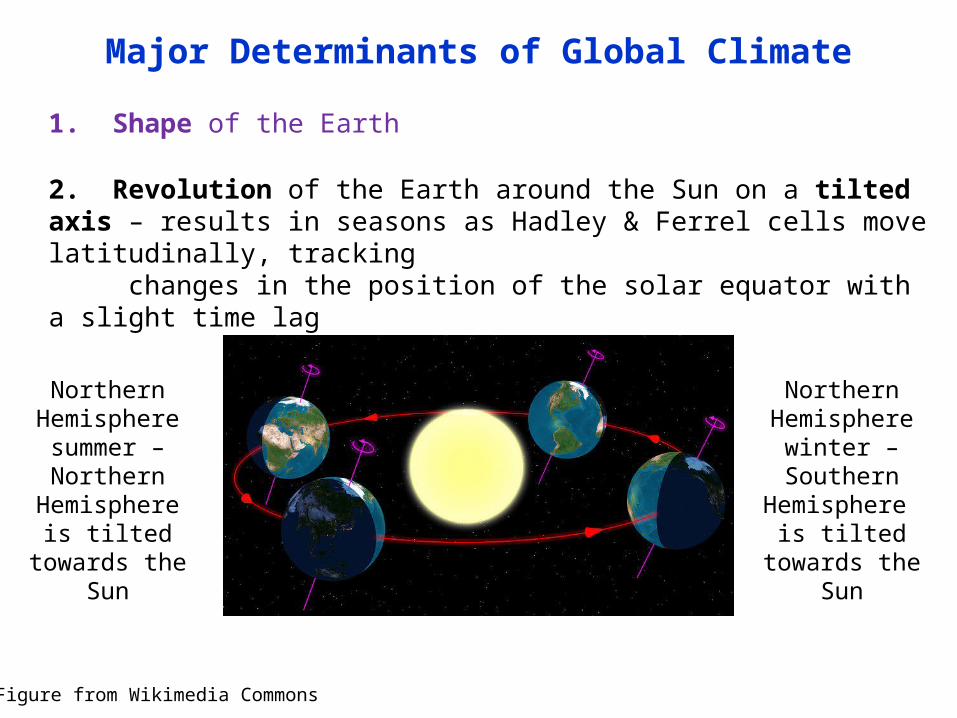
– results in seasons as Hadley & Ferrel cells move latitudinally, tracking changes in the position of the solar equator with a slight time lag
2. Revolution of the Earth around the Sun on a tilted axis
1. Shape of the Earth
Northern Hemisphere summer – Northern
Hemisphereis tilted towards
the Sun
Northern Hemisphere
winter – Southern
Hemisphere is tilted towards
the Sun
Major Determinants of Global Climate
Figure from Wikimedia Commons
2. Revolution of the Earth around the Sun on a tilted axis
1. Shape of the Earth
Major Determinants of Global Climate
2. Revolution of the Earth around the Sun on a tilted axis
1. Shape of the Earth
Major Determinants of Global Climate
3. Rotation of Earth on Earth’s axis Creates Coriolis effect (actually conservation of momentum) Currents in air and water are deflected right in
N. Hemisphere and left in S. Hemisphere
2. Revolution of the Earth around the Sun on a tilted axis
1. Shape of the Earth
Major Determinants of Global Climate
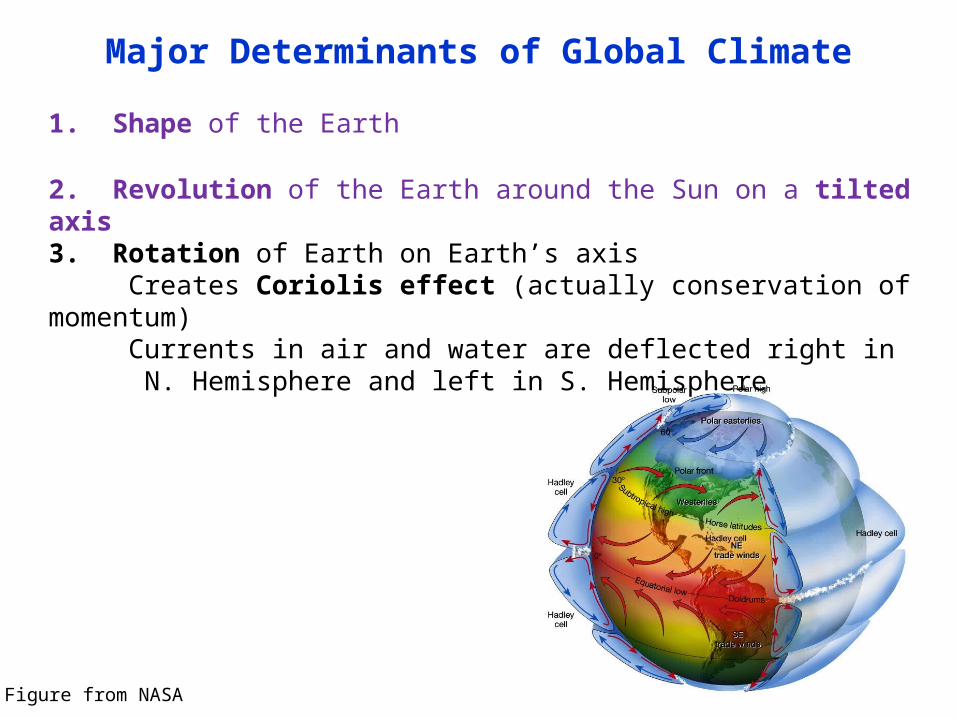
Figure from NASA
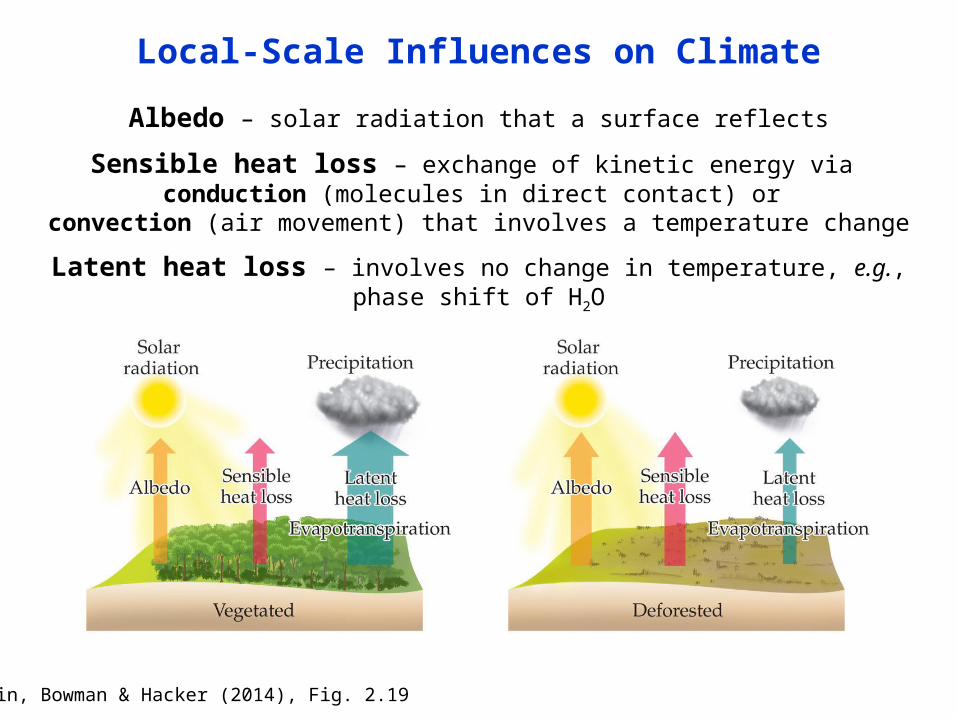
Albedo – solar radiation that a surface reflects
Local-Scale Influences on Climate
Cain, Bowman & Hacker (2014), Fig. 2.19
Sensible heat loss – exchange of kinetic energy via conduction (molecules in direct contact) or
convection (air movement) that involves a temperature change
Latent heat loss – involves no change in temperature, e.g., phase shift of H2O

Rainshadow
Local-Scale Influences on Climate
Cain, Bowman & Hacker (2014), Fig. 2.18
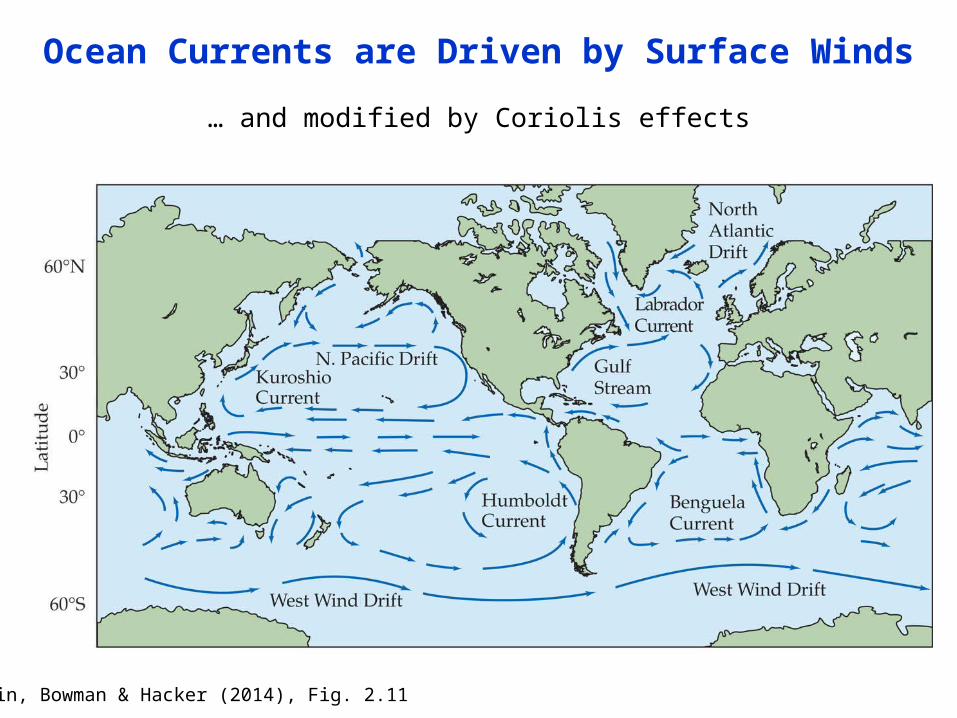
… and modified by Coriolis effects
Ocean Currents are Driven by Surface Winds
Cain, Bowman & Hacker (2014), Fig. 2.11
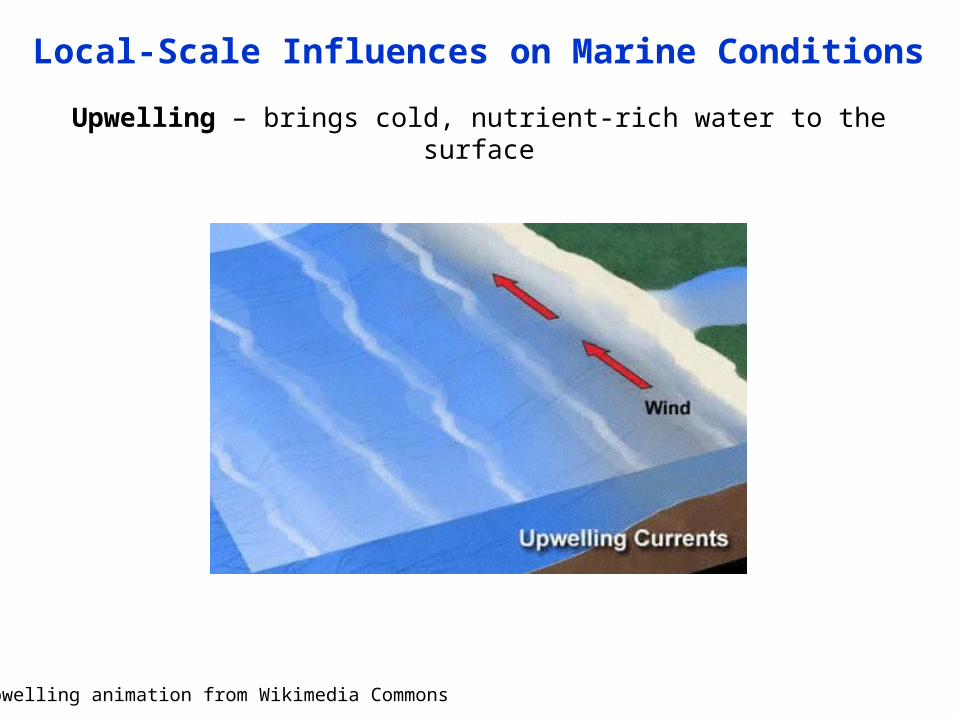
Upwelling – brings cold, nutrient-rich water to the surface
Local-Scale Influences on Marine Conditions
Upwelling animation from Wikimedia Commons
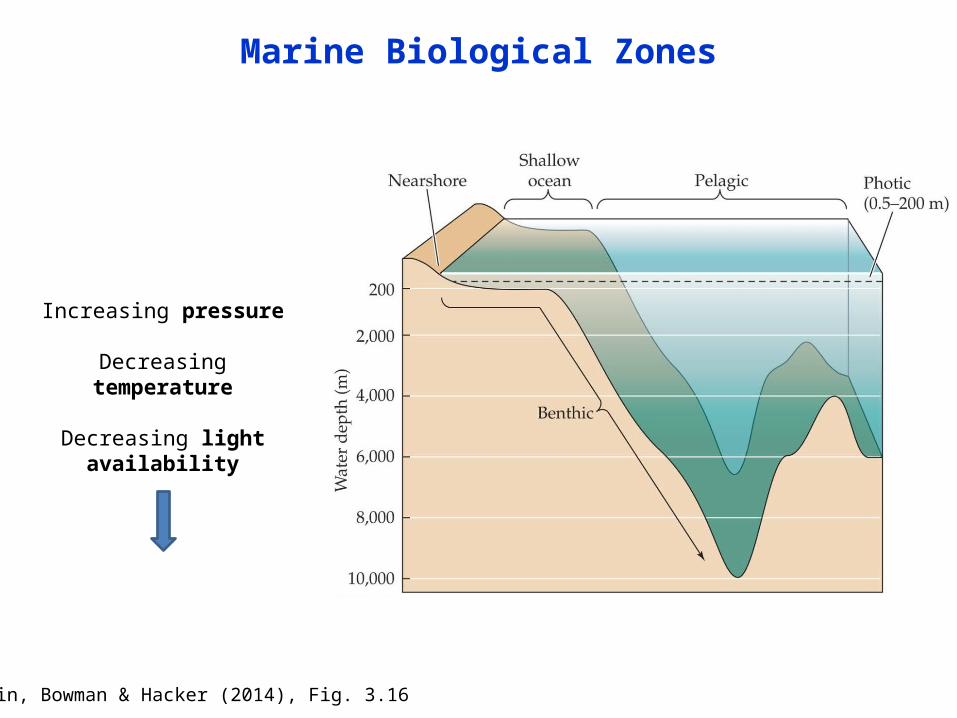
Marine Biological Zones
Cain, Bowman & Hacker (2014), Fig. 3.16
Increasing pressure
Decreasing temperature
Decreasing light availability
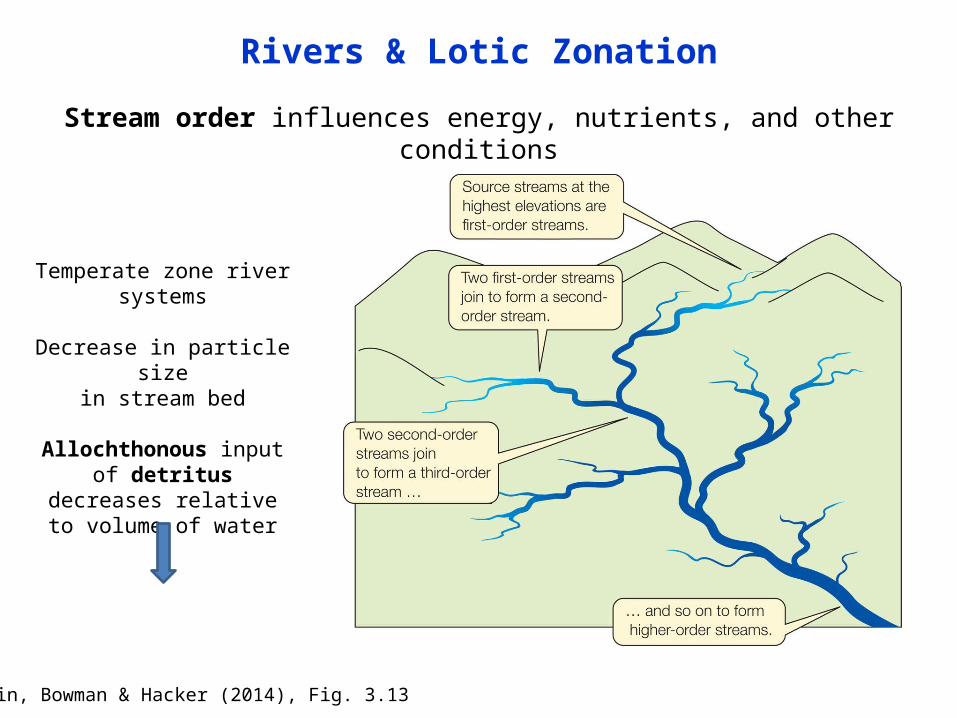
Stream order influences energy, nutrients, and other conditions
Rivers & Lotic Zonation
Cain, Bowman & Hacker (2014), Fig. 3.13
Temperate zone river systems
Decrease in particle sizein stream bed
Allochthonous input of detritus decreases relative
to volume of water
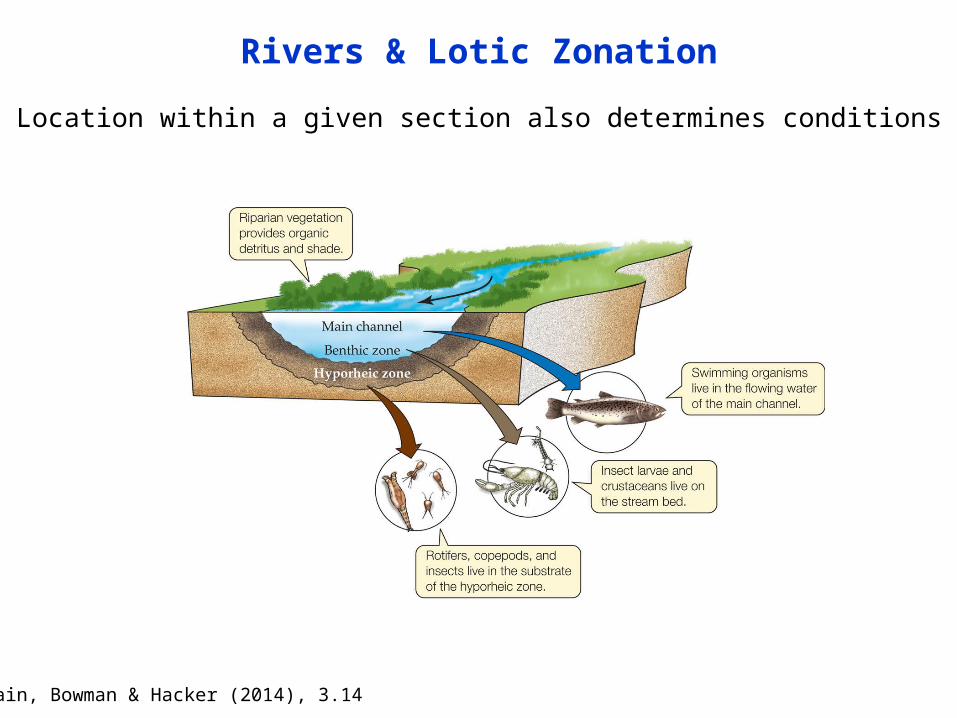
Rivers & Lotic Zonation
Cain, Bowman & Hacker (2014), 3.14
Location within a given section also determines conditions
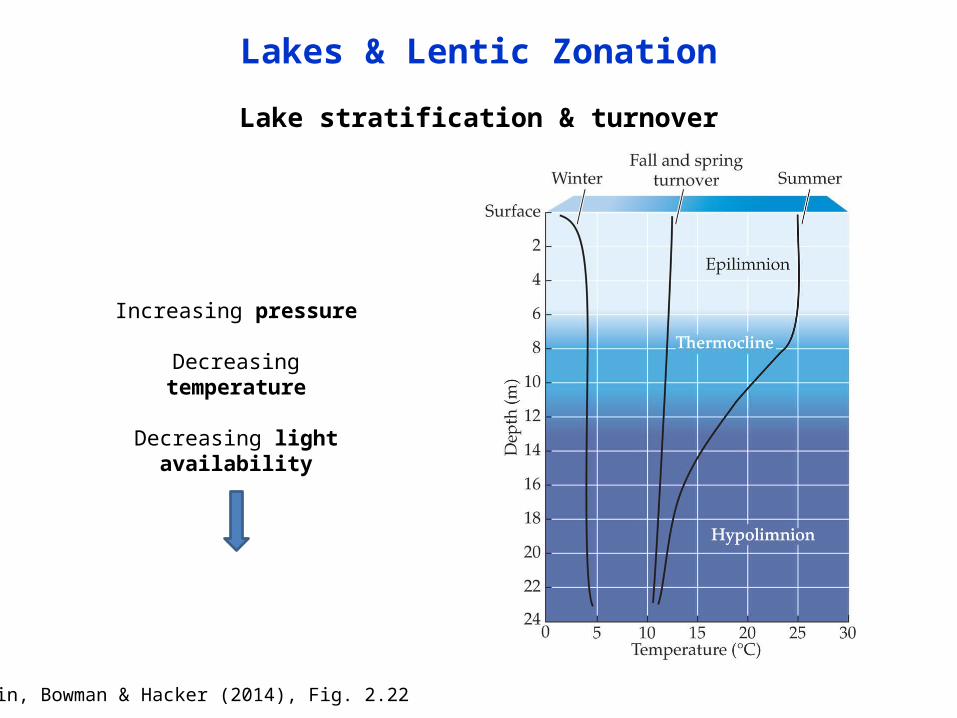
Lake stratification & turnover
Lakes & Lentic Zonation
Cain, Bowman & Hacker (2014), Fig. 2.22
Increasing pressure
Decreasing temperature
Decreasing light availability
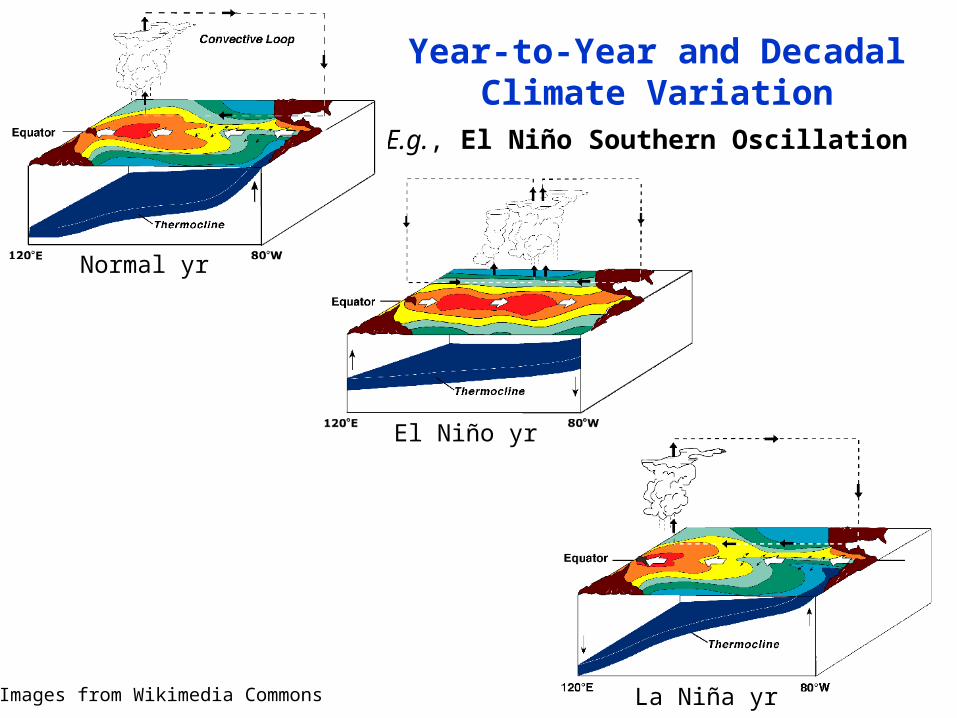
E.g., El Niño Southern Oscillation
Images from Wikimedia Commons
Year-to-Year and Decadal Climate Variation
Normal yr
El Niño yr
La Niña yr
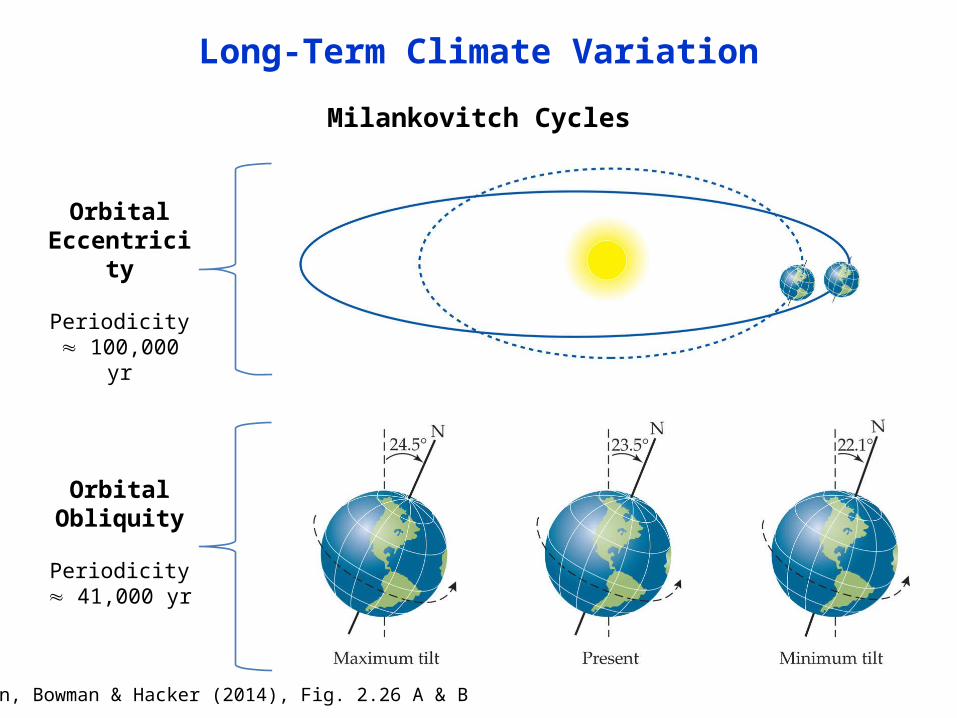
Milankovitch Cycles
Long-Term Climate Variation
Cain, Bowman & Hacker (2014), Fig. 2.26 A & B
Orbital Eccentricity
Periodicity 100,000 yr
Orbital Obliquity
Periodicity 41,000 yr
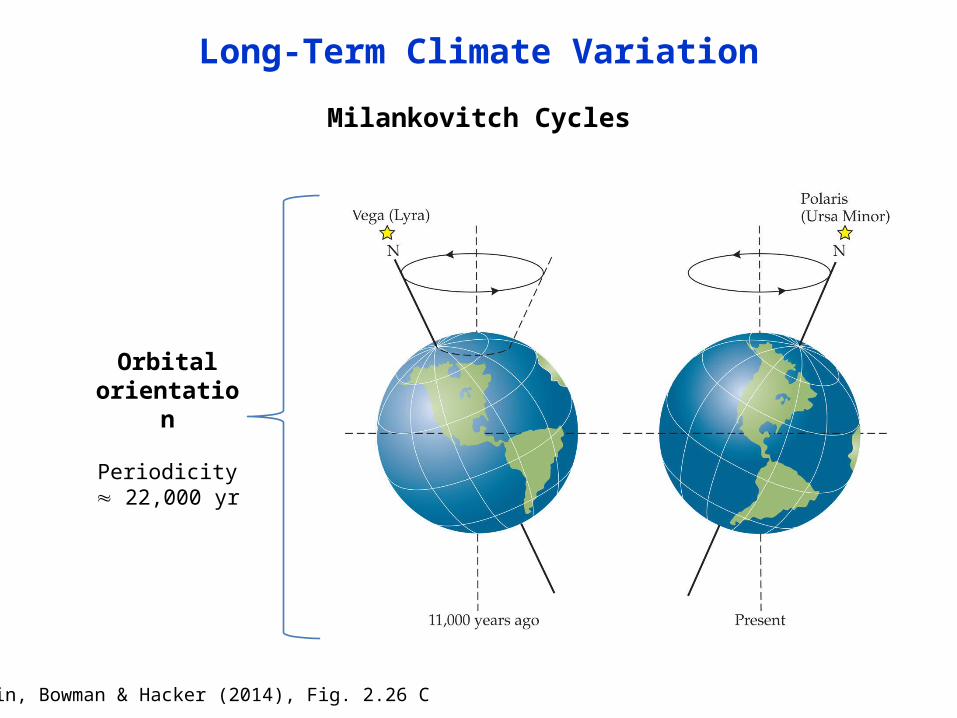
Milankovitch Cycles
Long-Term Climate Variation
Cain, Bowman & Hacker (2014), Fig. 2.26 C
Orbital orientation
Periodicity 22,000 yr
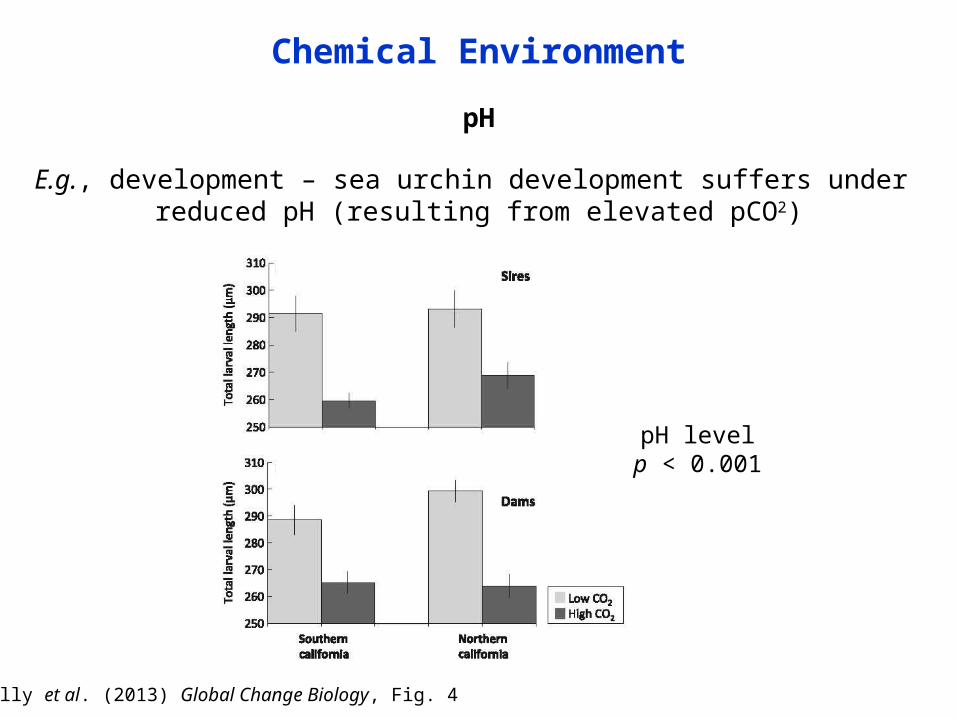
pH
Chemical Environment
Kelly et al. (2013) Global Change Biology, Fig. 4
E.g., development – sea urchin development suffers under reduced pH (resulting from elevated pCO2)
pH levelp < 0.001
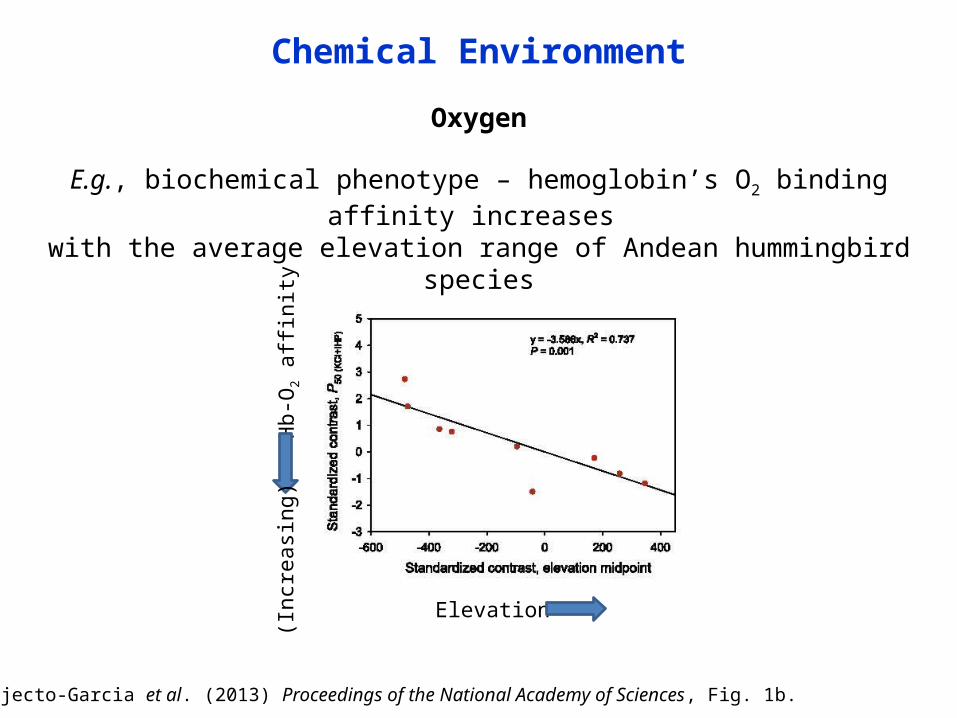
Oxygen
Chemical Environment
Projecto-Garcia et al. (2013) Proceedings of the National Academy of Sciences, Fig. 1b.
E.g., biochemical phenotype – hemoglobin’s O2 binding affinity increases with the average elevation range of Andean hummingbird species
Elevation
Hb-
O2
affin
ity(I
ncre
asin
g)
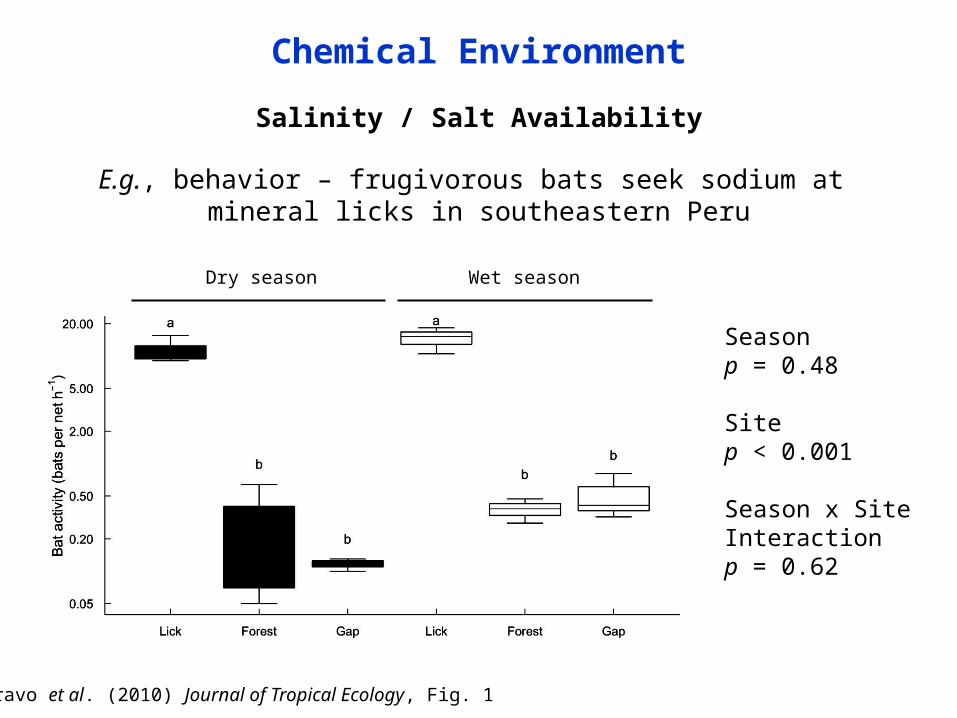
Salinity / Salt Availability
Bravo et al. (2010) Journal of Tropical Ecology, Fig. 1
Chemical Environment
Dry season Wet season
Seasonp = 0.48
Site p < 0.001
Season x SiteInteraction p = 0.62
E.g., behavior – frugivorous bats seek sodium at mineral licks in southeastern Peru