Embed Size (px)
Citation preview
436 IEEE TRANSACTIONS ON AUTOMATION SCIENCE AND ENGINEERING, VOL. 9, NO. 2, APRIL 2012
Feedback Matching Framework for SemanticInteroperability of Product Data
Il Yeo, Lalit Patil, Member, IEEE, and Debasish Dutta, Fellow, IEEE
Abstract—There is a need to promote drastically increased levels of inter-operability of product data across a broad spectrum of stakeholders, whileensuring that the semantics of product knowledge are preserved, and whennecessary, translated. In order to achieve this, multiple methods have beenproposed to determine semantic maps across concepts from different rep-resentations. Previous research has focused on developing different indi-vidual matching methods, i.e., ones that compute mapping based on a singlematching measure. These efforts assume that some weighted combinationcan be used to obtain the overall maps. We analyze the problem of com-bination of multiple individual methods to determine requirements spe-cific to product development and propose a solution approach called FEed-back Matching Framework with Implicit Training (FEMFIT). FEMFITprovides the ability to combine the different matching approaches usingranking Support Vector Machine (ranking SVM). The method accounts fornonlinear relations between the individual matchers. It overcomes the needto explicitly train the algorithm before it is used, and further reduces thedecision-making load on the domain expert by implicitly capturing the ex-pert’s decisions without requiring him to input real numbers on similarity.We apply FEMFIT to a subset of product constraints across a commercialsystem and the ISO standard. We observe that FEMIT demonstrates betteraccuracy (average correctness of the results) and stability (deviation fromthe average) in comparison with other existing combination methods com-monly assumed to be valid in this domain.
Note to Practitioners—This paper was motivated by the problem ofautomating the exchange of meaning associated with the data, amongdifferent software systems or information resources in product develop-ment. More specifically, it focuses on automatically determining the mapsbetween the concepts from participating system, which is required toensure that the final physical translation is accurate. Existing approacheseither focus on one aspect of product information or a weighted sum ofdifferent aspects. However, there is no formal ground to choose a specificmethod. Furthermore, as we show in this paper, these approaches areunlikely to find the correct matches because of the inherent nonlinearity.We propose a framework, FEMFIT, in which multiple matching methodsare automatically combined using inputs from experts obtained throughan intuitive, Google search-like, interface. It is evaluated by comparingwith known matching methods and FEMFIT shows better matchingaccuracy on the example cases. Future work focuses on extending the workto handle m:n matches.
Index Terms—Concept matching, product lifecycle management (PLM),ranking support vector machine (SVM), semantic interoperability.
I. BACKGROUND AND MOTIVATION
Globalization has led to an increasing emphasis on unifying theknowledge-intensive, distributed, and cross-functional product de-
Manuscript received June 01, 2011; accepted September 15, 2011. Date ofpublication November 09, 2011; date of current version April 03, 2012. Thispaper was recommended for publication by Associate Editor S. G. Ponnam-balam and Editor Y. Narahari upon evaluation of the reviewers’ comments. Thiswork was supported in part by the E. William and J. Marr Gutgsell Professor-ship at the University of Illinois, the University of Michigan’s PLM Alliance,and the National Science Foundation under Grant CMMI-0653838. Any opin-ions, findings, and conclusions or recommendations expressed in this materialare those of the authors and do not necessarily reflect the views of the NationalScience Foundation.
I. Yeo is with Microsoft Corporation, Redmond, WA 98052 USA (e-mail:[email protected]).
L. Patil and D. Dutta are with the Department of Mechanical Science andEngineering, University of Illinois, Urbana–Champaign, IL 61820-5711 USA(e-mail: [email protected]; [email protected]).
Color versions of one or more of the figures in this paper are available onlineat http://ieeexplore.ieee.org.
Digital Object Identifier 10.1109/TASE.2011.2171950
velopment and manufacturing activities. This has led to the visionof Product Lifecycle Management (PLM) as a business strategy thatviews all the activities as one product-centric enterprise, and not as aset of silo-ed processes. Ameri and Dutta [1] discuss several aspectsof PLM and synthesize that it is “a computational framework whicheffectively enables capture, representation, retrieval, and reuse ofproduct knowledge.” The overall idea of PLM is to use emergingsoftware technologies in areas, such as knowledge management andweb-based collaboration to facilitate innovation through integration,i.e., by allowing effective product data interoperability and seamlesscollaboration between various functions of the enterprise.
Geographic, functional, and cultural boundaries between the teamshave prevented the development of a single neutral tool to support theentire product development activity. This has led to the developmentand use of a wide variety of “best-in-class” software tools that stake-holders use to study and enhance the product from their own perspec-tive in the best possible way. Conservative estimates in a study by theNational Institute of Standards and Technology (NIST) suggest thatimperfect interoperability costs at least one billion dollars per year tothe United States Automotive Supply Chain [2]. The majority of thesecosts are due to resources spent in correcting and recreating data that isnot usable by the receiving applications. This inability to use translatedproduct information is mainly because its semantics are lost during thetranslation, i.e., due to the lack of semantic interoperability.
The Automated Methods for Integrating Systems (AMIS) project [3]at NIST envisions the reduction of cost and time for product develop-ment software integration by devising automated techniques to enableinteroperability. The approach consists of three key steps.
• Capturing product development data in representations in a formsuitable for machine reasoning
• Automatically identifying semantic maps, i.e., matching conceptsto ensure that the semantics are appropriately preserved or trans-lated, across the different representations
• Implementing the semantic maps to enable physical translationacross different representations
In the product development domain, researchers, such as Subrah-manian et al. [4] from the NIST have documented the role of formalrepresentations. Major commercial vendors are working on developingformal representations, such as PLM XML by Siemens and 3D XMLby Dassault Systèmes. Once appropriate representations are developed/obtained, the next phase is the determination of the semantic mapsacross different terms in the different representations.
The generation of appropriate semantic maps across the differentrepresentations is necessary to build tools that generate translationscorresponding to the mappings [3]. However, manual creation andmaintenance of semantic maps across the different representations isprohibitive due to the evolving nature, complexity, size, life-cycle widescope, and multitude of representations being developed and used.Product knowledge (product description, configuration, attributesand requirements), in contrast to text data, is not self-descriptive.It is structured and complex comprising multiple disparate objecttypes (features, function, tolerances, geometry, and so on) interactingthrough multiple complex relationships (e.g., part-of, hierarchical) [5].Even if a single neutral representation were to be used, the numbersof representations and the number and variety of terms in each ofthem, particularly, across domains, such as Computer-Aided Design(CAD) and Computer-Aided Manufacturing (CAM), makes manualdetermination of semantic maps prohibitive.
Thus, a decision-support tool that automatically provides the do-main expert with candidate matches is much desired. Standards or-ganizations, such as the NIST [3], focusing specifically on manufac-turing interoperabilty, and computer scientists, such as Noy et al. [6]
1545-5955/$26.00 © 2011 IEEE
IEEE TRANSACTIONS ON AUTOMATION SCIENCE AND ENGINEERING, VOL. 9, NO. 2, APRIL 2012 437
and Rahm et al. [7], in the broader field of data integration emphasizethat the second phase of automatically identifying semantic maps is akey requirement to enable semantic interoperability.
In an ideal case, a semantic map should be derived from an “equiv-alence” relation across the different terms in two representations. Patilet al. [8] have explained that in product development, two terms areequivalent if every instance of one term is a valid instance of the otherone. Such a definition of semantic equivalences potentially ensures thatthe creator’s intent (in instancing a term) during the creation/modifi-cation of a product is preserved in or translated to the other system.However, Patil [9] demonstrates through examples that, in product de-velopment, most of the terms mapping with each other agree on many,but not all properties. In addition, the number of properties in the defi-nitions of those terms may differ. Therefore, semantic maps have to bedetermined by calculating the approximate semantic similarity (insteadof equivalence) between the terms in different representations.
These semantic similarities can be calculated using a predefinedmetric (e.g., Dice coefficient, Jaccard coefficient) to compare a pre-defined set of properties (e.g., number of geometric features, name ofthe term). Individual matchers, i.e., ones that compute mapping basedon a single matching measure, do not capture all aspects of productdata, and therefore, cannot be used effectively. Furthermore, there isno formal basis to define a correct individual matcher. Therefore, thereis a need to combine multiple match results produced by differentmatchers to approximate the similarity, i.e., develop a “combined”matcher.
A few automated matching techniques, such as those proposed by[9]–[11] and discussed in Section II have been documented in theproduct development domain. However, these efforts focus on devel-oping different individual methods and then assume that a weightedcombination will provide the combined match. Such an approach isafterthought and inappropriate due to the inherent nonlinearity in thisdomain. Furthermore, these techniques output to the domain experta set of similarity values among the different terms. However, inthe product development domain, the mathematical values and thegeometric definitions of similarity are not intuitive, because formalmathematical models have not been developed for capturing humanperceptions.
In this paper, we analyze the problem of combining multiple indi-vidual matching methods and determine specific requirements, partic-ularly, the issue of nonlinearity, in this domain (see Section III). As a so-lution approach, Sections IV and V discuss FEedback Matching Frame-work with Implicit Training (FEMFIT), a framework which semi-au-tomates the process of determining semantic maps for product databased on Ranking SVM developed by Joachims [12]. FEMFIT not onlyaccounts for nonlinear relations between the individual matchers, butalso reduces the decision-making load on the domain expert by pro-viding her with a ranked list of candidate solutions, instead of simi-larity values. The domain expert’s decisions are implicitly captured asa feedback to adjust the matching results to her perception of correctmatches. In the absence of previous research and its results in this field,we evaluate FEMIT for accuracy (average correctness of the results)and stability (deviation from the average) by comparing with otherexisting combination methods commonly documented in the genericschema/ontology matching literature (Section VI).
II. RELATED WORK
Schema/Ontology matching has been actively researched, and anumber of techniques have been developed [6], [7], [13]. The readeris referred to [7] for a detailed review of various individual andcombined matching techniques. Only a few methods have focusedon combination of results from individual matchers. This sectionoverviews commonly used combination techniques to obtain the
combined similarity value from the results of individual matchers.The focus is on methods relevant to the product development domain.We classify the combination strategies into those that use a linearcombination and those that provide for a nonlinear combination of theindividual matchers.
A. Techniques for Linear Combination
The most common approach is that of combining using a weightedaverage in which the similarity values calculated by individual simi-larity measures are added with different weight values.
Patil [9] linearly combines two individual similarity measures forsemantic maps: one derived from a set-based comparison of axiomaticconcept/term descriptions and the other from the hierarchical natureof product representations. Lee et al. [10] determine maps from CADto Product Data Management (PDM) data using a weighted combina-tion of three individual similarities by comparing ontological conceptsusing: character strings, ontological definitions, and the Bayesian sim-ilarities obtained from the ontological structure. In these efforts, themain focus is on developing the different individual matchers whereasthe linear combination is used after the fact.
Except for some special cases, e.g., Max, Min and Average aggrega-tions as used in COMA [14], the success of weighted average dependsprimarily on the weight values assigned to each individual measures. Insome cases, e.g., [9] or [10], the decision is solely based on the experi-ence of the user. Machine learning has been used to formally determinethe weight values. For example, Doan et al. [15] use regression anal-ysis to fit the training data set where matching pairs are given value 1,and non-matching pairs are given a value of 0—the maximum and min-imum of the similarity value range. The weight values are determinedto minimize the training error.
B. Techniques for Nonlinear Combination
Zhang et al. [11] propose a sequential application of methods basedon concept names, class hierarchy, and class description. At a givenstage, only those concept pairs that have similarities above a certainthreshold are selected for further analysis by the next similarity metric.However, this special method is relevant only for the special case con-sidered by the authors.
Sheikholeslami et al. [16] used Neural Networks and Wang et al.[17] used the Support Vector Machine (SVM) to determine the combi-nation function instead of linear regression. Thus, they provide for thepossibility of nonlinear relations in the combination. We believe thischaracteristic is especially useful in product domain where conceptshave relatively complex relations, and the relations between the indi-vidual matching methods and the overall or combined similarity is notnecessarily linear.
For the above learning methods, the labels, i.e., match or non-match,are converted into a numeric value (1 and 0, respectively) for actualcalculation. In our previous work [18], however, we have shown thatsuch training input leads to biased training, i.e., all the pairs are biasedto the extreme value regardless of their actual similarity. For example,Extrusion in Unigraphics (UG), a CAD software, matches to Pad inCATIA, another CAD software. However, Extrusion also matches toPocket in CATIA and is not identical to neither Pad nor Pocket. Thus,setting similarity value 1 for the pair Extrusion—Pad will overestimatethe actual similarity. Likewise, Edge Blend in UG does not match toChamfer in CATIA, but they share many properties, e.g., based on edgeobject and requires one numeric value (radius or angle), and settingsimilarity 0 for this pair underestimates the actual similarity.
In order to reduce such estimation error, in [18], we proposed amatching method based on Support Vector Regression (SVR) in whichwe assign continuous values of ��� �� for training data, instead of 0 and1. The result has shown that SVR outperforms linear regression in terms
438 IEEE TRANSACTIONS ON AUTOMATION SCIENCE AND ENGINEERING, VOL. 9, NO. 2, APRIL 2012
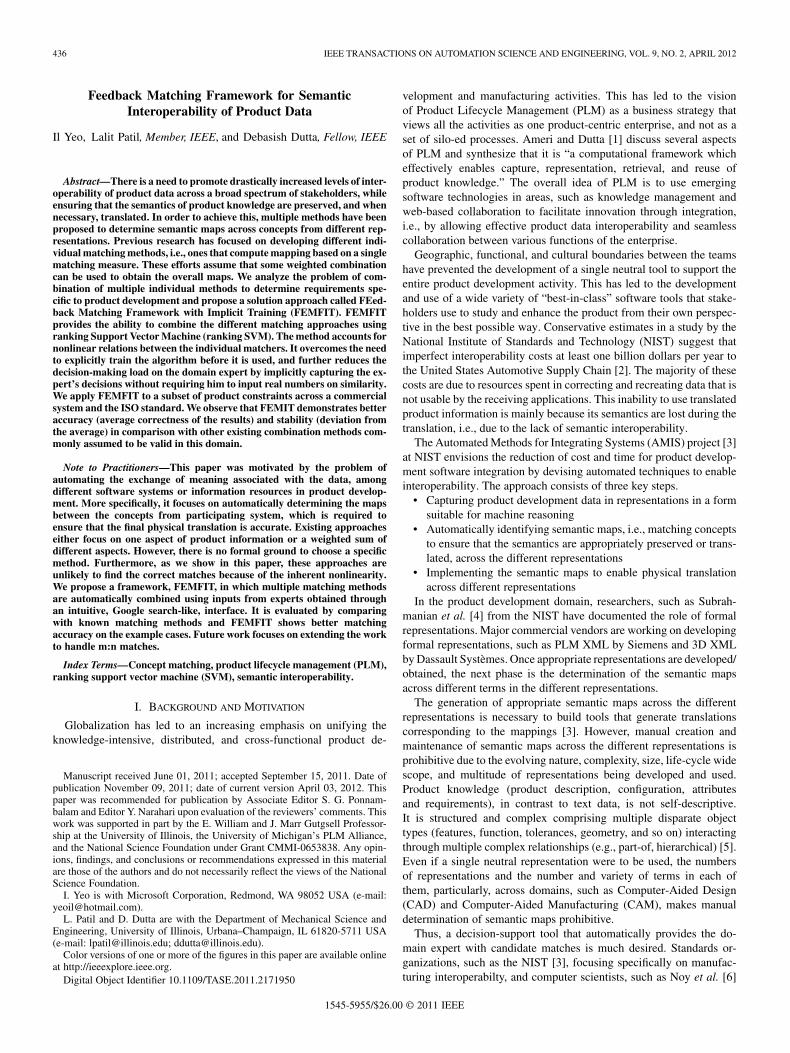
Fig. 1. Relation between an individual name similarity measure and the overall similarity measure on the constraint concepts in CATIA and UG. A nonlinearfunction is required to capture this relation correctly. (a) Some concepts representing 2D constraints in CATIA and UG. (b) Similarity values obtained by indi-vidual similarity, ��� using edit distance, and overall similarity ��� given by the expert. (c) Nonlinearity of overall similarity in the context of theindividual similarity.
of matching accuracy. However, an additional cost is that domain ex-perts are required to provide the actual similarity value, for which noformal basis is available, and it is difficult and nonintuitive as comparedto indicating a match or non-match.
C. Summary of the Related Work
The following are the broad limitations of existing combination tech-niques specifically applied to the product development domain.
• As we shall show in Section III, using linear combination is in-appropriate due to the inherent nonlinearity in this domain. Mostefforts however, have focused primarily on the development of in-dividual matchers and combining them using linear combinationmethods. We are not aware of efforts that provide an analysis ofthe requirements for the combination of individual matchers inthis domain.
• Efforts have focused on presenting a set of similarity values, i.e.,real numbers, representing a semantic map to the domain experts.Such values are not intuitive and domain experts cannot easilyassign a real value to their perception of similarity. Thus, there isa need for the method to present match results, and use inputs, ifrequired, in a way such that the domain experts find it more usableand acceptable.
In Section III, we describe the need to address nonlinearity forcombination.
III. NONLINEARITY IN COMBINATION
As explained earlier, multiple similarity measures are combined forbetter approximation of the semantic similarity; we call this combinedmeasure as combined or overall similarity. We claim that the overallsimilarity is not necessarily a linear combination of the individual sim-ilarities due to the following reasons
• Nonlinear relation between individual and combined sim-ilarity—Various contributors to the similarity may not benecessarily linearly-related to the overall similarity.For example, Fig. 1 demonstrates the issue in comparing con-cepts that capture 2D constraints across the CAD softwareCATIA and UGs. Relevant concepts in CATIA include Radius,
Tangency, while concepts in UG include Perpendicular, Equal-Radius, RadiusDim, Tangent, and others that are not shown inFig. 1(a) for readability. The individual similarity ���������is calculated using the edit distance developed by Wagner andFischer [19]. The overall similarity ������������ is obtainedfrom expert knowledge. Different pairs of concepts are denotedby ��� ��� � � �. These concepts and the results of individualsimilarity measures, as shown in Fig. 1(b).Fig. 1(c) plots the individual name-based similarity ���������against the overall similarity ������������ and showsthat ������� is not necessarily linear to ����������.We see that there is a certain threshold, approximately���������� � ��� ����� below (above) which the perceiveddifference between of the similarity values is not the mathemat-ical distance obtained by using the metric to obtain �������.Therefore, using a linear combination that includes �������
will not give an accurate representation of the overall semanticsimilarity.
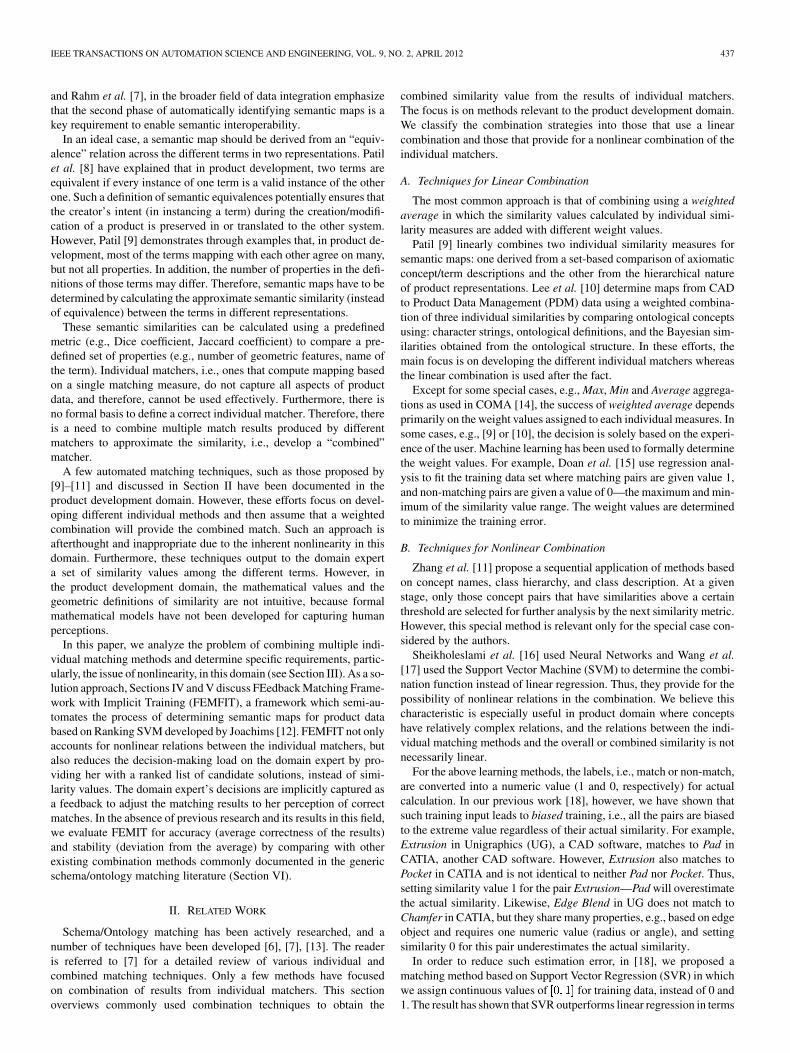
• Dependent measures—Several times, some individual similar-ities conditionally depend on other individual similarities. Theseconditional dependencies must be captured because they representsignificant semantic interrelationships. However, linear combina-tions cannot capture these relationships.For example, Fig. 2 shows two concepts, Parallelism in CATIAand Parallel in UG that restrict the relation between different geo-metric elements. Both apply to 2D and 3D objects. So, a name-based matcher indicates that they are very similar in every singleinstance (with a value of ������� � ���). However, this valueis insignificant in the absence of the similarity measure, ����
that captures the dimensionality of the space, viz., 2D or 3D. If���� � �, then the value of ������� is irrelevant. In otherwords, if the concepts are in different spaces, one in 2D and theother in 3D, then the overall similarity should be zero regardlessof values from other matchers.
• Similarity overlap—Different individual matchers might useoverlapping criteria to evaluate the individual similarities. There-fore, their results can have an overlap. Unless the overlap is
IEEE TRANSACTIONS ON AUTOMATION SCIENCE AND ENGINEERING, VOL. 9, NO. 2, APRIL 2012 439
Fig. 2. Conditional dependency of parallelism constraint in CATIA and parallel constraint in UG. The similarity measure that considers the dimension of thespace is necessary before considering the name-based similarity measure.
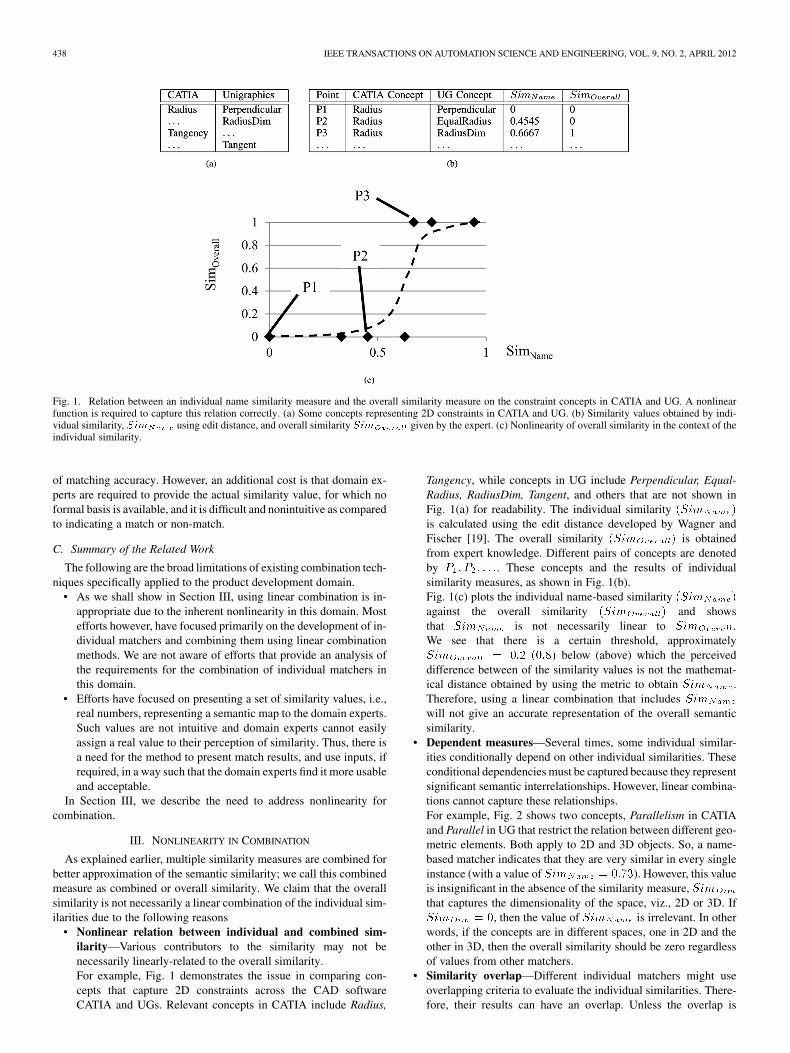
Fig. 3. Overview of FEMIT. Solid lines indicate the sequence of execution with necessary information flow, and the dotted lines indicate the flow of the additionaltraining data from the decision.
clearly identified and adjusted, the overall similarity can implic-itly overweight (underweight) the overlapped (nonoverlapping)criteria.
Weighted average, which is used in most matching problems, cannotaddress the challenges posed due to inherent nonlinearity as discussedpreviously.
In Sections IV–VII, we discuss the proposed FEMFIT to address theabove challenges in addition to those identified in Section II.
IV. OVERVIEW OF FEMFIT
Fig. 3 shows a schematic of FEMFIT. The inputs are the source andtarget concepts/terms from the sending and receiving system respec-tively. The framework works iteratively—in each iteration, a matchingtarget concept for one source concept is identified. The phrase “Feed-back Matching” is used to indicate that the expert feedback is used toadjust matching results to her perception of correct matches.
For each iteration, the system presents a ranked list of mapping targetconcepts for a given source concept to the domain expert who chooses/assigns the “true” match from this list. The higher the position of theselected concept, the better the performance of the system is. This issimilar to searching on the web, where the most appropriate searchresult is expected to be among the first few. Thus, the domain expert canfocus on only small number of high-ranked concepts to decide withouthaving to look all the way down to the lower ranked concepts.
The overall framework comprises the following three components(shown as shaded boxes in Fig. 3).
• Individual matchers: Calculating individual similarities—Foreach source concept, individual similarities are calculated with alltarget concepts. Multiple individual matchers are used to calculatethe (individual) similarities between the source concept and thetarget concepts. For � matchers, the output will be � arrays of size�; �th array’s �th element is a similarity value between the sourceconcept and �th concept in the target ontology using �th matcher(� is a number of target concepts).
• Combined matcher: Combining individual similarities usingRanking SVM—Ranking SVM [12], trained with the previousdecisions from domain expert, combines individual matcher’s re-sults (a set of arrays) into one array of overall similarity values;�th element in the array means the overall similarity between thegiven source concept and �th target concept. More details are pre-sented in Section V-B.
• Expert feedback: Finalizing the match—Finally, the domainexpert finalizes the decision on the matching (or equivalently,corresponding) concept based on the similarities calculated byRanking SVM. The concept the expert chooses, which may or
may not be the concept of the first rank in the list, is confirmed asthe matching concept for a given source concept, and the resultis provided as a feedback to the learning algorithm. Thus, theframework considers expert feedback to adjust matching resultsto her perception of correct matches. More details are presentedin Section V-C.
Section V explains each component in detail.
V. COMPONENTS OF FEMFIT
A. Individual Matchers: Calculating Individual Similarities
Individual matchers calculate the similarity between two conceptswith respect to one specific aspect, e.g., name or hierarchical infor-mation. In this paper, we do not propose or recommend any individualmatcher. Literature documents various matchers specific to the productdomain [9]–[11], [18] as well as more generic ones [6], [7], [13].
The domain expert chooses a set of individual matchers to use. How-ever, the selection process itself requires expertise in matching algo-rithms which the domain experts in product development systems maynot have. With conventional techniques like weighted average (some-times called linear combination), adding more matchers requires morework—to make sure that the matcher does not at least degrade theoverall performance, and to decide the weight value for the matcher.
With FEMFIT (as will be shown in the evaluation in Section VI),however, adding more matchers does not increase any effort towardthe domain expert because it trains itself with the exactly same input.In addition, even the poor matchers do not degrade the overall perfor-mance as compared to other combination methods.
Section VI discusses how individual measures are combined usingRanking SVM.
B. Combined Matcher: Combining Individual Similarities UsingRanking SVM
To combine the multiple measures from individual matchers, we useRanking SVM. Given the multiple source and target concept pairs, thealgorithm will output a ranked list with similarity values for all thepairs. Thus, for each source concept the number of possible pairs isthe number of target concepts. In this section, we will first review thebasic idea of Ranking SVM, and then explain how it is used to combinethe individual matchers to determine maps across concepts in productontologies.
It should be noted that some of the terms from the standard descrip-tion of SVM presented in [12] have been changed for brevity and sim-plicity of description in the context of product concept matching. How-ever, FEMFIT does not change any parts of the SVM ranking explained
440 IEEE TRANSACTIONS ON AUTOMATION SCIENCE AND ENGINEERING, VOL. 9, NO. 2, APRIL 2012
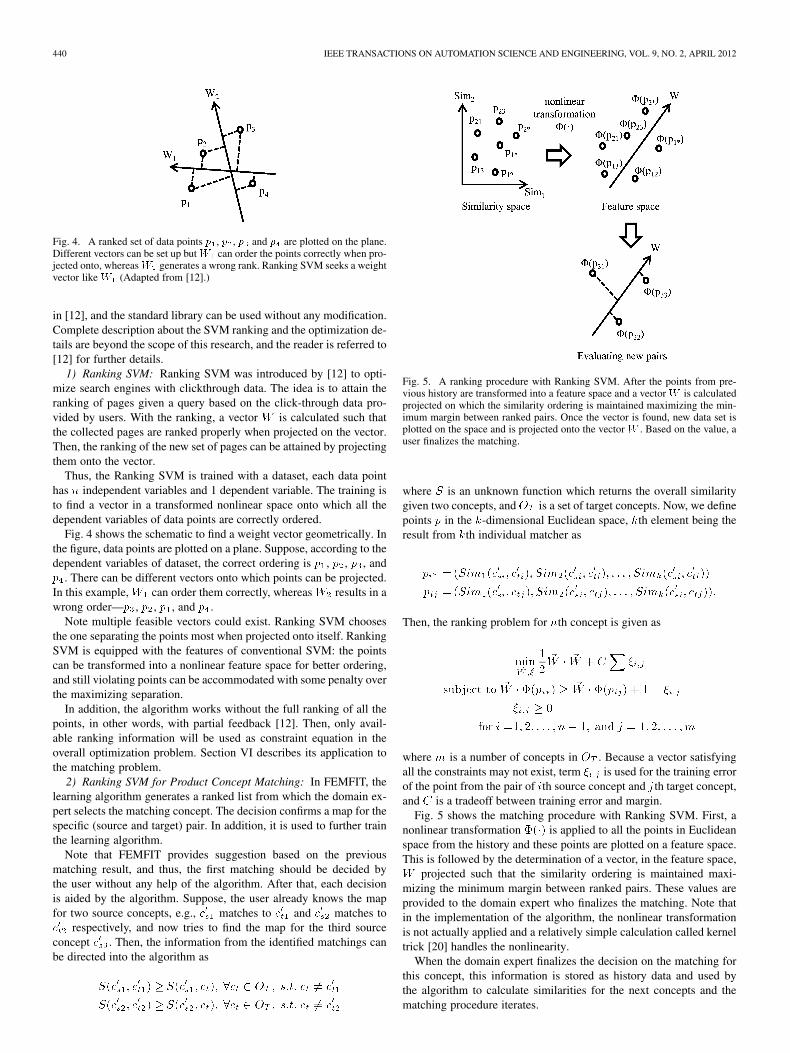
Fig. 4. A ranked set of data points � , � , � and � are plotted on the plane.Different vectors can be set up but� can order the points correctly when pro-jected onto, whereas� generates a wrong rank. Ranking SVM seeks a weightvector like � (Adapted from [12].)
in [12], and the standard library can be used without any modification.Complete description about the SVM ranking and the optimization de-tails are beyond the scope of this research, and the reader is referred to[12] for further details.
1) Ranking SVM: Ranking SVM was introduced by [12] to opti-mize search engines with clickthrough data. The idea is to attain theranking of pages given a query based on the click-through data pro-vided by users. With the ranking, a vector � is calculated such thatthe collected pages are ranked properly when projected on the vector.Then, the ranking of the new set of pages can be attained by projectingthem onto the vector.
Thus, the Ranking SVM is trained with a dataset, each data pointhas � independent variables and 1 dependent variable. The training isto find a vector in a transformed nonlinear space onto which all thedependent variables of data points are correctly ordered.
Fig. 4 shows the schematic to find a weight vector geometrically. Inthe figure, data points are plotted on a plane. Suppose, according to thedependent variables of dataset, the correct ordering is ��, ��, ��, and��. There can be different vectors onto which points can be projected.In this example, �� can order them correctly, whereas �� results in awrong order—��, ��, ��, and ��.
Note multiple feasible vectors could exist. Ranking SVM choosesthe one separating the points most when projected onto itself. RankingSVM is equipped with the features of conventional SVM: the pointscan be transformed into a nonlinear feature space for better ordering,and still violating points can be accommodated with some penalty overthe maximizing separation.
In addition, the algorithm works without the full ranking of all thepoints, in other words, with partial feedback [12]. Then, only avail-able ranking information will be used as constraint equation in theoverall optimization problem. Section VI describes its application tothe matching problem.
2) Ranking SVM for Product Concept Matching: In FEMFIT, thelearning algorithm generates a ranked list from which the domain ex-pert selects the matching concept. The decision confirms a map for thespecific (source and target) pair. In addition, it is used to further trainthe learning algorithm.
Note that FEMFIT provides suggestion based on the previousmatching result, and thus, the first matching should be decided bythe user without any help of the algorithm. After that, each decisionis aided by the algorithm. Suppose, the user already knows the mapfor two source concepts, e.g., ���� matches to ���� and ���� matches to���� respectively, and now tries to find the map for the third sourceconcept ����. Then, the information from the identified matchings canbe directed into the algorithm as
������� ��
��� �������� ���� ��� � �� � � �� �� ��
��
������� ��
��� �������� ���� ��� � �� � � �� �� ��
��
Fig. 5. A ranking procedure with Ranking SVM. After the points from pre-vious history are transformed into a feature space and a vector� is calculatedprojected on which the similarity ordering is maintained maximizing the min-imum margin between ranked pairs. Once the vector is found, new data set isplotted on the space and is projected onto the vector � . Based on the value, auser finalizes the matching.
where � is an unknown function which returns the overall similaritygiven two concepts, and �� is a set of target concepts. Now, we definepoints � in the �-dimensional Euclidean space, �th element being theresult from �th individual matcher as
�� ���� ����
��� ��
���� �� ����
��� ��
���� � � � � �� ����
��� ��
����
��� ���� ����
��� ����� �� ����
��� ����� � � � � �� ����
��� �����
Then, the ranking problem for �th concept is given as
������
�
�� � �� � ���
�� ���� �� �� � ������ � �� � ������ �� ���
��� � �
��� � ��� � � � � � �� �� ��� � � �� � � � � �
where is a number of concepts in �� . Because a vector satisfyingall the constraints may not exist, term ��� is used for the training errorof the point from the pair of �th source concept and �th target concept,and � is a tradeoff between training error and margin.
Fig. 5 shows the matching procedure with Ranking SVM. First, anonlinear transformation ���� is applied to all the points in Euclideanspace from the history and these points are plotted on a feature space.This is followed by the determination of a vector, in the feature space,� projected such that the similarity ordering is maintained maxi-mizing the minimum margin between ranked pairs. These values areprovided to the domain expert who finalizes the matching. Note thatin the implementation of the algorithm, the nonlinear transformationis not actually applied and a relatively simple calculation called kerneltrick [20] handles the nonlinearity.
When the domain expert finalizes the decision on the matching forthis concept, this information is stored as history data and used bythe algorithm to calculate similarities for the next concepts and thematching procedure iterates.
IEEE TRANSACTIONS ON AUTOMATION SCIENCE AND ENGINEERING, VOL. 9, NO. 2, APRIL 2012 441
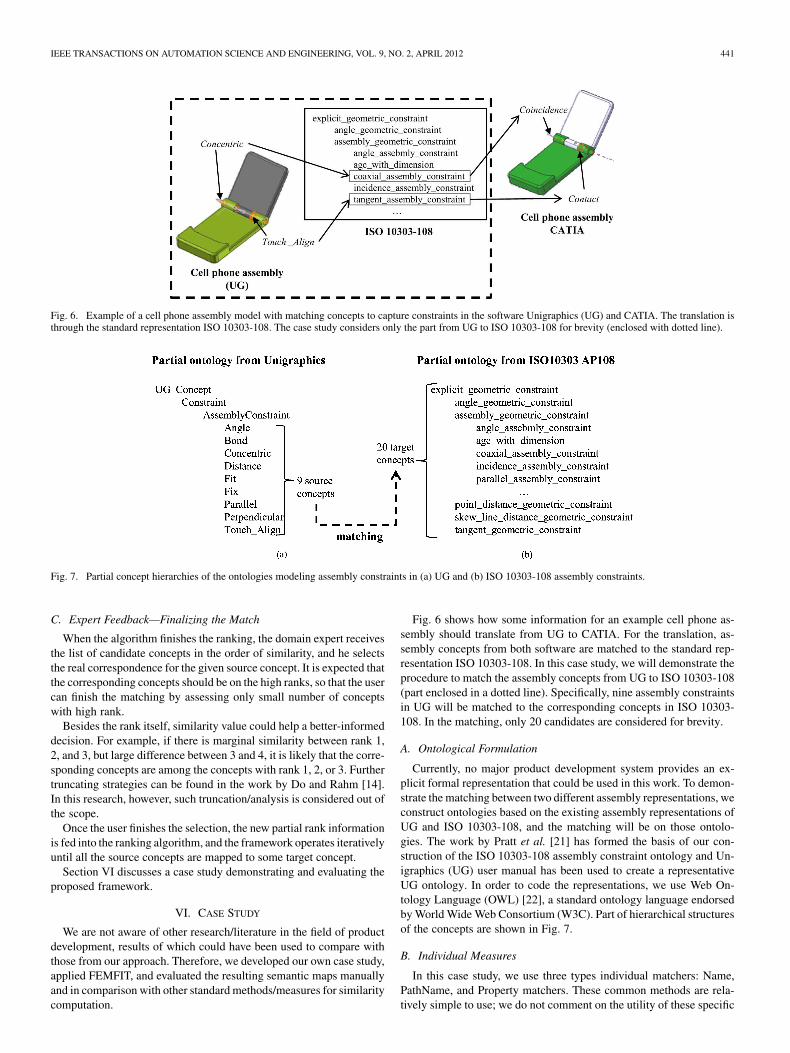
Fig. 6. Example of a cell phone assembly model with matching concepts to capture constraints in the software Unigraphics (UG) and CATIA. The translation isthrough the standard representation ISO 10303-108. The case study considers only the part from UG to ISO 10303-108 for brevity (enclosed with dotted line).
Fig. 7. Partial concept hierarchies of the ontologies modeling assembly constraints in (a) UG and (b) ISO 10303-108 assembly constraints.
C. Expert Feedback—Finalizing the Match
When the algorithm finishes the ranking, the domain expert receivesthe list of candidate concepts in the order of similarity, and he selectsthe real correspondence for the given source concept. It is expected thatthe corresponding concepts should be on the high ranks, so that the usercan finish the matching by assessing only small number of conceptswith high rank.
Besides the rank itself, similarity value could help a better-informeddecision. For example, if there is marginal similarity between rank 1,2, and 3, but large difference between 3 and 4, it is likely that the corre-sponding concepts are among the concepts with rank 1, 2, or 3. Furthertruncating strategies can be found in the work by Do and Rahm [14].In this research, however, such truncation/analysis is considered out ofthe scope.
Once the user finishes the selection, the new partial rank informationis fed into the ranking algorithm, and the framework operates iterativelyuntil all the source concepts are mapped to some target concept.
Section VI discusses a case study demonstrating and evaluating theproposed framework.
VI. CASE STUDY
We are not aware of other research/literature in the field of productdevelopment, results of which could have been used to compare withthose from our approach. Therefore, we developed our own case study,applied FEMFIT, and evaluated the resulting semantic maps manuallyand in comparison with other standard methods/measures for similaritycomputation.
Fig. 6 shows how some information for an example cell phone as-sembly should translate from UG to CATIA. For the translation, as-sembly concepts from both software are matched to the standard rep-resentation ISO 10303-108. In this case study, we will demonstrate theprocedure to match the assembly concepts from UG to ISO 10303-108(part enclosed in a dotted line). Specifically, nine assembly constraintsin UG will be matched to the corresponding concepts in ISO 10303-108. In the matching, only 20 candidates are considered for brevity.
A. Ontological Formulation
Currently, no major product development system provides an ex-plicit formal representation that could be used in this work. To demon-strate the matching between two different assembly representations, weconstruct ontologies based on the existing assembly representations ofUG and ISO 10303-108, and the matching will be on those ontolo-gies. The work by Pratt et al. [21] has formed the basis of our con-struction of the ISO 10303-108 assembly constraint ontology and Un-igraphics (UG) user manual has been used to create a representativeUG ontology. In order to code the representations, we use Web On-tology Language (OWL) [22], a standard ontology language endorsedby World Wide Web Consortium (W3C). Part of hierarchical structuresof the concepts are shown in Fig. 7.
B. Individual Measures
In this case study, we use three types individual matchers: Name,PathName, and Property matchers. These common methods are rela-tively simple to use; we do not comment on the utility of these specific
442 IEEE TRANSACTIONS ON AUTOMATION SCIENCE AND ENGINEERING, VOL. 9, NO. 2, APRIL 2012
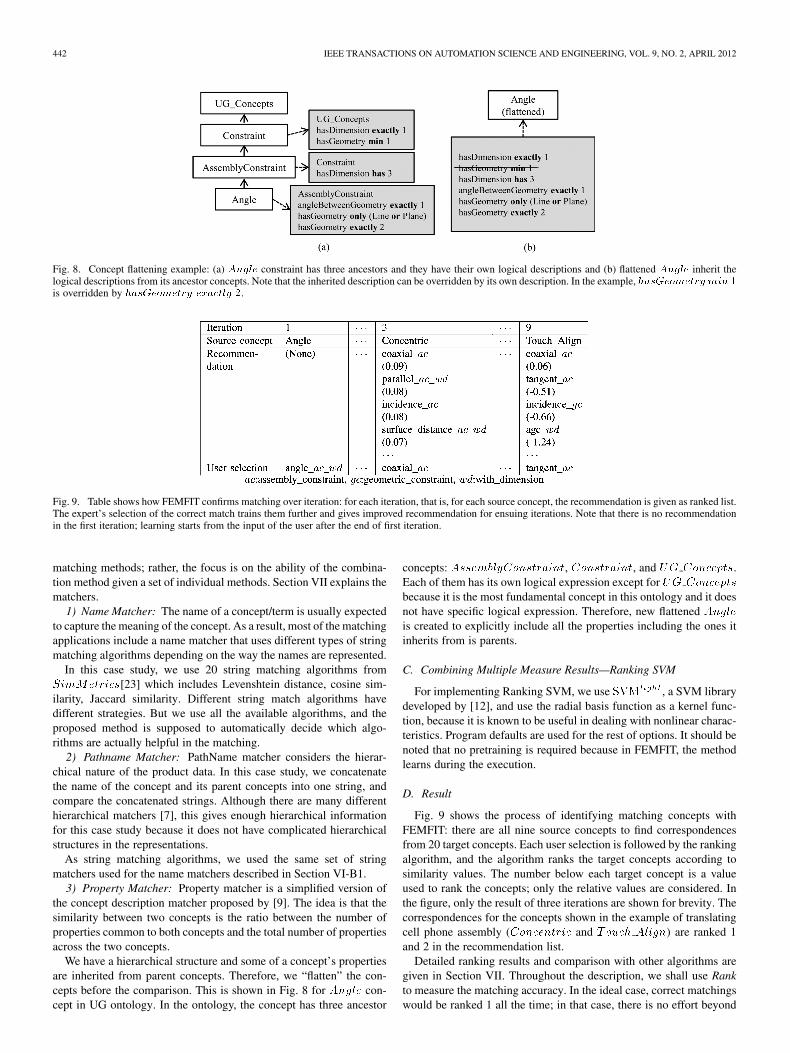
Fig. 8. Concept flattening example: (a) ����� constraint has three ancestors and they have their own logical descriptions and (b) flattened ����� inherit thelogical descriptions from its ancestor concepts. Note that the inherited description can be overridden by its own description. In the example, ������� � ��� �
is overridden by ������� � ������� �.
Fig. 9. Table shows how FEMFIT confirms matching over iteration: for each iteration, that is, for each source concept, the recommendation is given as ranked list.The expert’s selection of the correct match trains them further and gives improved recommendation for ensuing iterations. Note that there is no recommendationin the first iteration; learning starts from the input of the user after the end of first iteration.
matching methods; rather, the focus is on the ability of the combina-tion method given a set of individual methods. Section VII explains thematchers.
1) Name Matcher: The name of a concept/term is usually expectedto capture the meaning of the concept. As a result, most of the matchingapplications include a name matcher that uses different types of stringmatching algorithms depending on the way the names are represented.
In this case study, we use 20 string matching algorithms from���������[23] which includes Levenshtein distance, cosine sim-ilarity, Jaccard similarity. Different string match algorithms havedifferent strategies. But we use all the available algorithms, and theproposed method is supposed to automatically decide which algo-rithms are actually helpful in the matching.
2) Pathname Matcher: PathName matcher considers the hierar-chical nature of the product data. In this case study, we concatenatethe name of the concept and its parent concepts into one string, andcompare the concatenated strings. Although there are many differenthierarchical matchers [7], this gives enough hierarchical informationfor this case study because it does not have complicated hierarchicalstructures in the representations.
As string matching algorithms, we used the same set of stringmatchers used for the name matchers described in Section VI-B1.
3) Property Matcher: Property matcher is a simplified version ofthe concept description matcher proposed by [9]. The idea is that thesimilarity between two concepts is the ratio between the number ofproperties common to both concepts and the total number of propertiesacross the two concepts.
We have a hierarchical structure and some of a concept’s propertiesare inherited from parent concepts. Therefore, we “flatten” the con-cepts before the comparison. This is shown in Fig. 8 for �� � con-cept in UG ontology. In the ontology, the concept has three ancestor
concepts: ��� ����������, ���������, and �� �������.Each of them has its own logical expression except for �� �������
because it is the most fundamental concept in this ontology and it doesnot have specific logical expression. Therefore, new flattened �� �
is created to explicitly include all the properties including the ones itinherits from is parents.
C. Combining Multiple Measure Results—Ranking SVM
For implementing Ranking SVM, we use ��������, a SVM librarydeveloped by [12], and use the radial basis function as a kernel func-tion, because it is known to be useful in dealing with nonlinear charac-teristics. Program defaults are used for the rest of options. It should benoted that no pretraining is required because in FEMFIT, the methodlearns during the execution.
D. Result
Fig. 9 shows the process of identifying matching concepts withFEMFIT: there are all nine source concepts to find correspondencesfrom 20 target concepts. Each user selection is followed by the rankingalgorithm, and the algorithm ranks the target concepts according tosimilarity values. The number below each target concept is a valueused to rank the concepts; only the relative values are considered. Inthe figure, only the result of three iterations are shown for brevity. Thecorrespondences for the concepts shown in the example of translatingcell phone assembly (���������� and ����� ���) are ranked 1and 2 in the recommendation list.
Detailed ranking results and comparison with other algorithms aregiven in Section VII. Throughout the description, we shall use Rankto measure the matching accuracy. In the ideal case, correct matchingswould be ranked 1 all the time; in that case, there is no effort beyond
IEEE TRANSACTIONS ON AUTOMATION SCIENCE AND ENGINEERING, VOL. 9, NO. 2, APRIL 2012 443
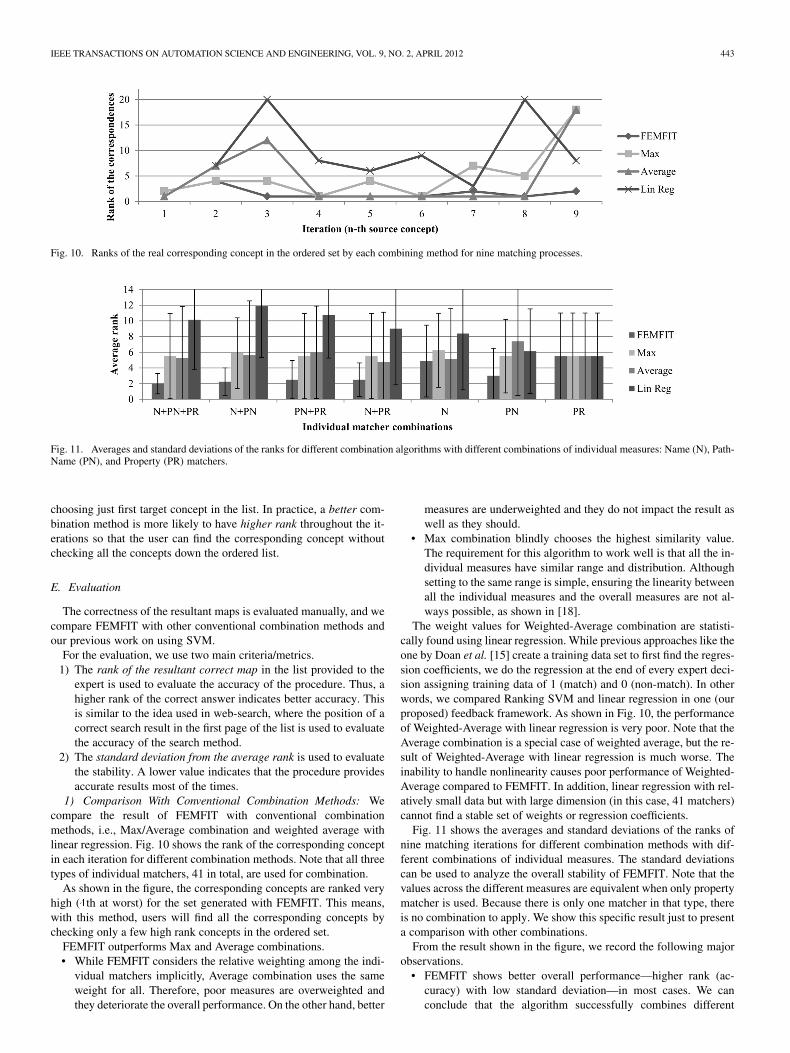
Fig. 10. Ranks of the real corresponding concept in the ordered set by each combining method for nine matching processes.
Fig. 11. Averages and standard deviations of the ranks for different combination algorithms with different combinations of individual measures: Name (N), Path-Name (PN), and Property (PR) matchers.
choosing just first target concept in the list. In practice, a better com-bination method is more likely to have higher rank throughout the it-erations so that the user can find the corresponding concept withoutchecking all the concepts down the ordered list.
E. Evaluation
The correctness of the resultant maps is evaluated manually, and wecompare FEMFIT with other conventional combination methods andour previous work on using SVM.
For the evaluation, we use two main criteria/metrics.1) The rank of the resultant correct map in the list provided to the
expert is used to evaluate the accuracy of the procedure. Thus, ahigher rank of the correct answer indicates better accuracy. Thisis similar to the idea used in web-search, where the position of acorrect search result in the first page of the list is used to evaluatethe accuracy of the search method.
2) The standard deviation from the average rank is used to evaluatethe stability. A lower value indicates that the procedure providesaccurate results most of the times.
1) Comparison With Conventional Combination Methods: Wecompare the result of FEMFIT with conventional combinationmethods, i.e., Max/Average combination and weighted average withlinear regression. Fig. 10 shows the rank of the corresponding conceptin each iteration for different combination methods. Note that all threetypes of individual matchers, 41 in total, are used for combination.
As shown in the figure, the corresponding concepts are ranked veryhigh (�th at worst) for the set generated with FEMFIT. This means,with this method, users will find all the corresponding concepts bychecking only a few high rank concepts in the ordered set.
FEMFIT outperforms Max and Average combinations.• While FEMFIT considers the relative weighting among the indi-
vidual matchers implicitly, Average combination uses the sameweight for all. Therefore, poor measures are overweighted andthey deteriorate the overall performance. On the other hand, better
measures are underweighted and they do not impact the result aswell as they should.
• Max combination blindly chooses the highest similarity value.The requirement for this algorithm to work well is that all the in-dividual measures have similar range and distribution. Althoughsetting to the same range is simple, ensuring the linearity betweenall the individual measures and the overall measures are not al-ways possible, as shown in [18].
The weight values for Weighted-Average combination are statisti-cally found using linear regression. While previous approaches like theone by Doan et al. [15] create a training data set to first find the regres-sion coefficients, we do the regression at the end of every expert deci-sion assigning training data of 1 (match) and 0 (non-match). In otherwords, we compared Ranking SVM and linear regression in one (ourproposed) feedback framework. As shown in Fig. 10, the performanceof Weighted-Average with linear regression is very poor. Note that theAverage combination is a special case of weighted average, but the re-sult of Weighted-Average with linear regression is much worse. Theinability to handle nonlinearity causes poor performance of Weighted-Average compared to FEMFIT. In addition, linear regression with rel-atively small data but with large dimension (in this case, 41 matchers)cannot find a stable set of weights or regression coefficients.
Fig. 11 shows the averages and standard deviations of the ranks ofnine matching iterations for different combination methods with dif-ferent combinations of individual measures. The standard deviationscan be used to analyze the overall stability of FEMFIT. Note that thevalues across the different measures are equivalent when only propertymatcher is used. Because there is only one matcher in that type, thereis no combination to apply. We show this specific result just to presenta comparison with other combinations.
From the result shown in the figure, we record the following majorobservations.
• FEMFIT shows better overall performance—higher rank (ac-curacy) with low standard deviation—in most cases. We canconclude that the algorithm successfully combines different
444 IEEE TRANSACTIONS ON AUTOMATION SCIENCE AND ENGINEERING, VOL. 9, NO. 2, APRIL 2012
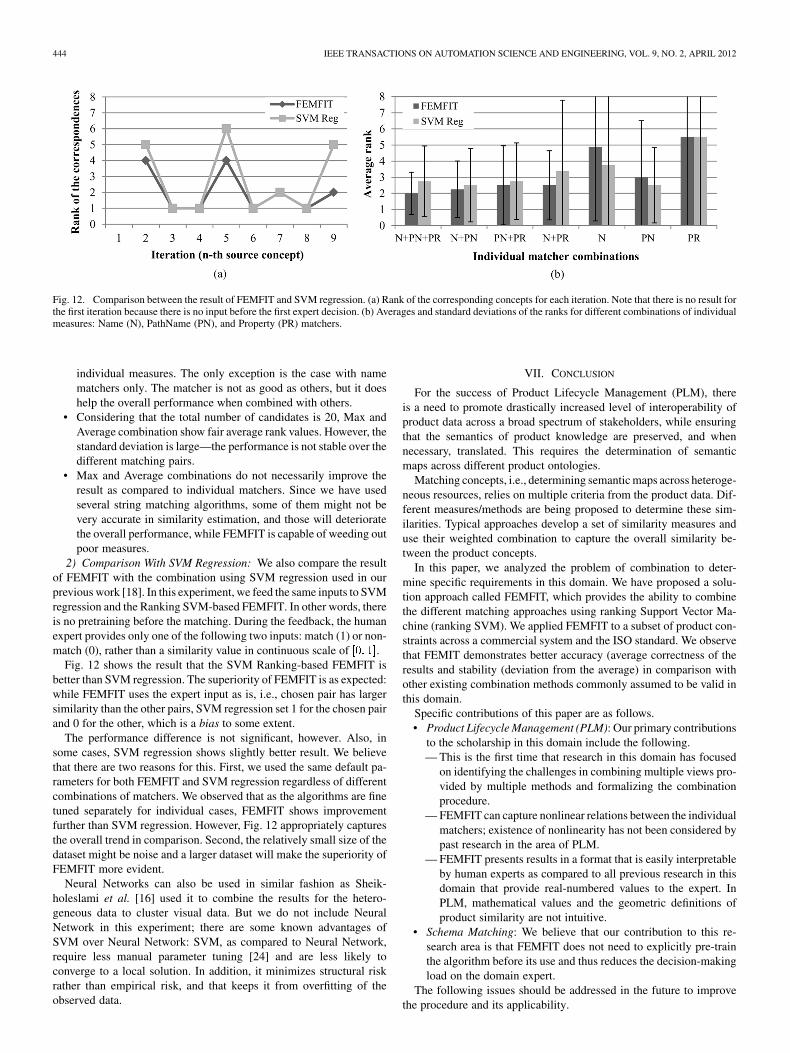
Fig. 12. Comparison between the result of FEMFIT and SVM regression. (a) Rank of the corresponding concepts for each iteration. Note that there is no result forthe first iteration because there is no input before the first expert decision. (b) Averages and standard deviations of the ranks for different combinations of individualmeasures: Name (N), PathName (PN), and Property (PR) matchers.
individual measures. The only exception is the case with namematchers only. The matcher is not as good as others, but it doeshelp the overall performance when combined with others.
• Considering that the total number of candidates is 20, Max andAverage combination show fair average rank values. However, thestandard deviation is large—the performance is not stable over thedifferent matching pairs.
• Max and Average combinations do not necessarily improve theresult as compared to individual matchers. Since we have usedseveral string matching algorithms, some of them might not bevery accurate in similarity estimation, and those will deterioratethe overall performance, while FEMFIT is capable of weeding outpoor measures.
2) Comparison With SVM Regression: We also compare the resultof FEMFIT with the combination using SVM regression used in ourprevious work [18]. In this experiment, we feed the same inputs to SVMregression and the Ranking SVM-based FEMFIT. In other words, thereis no pretraining before the matching. During the feedback, the humanexpert provides only one of the following two inputs: match (1) or non-match (0), rather than a similarity value in continuous scale of ��� ��.
Fig. 12 shows the result that the SVM Ranking-based FEMFIT isbetter than SVM regression. The superiority of FEMFIT is as expected:while FEMFIT uses the expert input as is, i.e., chosen pair has largersimilarity than the other pairs, SVM regression set 1 for the chosen pairand 0 for the other, which is a bias to some extent.
The performance difference is not significant, however. Also, insome cases, SVM regression shows slightly better result. We believethat there are two reasons for this. First, we used the same default pa-rameters for both FEMFIT and SVM regression regardless of differentcombinations of matchers. We observed that as the algorithms are finetuned separately for individual cases, FEMFIT shows improvementfurther than SVM regression. However, Fig. 12 appropriately capturesthe overall trend in comparison. Second, the relatively small size of thedataset might be noise and a larger dataset will make the superiority ofFEMFIT more evident.
Neural Networks can also be used in similar fashion as Sheik-holeslami et al. [16] used it to combine the results for the hetero-geneous data to cluster visual data. But we do not include NeuralNetwork in this experiment; there are some known advantages ofSVM over Neural Network: SVM, as compared to Neural Network,require less manual parameter tuning [24] and are less likely toconverge to a local solution. In addition, it minimizes structural riskrather than empirical risk, and that keeps it from overfitting of theobserved data.
VII. CONCLUSION
For the success of Product Lifecycle Management (PLM), thereis a need to promote drastically increased level of interoperability ofproduct data across a broad spectrum of stakeholders, while ensuringthat the semantics of product knowledge are preserved, and whennecessary, translated. This requires the determination of semanticmaps across different product ontologies.
Matching concepts, i.e., determining semantic maps across heteroge-neous resources, relies on multiple criteria from the product data. Dif-ferent measures/methods are being proposed to determine these sim-ilarities. Typical approaches develop a set of similarity measures anduse their weighted combination to capture the overall similarity be-tween the product concepts.
In this paper, we analyzed the problem of combination to deter-mine specific requirements in this domain. We have proposed a solu-tion approach called FEMFIT, which provides the ability to combinethe different matching approaches using ranking Support Vector Ma-chine (ranking SVM). We applied FEMFIT to a subset of product con-straints across a commercial system and the ISO standard. We observethat FEMIT demonstrates better accuracy (average correctness of theresults and stability (deviation from the average) in comparison withother existing combination methods commonly assumed to be valid inthis domain.
Specific contributions of this paper are as follows.• Product Lifecycle Management (PLM): Our primary contributions
to the scholarship in this domain include the following.— This is the first time that research in this domain has focused
on identifying the challenges in combining multiple views pro-vided by multiple methods and formalizing the combinationprocedure.
— FEMFIT can capture nonlinear relations between the individualmatchers; existence of nonlinearity has not been considered bypast research in the area of PLM.
— FEMFIT presents results in a format that is easily interpretableby human experts as compared to all previous research in thisdomain that provide real-numbered values to the expert. InPLM, mathematical values and the geometric definitions ofproduct similarity are not intuitive.
• Schema Matching: We believe that our contribution to this re-search area is that FEMFIT does not need to explicitly pre-trainthe algorithm before its use and thus reduces the decision-makingload on the domain expert.
The following issues should be addressed in the future to improvethe procedure and its applicability.
IEEE TRANSACTIONS ON AUTOMATION SCIENCE AND ENGINEERING, VOL. 9, NO. 2, APRIL 2012 445
• Complete translation is not possible unless there are some explicitand open representations of the product development systems. Wethink, however, industry is moving toward more semantically richrepresentations where we do not need such manual constructionof ontologies. For example, major CAD vendors have recentlydeveloped a more expressive document representations, such asPLM XML by Siemens and 3D XML by Dassault Systèmes. Suchrepresentations could reduce significant amount of manual workin parsing and reasoning about the concepts in the representations.
• While the FEMFIT can handle 1–1 matches, it needs to be im-proved to handle m-n matches. This is known to be a difficultproblem, but starting with 1:n matching might be a manageableapproach.
• Since there is learning at each iteration, a rigorous analysis ofthe proposed method is necessary to comment on its order depen-dence.
• Research is necessary to enable the approach to learn the correctweightings of the individual matchers for cases, such as the onethat states “if property � has some value �, then property � is vitalfor similarity, otherwise � does not play a role.”
• We have used our expert knowledge to determine the correctnessof the results for the demonstrative cases that we have developed.Standard data sets should be generated from complex, real-worldproducts and ontologies. Such rigorously developed datasets canform a cyber-repository that can be used to benchmark/validatedifferent methods and tools developed by researchers in this field.
REFERENCES
[1] F. Ameri and D. Dutta, “Product lifecycle management: Closing theknowledge loops,” Comput.-Aided Design Appl., vol. 2, no. 5, pp.577–590, 2005.
[2] S. Brunnermeier and S. Martin, “Interoperability cost analysis of theU.S. automotive supply chain,” Research Triangle Institute, ResearchTriangle Park, NC, Report prepared for the National Institute of Stan-dards and Technology, 1999. [Online]. Available: http:www.nist.gov-directorprog-ofcreport99-1.pdf
[3] E. J. Barkmeyer, A. B. Feeney, P. Denno, D. W. Flater, D. E. Libes, M.P. Steves, and E. K. Wallace, “Concepts for automating systems inte-gration,” National Institute of Standard and Technology, Gaithersburg,MD, Tech. Rep, 2003.
[4] E. Subrahmanian, R. Sudarsan, A. Bouras, S. Fenves, S. Foufou, andR. Sriram, “The role of standards in product lifecycle managementsupport,” National Institute of Standard and Technology, Gaithersburg,MD, Tech. Rep. NISTIR 7289, 2006.
[5] S. J. Fenves, R. D. Sriram, E. Subrahmanian, and S. Rachuri, “Productinformation exchange: Practices and standards,” J. Comput. Inform.Sci. Eng., vol. 5, no. 3, pp. 238–246, 2005.
[6] N. F. Noy, “Semantic integration: A survey of ontology-based ap-proaches,” SIGMOD Record, vol. 33, no. 4, pp. 65–70, Dec. 2004.
[7] E. Rahm and P. A. Bernstein, “A survey of approaches to automaticschema matching,” VLDB J. Int. J. Very Large Data Bases, vol. 10, no.4, pp. 334–350, Nov. 2001.
[8] L. Patil, D. Dutta, and R. Sriram, “Ontology-based exchange ofproduct data semantics,” IEEE Tran. Autom. Sci. Eng., vol. 2, no. 3,pp. 213–225, Jul. 2005.
[9] L. Patil, “Interoperability of formal semantics of product data acrossproduct development systems,” Ph.D. dissertation, Univ. Michigan,Ann Arbor, MI, 2005.
[10] M.-J. Lee, M. Jung, and H.-W. Suh, “Semantic mapping based on on-tology and a Bayesian network and its application to CAD and PDMintegration,” in Proc. ASME Int. Design Eng. Tech. Conf. Comput. In-form. Eng. Conf., IDETC/CIE’06, 2006, pp. 591–602.
[11] L. Zhang and J.-G. Gu, “Ontology based semantic mapping architec-ture,” in Proc. Int. Conf. Machine Learning Cybern., 2005, vol. 4, pp.2200–2205.
[12] T. Joachims, “Optimizing search engines using clickthrough data,” inProc. 8th ACM SIGKDD Int. Conf. Knowl. Discovery Data Mining,New York, NY, 2002, pp. 133–142.
[13] J. Euzenat and P. Shvaiko, Ontology Matching. New York: Springer-Verlag, 2007.
[14] H.-H. Do and E. Rahm, “COMA: A system for flexible combinationof schema matching approaches,” in Proc. 28th Int. Conf. Very LargeData Bases, VLDB’02, 2002, pp. 610–621.
[15] A. Doan, P. Domingos, and A. Y. Halevy, “Reconciling schemas of dis-parate data sources: A machine-learning approach,” SIGMOD Record,vol. 30, no. 2, pp. 509–520, 2001.
[16] G. Sheikholeslami, W. Chang, and A. Zhang, “SemQuery: Semanticclustering and querying on heterogeneous features for visual data,”IEEE Trans. Knowl. Data Eng., vol. 14, no. 5, pp. 988–1002, Sep./Oct.2002.
[17] C. Wang, J. Lu, and G. Zhang, “Integration of ontology data throughlearning instance matching,” in Proc. IEEE/WIC/ACM Int. Conf. WebIntell., WI’06, Washington, DC, 2006, pp. 536–539.
[18] I. Yeo, L. Patil, and D. Dutta, “Semantic combination of matchingmethods for product data interoperability,” in Proc. 5th Int. Conf.Product Lifecycle Management, 2008, pp. 167–176.
[19] R. A. Wagner and M. J. Fischer, “The string-to-string correctionproblem,” J. ACM, vol. 21, no. 1, pp. 168–173, 1974.
[20] B. E. Boser, I. M. Guyon, and V. N. Vapnik, “A training algorithmfor optimal margin classifiers,” in Proc. 5th Annu. ACM Workshopon Comput. Learning Theory (COLT), D. Haussler, Ed., 1992, pp.144–152, Pittsburgh, PA, ACM Press.
[21] “ISO/CD 10303-108: Industrial Automation Systems and Inte-gration—Product Data Representation and Exchange: IntegratedApplication Resource: Parameterization and Constraints for ExplicitGeometric Product Models,” International Organization for Standard-ization (ISO), Geneva, Switzerland, 2001.
[22] D. L. McGuinness and F. van Harmelen, “OWL web ontology lan-guage overview,” World Wide Web Consortium (W3C), 2004. [Online].Available: http://www.w3.org/TR/owl-features
[23] S. Chapman, “SimMetrics—Open source similarity measure library,”2006. [Online]. Available: http://www.dcs.shef.ac.uk/~sam/simmet-rics.html
[24] A. J. Smola and B. Schökopf, “A tutorial on support vector regression,”Stat. Comput., vol. 14, no. 3, pp. 199–222, Aug. 2004.