Embed Size (px)
Citation preview

Investment Option Review Federal Retirement Thrift Investment Board
Thrift Savings Plan
February 2013
Hewitt EnnisKnupp, An Aon Company © 2011 – Aon Corporation

(This page left blank intentionally)

Table of Contents
Page 1 Executive Summary 1 2 Review of Current Circumstances and Comparison to Peers 9 3 Investment Structure 19 4 Key Evaluation Criteria for Investment Fund Alternatives 25 5 Application of Key Criteria to Investment Fund Alternatives 33 6 Non-U.S. Bonds 49 7 U.S. Stocks 55 8 Emerging Markets Stocks 61 9 Global REITs 69 10 Commodities 77 11 Emerging Market Bonds 85 12 Non-U.S. Small Cap Stocks 93 13 Appendix 101

(This page left blank intentionally)

1
EXECUTIVE SUMMARY

2
(This page left blank intentionally)

EXECUTIVE SUMMARY
3
Background The Federal Retirement Thrift Investment Board (FRTIB) asked Hewitt EnnisKnupp to review the line-up of funds offered within the Thrift Savings Plan (TSP) to determine whether the line-up remains appropriate and to evaluate whether potential fund additions are warranted. In this report, we: Review the circumstances of the Thrift Savings Plan and compare its circumstances to that of peer
plans Identify the key criteria to evaluate potential fund additions Apply the key criteria to a broad array of potential fund alternatives to identify those suitable for further
consideration Review the appropriateness of including specific fund alternatives and provide our recommendations
on whether a fund alternative should be included in the Plan line-up Current Practices and Peer Comparisons
As of December 31, 2012, the TSP had approximately 4.6 million participants who had approximately
$330 billion invested among the underlying plan options. This translates to an average participant balance of approximately $70,000.
The TSP offers ten investment alternatives for participants to choose from. These include five core investment alternatives and five lifecycle or target retirement date funds.
The table below lists the investment options currently offered within the Thrift Savings Plan Fund Type TSP Fund Stable Value G Fund Diversified Fixed Income F Fund Lifecycle/Balanced L Income
L 2020 L 2030 L 2040 L 2050 U.S. Stock C Fund
S Fund Non-U.S. Stock I Fund

EXECUTIVE SUMMARY
4
Investment Structure By investment structure, we refer to the number and types of options that are offered within a plan. We believe a plan’s investment options should offer a sufficient range of choice to allow participants to form well-diversified portfolios, given a reasonable range of risk and return circumstances. As such, we believe that the TSP should have a structure that: Offers sufficient range of choice – with options that reasonably span the risk and return spectrum Allows participants to form well-diversified portfolios Is appropriately comparable with peers Meets broad participant demand
The investment fund types offered to TSP participants match those that we recommend the TSP offer. U.S. stock Non-U.S. stock Diversified fixed income Cash equivalent/stable value Lifecycle
Our recommendations regarding the TSP’s investment structure are also influenced by our beliefs that: Employee education is one of the most important components of a successful defined contribution
plan The number of options should not overwhelm participants The more broadly diversified an asset class/asset category, the better it will serve participants over the
long-term Participants should be provided with two decision-making paths – an array of lifecycle funds and an
array of broadly diversified asset class/asset category specific funds

EXECUTIVE SUMMARY
5
Review of the TSP’s Investment Structure
The five core investment alternatives span the risk/return spectrum and include what we would consider to be all of the core building blocks to build a diversified investment portfolio. With the exception of the G Fund, each of the core investment options is broadly diversified and provides comprehensive coverage of the asset class it represents. The G Fund, while not broadly diversified since it has exposure to a single issuer, the U.S. Treasury, is backed by the full faith and credit of the U.S. Government.
The L Funds include an Income Fund and four target retirement date funds offered in 10-year increments commencing with a fund with a target retirement date of 2020. The L Funds allow participants to select an investment fund that is diversified among and within asset classes as the L Funds are constructed using the five core investment options.
While the number of options offered within the Thrift Savings Plan is lower than that of peer plans, we believe that the TSP offers investment funds across the major categories that are found in a majority of participant directed plans and represent the investment options in peer plans.
Moreover, the options offered within the TSP represent those that receive a large portion of the assets in peer participant directed plans.
As noted earlier, we believe that the options offered also represent the core building blocks necessary to build a diversified investment portfolio.
One of the hallmarks of the Thrift Savings Plan is its simplicity and efficiency. The Plan offers low-cost, broadly diversified options that provide coverage of the broad asset class segments that form the core building blocks of diversified portfolios. The core options allow participants to build portfolios that span the risk and return spectrum. Further, offering the L Funds is in line with contemporary best practices and allows participants who do not wish to make investment decisions pre-mixed portfolios that embrace the key tenets of investing (diversification, appropriate risk/return profile, and low cost). We believe that the options offered represent the major categories found in peer plans and the options to which most participant assets are directed. In terms of broader industry trends, after years of offering an increasingly wide number of options from which participants can choose, we find that increasingly plan sponsors are seeking to streamline their plans and are focusing on simplicity and efficiency. This has led to, for the first time in years, a reduction in the average number of plan options offered across a broad range of participant directed defined contribution plans. Hewitt EnnisKnupp’s advice to our defined contribution clients is to maintain a simple efficient investment line-up that includes target retirement date funds, passive options that provide broad asset class coverage, and select, broadly-diversified active fund options. With the exception of active fund options, the TSP line-up is reflective of the broad advice we provide clients in structuring their defined contribution plan line-up. We believe that the core of the TSP’s line-up is well-structured and that there are no gaps in the fund line-up offered to participants.

EXECUTIVE SUMMARY
6
Key Criteria For Evaluation of Investment Fund Alternatives In evaluating the types of investment fund alternatives to offer in the TSP, we believe the following criteria (individually and collectively) are the most relevant to consider: Major diversified asset class/category not currently offered as an investment option Asset class/category is large enough for the TSP to invest in (consider asset classes/categories with a
market capitalization or investment opportunity set of at least $1 trillion) Potential diversification benefit for TSP participant portfolios Asset class/category offers daily liquidity Exposure to the asset class/category can be derived on a passive basis Practices of peers
Review of Asset Classes/Categories Considered for Inclusion The asset classes/categories we considered for review are listed in the table below. Equities Fixed Income Alternatives/Other U.S. Growth Stock Non-U.S. Bonds Private Real Estate U.S. Value Stock High Yield Bonds Private Equity Global REITs TIPS Commodities Emerging Market Stock Emerging Market Debt Hedge Funds Non-U.S. Small-cap Stock Socially Responsible/ Frontier Markets Corporate Governance Funds
Infrastructure Based on the application of the key criteria discussed above, we eliminated several categories from further consideration due to factors such as – small market size, illiquidity, lack of passive investment strategies, concentrated strategies, or the TSP participants already gain access to the category through existing investments. The asset classes excluded for further consideration were: Frontier Market Equities High Yield Bonds Private Real Estate Private Equity Commodities Hedge Funds Socially Responsible/Corporate Governance Funds Infrastructure
We also excluded TIPS from further consideration. TIPS are an attractive asset class for investors who seek to hedge against the risk of inflation. The TSP offers a fund (G Fund) that provides similar characteristics over the long-term without negative price volatility associated with a TIPS fund.

EXECUTIVE SUMMARY
7
Additionally, a TIPS fund would provide limited diversification benefits to TSP participants, add complexity to an investment category where we believe additional flexibility is not required, and is not common practice among peer plans. Therefore, we recommend the FRTIB not offer TIPS as an investment fund alternative. Below we provide summary thoughts on the asset classes/categories that we reviewed in detail. Non-U.S. Bonds Non-U.S. bonds are a material portion of the world’s market capitalization and investable opportunity set. However, the benefits of adding a non-U.S. bond option are minimal from an expected risk-return and portfolio diversification standpoint for TSP participants. Moreover, adding a non-U.S. bond fund would add complexity to a segment of the plan where we believe additional flexibility is not required and/or meaningful. As such, we recommend the FRTIB not add a non-U.S. bond fund as an investment fund alternative. Value and Growth U.S. Stocks Larger-capitalization growth and value funds are attractive alternatives from a market size, liquidity, sector and a security diversification standpoint. The diversification benefits from a portfolio standpoint, however, would not be material relative to the current investment funds already available. We do not believe it is necessary for the TSP to offer any additional U.S. stock funds as the C and S Funds provide exposure to the entire U.S. stock market. Offering a more limited number of U.S. stock funds without foregoing material improvement in portfolios would be consistent with avoiding investment choice overload. On balance, we do not find a compelling reason to add additional U.S. stock funds, as the TSP’s current investment line-up provides broad exposure to the U.S. stock market via the C and S Funds. The same thinking applies with value and growth stocks in non-U.S. developed markets as well. Emerging Market Stocks Emerging markets are a large asset class, expected to experience secular growth, and provide a benefit to portfolios at the higher levels of risk. While emerging markets are an attractive asset class, we have concerns with the TSP (and DC plans in general) offering emerging markets as a standalone investment fund. The high risk associated with emerging markets has resulted in material losses over relatively short periods of time and is difficult for participants (or for any investor) to bear. Additionally, there are limited benefits to adding emerging market equities to well-diversified low to moderate risk portfolios. Overall, we believe the negatives of offering an emerging markets investment fund outweigh the positives and recommend an emerging market stock fund not be added as an investment fund alternative. Global REITs While there appear to be compelling attributes supporting the inclusion of global REITs, we do not recommend their inclusion at this time. As noted, TSP participants attain exposure to REITs in market capitalization weights via the C, S and I Funds. REITs are a specific sector of the global equity market and exhibit a higher degree of volatility than the broad equity market. Adding REITs would make the plan line-up more complex. While the number of plans offering a REIT option has increased, utilization has remained low.

EXECUTIVE SUMMARY
8
Commodities Commodity futures offer a diversification benefit, as well as the potential to hedge against inflation. However, commodity prices are influenced by demand/supply considerations rather than the intrinsic value of a security, and future return expectations are uncertain. Most individual investors will have difficulty in determining an appropriate allocation to commodities. Commodity funds are also not a common investment option in defined contribution plans. We recommend that the FRTIB not offer commodities as an investment option in the TSP. Emerging Market Debt While correlations to traditional bonds are low, correlation to equities are fairly high, coupled with lower expected returns and high risk, this asset class is less appealing as a stand-alone option. Offering emerging market debt, as a stand-alone option, is not common practice (none of the top ten largest government plans offer this option). For these reasons we would not recommend emerging market debt be added as an investment fund alternative. Non-U.S. Small Cap Stock While non-U.S. small cap markets have grown to an adequate size and index products are now offered, we would prefer to take a more broadly diversified view of international stocks. More broadly defined investment options will make education easier and participation more likely. Non-U.S. small cap may rank second, next to emerging market equity, as one of the higher risk offerings and is not commonly offered, as a stand-alone investment option. The high risk associated with non-U.S. small cap stocks may result in material losses. We do not recommend non-U.S. small cap stock be included as a stand-alone investment fund. Conclusion Based on our analysis, we did not find any of the seven asset classes/categories that we evaluated in detail particularly compelling as an investment fund addition to the TSP line-up. The simplicity and efficiency of the existing line-up makes the TSP a very attractive offering to participants. We do not believe that the addition of any of these options offered would enhance the efficiency of the Plan without compromising materially on its simplicity. As such, we recommend that the FRTIB maintain the existing structure of its investment line-up and not add any additional investment option to its line-up.

9
REVIEW OF CURRENT CIRCUMSTANCE AND COMPARISON TO PEERS

10
(This page left blank intentionally)

REVIEW OF CURRENT CIRCUMSTANCES AND COMPARISON TO PEERS
11
The following section encapsulates the current circumstances of the TSP's investment structure and compares it to peer plans. Overview Assets of approximately $330 billion as of December 31, 2012
Over 4.6 million participants
An average participant balance of approximately $70,000
10 investment options are currently available to participants (5 core options and 5 lifecycle or
target date funds): Fund Type TSP Fund Stable Value G Fund Diversified Fixed Income F Fund Lifecycle/Balanced L Income L 2020 L 2030 L 2040 L 2050 U.S. Stock C Fund S Fund Non-U.S. Stock I Fund
Key Characteristics of TSP The TSP offers participants the ability to invest in five diversified “core” investment alternatives
(G, F, C, S and I Funds) that reasonably span the risk and return spectrum, allowing participants to construct portfolios that range from low risk to moderate to higher risk. We note the G Fund is not “diversified” among securities, but is backed by the full faith and credit of the U.S. government.
The L Funds allow participants to select an investment fund(s) that is diversified among and
within asset classes, as the L Funds are constructed using the five underlying core investment funds. Importantly, the L Funds embrace the key principle of investing in that they are broadly diversified. The L Funds rebalance and evolve over time from growth-oriented portfolios to income and principal-preservation focused portfolios in order to adjust for participants’ time horizons.
The costs of administering the TSP’s total plan are well below industry average (under 5 basis
points or 0.05%). Investment fees for most other plans range from 0.50% to 0.80%. We rarely observe total investment fees below 0.45% for participant defined contribution plans.

REVIEW OF CURRENT CIRCUMSTANCES AND COMPARISON TO PEERS
12
On the following pages, we compare the practices of the TSP to those of peer defined contribution plans. In order to compare the TSP to an appropriate sub-set of peers, we use information from two widely followed defined contribution surveys – Profit Sharing/401(k) Council of America (PSCA) and Vanguard – both of which provide information on private sector 401(k) plans. In addition, we compiled information on the offerings of the ten largest public sector (and quasi-public sector) defined contribution plans shown in the table below. Top Ten Public Sector (Quasi Public Sector) Savings Plans by Assets Name of Fund Market Value ($Billions) New York Retirement Systems $20.8 University of California Retirement Systems 11.3 Washington State 9.9 New York City Investment Board 9.9 Ohio Public Employees Deferred Compensation 7.9 California State Savings Plan 7.2 County of Los Angeles 7.1 State Board of Administration Florida 6.4 North Carolina Retirement Systems 5.7 Indiana Public Retirement System 5.5 Observations From a practical standpoint, it is worth noting that while peer comparisons provide a good
reference point, the large size of TSP’s assets limit the options that can be offered to participants due to the size and liquidity attributes of a potential offering’s market capitalization/opportunity set. Moreover, the TSP’s governing statute and Board policies (such as offering passive options), limit the number of options that can be made available to participants.

REVIEW OF CURRENT CIRCUMSTANCES AND COMPARISON TO PEERS
13
The table below shows the types of investment options commonly offered to participants. Investment Options Commonly Offered Fund Type
TSP PSCA (5,000+ Participants)
Vanguard (5,000+
Participants) Top 10 Public Sector Plans
Balanced Fund No 54% 74% 60% Bond Fund – Active Bond Fund – Passive International Bond TIPS* High Yield
No Yes No Yes No
77 58 13
N/A N/A
67 85
N/A 40 22
100 50 0 40 10
Cash (CD/Money Market)* Yes 39 64 40 Company Stock No 52 43 0 US Equity – Active US Equity – Passive US Large Cap Value US Large Cap Growth US Mid Cap US Small Cap
No Yes No No No No
85 90
N/A N/A N/A N/A
93 99 88 92 80 81
70 100 50 50 70
100 International Equity – Active International Equity – Passive Emerging Markets
No Yes No
80 48
N/A
88 56 25
80 60 30
Target Date/Asset Allocation Fund Yes 75 91 90 Real Estate Fund No 22 26 10 Stable Value* Yes 80 64 90 Self-Directed (Brokerage/Mutual Fund) No 32 21 30 Socially Responsible No N/A N/A 60 Source: PSCA 49th Annual Survey of Profit Sharing and 401(k) Plans (20011 Plan Experience), Vanguard 2011, Hewitt EnnisKnupp *For the purpose of this analysis, we classify the G Fund, offered within the TSP, to represent three options – money market, stable value and TIPS – since it provides benefits and/or attributes associated with each of these categories. The G Fund adjusts almost immediately to changes in interest rates (without any principal volatility), which may be a result of rising inflation (TIPS), provides daily liquidity (money market), and provides higher yields than money market without risk of loss to principal (stable value).

REVIEW OF CURRENT CIRCUMSTANCES AND COMPARISON TO PEERS
14
Observations The TSP offers investment options in the most widely provided categories.
The areas where TSP does not offer options that are commonly utilized by peers include US
large cap growth/value, active equity and active bonds. Exposure to the market return (beta) that these active funds provide can be gained through passive domestic/international equity and passive bond funds (funds C, I & F). On this issue, it is important to note the research that we and others in the industry have conducted shows that a vast majority of active funds fail to add value net of fees. As such, we do have a bias toward utilizing passive investments/funds, especially in defined contribution plans.
Socially Responsible Investment (SRI) funds are offered by a majority of the largest public sector
defined contribution plans, however, most of the exposure to stocks that such funds provide can be gained through the C, S & I funds as SRI is a subsector of equities and not a distinct asset class.
Balanced funds are offered by the majority of large defined contribution plans, however, most of
the exposure can be obtained by using the L Funds or a combination of C, S, I, F and G funds. In the following tables, we show the participant asset allocation practices according to the three marketplace surveys mentioned earlier. PSCA: Participant Asset Allocation
Plans with 5,000+
Participants
Allocations Excluding
Company Stock
TSP
Cash (CD/Money Market) Stable Value Bonds – Active Bonds – Passive International Bonds
4% 16 5 3 0
5% 20 6 4 0
-- 43 -- 8 --
Total Fixed Income 28 35 51 Company Stock US Equity – Active US Equity – Passive International Equity – Active International Equity -- Passive
22 16 12 4 2
-- 20 15 6 2
-- -- 30 -- 5
Total Equity 56 43 35 Balanced Sector Funds Self-Directed Target Date/Lifecycle Other
6 0 1 8 1
7 0 1 11 1
-- -- -- 14 --
TOTAL 100% 100% 100% Source: PSCA 55th Annual Survey of Profit Sharing and 401(k) Plans (2011 Plan Experience)

REVIEW OF CURRENT CIRCUMSTANCES AND COMPARISON TO PEERS
15
Observations TSP participants have significantly less allocated to equities than their peer group.
TSP participants have similar allocations to bond funds, however significantly more in stable
value than their peer group. TSP participants have a higher allocation to target date/life cycle funds than their peer group.
The table below shows the asset allocation practices according to Vanguard 2011 survey. 2011 Vanguard Survey: Participant Asset Allocation Vanguard Plan
Assets Allocations
Excluding Company Stock
TSP
Cash Equivalents Bond
16% 9
18% 10
43% 8
Total Fixed Income 25 28 51 Company Stock Diversified Stock
10 43
-- 48
-- 35
Total Equity 53 48 35 Balanced Target Date/Lifecycle Funds
10 12
11 13
-- 14
TOTAL 100% 100% 100% Source: Vanguard 2011

REVIEW OF CURRENT CIRCUMSTANCES AND COMPARISON TO PEERS
16
Observations TSP participants have similar allocations to bond and target date funds as their peers.
Even when excluding allocations to company stock, TSP participants still have significantly less
exposure to equities when compared to its peers. TSP participants have the highest allocation to the lowest risk, stable value fund option.
The graph below shows the 20 year historical risk/return relationship characteristics of the TSP’s current investment options. Returns are shown on the Y-axis (annualized return) and risk (annualized standard deviation of return) is shown on the X-axis. The L Funds (target date funds) were introduced in August of 2005 and consist of varying proportions of the G, F, C, S, and I Funds. The historical risk/return characteristics of each L Fund are determined by the component weights for each fund. As shown, the investment funds currently offered to participants span the risk/return spectrum from conservative to more aggressive risk.
Summary TSP participants are offered broad exposure to major asset classes within the five core investment options that span the risk spectrum. The L Funds deliver the choice of pre-mixed portfolios that offer participants well diversified portfolios with automatic rebalancing that provides a glide path to higher fixed income allocations (lower risk portfolios), as the participant’s time horizon shortens. The investment options are provided through low-cost, passively managed funds. Relative to peers, the TSP offers fewer choices; however, our review of the program leads us to the conclusion that there are no major gaps within the core investment options. However, there are areas within the broader equity universe that are not represented in the core options (small cap international and emerging markets) that may provide better risk adjusted returns when included as part of the broader equity exposure. We also believe it will be worthwhile reviewing additional asset
Efficient Frontier -- Based on 20 Years of Historical Data Ending 12/31/12
G Fund
F Fund
C Fund
S Fund
I Fund
T-Bills
0%
2%
4%
6%
8%
10%
0% 2% 4% 6% 8% 10% 12% 14% 16% 18% 20%
Annualized Risk
Exp
ecte
d G
eom
etri
c Re
turn

REVIEW OF CURRENT CIRCUMSTANCES AND COMPARISON TO PEERS
17
classes that may provide participants with better flexibility and that may increase the benefits of diversification. Having discussed TSP’s circumstances and how it compares to peers, we now review the factors that impact participant behavior and our thoughts on how to best implement an investment option structure from a “macro” perspective.

18
(This page left blank intentionally)

19
INVESTMENT STRUCTURE

20
(This page left blank intentionally)

INVESTMENT STRUCTURE
21
Investment Structure The investment structure of a participant-directed defined contribution plan refers to the number and type of options offered to participants. This is the most important component of the investment program. It will not only determine the structure of investment options offered to participants, but will also: Shape how participants invest their assets Impact the participants’ perceived value of the Plan
We believe a plan’s investment options should offer a sufficient range of choice to allow participants to form well-diversified portfolios, given a reasonable range of risk and return circumstances. As such, we recommend that the TSP have a structure that: Offers sufficient range of choice – with options that span the risk and return spectrum Allows participants to form well-diversified portfolios Meets broad participant demand Is appropriately comparable with peers
We recommend that at a minimum the TSP offer the investment option types listed below. The investment option types provide representation of all major asset classes typically considered suitable for defined contribution plans, represent the major building blocks for a diversified portfolio, and allow for representation of different levels of risk: U.S. stock Non-U.S. stock Diversified fixed income Cash equivalent/stable value Lifecycle
The TSP currently offers at least one broadly diversified “core” investment fund in each of these categories. We generally recommend offering only a single option in the cash equivalent/stable value, diversified fixed income and international stock categories, as one option is all that is necessary to provide the asset class exposure required to diversify participant portfolios. However, it is common practice to provide two options for international stock (developed and emerging markets). In general, we would not recommend offering an emerging market equity fund on a standalone basis for most DC plans, but especially for a plan such as the TSP, given the higher volatility of the asset class.

INVESTMENT STRUCTURE
22
The two categories where it is appropriate to consider multiple options are lifecycle and U.S. stock. It is appropriate to offer multiple lifecycle funds as a program must meet the needs of participants with materially different time horizons (e.g., 5 years vs. 35 years). Offering multiple options in U.S. stock is appropriate for the following reasons: Participants’ knowledge of U.S. stock investing has grown tremendously in recent years –
resulting in increased demand for U.S. stock fund alternatives. As U.S. stock is generally one of the largest components of a participant’s portfolio, a subset of
participants typically want to customize their defined contribution plan U.S. stock portfolios to account for personal (taxable and tax-exempt) investments, complement investment funds available in a spouse’s plan and/or account for their own investment preferences/risk tolerance.
It represents contemporary practice, in part, due to the fact that small cap stocks have different
risk and return attributes relative large cap stocks. The types of U.S. stock funds that are commonly offered across DC are: Core stock index fund Larger-cap value Larger-cap growth Mid/small-cap stock
The TSP does not offer separate large-cap growth and value fund options. We note, however, that participants have access to the entire U.S. stock market, including growth and value stocks, via the C and S Funds. Actively managed U.S. and non-U.S. stock funds are offered in the majority of plans. The TSP has not offered actively managed stock funds as it has not been allowed to do so by statute. It is not necessary for the TSP to offer actively managed stock funds as the TSP has provided broad exposure to the U.S. and non-U.S. stock asset class via the C, S & I Funds. Offering a single option in international stock is appropriate given that it represents contemporary practice; typically, managers of non U.S. investments have not focused on growth/value or large/small divisions when crafting investment products. A vast majority of defined contribution plans offer broad-based non-U.S./international stock funds as opposed to style or capitalization specific funds.

INVESTMENT STRUCTURE
23
Guiding Principles There are three guiding principles we recommend our clients generally employ in structuring their investment fund line-ups. These guiding principles are: Employee education is one of the most important components of a participant-directed defined
contribution plan. Therefore, the less complex the program is, the higher the likelihood of a successful education program, as participants tend to get overwhelmed if there are too many options
The more broadly diversified an asset class, asset category, investment style, etc., the better it will serve participants, in order to avoid non-systematic risk
The investment options of an investment program should be structured/communicated to participants so they have two paths from which to choose – an array of pre-mixed lifecycle funds and an array of broadly diversified asset class/category specific funds
Number of options: Surveys and studies by providers such as, Fidelity and Vanguard, and academics cite that the greater number of options offered, generally the lower a plan’s participation rate and/or the fewer number of investment funds utilized. The unintended consequence of offering too many funds to participants is that instead of selecting the appropriate fund(s) they become overwhelmed and delay their decision to participate. In many cases, they end up not participating at all, or make no investment decision and are mapped to the plan’s default fund. Broadly Diversified Funds: We generally recommend our clients offer participants investment funds that are broadly diversified by security, sector, industry, etc. This assists in avoiding large losses due to an undue concentration in a sector, industry and/or security and assists participants in building broadly diversified portfolios. Tiering of Investment Options: We recommend that clients communicate their lifecycle and asset class/category funds as different decision paths or “tiers”. The first path, or tier, is populated with lifecycle funds and is intended for participants uncomfortable in or not inclined to making investment decisions. Participants are able to then focus on the lifecycle fund that best suits their time horizon. The second tier is comprised of the asset class/category specific funds where participants are able to select and mix funds in order to build portfolios that best suit their needs. Summary For the most part, the TSP’s current practices are reflective of our general advice on how to best structure a participant-directed defined contribution plan. The investment options are well-diversified, the number of options offered in each category are sufficient to gain broad exposure, and participants have two “paths” or “tiers” to select from when making their investment decisions.

INVESTMENT STRUCTURE
24
(This page left blank intentionally)

25
KEY EVALUATION CRITERIA FOR INVESTMENT FUND ALTERNATIVES

26
(This page left blank intentionally)

KEY EVALUATION CRITERIA FOR INVESTMENT FUND ALTERNATIVES
27
In this section of the report, we discuss the key criteria we use to evaluate whether or not an asset class or asset category should be considered as an investment fund for inclusion in the Thrift Savings Plan (TSP). We use these criteria to narrow the asset classes/categories that we review in-depth as potential alternatives. Evaluation Criteria While there are numerous criteria to consider when evaluating the types of investment alternatives to offer in a participant-directed defined contribution plan, we believe the following criteria (individually and collectively) are among the most relevant for the TSP to consider: Major diversified asset classes/categories not currently offered as an investment option Asset class/category is large enough for the TSP to invest in Potential diversification benefit for TSP participant portfolios Index fund products are available for TSP use Daily valuation Practices of peers
We discuss these criteria in more detail below. Major Diversified Asset Classes/Categories Not Currently Offered to Participants We believe it is worthwhile to consider the major diversified capital markets that are not currently offered to TSP participants. The TSP currently provides participants the ability to invest in three of the world’s largest capital markets (U.S. stock, U.S. bonds and non-U.S. developed markets stock), but not all (e.g., non-dollar denominated debt or emerging market stock). For the major diversified asset classes not currently offered to participants, we believe reviewing the rationale why such an asset class/category would or would not be an appropriate asset class/category to add as an investment option is prudent. Our review takes into account the advantages and disadvantages of offering an asset class/category individually as well as how it could potentially allow participants to form improved portfolios.

KEY EVALUATION CRITERIA FOR INVESTMENT FUND ALTERNATIVES
28
Asset Class/Category is Large Enough for the TSP to Invest In Given the extraordinary asset size of the TSP, any investment alternative offered should represent an asset class/category of such significance that the likelihood of the TSP becoming a disproportionately large investor and trader of the asset class/category is minimized. Several of the measures we evaluate are: Size of the asset class/category in terms of market capitalization Liquidity of the market/category Sector diversification within the asset class/category Number of securities that comprise the market /category
The criteria we will use within this category include: Large Capital Market: We define a large capital market by its total market capitalization (the aggregate value of the securities that comprise the asset class/category). We believe the appropriate threshold to use for the TSP is a minimum market capitalization of $1 trillion. This is an important consideration as the extraordinary asset size of the TSP ($330 billion and growing) could cause it to own a large portion of a market that is less than $1 trillion in asset size if participants were to allocate just 10% of the Plan’s assets to a smaller-sized asset class/category. Moreover, the fact that the TSP offers daily liquidity to its participants and participants have transferred substantial assets into and out of its options (e.g., $700 million in a single day and $1.5 billion in six consecutive business days) implies that TSP participants could trade an abnormally large amount of a small market in a single day and significantly impact prices. The market capitalization of each of the benchmarks for the TSP Funds exceeds $2.5 trillion. F Fund C Fund S Fund I Fund Fund benchmark Barclays
Aggregate Bond Index
S&P 500 Stock Index
Dow Jones Wilshire 4500
Index
Morgan Stanley Capital
International (MSCI) Europe, Australasia, and Far East Stock
Index Market capitalization of benchmark
$16.8 trillion $12.3 trillion $2.5 trillion $10.9 trillion
Number of securities
8,000+ 500 4,400+ 900+

KEY EVALUATION CRITERIA FOR INVESTMENT FUND ALTERNATIVES
29
Liquidity We place significant emphasis on liquidity of a potential fund offering, given the need to ensure daily liquidity to participants and to ensure that all participant directed trading activity is met. For existing TSP fund options, liquidity is not a major issue given the large underlying market represent by each fund mandate’s opportunity set. Some markets/sectors may not be able to absorb large trades without impacting prices in a direction that is adverse to participants. If there is excessive demand to buy a stock relative to its supply, it will drive the price of the stock higher temporarily, and vice versa, resulting in a “buy high, sell low” outcome. Trades that constitute a large portion of the average daily volume (ADV) can be expensive; investment managers and traders typically avoid representing more than 10%, and at most 20% of the ADV in any security. While markets/sectors, per se, may be liquid, they may not be liquid enough for very large trades, such as those experienced by some of the TSP Funds. Liquidity of markets is more relevant and important to the TSP than to almost any other defined contribution plan. Based on an analysis of daily participant trading activity, we note that in times of market stress the TSP funds have significantly large cash flows resulting from participant trading activity both on a daily basis and in terms of the aggregate cash flows resulting from trading over consecutive days. Given the size of the TSP, these cash flows can represent a significant portion of the daily market liquidity, which could pose a challenge in meeting participant trading activity as needed and on a low-cost basis. Sector/Security Diversification As we discussed earlier, we believe it is important for defined contribution plans to offer broadly diversified investment options to participants so as to potentially limit the impact of large losses on their portfolios. One way to avoid overly concentrated portfolios is to offer options that are diversified by sector, industry and security. Asset classes/categories that are comprised of numerous sectors, industries and securities assist in minimizing large losses as the performance drivers of these sectors, industries and securities are different or diversified. Index fund products are available for TSP use We review the availability of index fund strategies that offer daily valuation within the asset class/category. This is a relevant criterion as the TSP has historically only offered index products and any product that the TSP may offer needs to offer daily liquidity so that it integrates easily with the plan administration. As discussed in this report, some asset classes/categories do not offer daily valued products or a very limited set of daily valued products, and/or no daily valued index product is currently available. Diversification Benefit We also review the potential “diversification benefit” that adding an asset class/category could offer participant portfolios. The diversification benefit is the risk reduction and/or return enhancement an asset class/category could provide by adding it to portfolios at various risk levels.

KEY EVALUATION CRITERIA FOR INVESTMENT FUND ALTERNATIVES
30
Asset classes/categories that benefit portfolios generally have low correlations relative to the investment funds currently offered and competitive historical and expected risk-return characteristics. Practices of Peers In making decisions about the number and type of investment options to offer in a participant-directed defined contribution plan, it is worthwhile to be aware of contemporary practices. This serves as a guide as participants will likely compare the type of options offered in their plan to those of their spouse, friends, and neighbors. This does not mean that the TSP should be compelled to offer funds just because peer plans offer certain fund types. Rather the types of options to consider should represent a diversified opportunity set that may provide participants exposures not currently available and allow them to form better portfolios. As we discussed earlier in this report, the TSP offers the types of options that are found in the majority of defined contribution plans and the allocations of TSP’s participants to “core” investment options is comparable to that of peers. Asset Classes/Asset Categories Under Consideration Based on the criteria we’ve outlined, we segregate the asset classes/categories that we will review into: Broad asset classes/categories not currently offered to TSP participants Asset classes/categories that TSP participants have exposure to via the current investment
options, but not as a separate fund option Specialty categories that do not fall under the first two categories
The broad asset classes/categories currently not available to participants in any way that we will review are: Non-U.S. bonds High yield bonds Emerging market stock Non-U.S. small-cap stock Real estate (private market) Private equity Commodities Emerging market debt Frontier market stock Hedge funds

KEY EVALUATION CRITERIA FOR INVESTMENT FUND ALTERNATIVES
31
The asset classes/categories that are not explicitly offered to TSP participants currently, but participants obtain some exposure to via the current investment options offered are: U.S. value stock U.S. growth stock Global REITs Infrastructure Socially Responsible Investment (SRI) funds

32
(This page left blank intentionally)

33
APPLICATION OF KEY CRITERIA TO INVESTMENT FUND ALTERNATIVES

34
(This page left blank intentionally)
APPLICATION OF KEY CRITERIA TO INVESTMENT FUND ALTERNATIVES
35
In this section of the report, we apply the criteria developed to the asset classes/categories identified in Section 4 of our report. Application of Criteria In determining the asset classes/categories that the TSP should consider as potential additions to its array of investment funds offered to participants, we first conduct a broad scope review of the possible additions. The purpose of the initial broad scope review is to determine which asset classes/categories are worthwhile to review in-depth and those asset classes/categories that should be eliminated early on in the process. Factors considered included whether: The asset class/category benefits participants’ portfolios meaningfully The asset class/category has a small market capitalization The class/category is unduly concentrated Daily-valued index products are not available It is a common investment option among peer plans
The asset classes/categories we initially review are:
Equities Fixed Income Alternatives/Other U.S. Growth Stock Non-U.S. Bonds Private Real Estate U.S. Value Stock High Yield Bonds Private Equity
Global REITs TIPS Commodities Emerging Market Stock Emerging Market Debt Hedge Funds
Non-U.S. Small-cap Stock Socially Responsible/ Frontier Markets Corporate Governance Funds
Infrastructure

APPLICATION OF KEY CRITERIA TO INVESTMENT FUND ALTERNATIVES
36
Screening Criteria: U.S. Stock, Global REITs and Non-U.S. Stock Asset class/asset category
Current Investment
Fund provides exposure to:
Large market capitalization
>$1 trillion
Diversified by sector, industry
and/or securities
Liquid market Meaningful portfolio
diversifier: correlation of
<0.5 relative to current TSP stock funds*
Daily valued index product is
available
Peer practice
U.S. Growth Equities
Yes Yes ($6 trillion) Yes Yes No Yes Yes
U.S. Value Equities
Yes Yes ($6 trillion) Yes Yes No Yes Yes
Public Real Estate/ Global REITs
Yes; 2% of C, 6%
of S and 2% of I
Funds
Yes ($1 trillion)
Yes – security
Yes – industry
No - sector
Yes; but may be an
issue for TSP if cash
flows exceed $100
million
Yes Yes No
Emerging Markets
No Yes ($4 trillion) Yes
Yes, but may be an
issue for TSP if cash
flows exceed $100
million in a day
No, moderate
benefit as
correlations to C,
S and I Funds
are <0.8
Yes No
Non-U.S. Small-Cap
No Yes ($2 trillion) Yes
Yes, but may be an
issue for TSP if cash
flows exceed $100
million in a day
No, moderate
benefit as
correlations to C,
S and I Funds
are <0.8
Yes No
Frontier Markets
No No; Approx. $100
billion
No – security
No – industry
No -- sector
No Yes
Yes; 2 providers
(Blackrock,
Claymore/BNY)
No
*See appendix for complete correlation matrix

APPLICATION OF KEY CRITERIA TO INVESTMENT FUND ALTERNATIVES
37
Screening Criteria: Fixed Income Asset class/asset category
Current Investment Fund
provides exposure to
Large market capitalization
>$1 trillion
Diversified by sector, industry and/or securities
Liquid market Meaningful portfolio
diversifier: correlation of <0.5 to current
TSP bond funds*
Daily valued index product is available
Peer practice
Non-U.S. Bond
No Yes ($21 trillion) Yes Yes No Yes No
Emerging Market Debt
No Yes ($9 trillion) Yes Yes Yes Yes; 2 providers (Blackrock, SSgA)
No
High Yield No Yes; Just over $1 trillion
Diversified, but has been
concentrated in certain sectors and securities
historically
Yes, but may be an issue for TSP if cash flows exceed $100 million in a
day
Yes Yes No
TIPS No No; Just under $1 trillion
No; not a major issue as securities are backed by the full faith and credit
of the U.S. government
Yes, but may be an issue for TSP if cash flows exceed $100 million in a
day
No; high correlation to F
Fund
Yes Yes; Nearly half of the top
10 government plans offer TIPs
*See appendix for complete correlation matrix

APPLICATION OF KEY CRITERIA TO INVESTMENT FUND ALTERNATIVES
38
Screening Criteria: Real Estate, Private Equity and Alternatives/Other Asset class/asset category
Current Investment
Fund provides exposure to
Large market capitalization:
>$1 trillion
Diversified by sector, industry
and/or securities
Liquid market Portfolio diversifier:
correlation to current funds is
<0.5*
Daily valued index product
is available
Peer practice
Private Real Estate No Yes (>$12 trillion)
Yes – security
Yes – industry
No - sector
No
Yes; due to its
appraisal based
valuations
No No
Private Equity
No Yes ($2 trillion) Yes No
Not applicable;
appraisal based
valuations made
No No
Commodities No
Yes via futures
instruments Yes
Yes; most
futures markets
are liquid
Yes Yes No
Hedge Funds No; active
management
strategy
Not applicable;
not an asset
class
Not applicable;
not an asset
class
No; most
vehicles allow
limited liquidity
Not applicable;
not an asset
class per se
No No
Socially Responsible Investing/Corporate Governance
Yes; Within C, S,
& I Funds Yes ($6 trillion) Yes Yes
No; High
correlation to C,
S & I Funds
Yes
Yes; 6 of 10
large public
plans offer SRI
Publicly Traded Infrastructure (Equities)
Yes; Within C, S,
& I Funds Yes ($1 trillion)
Yes – Security
No – Industry
No – Sector
Yes
No; High
correlation to C,
S & I Funds
Yes; 2 providers
(Blackrock &
SSgA)
No
*See appendix for complete correlation matrix
While index funds are offered across some of the categories noted above, it is important to note that the size of passive offerings may not be sufficiently large and/or products/strategies may not be available from multiple providers. Those factors, in addition to others, may preclude the TSP from obtaining competitive bids from fund providers. Moreover, were the TSP to offer an option to some of the categories listed, it is conceivable that the TSP’s assets

APPLICATION OF KEY CRITERIA TO INVESTMENT FUND ALTERNATIVES
39
could easily represent more than 50% of the major index fund providers’ assets under management in that category and in some cases could be as much as two times providers’ assets under management .

APPLICATION OF KEY CRITERIA TO INVESTMENT FUND ALTERNATIVES
40
Below we discuss the information provided in the tables on the previous pages and provide our rationale why we believe an asset class/category should or should not be further considered as an investment fund option. In sections 6 to 11 of this report we provide an in-depth review of the asset classes/categories we believe are worthwhile to examine in detail. U.S. Stock We review investment fund alternatives in U.S. stock by style (value and growth). We highlight our rationale for reviewing U.S. stock investment funds by valuation below: Larger-cap growth and value market segments are substantial with over $12 trillion market
capitalizations, respectively The market segments are diversified by sector, industry, and securities
Index products from the major index providers are available
These market segments are liquid
Peer practice: a majority of plans offer large-cap growth and value fund options to participants
Allows participants to better customize their TSP portfolio so that it complements their “total
portfolio” – i.e., taxable investments, non-TSP retirement investments and spouse’s assets – to better suit their circumstances
We do not review small cap value and growth funds. As each of these markets is relatively small (approximately $1 trillion in market capitalization), the TSP could face liquidity issues if cash flows exceed $200 million in a day. Participants have access to these segments via the S Fund, and the amount of assets indexed in this category is modest. We discuss the merits of offering large-cap growth and value funds in Section 7.

APPLICATION OF KEY CRITERIA TO INVESTMENT FUND ALTERNATIVES
41
Global REITs We review the merits of adding Global REITs as an investment option. We review REITs as a potential investment fund alternative for the following reasons: REITs have relatively low correlations to the current TSP Funds
REITs have grown substantially in market capitalization in recent years
The major index providers offer REIT index funds
Some investors argue that REITs are a hedge against inflation
REITs are beginning to be offered as investment options in DC plans
We address Global REITs in Section 10 of this report. Non-U.S. Stock We review the merits of offering an emerging markets stock fund. We review the merits of offering a non-U.S. small-capitalization stock fund. We eliminate a frontier markets stock fund from further consideration. As the I Fund is a large- to mid-cap diversified non-U.S. developed markets index fund, we review two potential additions to the TSP investment line-up, emerging markets stock and non-U.S. small-cap stock. Emerging Markets We believe it is appropriate to review the merits of an emerging markets stock fund for the following reasons: Large market with total capitalization of over $4.0 trillion (approximately 15% of world equity
market capitalization) Emerging markets are diversified by country, sector, industry, and securities
TSP participants do not currently have exposure to emerging markets
Daily valued index products are available
Expectations are that emerging markets will provide exposure to some of the world’s most rapidly
expanding economies. Emerging markets now account for over 40% of world GDP.

APPLICATION OF KEY CRITERIA TO INVESTMENT FUND ALTERNATIVES
42
There are a number of issues that warrant further discussion regarding the risks of offering an emerging markets stock fund, which include volatility of returns, market liquidity, political risk and that the majority of peer plans do not offer this fund type. We discuss the merits of adding an emerging markets stock fund in Section 8. Non-U.S. Small-cap Stock We believe it is appropriate to further review the merits of adding a non-U.S. small-cap stock fund, for the following reasons: Market capitalization of nearly $2.0 trillion
Daily valued non-U.S. small-cap stock index funds are offered by major index providers
Modest diversification benefits
Investor’s are realizing the importance of diversification through international equities and as a
result, thinking should be consistent with the U.S. market options. We discuss the merits of offering a non-US small cap option in Section 12 of this report. Frontier Markets Stock We eliminate a frontier market stock fund from further consideration for the following reasons: Small market size of only $100 billion
Concentrated exposures (stock, industry and sector)
Frontier market stock funds are not common practice among peers
Fixed Income We review in-depth the merits of adding a non-U.S. bond fund and an emerging market debt fund. We eliminate TIPS and high yield bond funds from further consideration. Non-U.S. Bond We believe it is appropriate to further review non-U.S. bonds for the following reasons: Large market: non-U.S. bonds represent approximately 20% of the world’s market capitalization
at nearly $21.0 trillion TSP participants do not currently have any exposure to this substantial asset class
Non-U.S. bond market is well-diversified by country, maturity and issuers

APPLICATION OF KEY CRITERIA TO INVESTMENT FUND ALTERNATIVES
43
Non-U.S. bonds have a low correlation to stocks and the unhedged funds have low correlations to traditional bonds
We discuss the merits of offering a non-U.S. bond fund in Section 6. Emerging Market Debt We believe it is appropriate to further consider emerging market debt for the following reasons: Large and rapidly growing market with current market capitalization of $1.7 trillion
Emerging markets have seen improvements relative developed markets in recent years
– Higher GDP growth relative to developed markets – More stable financial condition from large currency reserves and lower public debt than
developed countries – Improved credit ratings relative developed market bonds – Higher yields relative developed markets
Diversification benefits with low correlation to traditional bond and equity markets
Daily valued, index funds are available from major index providers. BlackRock is the largest
index fund provider at nearly $8 billion under management. We review the merits of offering an emerging market debt fund in Section 11 of this report. TIPS We do not believe TIPS warrant further consideration for the following reasons. The size of the market is just under $1.0 trillion.
TIPS are an attractive asset class for investors who seek to hedge against inflation, but the TSP
offers a fund (G Fund) that provides similar characteristics, over the long-term, without negative price volatility associated with a TIPS option.
TIPS are a good hedge against inflation, if they are held to maturity. Over shorter periods,
however, TIPS may not yield a return comparable with inflation since the prices at which the bonds may be traded may not perfectly sync with inflation over a given holding period.
TIPS fund would provide limited diversification benefits to TSP participants and add complexity to
the plan lined-up in area where we do not believe additional flexibility is necessary given the G Fund offering.
Not common practice among peers to offer TIPS funds.

APPLICATION OF KEY CRITERIA TO INVESTMENT FUND ALTERNATIVES
44
High Yield Bonds We do not believe high yield bonds warrant further consideration for the following reasons: While the high yield market is relatively large at $1 trillion, the market has been concentrated in
certain industries over time (casinos, cable, autos). Composition of market is driven by issuers – i.e., the high yield market’s composition is not
necessarily a result of demand by investors as the market’s composition may result from sector/industry issuance and/or downgrading of former investment-grade issuers (e.g., Ford)
Replicating a broadly diversified high yield bond index is very difficult without incurring high
tracking error; Only a highly liquid sub-set can be indexed successfully, however that dilutes some of the diversification benefit
High yield bond funds are not common practice among peers
Private Market Real Estate We eliminate private market real estate from consideration. While we generally advocate that our defined benefit plan clients invest in real estate, we eliminate private market real estate from further consideration. Daily valued direct real estate products are now being offered to defined contribution plans, usually as a sleeve of their target date funds. These funds are typically invested in 1/3 REITs and cash and 3/4 direct real estate to provide daily liquidity. There is a movement in the industry to provide a single real estate asset class that provides exposure to both REITs and direct real estate investments. However, these funds are still fairly small and are limited to target date funds. Private Equity We eliminate private equity from further consideration. Private equity is broadly defined as venture capital, leveraged buyouts, mezzanine financing, distressed debt and special situations. We eliminate private equity from further consideration for the following reasons: Private equity investment vehicles are illiquid, and the assets are valued infrequently - a major
issue for TSP administration No daily valued index product currently exists
Private equity investments cannot be passively managed
Private equity represents a small proportion of the world’s overall market capitalization
Private equity is not a common investment type offered to participants

APPLICATION OF KEY CRITERIA TO INVESTMENT FUND ALTERNATIVES
45
Hedge Funds We eliminate hedge funds from further consideration. While hedge funds have garnered billions of dollars in assets over the past several years, we recommend eliminating hedge funds from further consideration for the following reasons: The hedge fund category is not an asset class in and of itself; rather hedge funds represent a
broad array of active management strategies No daily valued index fund of hedge funds exists
The majority of hedge funds do not offer daily liquidity
Hedge funds are not a common investment offering in peer plans
Commodities We evaluate the merits of offering commodities as an investment option. We believe it is worthwhile to review commodities as a potential investment option for the following reasons: No explicit exposure via current TSP offerings
Diversified among different types of commodities (e.g., oil, metals, grains)
Commodities can be a strong portfolio diversifier
Commodities have shown to be a strong hedge against inflation
Large and liquid market
We discuss the merits of adding a commodities fund in Section 10 of this report. Socially Responsible/Corporate Governance Funds (Equities) We eliminate socially responsible investment (SRI) stock funds from further consideration. While SRI investing has gained in popularity over the years and several of the large public sector plans provide this option, we eliminated SRI from further consideration for the following reasons: SRI is a style of investing that can be implemented passively, but the selection of the SRI issue(s)
is an active decision to exclude or include a security/company – an approach the TSP has not employed previously

APPLICATION OF KEY CRITERIA TO INVESTMENT FUND ALTERNATIVES
46
Identification of an issue(s) would likely draw attention from opposing parties of interest – i.e., difficult to find “perfect” common ground
Exposure to equities found in socially responsible funds can be found in the C, S, & I Funds
While defined contribution plan participants often express an interest in an SRI fund option, our research and experience indicates that an SRI option is not widely offered across the broad spectrum of DC plans (including private sector DC plans). Where an SRI option is offered, we find participant utilization to be low. One explanation of the discrepancy between the apparent participant demand and actual plan sponsor/participant practices is expressed in a study that was conducted by Hartford Financial Services Group in 2004. It notes that “91 percent of defined contribution plan participants would be interested in funds managed by a socially responsible firm as long as the funds boasted top historical performance.” Some of the issues noted above were also reflected in a study conducted by the Government Accountability Office (GAO) titled “Thrift Savings Plan – Adding a Socially Responsible Index Fund Presents Challeneges”. The following is the conclusion from that report: Adoption of an SRI index fund would present challenges for TSP. Currently, the law limits the types of funds that TSP can offer, prohibits overlap among existing funds, and charges TSP to keep its costs low. First, TSP would have difficulty finding an SRI index fund that did not overlap with the existing TSP funds, limiting opportunities for additional portfolio diversification. However, officials at other DC plans, which do not face the same restrictions as TSP, said that a certain amount of overlap with SRI and other investment options was acceptable and the purpose of SRI was to provide an alternative investment choice. Second, TSP would have difficulty selecting SRI screening criteria that all participants and the Congress would find acceptable. While challenging, a number of plans have a long history of SRI in their plans. Finally, under TSP’s current structure, the costs of adding a new fund would be distributed among all participants regardless of whether they participated in that fund. We note that the Board has the authority to open a mutual fund window for participants to invest in mutual funds managed outside TSP. If the Board decides to act on this authority and allow the mutual fund window, participants seeking other forms of investment, including SRI, could invest in mutual funds and would bear the costs associated with this investment.

APPLICATION OF KEY CRITERIA TO INVESTMENT FUND ALTERNATIVES
47
Publicly Traded Infrastructure Funds (Equities) We eliminate publicly traded infrastructure funds from further consideration. Background: The broad infrastructure space comprises of publicly traded equities of infrastructure and infrastructure-related companies and private infrastructure investments. Private infrastructure investments include toll roads, airports, ports, etc. and are offered in fund vehicles similar to private equity investments. We eliminate private infrastructure from further review because of the lack of a daily valued product/strategy in the space and the illiquid nature of this asset class. Publicly-traded infrastructure comprises equity of companies that are directly or indirectly related to the infrastructure space. Most of these companies are concentrated in the industrials, utilities and energy sectors. These may include pipelines, airport services, highways, railroads, ports, electric, gas and water utilities. The chart below shows the sector concentrations of the S&P Global Infrastructure Index. The S&P Global Infrastructure Index is the most commonly used liquid infrastructure index. It has exposures to 75 companies across 19 countries across the world. The Index provides exposure to three broad sectors – energy, industrials, and utilities – as shown in the chart below. The Index is constructed by selecting the largest 30 stocks from the Utilities and Transportation Infrastructure segments and the largest 15 stocks from the Energy Infrastructure segment. S&P notes that up to 20% of the constituents within the Index are emerging market stocks with a liquid developed market listing. The Index is somewhat concentrated in that the top ten stocks represent nearly 40% of the Index, as compared to the S&P 500 Index where the top ten stocks represent approximately 20% of the overall market capitalization.
Concentrated exposure to utilities, energy and industrial sectors of the equity market
Industrials42%
Utilities38%
Energy20%

APPLICATION OF KEY CRITERIA TO INVESTMENT FUND ALTERNATIVES
48
Minimal diversification benefits relative the broader equity market
Publicly traded infrastructure exposure is approximately 5% of the U.S. and international equity
markets and, as a result, can be accessed through the C,S, & I Funds Infrastructure is not a commonly offered option to participants
Summary We conduct an in-depth review of the following asset classes/categories in Sections 6 through 12. Non-U.S. bonds U.S. stock funds by valuation Emerging markets stock Global REITs Commodities Non-US small cap stock Emerging market debt
We eliminate the following asset classes/categories from further consideration: TIPS High yield bonds Private market real estate Private equity Hedge funds Socially responsible/corporate governance funds Frontier markets stock Infrastructure stocks

49
NON-U.S. BONDS

50
(This page left blank intentionally)

NON-U.S. BONDS
51
We review the merits of offering a non-U.S. bond fund as an investment fund alternative. The primary rationale for reviewing non-U.S. bonds includes the significance of non-U.S. bonds in terms of size and the fact that it is diversified by security and issuer. We review the asset class in greater detail and provide our recommendation as to whether the FRTIB should offer a non-U.S. bond fund. Market Size Non-U.S. bonds comprise over 20% of the world markets (stocks and bonds) with approximately $21 trillion in assets. As one of the world’s largest capital markets, it is appropriate to review whether or not the TSP should offer this asset class as a stand alone investment fund. Below we discuss the relevant factors to consider in making this decision, such as historical risk-return characteristics, potential diversification benefits and index product availability. Earlier in our report we noted that non-U.S. bond portfolios were not commonly offered in peer plans. Historical Performance of Non-U.S. Bonds In the table below, we show the historical returns of currency unhedged and currency hedged non-U.S. bonds. We show the returns of the CitiGroup World Government Bond Index (CWGBI) as this is the most widely used non-U.S. bond index. We also show the returns of the Barclays Aggregate Bond Index (benchmark for the F Fund) for comparative purposes. Annualized Returns (As of September 30, 2012)
Trailing Years
CitiGroup World Government Bond Index (Unhedged)
CitiGroup World Government Bond Index
(Hedged)
Barclays Aggregate Bond
Index 1 3.5% 4.9% 5.2% 3 4.0 3.6 6.2 5 6.6 4.6 6.5 10 7.3 4.3 5.3 15 6.0 5.4 6.2 20 6.2 6.5 6.3
The fluctuations in returns between the unhedged CWGBI and the hedged CWGBI are a result of the performance of the U.S. dollar relative to foreign currencies. Recent flight to quality, during the financial crisis, to US government bonds and exposure to credit helped the Barclays Aggregate Bond Index outperform both hedged and unhedged CWBI indexes.
NON-U.S. BONDS
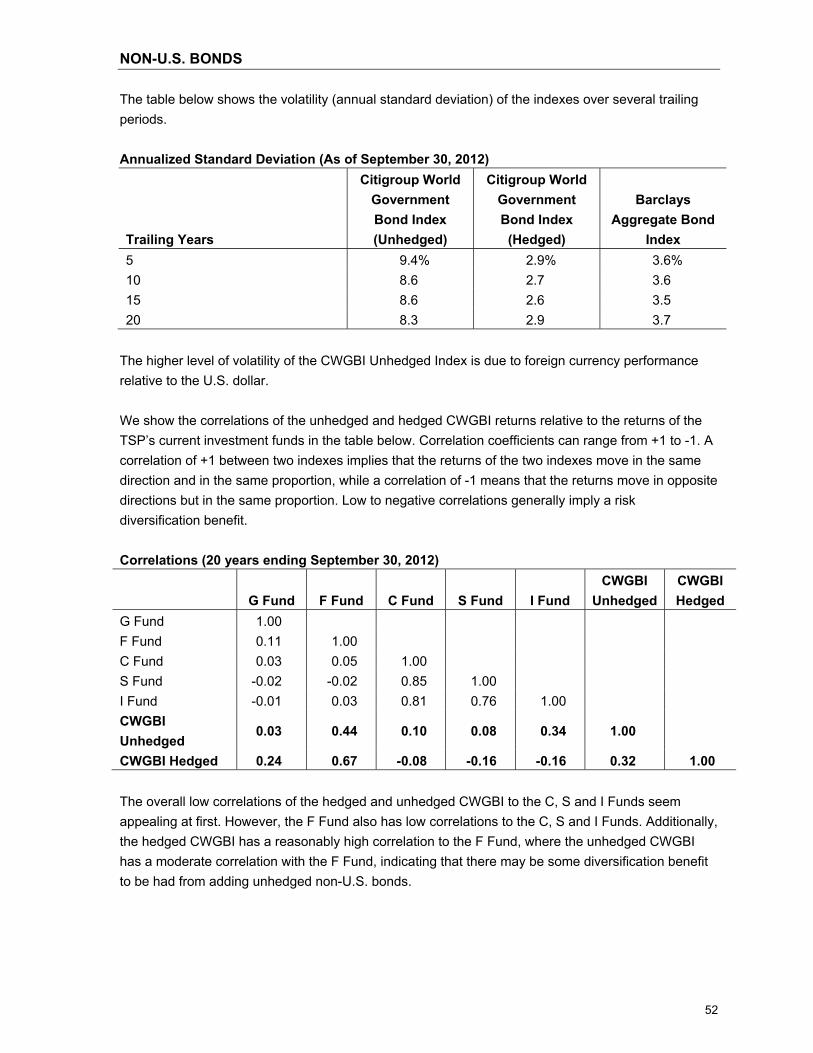
52
The table below shows the volatility (annual standard deviation) of the indexes over several trailing periods. Annualized Standard Deviation (As of September 30, 2012)
Trailing Years
Citigroup World Government Bond Index (Unhedged)
Citigroup World Government Bond Index
(Hedged)
Barclays Aggregate Bond
Index 5 9.4% 2.9% 3.6% 10 8.6 2.7 3.6 15 8.6 2.6 3.5 20 8.3 2.9 3.7
The higher level of volatility of the CWGBI Unhedged Index is due to foreign currency performance relative to the U.S. dollar. We show the correlations of the unhedged and hedged CWGBI returns relative to the returns of the TSP’s current investment funds in the table below. Correlation coefficients can range from +1 to -1. A correlation of +1 between two indexes implies that the returns of the two indexes move in the same direction and in the same proportion, while a correlation of -1 means that the returns move in opposite directions but in the same proportion. Low to negative correlations generally imply a risk diversification benefit. Correlations (20 years ending September 30, 2012)
G Fund F Fund C Fund S Fund I Fund CWGBI
UnhedgedCWGBI Hedged
G Fund 1.00 F Fund 0.11 1.00 C Fund 0.03 0.05 1.00 S Fund -0.02 -0.02 0.85 1.00 I Fund -0.01 0.03 0.81 0.76 1.00 CWGBI Unhedged
0.03 0.44 0.10 0.08 0.34 1.00
CWGBI Hedged 0.24 0.67 -0.08 -0.16 -0.16 0.32 1.00 The overall low correlations of the hedged and unhedged CWGBI to the C, S and I Funds seem appealing at first. However, the F Fund also has low correlations to the C, S and I Funds. Additionally, the hedged CWGBI has a reasonably high correlation to the F Fund, where the unhedged CWGBI has a moderate correlation with the F Fund, indicating that there may be some diversification benefit to be had from adding unhedged non-U.S. bonds.

NON-U.S. BONDS
53
In the following graphs, we show the historical efficient frontier for TSP participants using the current TSP investment options and the efficient frontier if the hedged and unhedged CWGBI were part of the investment line-up. The efficient frontier is the mix of different funds that provides the highest expected return for a given level of risk or the asset mix with the lowest level of risk for a given return.
There is little difference in the historical efficient frontiers for the TSP’s current investment fund and those that include unhedged WGBI, however there is a small improvement when hedged WGBI is added, particularly, in the low risk portfolios. One must caution relying solely on historical data to draw conclusions, as the past may not be indicative of the future. The table below shows the amount of assets indexed to non-U.S. bonds by the three largest institutional index fund managers, Blackrock, Northern Trust Global Investments (NTGI), and State Street Global Advisors (SSgA). Most of the assets indexed to the non-U.S. developed market bonds are in the form of exchange traded funds (ETFs). Non-U.S. Bond Index Fund Products (assets in millions) – All assets Blackrock SSgA
Global Aggregate Bonds $403 0
Non-US Developed Bonds $664 $2,123
Efficient Frontier -- Based on 20 Years of Historical Data Ending 9/30/12
S Fund
I Fund
C Fund
G Fund
F Fund
T-Bills
WGBI Unhedged
WGBI Hedged
0%
2%
4%
6%
8%
10%
0% 2% 4% 6% 8% 10% 12% 14% 16% 18% 20%Annualized Risk
Current Line-Up Adding Hedged WGBI Adding Unhedged WGBI

NON-U.S. BONDS
54
Non-U.S. Bond Index Fund Products (assets in millions) – Daily-valued DC assets Blackrock SSgA*
Global Aggregate Bonds 0 -
Non-US Developed Bonds 0 - *Daily valued DC asset information was not readily available from SSgA Considerations We generally advocate that our clients offer only one investment fund alternative in the diversified fixed income/bond fund category. We advocate simplicity in the bond category as participants generally do not allocate significant assets to bond funds and do not obtain material benefits from specialized bond funds if they have a broadly diversified portfolio. Additionally, it can be difficult to educate participants regarding the drivers of a specialized bond fund’s performance (interest rate sensitivity, credit spreads, currency fluctuations, etc.). Non-U.S. bond funds are not common practice in peer plans and the addition of non-US bond funds has not shown to add material diversification benefits. Only the unhedged non-U.S. bonds offer low correlation to traditional fixed income (F Fund), however significant currency risk is introduced which has not been compensated for with higher returns, over the past twenty years. Conclusion While non-U.S. bonds are a material portion of the world’s market capitalization, indexed assets under management are small and could be overwhelmed by cash flows from the TSP. The benefits of adding a non-U.S. bond option are minimal from an expected risk-return and portfolio diversification standpoint for TSP participants. Moreover, adding a non-U.S. bond fund would add complexity to a segment of the plan where we believe additional flexibility is not required and/or meaningful. As such, we recommend the FRTIB not add a non-U.S. bond fund as an investment fund alternative.

55
U.S. STOCK

56
(This page left blank intentionally)

U.S. STOCK
57
Our rationale for reviewing the merits of offering additional broad-based U.S. stock investment funds include: Participants’ knowledge of U.S. stock investing has grown tremendously in recent years –
resulting in increased demand for U.S. stock fund alternatives. As the allocation to U.S. stocks is generally one of the largest components of a participant’s
portfolio, a subset of participants may desire to customize their defined contribution plan U.S. stock portfolios to account for personal (taxable and tax-exempt) investments, complement investment funds available in a spouse’s plan and/or account for their own investment preferences/risk tolerance.
It represents contemporary practice.
The types of U.S. stock funds that we generally recommend offering are: Core stock index fund Larger-cap value Larger-cap growth Mid-/small-cap stock
Depending upon a plan’s circumstances, four to eight U.S. stock funds are typically offered to participants. The number of options offered is generally influenced by the number of active and passive funds offered and how finely each of the categories is defined. More recently, we have seen a trend across DC plans simplifying their U.S. stock line-up. Several of our clients today simply offer a broad based (all cap, broadly style neutral), active and passive option within their 401(k) plans. The TSP plan already offers access to large cap stocks and mid/small cap stocks via the C and S Funds, respectively. In this section of the report, we focus our attention on large cap value and growth options. Growth stocks are generally thought of as those that have a high earnings growth rate, high price-to-book and high price-to-earnings ratios. Value stocks on the other hand are thought of as those that have a high dividend yield, low price-to-book and low price-to-earnings ratios.
U.S. STOCK
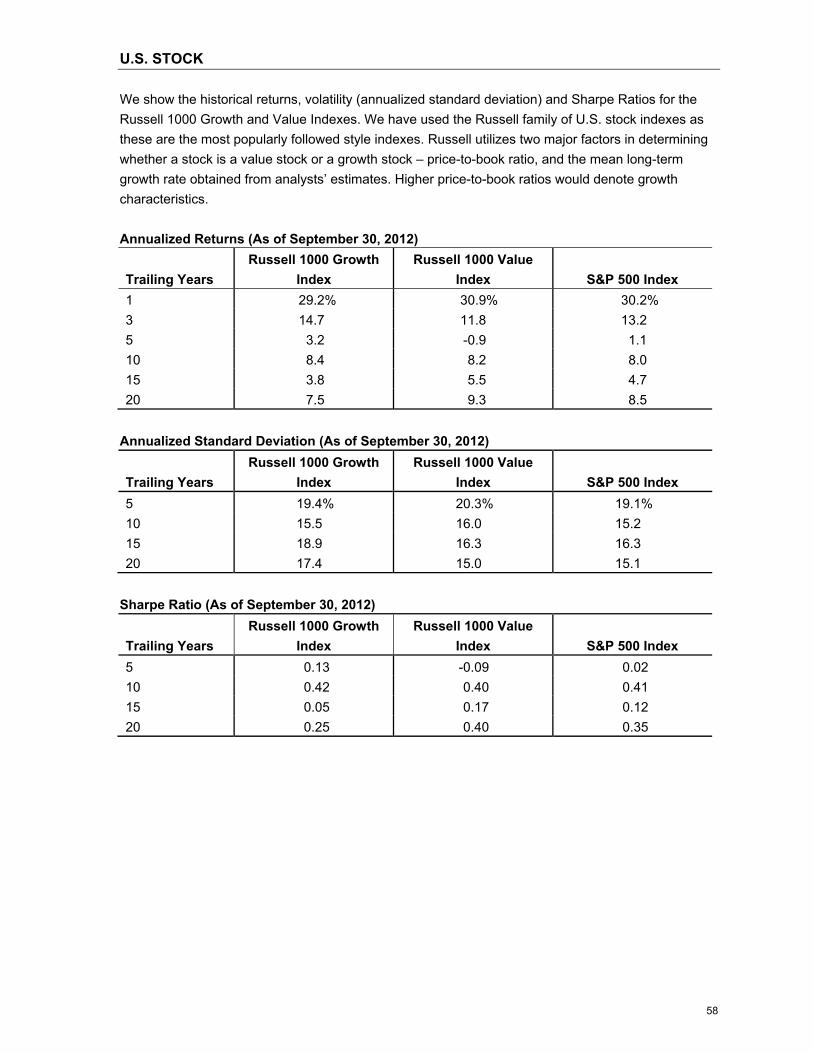
58
We show the historical returns, volatility (annualized standard deviation) and Sharpe Ratios for the Russell 1000 Growth and Value Indexes. We have used the Russell family of U.S. stock indexes as these are the most popularly followed style indexes. Russell utilizes two major factors in determining whether a stock is a value stock or a growth stock – price-to-book ratio, and the mean long-term growth rate obtained from analysts’ estimates. Higher price-to-book ratios would denote growth characteristics. Annualized Returns (As of September 30, 2012)
Trailing Years Russell 1000 Growth
Index Russell 1000 Value
Index S&P 500 Index 1 29.2% 30.9% 30.2% 3 14.7 11.8 13.2 5 3.2 -0.9 1.1 10 8.4 8.2 8.0 15 3.8 5.5 4.7 20 7.5 9.3 8.5
Annualized Standard Deviation (As of September 30, 2012)
Trailing Years Russell 1000 Growth
Index Russell 1000 Value
Index S&P 500 Index 5 19.4% 20.3% 19.1% 10 15.5 16.0 15.2 15 18.9 16.3 16.3 20 17.4 15.0 15.1
Sharpe Ratio (As of September 30, 2012)
Trailing Years Russell 1000 Growth
Index Russell 1000 Value
Index S&P 500 Index 5 0.13 -0.09 0.02 10 0.42 0.40 0.41 15 0.05 0.17 0.12 20 0.25 0.40 0.35

U.S. STOCK
59
We show the correlations of the various capitalization and valuation segments in the following table. Correlations (20 years ending September 30, 2012)
G Fund F Fund C Fund S Fund I Fund
Russell 1000
Growth
Russell 1000 Value
G Fund 1.00 F Fund 0.11 1.00 C Fund 0.03 0.05 1.00 S Fund -0.02 -0.02 0.85 1.00 I Fund -0.01 0.03 0.81 0.76 1.00 Russell 1000 Growth
0.01 0.01 0.95 0.88 0.75 1.00
Russell 1000 Value 0.04 0.07 0.94 0.76 0.78 0.79 1.00 Observations The historical data suggests that approximately a 50/50 mix of growth and value oriented stocks produces risk/return characteristics very similar to that of the S&P 500 Index (C Fund). While historical data, over the past 20 years indicates value-oriented stocks have had superior risk/return characteristics (higher return with less risk), we would caution against coming to conclusions based solely on historical returns. Growth and value oriented stocks fall into and out of favor depending on the market cycle. Some have argued that a value premium exists, but other research indicates that value stocks carry asymmetric risks. Value stocks tend to decline more than growth stocks, during times of economic stress, as is evident in the three and five year returns. The common practice in the marketplace for plans that offer style specific funds is to offer both value and growth funds so complementary styles are offered to participants and they have the flexibility to customize their portfolios. Index Investment Options The table below shows the amount of assets indexed to large-cap value and growth style equities by the major institutional index fund managers. U.S. Equity Styles Index Fund Products (assets in millions) – All assets Blackrock Northern Trust SSgA
Russell 1000 Growth Index $9,727 $13,515 $5,702
Russell 1000 Value Index 9,329 12,247 7,130

U.S. STOCK
60
U.S. Equity Styles Index Fund Products (assets in millions) – Daily-valued DC assets Blackrock Northern Trust SSgA
Russell 1000 Growth Index $2,067 $225 $1,485
Russell 1000 Value Index 1,553 -- 1,165 The level of assets currently invested in index funds benchmarked to the Russell 1000 Value and Russell 1000 Growth Index is material at near $29 billion for each at Blackrock, Northern Trust and SSgA. Considerations While the broad industry trend is moving in the direction of simplification of the U.S. equity line-up, it is still common practice for plans to offer growth- and value-oriented U.S. stock funds, with it being more common to offer larger-capitalization growth and value funds than smaller-capitalization growth and value funds. Larger-capitalization growth and value funds are attractive alternatives from a market size, liquidity, sector and security diversification, and contemporary practice standpoint. The diversification benefits, however, would not be material relative to the current investment funds already available. We do not believe it is necessary for the TSP to offer any additional U.S. stock funds as the C and S Funds provide exposure to the entire U.S. stock market. Offering a more limited number of U.S. stock funds without foregoing material improvement in portfolios would be consistent with avoiding investment choice overload. Conclusion On balance, we do not find a compelling reason to add additional U.S. stock funds, as the TSP’s current investment line-up provides broad exposure to the U.S. stock market via the C and S Funds.

61
EMERGING MARKETS STOCKS

62
(This page left blank intentionally)

EMERGING MARKETS STOCKS
63
We review the merits of offering an emerging markets stock fund as an investment alternative for the following reasons: Large market with total capitalization of over $4.0 trillion (approximately 15% of world equity
market capitalization) Emerging markets are diversified by country, sector, industry, and securities
TSP participants do not currently have exposure to emerging markets
Daily valued index products are available
Expectations are that emerging markets will provide exposure to some of the world’s most rapidly
expanding economies. Emerging markets now account for over 40% of world GDP. While “emerging markets” are a commonly used term in today’s investment world, there isn’t a single concise definition for what constitutes an emerging market economy. In general, countries with developing economies that have low- to mid-per capita income levels and are experiencing positive structural changes to the characteristics of their economic systems can be thought of as emerging market economies. These changes include, but are not limited to, deregulation and privatization of industry, rationalization of monetary and fiscal policies, elimination of trade barriers, enhancement of property rights, etc. In other words, these economies can be thought of as transitional economies – ones that aren’t yet perfectly integrated into the global financial system, but making strides to get there. On the following pages we review the composition of the emerging markets stock index, its historical performance and the potential diversification benefits of adding an emerging markets stock fund. We use the Morgan Stanley Capital International (MSCI) Emerging Markets (EM) Stock Index, the most widely followed emerging markets stock index, to review the characteristics and performance of emerging markets stocks. The following exhibits show that emerging markets are diversified by sector and country. Emerging Market Characteristics (As of December 31, 2012) Market Capitalization ($ in millions) $4.3 trillion Number of Securities 2,616 Average market capitalization $1.7 billion

EMERGING MARKETS STOCKS
64
The countries that comprise the MSCI Emerging Markets Stock Index are shown in the table below. Emerging Market Country Allocation (As of December 31, 2012)
Country/Region %
Allocation China 18.3% India 6.6 Indonesia 2.6 Korea 15.3 Malaysia 3.5 Philippines 0.9 Taiwan 10.6 Thailand 2.5 Asia 60.4% Czech Republic 0.3% Egypt 0.3 Hungary 0.2 Poland 1.5 Russia 6.0 Turkey 2.0 Morocco 0.1 Europe & Middle East 10.4% Brazil 12.6 Chile 1.8 Colombia 1.3 Mexico 5.2 Peru 0.6 Latin America 21.4% South Africa 7.8% Africa 7.8% TOTAL 100.0%
Historical Performance In the following chart, we show the annual returns of emerging markets over time. As seen in the chart, emerging market investments exhibit a very high degree of variability (volatility) from year to year.

EMERGING MARKETS STOCKS
65
We show the annualized returns, volatility and Sharpe Ratios for the MSCI Emerging Markets Stock Index in the following tables.
Annualized Returns (As of September 30, 2012)
Trailing Years MSCI Emerging Markets Index MSCI EAFE Index
1 16.9% 13.8% 3 5.6 2.4 5 -1.3 -4.9 10 17.0 8.5 15 7.2 3.5 20 8.7 5.7
Annualized Standard Deviation (As of September 30, 2012)
Trailing Years MSCI Emerging Markets Index MSCI EAFE Index
5 29.6% 23.5% 10 24.3 18.6 15 26.0 18.1 20 24.1 17.1
Emerging Markets -- Annual Returns
-60%
-40%
-20%
0%
20%
40%
60%
80%
1993 1995 1997 1999 2001 2003 2005 2007 2009 2011
Year

EMERGING MARKETS STOCKS
66
Sharpe Ratio (As of September 30, 2012)
Trailing Years MSCI Emerging Markets Index MSCI EAFE Index
5 -0.07 -0.24 10 0.63 0.36 15 0.17 0.04 20 0.23 0.14
The table below shows the historical correlations of the MSCI Emerging Markets Stock Index relative to the current TSP Funds. Correlations (20 years ending September 30, 2012)
G Fund F Fund C Fund S Fund I Fund MSCI EM
Index G Fund 1.00
F Fund 0.11 1.00
C Fund 0.03 0.05 1.00
S Fund -0.02 -0.02 0.85 1.00
I Fund -0.01 0.03 0.81 0.76 1.00
MSCI EM Index -0.08 -0.02 0.73 0.75 0.77 1.00 Emerging market returns are relatively highly correlated to the C, S and I Fund, reflecting the globalized nature of the world economy and uncorrelated to the F and G Funds. Below we show the efficient frontiers, based on historical data, using the TSP Funds with and without emerging markets as an investment fund alternative.
Efficient Frontier -- Based on 20 Years of Historical Data Ending 9/30/12
S Fund
I Fund
C Fund
G Fund
F Fund
T-Bills
EM Equity
0%
2%
4%
6%
8%
10%
0% 5% 10% 15% 20% 25%Annualized Risk
Current Line-Up Adding EM Equity

EMERGING MARKETS STOCKS
67
As shown, the efficient frontier with emerging markets as an investment fund alternative changes only slightly the risk/return profile at low risk levels (under 10% annualized risk). At the highest risk levels, the benefit is more pronounced (risk greater than 15%). We believe the improvement in the efficient frontier would be of little benefit to the majority of TSP participants as most would not likely construct highly risky portfolios. The tables below show the amount of assets indexed to emerging market equities by the major institutional index fund mangers. Emerging Markets Index Fund Products (assets in millions) – All assets Blackrock Northern Trust Vanguard SSgA MSCI Emerging Markets Index $27,674 $16,882 $75,732 $36,134 Emerging Markets Index Fund Products (assets in millions) – Daily-valued DC assets Blackrock Northern Trust Vanguard SSgA MSCI Emerging Markets Index $2,236 $12 $1,260 $1,891 The total assets indexed to emerging market stocks amongst the leading index fund providers are substantial at approximately $156 billion. Considerations Emerging markets continue to expand and represents approximately 15% of the world’s equity market capitalization. Emerging markets generate over 40% of the world’s GDP. Emerging markets have seen improvements in terms of stronger fiscal position and improving credit ratings of emerging market economies relative developed markets. These developments coupled with higher expected growth rates make compelling case for inclusion. These strong expectations, however, come with considerable risk in terms of volatility of returns and political risk that is not typically present in the developed markets. This causes us to pause when considering such an option for a defined contribution plan, where a participant could potentially put all their assets in a single fund. Emerging market funds are not commonly found in peer plans as stand alone investment options. Liquidity would be another area of concern. Large cash flows of $300 to $400 million in a single day, which is not uncommon in the TSP funds, may be cause for concern from the standpoint of ensuring daily liquidity to meet all participant directed trading activity. Conclusion While emerging markets are a large asset class, expected to experience secular growth, and provide a benefit to portfolios at the highest levels of risk, we have concerns with the TSP offering emerging markets as a stand alone investment fund. The high risk associated with emerging markets has resulted in material losses over relatively short periods of time and is difficult for participants (or for any investor) to bear. Additionally, there are limited benefits to adding emerging market equities to well-diversified low to moderate risk portfolios.

EMERGING MARKETS STOCKS
68
Overall, we believe the negatives of offering an emerging markets investment fund outweigh the positives and recommend an emerging market stock fund not be added as an investment fund alternative. However, we believe that exposure to this asset class could be considered as part of a broader allocation to international equities through the (I Fund). Several large government plans are offering emerging market exposure through broad market index funds that track the MSCI All Country World Index – Ex U.S. In 2012, as part of the study to evaluate the benchmarks for each of the TSP funds, we examined the benefits to expand the I Fund’s mandate to include emerging markets. While the addition of emerging markets appeared compelling on several fronts, we did not believe that it was appropriate to include emerging markets as part of a broader I Fund mandate at that time, owing primarily to cost and liquidity related concerns.

69
GLOBAL REITs

70
(This page left blank intentionally)

Global REITs
71
We review the merits of offering a Global REIT index fund as an investment alternative for the following reasons: REITs have relatively low correlations to the current TSP Funds
REITs have grown substantially in market capitalization in recent years
The major index providers offer REIT index funds
Some investors argue that REITs are a hedge against inflation
REITs are beginning to be offered as investment options
Real Estate Investment Trusts, or REITs are specialized companies that own, and in most cases operate income generating real estate properties. REITs are listed on most major stock markets and can be traded just like shares in any other company. REITs allow smaller investors the ability to share in the ownership of large, income generating real estate such as apartments, offices, hotels, and shopping centers – essentially allowing smaller investors the ability to diversify their exposure to real estate investments through investing in a portfolio of properties rather than an investment in a single or few properties. REITs must distribute at least 90% of their taxable income to shareholders annually. As REITs are publicly traded securities and listed on U.S. and international stock exchanges, REITs are included in the major stock market indexes as part of the finance sector, and as such, we consider REITs a sub-sector, similar to autos within consumer durables, pharmaceuticals within healthcare, or insurance within the finance sector. US REITs represent approximately 2% of the C Fund and 6% of the S Fund. International REITs represent approximately 2% of the I Fund. The table below shows the composition of the FTSE EPRA/NAREIT Global Index. REITs are diversified among many different types of real estate properties. FTSE EPRA/NAREIT Global Index – Sector Breakdown
Sector % Allocation
Retail 24.6%
Residential 12.1
Office 11.8
Diversified 34.5
Lodging/Resorts 2.5
Industrial 4.3
Healthcare 6.4
Self Storage 2.4
Industrial/Office Mixed 1.3

Global REITs
72
The table below shows the country breakdown of the FTSE EPRA/NAREIT Index. The U.S.REIT market represents approximately 40% of the overall market, as represented by the FTSE EPRA/NAREIT Index. FTSE EPRA/NAREIT Global Index – Country Breakdown
Sector % Allocation
U.S. 39.4%
Hong Kong 10.3
Japan 9.6
Australia 7.1
Canada 4.7
U.K. 4.5
Singapore 4.5
Other 19.8
Total 100.0% Historical Performance We show the historical returns, volatility and Sharpe Ratios for the FTSE EPRA/NAREIT Global Index compared to the S&P 500 Index below. Annualized Returns (As of September 30, 2012)
Trailing Years FTSE EPRA/NAREIT
Global Index S&P 500 Index S Fund 1 30.6% 30.2% 16.9%
3 12.9 13.2 5.6
5 -2.2 1.1 -1.3
10 11.8 8.0 17.0
15 7.0 4.7 7.2
20 10.1 8.5 8.7
Annualized Standard Deviation (As of September 30, 2012)
Trailing Years FTSE EPRA/NAREIT
Global Index S&P 500 Index S Fund 5 27.7% 19.1% 19.4% 10 21.6 15.2 15.5 15 20.1 16.3 18.9 20 18.9 15.1 17.4

Global REITs
73
Sharpe Ratios (As of September 30, 2012)
Trailing Years FTSE EPRA/NAREIT
Global Index S&P 500 Index S Fund 5 -0.10 0.02 -0.10 10 0.46 0.41 0.98 15 0.21 0.12 0.24 20 0.36 0.35 0.31
As shown in the tables above, REITs have performed well over longer time periods, relative the S&P 500 Index. REITs outperformed stocks by +1.6%, over the past twenty years along with a slightly higher Sharpe ratio. However, REITs tend to come with more volatility than the broader stock market, as there is no diversification benefit due to its exposure to a single sector of the equity market. We show the historical correlations of REITs to those of the current TSP investment funds in the table below. Correlations (20 years ending September 30, 2012)
G Fund F Fund C Fund S Fund I Fund
FTSE EPRA/
NAREIT Global Index
G Fund 1.00 F Fund 0.11 1.00 C Fund 0.03 0.05 1.00 S Fund -0.02 -0.02 0.85 1.00 I Fund -0.01 0.03 0.81 0.76 1.00 FTSE EPRA/NAREIT Index -0.04 0.16 0.70 0.69 0.78 1.00
As shown in the table above, REITs have had a low correlation to the G & F Funds, but fairly high correlation to the C, S, & I Funds. Given that REITs are a sub-set of equities, it is no surprise that the correlation to the equity funds is fairly high. We show the historical efficient frontiers using the current TSP Funds with and without Global REITs as an investment fund alternative. We use the FTSE EPRA/NAREIT Index as a proxy for Global REITs. The FTSE EPRA/NAREIT Global Index covers listed REITs in both developed and emerging markets. The index is free-float adjusted, screened for liquidity, size and revenue making it suitable for use as the basis for index investment products.

Global REITs
74
As shown, there has been a material improvement in the risk/return trade-off, especially in the middle to higher risk portfolios (10% risk level or higher) when adding global REITs. Historically high returns and moderate correlations to equities had made REITs an attractive addition to the portfolio. We show the amount of assets indexed to Global REITs at Blackrock, Northern Trust and SSgA. Global REITs Index Fund Products (assets in millions) – All assets Blackrock Northern Trust SSgA
Global REITs $401 $2,144 $544 Global REITs Index Fund Products (assets in millions) – Daily-valued DC assets Blackrock Northern Trust SSgA
Global REITs $185 $72 $266 The three leading institutional index fund providers listed above have in aggregate approximately $3 billion in assets indexed to the Global REIT indices. Considerations REITs have gained in popularity in recent years due to their strong performance, low correlation of returns to many of the major capital markets, improved liquidity, and overall growth of the REIT market. Some studies have argued that REITs have inflation-protection properties. This has caused many investors to review whether or not they should have an explicit exposure to REITs. While TSP participants invest in REITs through their investments in the C and S Funds, a REIT option would allow participants to make a specific above-market allocation to the sector.
Efficient Frontier -- Based on 20 Years of Historical Data Ending 9/30/12
S Fund
I Fund
C Fund
G Fund
F Fund
T-Bills
Global REITs
0%
2%
4%
6%
8%
10%
0% 5% 10% 15% 20% 25%Annualized Risk
Current Line-Up Adding Global REITs

Global REITs
75
The number of defined contribution plans offering a REIT option has increased over the years, including one of the ten largest government sponsored defined contribution plans. Nearly one in four plans now offers a REIT option, however utilization rates remain low. Moderate correlations to equity and attractive returns would have made a material improvement in the risk/return trade-off of TSP participant portfolios. The global REITs market has grown to over $1 trillion making it a large enough to consider as a stand alone option. Conclusion While there appear to be compelling attributes supporting the inclusion of global REITs, we do not recommend their inclusion at this time. As noted, TSP participants attain exposure to REITs in market capitalization weights via the C, S and I Funds. One of the hallmarks of the TSP is its simplicity – i.e. streamlined option line-up, broadly diversified options that form the core building blocks for most portfolios. REITs are a specific sector of the global equity market and exhibit a higher degree of volatility than the broad equity market. Adding REITs would make the plan line-up more complex. While the number of plans offering a REIT option has increased, utilization has remained low. According to the PSCA survey, 22% of DC plans with over 5,000 participants offered REIT funds, however only 0.2% of total plan asset were invested in REIT funds. Assets under management in Global REITs are among the smallest of all of the options we have reviewed and TSP cash flows could conceivably overwhelm the funds. Over time, we see this asset class evolving to include direct real estate investments, as part of daily valued index funds that are expected to provide exposure to assets that are not part of the overall equity market and as a result will be an even better diversifier. It may be worthwhile to revisit this asset class in the future as these developments play out, but, for the time being, we do not recommend consideration of a REIT option to the line-up.

76
(This page left blank intentionally)

77
COMMODITIES

78
(This page left blank intentionally)

COMMODITIES
79
Over the last decade, investing in commodities has caught the attention of institutional investors. Steep declines in equity markets coupled with strong returns from commodities and fears of higher inflation, due to large budget deficits, have contributed to this phenomenon. Commodities include energy (crude oil, natural gas, etc.), precious metals (gold, silver, etc.), base metals (copper, aluminum, etc.), and agricultural products (cattle, soybeans, etc.). Commodities provide a strong diversification benefit, as they tend to have low or even negative correlations with other asset classes. Investing in commodities is typically achieved using futures contracts, as investing in physical commodities is generally not feasible; most investors don’t have the ability to buy and store crude oil or grains. Futures contracts can be bought by placing a margin deposit with the futures broker. The margin is typically a small fraction of the value of the futures contract and is adjusted (marked-to-market) on a daily basis depending on the change in the value of the contract. In order to gain exposure to the underlying commodity / financial instrument, the investor need only place a fraction of the value of the exposure desired in the margin account, implying that purchasing futures contracts on margin essentially results in the use of leverage. In order to maintain an un-levered exposure to the underlying commodity, an investor can buy the necessary futures contract on margin and place the remaining investments in cash or a cash-like instrument. As a result, the returns from a long-only un-levered investment in futures contracts can be decomposed as follows: Spot Return – Return attributable to the change in the price level of the underlying commodity represented by the futures contract Roll Return – Return associated with “rolling” the futures contract at each contract maturity date. Futures contracts have a finite life. In order to maintain continuous exposure to the underlying assets, investors need to sell near-dated futures contracts at expiration and buy longer-dated contracts. The process of trading the futures to maintain exposure to the underlying commodity is referred to as rolling the futures. The roll process can result in either a profit or a loss. Collateral Return – The yield on the cash or government bond instrument held as collateral against the futures investment.

COMMODITIES
80
The chart below shows the sector breakdown of the Goldman Sachs Commodities Index (GSCI) and Dow Jones-UBS Commodity Index, which are the most widely tracked commodities indexes. Sectors DJ-UBS GSCI Energy 31.7% 69.0% Agriculture 30.7 15.5 Industrial Metals 18.8 6.9 Precious Metals 12.8 3.5 Livestock 6.0 5.0
Historical Performance We show the historical performance of the Goldman Sachs Commodities Index (GSCI) and Dow Jones-UBS Commodity Index, the most widely tracked commodity indexes, below. Annualized Returns (As of September 30, 2012) Trailing Years DJ-UBS GSCI 1 6.0% 12.7% 3 5.3 6.5 5 -3.0 -5.5 10 5.2 3.4 15 4.0 2.4 20 5.5 3.6
Annualized Standard Deviation (As of September 30, 2012) Trailing Years DJ-UBS GSCI 5 22.1% 27.9% 10 18.5 25.2 15 17.4 24.2 20 15.5 21.8
Sharpe Ratios (As of September 30, 2012) Trailing Years DJ-UBS GSCI 5 -0.17 -0.22 10 0.18 0.06 15 0.07 -0.01 20 0.15 0.02
The DJ-UBS Index has been significantly less volatile than the GSCI Index because it has lower concentration in the energy sector. Commodities in general have had fairly low Sharpe ratios, due to modest returns and high volatility. Given, the high volatility and concentrated nature of the GSCI Index, we will eliminate it from further analysis, in the remainder of this section.

COMMODITIES
81
Correlations (20 years ending September 30, 2012)
G Fund F Fund C Fund S Fund I Fund DJ-UBS GSCI G Fund 1.00 F Fund 0.11 1.00 C Fund 0.03 0.05 1.00
S Fund -0.02 -0.02 0.85 1.00 I Fund -0.01 0.03 0.81 0.76 1.00 DJ-UBS 0.05 0.04 0.33 0.35 0.45 1.00
As shown in the table above, commodities have had very low correlation of returns relative to the TSP’s current investment funds. Below we show the amount of assets indexed to commodities with the leading index fund providers. Commodities Index Fund Products (assets in millions) – All assets
Blackrock Credit Suisse SSgA Deutsche Bank
DJ UBS $1,159 $5,500 $502 -- GSCI $1,330 -- $6,750 Commodities Index Fund Products (assets in millions) – Daily-valued DC assets
Blackrock Credit Suisse SSgA Deutsche Bank
DJ UBS $391 -- -- -- GSCI -- -- -- $3,375 Over $15 billion is indexed to the major commodities indexes by the three major index providers of commodities. While Credit Suisse and Deutsche Bank are not large providers of a wide range of institutional index products, they are the largest commodities index fund providers. Credit Suisse & SSgA could not provide the amount that was managed within daily-valued DC assets. Based on the last 20 years of historical data, for the DJ-UBS Commodity Index, our optimization programs do not recommend adding commodities to existing TSP investment funds. The benefit of low correlation to other TSP funds has been offset by low returns and high risk. We must caution against using historical performance as the only consideration. Over the last 5 years, poor performance of the index has significantly lowered the 20 year return, which is an input into the optimization. Had the optimization been performed five years ago, the results would have been significantly different with higher commodity returns that would have shown a benefit to the TSP program. The chart below shows the rolling five year returns of the DJ-UBS Commodity Index which shows current historical commodity returns are near their lows compared to five years ago when they were near their highs. We used the DJ-UBS Commodity Index, due to its more diversified allocation (less emphasis on energy).

COMMODITIES
82
We utilized Hewitt Ennisknupp’s most recent capital market assumptions (forward-looking) to analyze whether it would change the results of the optimization. For the TSP funds, we used asset class proxies that most closely represent the TSP funds (U.S. large cap, U.S. small cap, international developed equity, core bonds and cash). Our forward-looking assumptions have commodity returns at low levels (3.8% versus 7.5%.for equities) with comparable risk (21.0% versus 21.5%). Below is the efficient frontier using HewittEnnisknupp’s forward-looking capital market assumptions with and without commodities.
5 Year Rolling Annualized Returns -- DJ-UBS Commodity Index
-10
-5
0
5
10
15
20
Sep-97 Sep-98 Sep-99 Sep-00 Sep-01 Sep-02 Sep-03 Sep-04 Sep-05 Sep-06 Sep-07 Sep-08 Sep-09 Sep-10 Sep-11 Sep-12
Efficient Frontier -- Based on 10 Year Forward-Looking Assumptions*
US Small Cap
International Equity
US Large Cap
CashCore Bonds
Commodities
0%
2%
4%
6%
8%
10%
0% 5% 10% 15% 20% 25% 30%Annualized Risk
Current Line-Up Adding Commodities

COMMODITIES
83
Even when using forward-looking assumptions, the addition of commodities has very minimal improvement on the efficient frontier, over using only the current TSP options. Despite low correlations to other assets, the low expected return and high risk offsets those benefits. Considerations Commodities futures offer a diversification benefit, relative to equities and a potential hedge against inflation. We note that spot commodities have actually underperformed both cash and inflation over the long term; commodity futures have outperformed because of the roll return and collateral yield. Unlike other capital assets such as equities or fixed income securities, commodities do not represent the capitalization of a stream of future cash flows. Commodity prices and consequently returns, are driven by current and expected supply/demand; we have no means to expect the roll returns of the past to continue in the future. To complicate matters, many commodities are trading in contango which is where the spot price is cheaper than those expiring in the future. This is important because it will have the effect of producing negative roll yield, as more expensive futures are purchased to replace expiring ones, in order to maintain exposure. Historically, most commodities traded in backwardation which produced positive roll yield. Studies have indicated that the increase in speculation versus hedging may have some influence on the increased incidence of contango in commodity futures markets. Participants’ general knowledge of the intricacies of the working of commodity futures is likely to be minimal, which could result in inappropriate allocations to such an investment fund in the program. We also note that it is not a commonly offered investment option in defined contribution programs. Conclusion Commodity futures offer a diversification benefit, as well as the potential to hedge against inflation. However, commodity prices are influenced by demand/supply considerations rather than the intrinsic value of a security, and future return expectations are uncertain. Most individual investors will have difficulty in determining an appropriate allocation to commodities. Commodity funds are also not a common investment option in defined contribution plans. We recommend that the FRTIB not offer commodities as an investment option in the TSP.

84
(This page left blank intentionally)

85
EMERGING MARKET DEBT

86
(This page left blank intentionally)

EMERGING MARKET DEBT
87
We review the merits of offering an emerging market debt fund as an investment alternative for the following reasons: Large and rapidly growing market with current market capitalization of $1.7 trillion
Emerging markets have seen improvements relative developed markets in recent years
– Higher GDP growth relative to developed markets – More stable financial condition from large currency reserves and lower public debt than
developed countries – Improved credit ratings relative to developed market bonds – Higher yields relative to developed markets
Diversification benefits with low correlation to traditional bond and equity markets
Daily valued, index funds are available from major index providers, however the maximum
tradeable dollar amount per day is only $50 million with transaction costs of 25 to 50 basis points. Emerging market debt are bonds issued by emerging market countries’ governments and corporations. These may be denominated in U.S. dollars (hard currency) or local currencies. Emerging market debt indexes come in many flavors -- hard versus local currencies and government versus corporate bonds. Emerging market debt, with a market cap of approximately $9 trillion now accounts for around 20% of the total global bond market capitalization. We focus our analysis on the U.S. dollar (hard currency) part of the market which amounts to approximately $1.7 trillion. Hard currency emerging market debt tends to be less volatile because there is no currency risk associated with these bonds, while most of the risk associated with local currency denominated bonds is as a result of the currency fluctuations. The most commonly used benchmark for the hard currency part of the market is the J.P. Morgan EMBI Global Diversified Index. This index consists of sovereign and quasi-sovereign bonds. There are no corporate bonds in this index. There has been growing interest in emerging market debt for several reasons. First, emerging market bonds still command higher yields than comparable U.S. bonds, though low by historical standards. Second, emerging market countries have experienced improving fundamentals such as rapid GDP growth rates with emerging markets share of global GDP around 40%, lower government debt, more investor protections and higher credit quality. Third, emerging market debt has low correlations to stocks and traditional fixed income which will provide diversification benefits. There are still many risks associated with emerging market debt. The chief concern is always the possibility of political instability. Emerging market countries are still very dependent on the export of commodities and any slowdown in demand can hurt economic prospects.

EMERGING MARKET DEBT
88
Historical Performance of Emerging Market Debt In the table below, we show the historical returns of emerging market debt. We show the returns of the J.P. Morgan EMBI Global Index as this is the most widely used emerging market debt index for hard currency emerging debt. We also show the returns of the Barclays Aggregate Bond Index (benchmark for the F Fund) for comparative purposes. Annualized Returns (As of September 30, 2012)
Trailing Years
J.P. Morgan EMBI Global
Index
Barclays Aggregate Bond
Index 1 20.6% 5.2% 3 12.3 6.2 5 10.3 6.5 10 12.5 5.3 15 9.6 6.2 18 Years and 9 Months 10.5 6.2
The performance of the J.P. Morgan EMBI Global Index has been very strong relative traditional bonds over both short and longer time periods. The table below shows the volatility (annualized standard deviation) of the indexes over several trailing periods. Annualized Standard Deviation (As of September 30, 2012)
Trailing Years
J.P. Morgan EMBI Global
Index
Barclays Aggregate Bond
Index 5 10.7 3.6 10 9.0 3.6 15 12.7 3.5 18 Years and 9 Months 13.5 3.7
J.P. Morgan EMBI Global Index has had significantly more volatility than traditional bonds, but it has come with significantly higher returns.

EMERGING MARKET DEBT
89
We show the correlations of J.P. Morgan EMBI Global Index relative to the returns of TSP’s current investment funds in the table below. Correlations (18 years and 9 months ending September 30, 2012)
G Fund F Fund C Fund S Fund I Fund JPM-EMBI
G Fund 1.00 F Fund 0.10 1.00 C Fund 0.02 0.05 1.00
S Fund -0.03 -0.02 0.85 1.00
I Fund -0.02 0.01 0.83 0.78 1.00 JPM-EMBI -0.02 0.33 0.54 0.52 0.50 1.00
Emerging market debt is modestly correlated to the C, S, & I Funds and has low correlations to the G and F Funds. Index Investment Options The table below shows the amount of assets indexed to emerging market debt indexes by the major institutional index fund managers. Emerging Market Debt Index Fund Products (assets in millions) – All assets
Blackrock Northern Trust SSgA
Emerging Market Debt $7,641 - $168 Emerging Market Debt Index Fund Products (assets in millions) – Daily-valued DC assets
Blackrock Northern Trust SSgA
Emerging Market Debt - - - Approximately, $8 billion in assets are managed to various emerging market indexes, by the leading institutional index providers. Most of the assets are managed within exchange traded funds (ETFs). Vanguard is also set to launch a fund in the near future. The providers could not tell us what portion of the assets were in daily-valued DC plans.

EMERGING MARKET DEBT
90
Below we show the efficient frontiers, based on historical data, using the TSP funds with and without emerging market debt as an investment fund alternative.
As shown, the efficient frontier with emerging market debt as an investment fund alternative significantly improves the risk/return trade-off. We must use caution from drawing too many conclusions from historical data as the strong returns of the past may not be indicative of future returns. Given the tremendous flows into this rapidly growing asset class in recent years, we will want to examine the effects on adding emerging markets debt, using our forward-looking estimates of risk and return.
Efficient Frontier -- Based on 18 Years and 9 months of Historical Data Ending 9/30/12
S Fund
I Fund
C Fund
G Fund
F Fund
T-Bills
EM Debt
0%
2%
4%
6%
8%
10%
0% 5% 10% 15% 20% 25%Annualized Risk
Current Line-Up Adding Emerging Market Debt

EMERGING MARKET DEBT
91
Below we show the efficient frontiers, based on Hewitt Ennisknupp’s most recent capital market assumptions. Our forward-looking assumptions for emerging market debt are significantly more modest than historical returns at 3.4% versus 10.5% historically. The risk estimates are comparable to historical at 12.0% versus 13.5% actual.
In contrast to using historical data, using Hewitt EnnisKnupp’s forward-looking assumptions, there is no material benefit from adding emerging market debt to the current investment options. Recent strong performance has pushed emerging market yields and expected returns to historically low levels. Low expected returns, coupled with fairly high correlations to equities (C, S & I Funds) negate any positives such as higher expected returns and low correlations relative bonds and cash (G & F Funds). Considerations Emerging market debt has seen an explosion of interest in recent years from investors looking for higher yields from an asset class that has low correlation to traditional bonds. Investors have also taken comfort in improving fundamentals with regard to government debts, credit ratings and robust growth rates relative their developed counterparts. Larger and more liquid markets have enabled large institutional index providers to create index products that track various emerging market indexes. However, we have to be cautious when evaluating the merits of this asset class based on only historical information. While recent performance has been strong, we believe future returns will not likely be as strong. There are still significant risks associated with this asset class with regard to political risk and the reliance on commodity driven economies. Liquidity and cost are also of concern as it is estimated that only a maximum of $50 million of daily transaction can be executed at costs of 25 to 50 basis points.
Efficient Frontier -- Based Forward-Looking Assumptions*
US Small Cap
International Equity
US Large Cap
CashCore Bonds
EM Debt
0%
2%
4%
6%
8%
0% 5% 10% 15% 20% 25% 30%Annualized Risk
Current Line-Up Adding EM Debt

EMERGING MARKET DEBT
92
Conclusions While correlations to traditional bonds are low, correlations to equities are fairly high coupled with lower expected returns and high risk making this asset class less appealing as a stand-alone option. Offering emerging market debt, as a stand-alone option, is not common practice (none of the top ten largest public plans offer this option). For these reasons we would not recommend emerging market debt be added as an investment fund alternative.

93
NON-U.S. SMALL CAP STOCK

94
(This page left blank intentionally)

NON-U.S. SMALL CAP STOCK
95
We reviewed the merits of offering a non-U.S. small cap fund as an investment alternative for the following reasons: Market capitalization of nearly $2.0 trillion
Daily valued non-U.S. small-cap stock index funds are offered by major index providers
Modest diversification benefits
Not part of current investment options
Consistent with the approach with respect to U.S. equities to broadly diversify stock exposure
across the entire market capitalization spectrum, it is becoming a common institutional trend to diversify non-U.S. stock exposure into mid and small cap stocks.
Non-U.S. small cap stocks represent approximately 10% of the overall non-U.S. stock market. These companies tend to have market capitalization of $2 billion or less and may be located in both developed and emerging markets. However, our focus will be on developed markets as measured by the MSCI EAFE Small Cap Index. Non-U.S. small cap stocks are believed to have diversification benefits because smaller companies provide more pure exposure to foreign economies. Unlike large caps, small cap companies tend to draw most of their sales from their local countries and rely less on global trade. As a result, their success is less dependent on the global economy and more on local factors. Smaller companies also tend to have higher growth rates. The I Fund is benchmarked to the MSCI EAFE Index which does not contain non-U.S. small cap stocks. The MSCI EAFE Small Cap Index is well diversified by country and sector with over 2,000+ stocks. MSCI EAFE Small Cap Index Characteristics (As of December 31, 2012) Market Capitalization ($ in millions) $1.4 trillion Number of Securities 2,177 Average market capitalization $664 million

NON-U.S. SMALL CAP STOCK
96
The chart below shows the sector composition of the MSCI EAFE Small Cap Index.
The chart below shows the country exposure of the MSCI EAFE Small Cap Index.
MSCI EAFE Small Cap -- Country Breakdown
Japan, 26.20%
United Kingdom, 22.40%
Australia, 8.90%
Germany, 6.10% France, 4.00%
Other, 32.40%
MSCI EAFE Small Cap -- Sector Breakdown
Health Care, 5.49%
Financials, 20.40%
Telecommunication Services, 1.26%
Utilities, 1.70%
Information Technology, 8.76%
Materials, 11.08%
Energy, 4.93%
Consumer Staples, 6.04%
Consumer Discretionary, 18.75%
Industrials, 21.59%

NON-U.S. SMALL CAP STOCK
97
We show the annualized returns, volatility and Sharpe Ratios for the MSCI EAFE Small Cap Index in the following tables. The MSCI EAFE Index was shown for comparative purposes. Annualized Returns (As of September 30, 2012)
Trailing Years MSCI EAFE
Small Cap Index MSCI EAFE Index 1 12.6% 13.8% 3 4.7 2.4 5 -3.0 -4.9 10 11.2 8.5 15 5.5 3.5 19 Years and 9 Months 5.6 6.0
Annualized Standard Deviation (As of September 30, 2012)
Trailing Years MSCI EAFE
Small Cap Index MSCI EAFE Index 5 25.5% 23.5% 10 20.3 18.6 15 19.6 18.1 19 Years and 9 Months 18.7 17.1
Sharpe Ratio (As of September 30, 2012)
Trailing Years MSCI EAFE
Small Cap Index MSCI EAFE Index 5 -0.14 -0.24 10 0.46 0.36 15 0.14 0.04 19 Years and 9 Months 0.13 0.16
As shown in the tables above, non-U.S. small cap stocks have outperformed their larger cap brethren over the 3, 5, 10 and 15 year time periods. Non-U.S. small cap stock volatility has been higher, as expected, over all time periods.

NON-U.S. SMALL CAP STOCK
98
The table below shows the historical correlations of the MSCI EAFE Small Cap Index relative to the current TSP funds. Correlations (19 years & 9 months ending September 30, 2012)
G Fund F Fund C Fund S Fund I Fund MSCI EAFE Small Cap
G Fund 1.00 F Fund 0.12 1.00 C Fund 0.02 0.05 1.00
S Fund -0.03 -0.01 0.85 1.00
I Fund 0.00 0.03 0.81 0.76 1.00 MSCI EAFE Small Cap -0.07 0.02 0.66 0.69 0.89 1.00
Non-U.S. small cap stocks have modest correlations U.S. equities (C & S Funds), high correlations to large cap international stocks (I Fund), but none to bonds & cash (G & F Funds). Index Investment Options The tables below show the amount of assets indexed to non-U.S. small cap stocks by the major institutional index fund managers. Non-U.S. Small Cap Stock Index Fund Products (assets in millions) – All assets
Blackrock Vanguard
Northern Trust SSgA
Non-U.S. Small Cap Index $676 $1,371 $925 $1,093 Non-U.S. Stock Index Fund Products (assets in millions) – Daily-valued DC assets
Blackrock Vanguard Northern Trust SSgA
Non-U.S. Small Cap Index $151 $7 -- $664 Total assets indexed to non-U.S. small cap stocks amongst the leading index fund providers is approximately $4 billion. Based on the last 19 years and 9 months of historical data, for the MSCI EAFE Small Cap Index, our optimization programs do not recommend adding non-U.S. small cap stock to existing TSP investment funds. The benefits of modest correlations to other TSP funds have been offset by low returns and high volatility. We must caution against using historical performance as the only consideration.

NON-U.S. SMALL CAP STOCK
99
Recent poor performance of the index has significantly lowered the 19 year and 9 month return which is an input into the optimization. Had this optimization been run five years ago, non-U.S. small cap stock would have been shown to improve the risk/return trade-off of the TSP investment program. The chart below shows the five year rolling annualized returns of the MSCI EAFE Small Cap Index. Recent returns are near historical lows, in contrast to five years ago when they were near historical highs.
Hewitt Ennisknupp’s does not produce capital market assumptions (forward-looking) for this asset class. However, we believe a small cap premium (MSCI EAFE Small Cap outperforming MSCI EAFE), over the long-term, will most likely exist. In other words, the long-term underperformance of non-U.S. small cap relative to non-U.S. large cap as measured by the MSCI EAFE, in the tables above, will most likely reverse over the long-run. Considerations Now that non-U.S. small cap stocks market size has grown to over $2 trillion and several index products are now being offered, the same argument could be made for a stand-alone non-U.S. small cap as with U.S. small cap. Even though the longest historical period examined underperformed non-U.S. large caps, we believe the small cap premium will be restored over time. Non-U.S. small cap stocks have benefits of modest correlations to other equities, due to less dependence on global market forces and higher growth rates. However, these benefits also come with higher volatility. Very few plans offer non-U.S. small cap and none of the top ten largest public sector plans do. Only a total of $4 billion of non-U.S. small cap index assets are managed by four major index providers. If TSP were to offer a non-U.S. small cap option, it is conceivable that the TSP’s assets to this category could easily represent more than half of the AUM of any single provider.
MSCI EAFE Small Cap Index -- 5 Year Rolling Returns
-10
0
10
20
30
Dec-97 Dec-99 Dec-01 Dec-03 Dec-05 Dec-07 Dec-09 Dec-11

NON-U.S. SMALL CAP STOCK
100
We would prefer to view the international stock asset class from the broadest level, that is consider large and small cap along with emerging market stock, as part of a single asset class or fund alternative. Our guiding principals recommend the more broadly diversified an asset class, the better it will serve participants. Too many fund alternatives will make education more difficult and participation less likely. Conclusion While non-U.S. small cap markets have grown to an adequate size and index products are now offered by major index providers, the level of assets passively managed are still low at only $4 billion. We would prefer to take a more broadly diversified view of international stocks. More broadly defined investment options will make education easier and participation more likely. Non-U.S. small cap may rank second, next to emerging market equity, as one of the higher risk offerings and are not commonly offered, as a stand-alone investment option. The high risk associated with non-U.S. small cap stocks may result in material losses. We would prefer to see non-U.S. small cap included, as part of a broader, international stock investment fund alternative invested in their respective market capitalization proportions. For these reasons, we would not recommend non-U.S. small cap stock be included as a stand-alone investment fund alternative.

101
APPENDIX

102
(This page left blank intentionally)

APPENDIX
103
Annual Returns (1992 – 2011)
Year C Fund S Fund I Fund F Fund G Fund
MSCI ACWI Ex-US Index
MSCI EAFE
Small Cap Index
1992 7.6% 11.9% -12.2% 7.4% 7.2% -- -- 1993 10.1 14.6 32.7 9.7 6.1 -- 37.2 1994 1.3 -2.7 7.8 -2.9 7.2 -- 8.3 1995 37.6 33.5 11.3 18.5 7.0 7.5 -2.0 1996 23.0 17.2 6.1 3.6 6.8 5.1 -0.1 1997 33.4 25.7 1.6 9.7 6.8 -3.3 -24.6 1998 28.6 8.6 20.1 8.7 5.8 12.0 5.4 1999 21.0 35.5 26.7 -0.8 6.0 37.7 17.7 2000 -9.1 -15.8 -14.2 11.6 6.4 -19.4 -7.6 2001 -11.9 -9.3 -21.4 8.4 5.4 -19.8 -12.5 2002 -22.1 -17.8 -15.9 10.3 5.0 -12.9 -7.8 2003 28.7 43.8 38.6 4.1 4.1 42.3 61.3 2004 10.9 18.1 20.2 4.3 4.3 21.9 30.8 2005 4.9 10.0 13.5 2.4 4.5 17.7 26.2 2006 15.8 15.3 26.3 4.4 4.9 26.5 19.3 2007 5.5 5.5 11.4 7.1 4.9 16.1 1.4 2008 -37.0 -38.3 -42.4 5.5 3.7 -46.0 -47.0 2009 26.7 34.8 30.0 6.0 3.0 43.6 46.8 2010 15.1 29.1 7.9 6.7 2.8 12.7 22.0 2011 2.1 -3.4 -11.8 7.9 2.5 -14.3 -15.9

APPENDIX
104
Annual Returns (1992 – 2011)
Year
ML High Yield Index
Citigroup WGBI Ex-
US Hedged
Citigroup WGBI Ex-
US Unhedged
Russell 1000
Growth Index
Russell 1000 Value
Index
MSCI Emerging Markets
Index 1992 17.4 8.0 4.8 5.0 13.8 11.0 1993 16.7 13.4 15.1 2.9 18.1 74.3 1994 -1.0 -4.0 6.0 2.7 -2.0 -7.6 1995 20.5 17.9 19.6 37.2 38.3 -5.5 1996 11.3 11.8 4.1 23.1 21.6 5.7 1997 13.3 11.1 -4.3 30.5 35.2 -11.8 1998 3.0 11.5 17.8 38.7 15.6 -25.6 1999 2.5 2.9 -5.1 33.1 7.3 66.0 2000 -5.1 9.6 -2.6 -22.4 7.0 -30.8 2001 4.5 6.1 -3.5 -20.4 -5.6 -2.6 2002 -1.9 6.9 22.0 -27.9 -15.5 -6.2 2003 28.1 1.9 18.5 29.8 30.0 55.8 2004 10.9 5.2 12.1 6.3 16.5 25.6 2005 2.7 5.7 -9.2 5.3 7.1 34.0 2006 11.8 3.1 6.9 9.1 22.2 32.2 2007 2.2 4.9 11.5 11.8 -0.2 39.4 2008 -26.4 8.0 10.1 -38.4 -36.8 -53.3 2009 57.5 2.4 4.4 37.2 19.7 78.5 2010 15.2 2.5 5.2 16.7 15.5 18.9 2011 4.4 4.1 5.2 2.6 0.4 -18.4

APPENDIX
105
Annual Returns (1992 – 2011)
Year
FTSE EPRA Global REIT
Barclays Inflation Linked Index
DJ UBS Commodity
Index JPM EMBI
Global
S&P Global Infrastructure
Index 1992 -15.2 -- 3.7 -- -- 1993 71.6 -- -1.1 -- -- 1994 -13.6 -- 16.6 -18.3 -- 1995 19.6 -- 15.2 26.4 -- 1996 30.9 -- 23.2 35.2 -- 1997 -7.4 -- -3.4 11.9 -- 1998 -8.2 3.9 -27.0 -11.5 -- 1999 8.9 2.4 24.3 24.2 -- 2000 13.8 13.2 31.8 14.4 -- 2001 -3.8 7.9 -19.5 1.4 -- 2002 2.8 16.6 25.9 13.1 -2.8 2003 40.7 8.4 23.9 25.7 39.0 2004 38.0 8.5 9.1 11.7 29.6 2005 15.4 2.8 21.4 10.7 14.2 2006 42.4 0.4 2.1 9.9 38.6 2007 -7.0 11.6 16.2 6.3 22.4 2008 -47.7 -2.4 -35.6 -10.9 -39.5 2009 38.3 11.4 18.9 28.2 24.0 2010 20.4 6.3 16.8 12.0 4.8 2011 -5.8 13.6 -13.3 8.5 -1.3

APPENDIX
106
Correlations (Based on 20-years of data ending September 30, 2012)* G Fund F Fund C Fund S Fund I Fund
G Fund 1.00 -- -- -- --
F Fund 0.11 1.00 -- -- --
C Fund 0.03 0.05 1.00 -- --
S Fund -0.02 -0.02 0.85 1.00
I Fund -0.01 0.03 0.81 0.76 1.00
MSCI EAFE Small Cap Index1
-0.07 0.02 0.66 0.69 0.89
MSCI ACWI Ex-US IMI2 -0.05 -0.02 0.82 0.81 0.98
ML High Yield Index -0.10 0.23 0.62 0.64 0.62
Citigroup WGBI Ex-US Hedged
0.24 0.67 -0.08 -0.16 -0.16
Citigroup WGBI Ex-US Unhedged
0.03 0.44 0.10 0.08 0.34
Russell 1000 Growth Index
0.01 0.01 0.95 0.88 0.75
Russell 1000 Value Index
0.04 0.07 0.94 0.76 0.78
MSCI Emerging Markets Index
-0.08 -0.02 0.73 0.75 0.77
FTSE EPRA Global REIT
-0.04 0.16 0.70 0.69 0.78
JPM EMBI Global3 -0.02 0.33 0.54 0.52 0.50
S&P Global Infrastructure4 0.06 0.17 0.82 0.79 0.93
Barclays TIPS Index5
0.02 0.72 0.03 0.02 0.08
DJ UBS Commodity 0.05 0.04 0.33 0.35 0.45 *For indexes with less than 20 years history, we used the longest common period (see below). 1) MSCI EAFE Small Cap Index 1/93 2) MSCI ACWI Ex-US IMI 6/94 3) JPM EMBI Global 1/94 4) S&P Global Infrastructure 12/01 5) Barclays TIPS Index 3/97

APPENDIX
107
Hewitt Ennisknupp Capital Market Assumptions as of 4Q 2012 – 10 Years Asset Class Proxies Expected Return Expected Risk US Large Cap Equity C Fund 7.5% 21.0% US Small Cap Equity S Fund 7.7 27.0 International Equity (Developed) I Fund 8.4 22.5 Emerging Market Equity 9.4 31.5 Cash G Fund 1.3 1.0 Core Fixed Income F Fund 1.9 3.0 High Yield Bonds 3.9 14.0 Emerging Market Debt 3.4 12.0 Non-US Developed Bonds (Unhedged)
2.6 10.0
Commodities 3.8 21.5 TIPS 1.7 4.5

(This page left blank intentionally)