Embed Size (px)
Citation preview
OPEN FILE REPORT
FEASIBILITY OF ECONOMIC ZINC, COPPER. SILVER, AND GOLD MINING
IN THE PORCUPINE MINING AREA OF THE JUNEAU MINING DISTRICT, ALASKA
MINERALS AVAILABILITY PROGRAM
BUREAU OF MINESUNITED STATES DEPARTMENT OF THE INTERIOR
15-87
FEASIBILITY OF ECONOMIC ZINC, COPPER, SILVER, AND GOLD MINING IN THE
PORCUPINE MINING AREA OF THE JUNEAU MINING DISTRICT, ALASKA
By
Donald W. Baggs and Gary E. Sherman
December 1986
OFR 15-87
Bureau of Mines Open File Report
No patentable features are contained in this report.
FOREWORD
This Bureau of Mines open file report is one of a series produced inconjunction with an ongoing Bureau of Mines mining district project beingconducted by the Division of Mineral Land Assessment (MLA). Order ofmagnitude economic feasibility studies were conducted on typical deposit typesthat occur in the Porcupine mining area of the Juneau Mining District todetermine ore quantities and metal prices which would allow mineral depositsto be mineable.
4
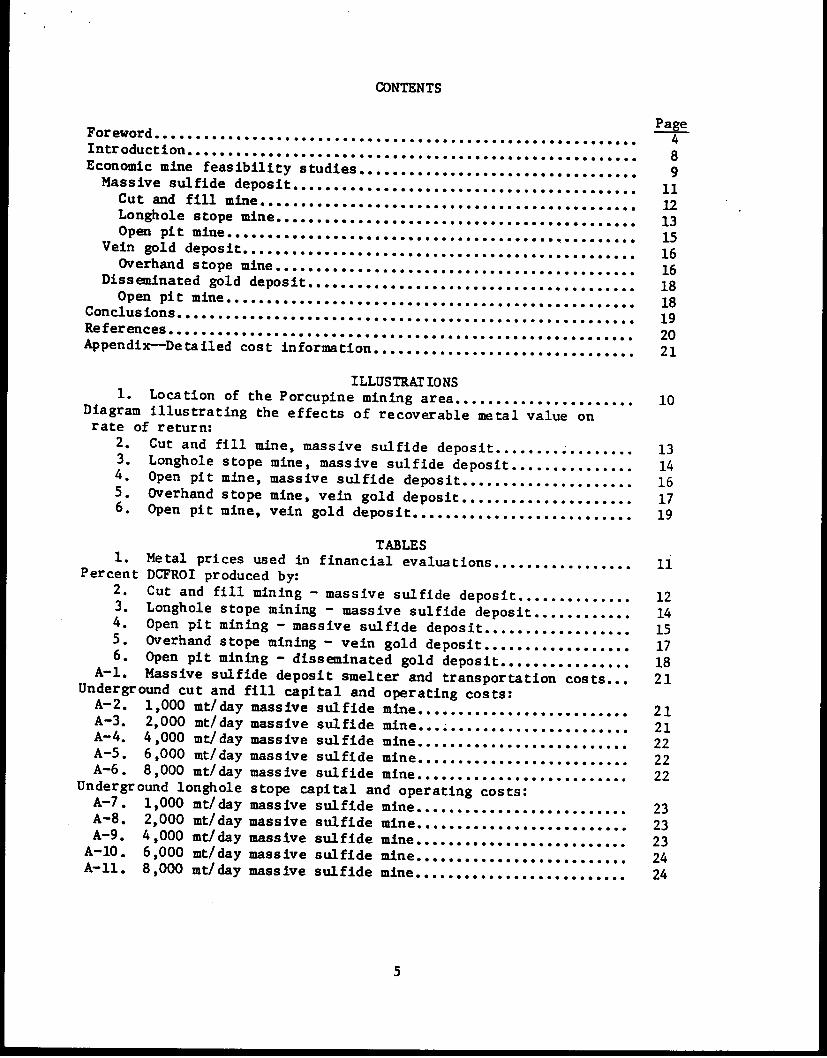
CONTENTS
Foreword...PageIntroduction 4.* * * * * * * * * * * * * * * * * * * * . ................... 8Economic mine feasibility studies ..................... . ............ 9
Massive sulfide deposit ...................................... *. . . 11Cut and fill mine .............................................. 12Longhole stope mine... .. * .................................................. . . 13Open pit mine ............................................................ 15
Vein gold deposit ......... ..................... .. . ... ............ . 16Overhand stope mine .. * * ........................................... 16
Disseminated gold deposit ... . 18Open pit mine ............................................... . 18
Conclusions ...... .................................................. 19References............................. ............................................................... 20Appendix-Detailed cost information ................................ 21
ILLUSTRAT IONS1. Location of the Porcupine mining area ...................... 10
Diagram illustrating the effects of recoverable metal value onrate of return:
2. Cut and fill mine, massive sulfide deposit. 133. Longhole stope mine, massive sulfide deposit. 144. Open pit mine, massive sulfide deposit .165. Overhand stope mine, vein gold deposit .176. Open pit mine, vein gold deposit .19
TABLES1. Metal prices used in financial evaluations . .11
Percent DCFROI produced by:2. Cut and fill mining - massive sulfide deposit . . 123. Longhole stope mining - massive sulfide deposit. . 144. Open pit mining - massive sulfide deposit . . 155. Overhand stope mining - vein gold dep os .. 176. Open pit mining - disseminated gold deposit. 18
A-1. Massive sulfide deposit smelter and transportation costs 21Underground cut and fill capital and operating costs:
A-2. 1,000 mt/day massive sulfide mine . . 21A-3. 2 ,000 mt/day massive sulfide mine ........................**. 21A-4. 4 ,000 mt/day massive sulfide mine .......................... 22A-5. 6 ,000 mt/day massive sulfide mine .. 22A-6. 8 ,000 mt/day massive sulfide mine .. .. 22
Underground longhole stope capital and operating costs:A-7. 1,000 mt/day massive sulfide m ine . . . . 2 3A-8. 2 ,000 mt/day massive sulfide mine . ... 23A-9. 4,000 mt/day massive sulfide m in e 23
A-10. 6 ,000 mt/day massive sulfide minei 24A-li. 8 ,000 mt/day massive sulfide mini n 24
5
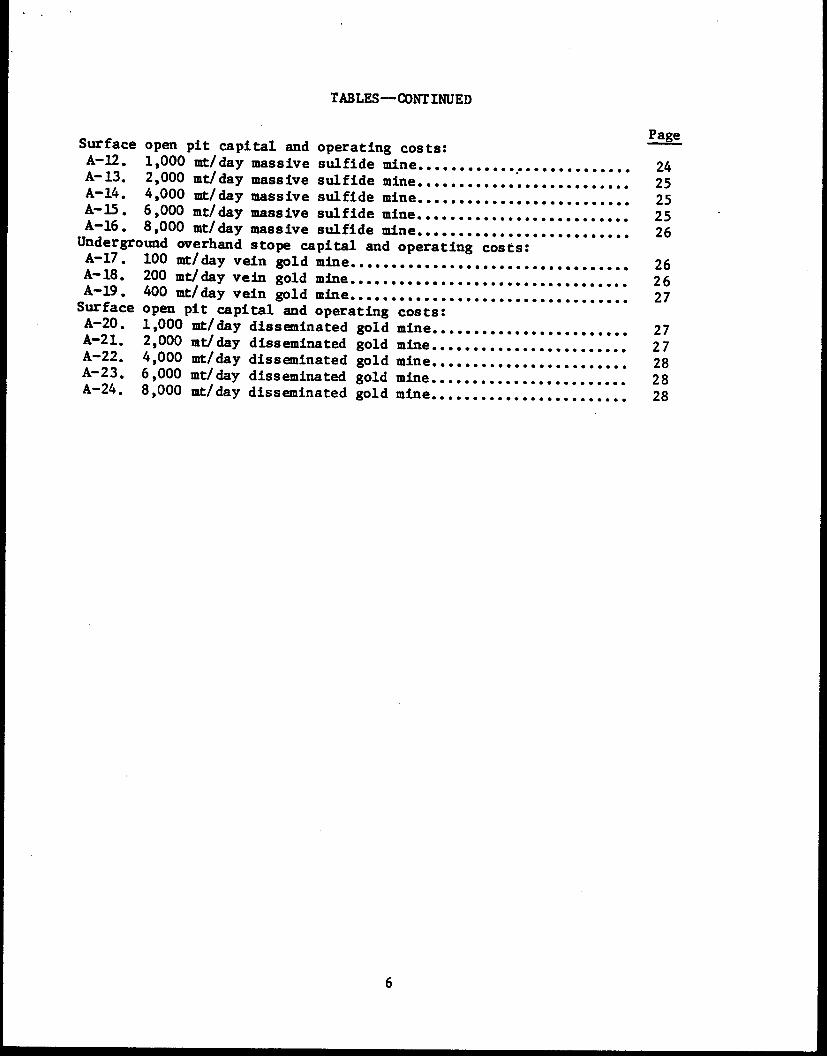
TABLES-CONTINUED
PageSurface open pit capital and operating costs:A-12. 1,000 mt/day massive sulfide mine ....... 24A-13. 2 ,000 mt/day massive sulfide mine ....... 25A-14. 4 ,000 mt/day massive sulfide mine ............ .............. 25A-15. 6 ,000 mt/day massive sulfide mine ................ ........... 25A-16. 8 ,000 mt/day massive sulfide mine .............. ....... 26
Underground overhand stope capital and operating costs:A-17. 100 mt/day vein gold mine. .............. O-*... .O..*.* ...... 26A-18. 200 mt/day vein gold mine .. ......................... . 26A-19. 400 mt/day vein gold minei ne.. ......................... 27
Surface open pit capital and operating costs:A-20. 1,000 mt/day disseminated gold mine ...... ........ 27A-21. 2 ,000 mt/day disseminated gold mine ........................ 27A-22. 4 ,000 mt/day disseminated gold mine ........................ 28A-23. 6,000 mt/day disseminated gold mine .............. .0 ... 28A-24. 8,000 mt/day disseminated gold mine........ ... o. 28
6
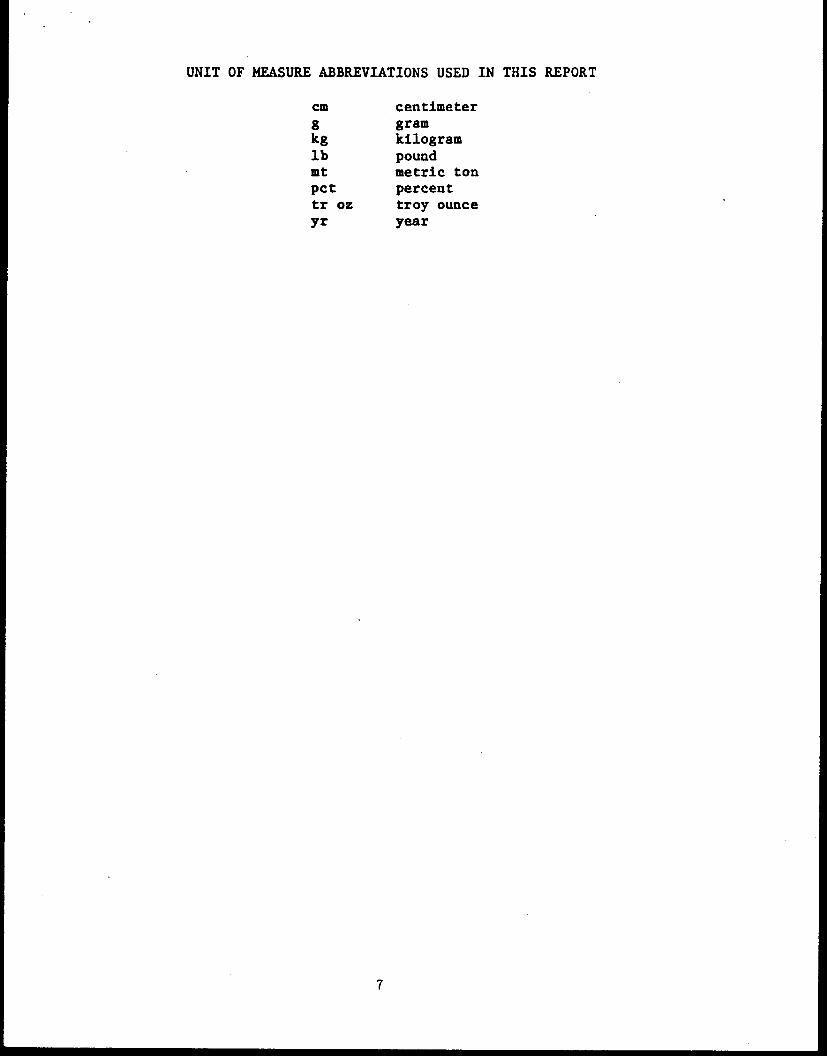
UNIT OF MEASURE ABBREVIATIONS USED IN THIS REPORT
cm centimeterg gramkg kilogramlb poundMt metric tonpct percenttr oz troy ounceyr year
7
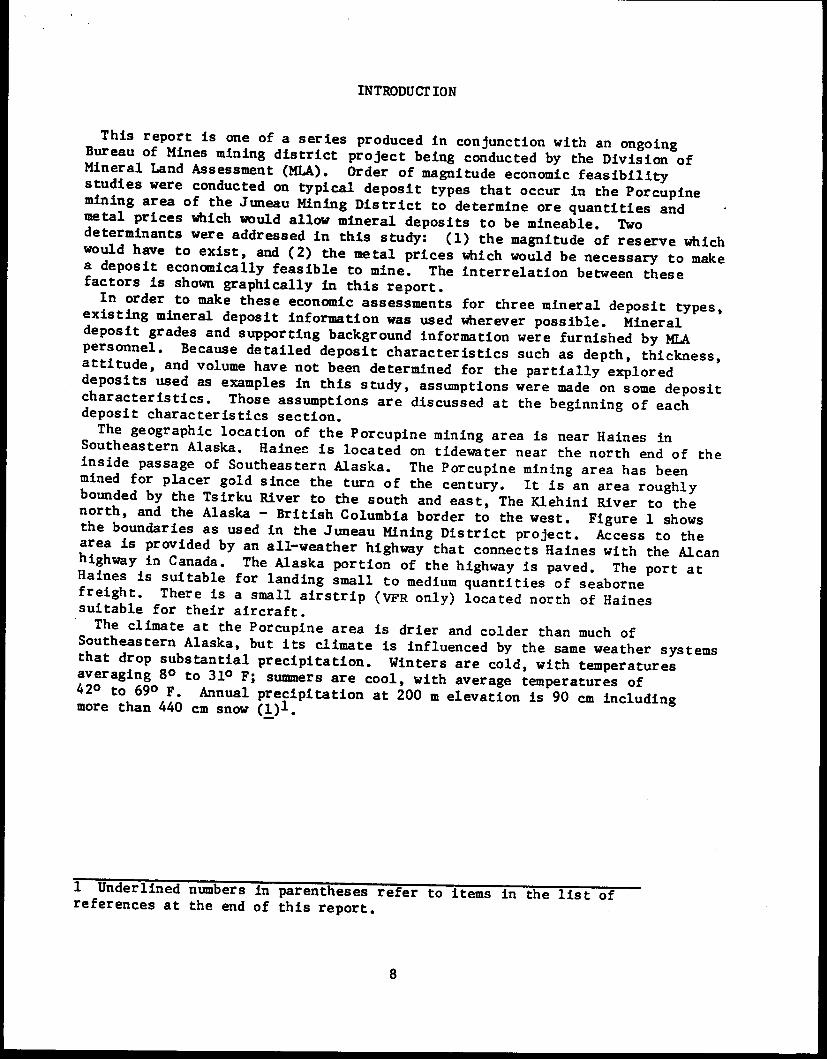
INTRODUCT ION
This report is one of a series produced in conjunction with an ongoingBureau of Mines mining district project being conducted by the Division ofMineral Land Assessment (MLA). Order of magnitude economic feasibilitystudies were conducted on typical deposit types that occur in the Porcupinemining area of the Juneau Mining District to determine ore quantities andmetal prices which would allow mineral deposits to be mineable. Twodeterminants were addressed in this study: (1) the magnitude of reserve whichwould have to exist, and (2) the metal prices which would be necessary to makea deposit economically feasible to mine. The interrelation between thesefactors is shown graphically in this report.In order to make these economic assessments for three mineral deposit types,existing mineral deposit information was used wherever possible. Mineraldeposit grades and supporting background information were furnished by MLApersonnel. Because detailed deposit characteristics such as depth, thickness,attitude, and volume have not been determined for the partially exploreddeposits used as examples in this study, assumptions were made on some depositcharacteristics. Those assumptions are discussed at the beginning of eachdeposit characteristics section.The geographic location of the Porcupine mining area is near Haines inSoutheastern Alaska. Hainee is located on tidewater near the north end of theinside passage of Southeastern Alaska. The Porcupine mining area has beenmined for placer gold since the turn of the century. It is an area roughlybounded by the Tsirku River to the south and east, The Klehini River to thenorth, and the Alaska - British Columbia border to the west. Figure 1 showsthe boundaries as used in the Juneau Mining District project. Access to thearea is provided by an all-weather highway that connects Haines with the Alcanhighway in Canada. The Alaska portion of the highway is paved. The port atHaines is suitable for landing small to medium quantities of seaborne
freight. There is a small airstrip (VFR only) located north of Hainessuitable for their aircraft.The climate at the Porcupine area is drier and colder than much ofSoutheastern Alaska, but its climate is influenced by the same weather systemsthat drop substantial precipitation. Winters are cold, with temperatures
averaging 80 to 310 F; summers are cool, with average temperatures of420 to 690 F. Annual precipitation at 200 m elevation is 90 cm includingmore than 440 cm snow (1)1.
8
1 Underlined numbers in parentheses refer to items in the list ofreferences at the end of this report.
ECONOMIC MINE FEASIBILITY STUDIES
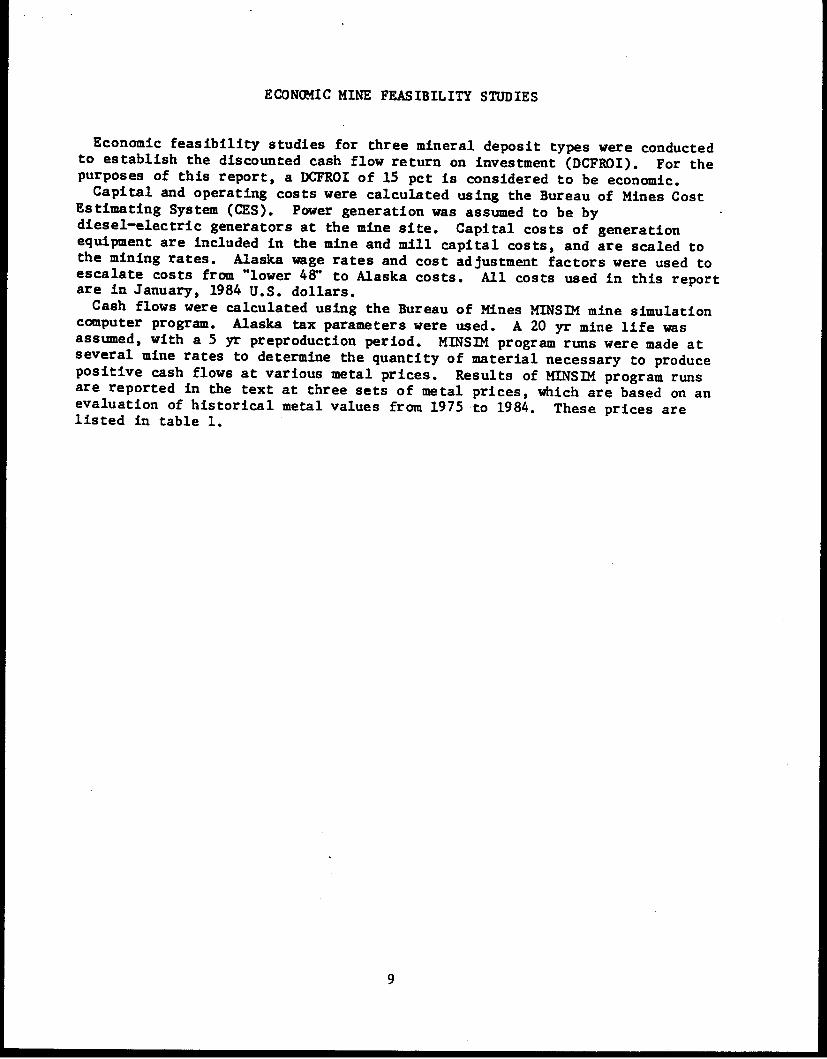
Economic feasibility studies for three mineral deposit types were conductedto establish the discounted cash flow return on investment (DCFROI). For thepurposes of this report, a DCFROI of 15 pct is considered to be economic.Capital and operating costs were calculated using the Bureau of Mines Cost
Estimating System (CES). Power generation was assumed to be bydiesel-electric generators at the mine site. Capital costs of generationequipment are included in the mine and mill capital costs, and are scaled tothe mining rates. Alaska wage rates and cost adjustment factors were used toescalate costs from 'lower 48" to Alaska costs. All costs used in this reportare in January, 1984 U.S. dollars.Cash flows were calculated using the Bureau of Mines MINSIM mine simulation
computer program. Alaska tax parameters were used. A 20 yr mine life wasassumed, with a 5 yr preproduction period. MINSIM program runs were made atseveral mine rates to determine the quantity of material necessary to producepositive cash flows at various metal prices. Results of MINSIM program runsare reported in the text at three sets of metal prices, which are based on anevaluation of historical metal values from 1975 to 1984. These prices arelisted in table 1.
9

0
Figure 1. - Location of the Porcupine mining area.
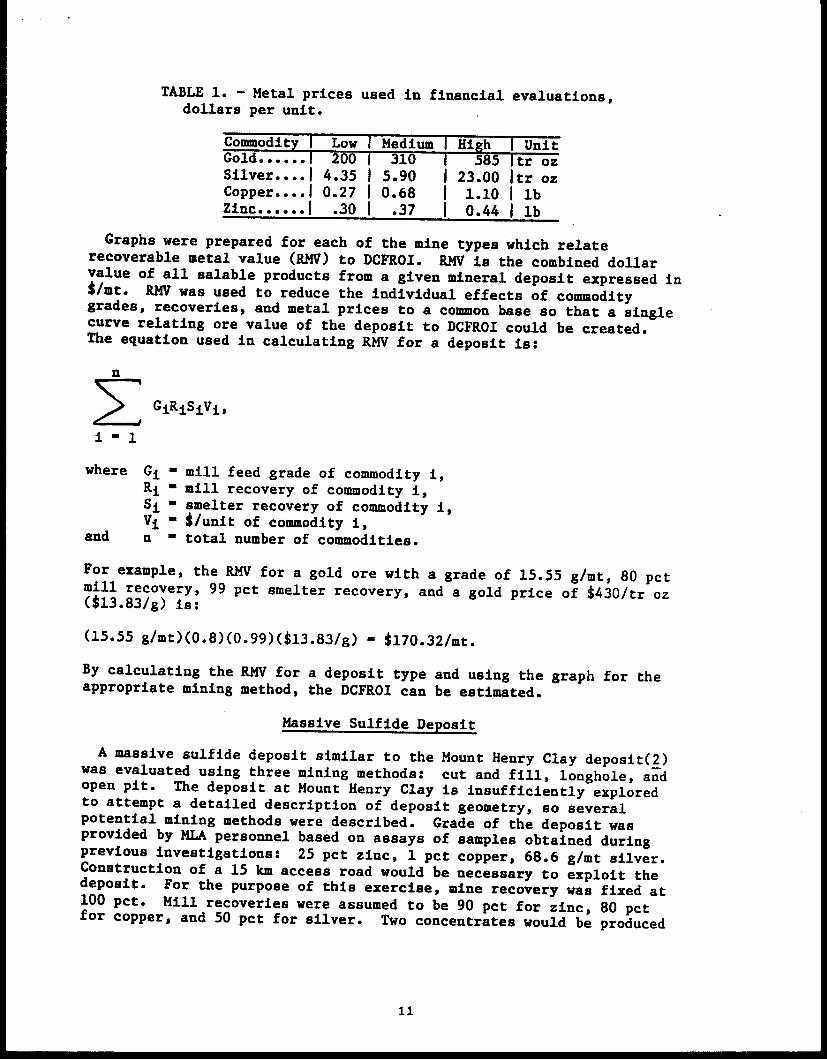
TABLE 1. - Metal prices used in financial evaluations,dollars per unit.
Commodity I Low I Medium I High I UnitGold......I 200 1 310 1 585 Itr ozSilver....I 4.35 1 5.90 1 23.00 Itr ozCopper....I 0.27 1 0.68 1 1.10 I lbZinc......I .30 I .37 I 0.44 1 lb
Graphs were prepared for each of the mine types which relaterecoverable metal value (RMV) to DCFROI. RMV is the combined dollarvalue of all salable products from a given mineral deposit expressed int/mt. RMV was used to reduce the individual effects of commoditygrades, recoveries, and metal prices to a common base so that a singlecurve relating ore value of the deposit to DCFROI could be created.The equation used in calculating RMV for a deposit is:
n
Z , GiRiSiVi,
i 1
where Gi - mill feed grade of commodity i,Ri - mill recovery of commodity i,Si - smelter recovery of commodity i,Vi - $/unit of commodity i,
and a - total number of commodities.
For example, the RMV for a gold ore with a grade of 15.55 g/mt, 80 pctmill recovery, 99 pet smelter recovery, and a gold price of A430/tr oz($13.83/g) is:
(15.55 g/mt)(0.8)(0.99)($13.83/g) - $170.32/mt.
By calculating the RMV for a deposit type and using the graph for theappropriate mining method, the DCFROI can be estimated.
Massive Sulfide Deposit
A massive sulfide deposit similar to the Mount Henry Clay deposit(2)was evaluated using three mining methods: cut and fill, longhole, andopen pit. The deposit at Mount Henry Clay is insufficiently exploredto attempt a detailed description of deposit geometry, so severalpotential mining methods were described. Grade of the deposit wasprovided by MLA personnel based on assays of samples obtained duringprevious investigations: 25 pet zinc, 1 pct copper, 68.6 g/mt silver.Construction of a 15 km access road would be necessary to exploit thedeposit. For the purpose of this exercise, mine recovery was fixed at100 pet. Mill recoveries were assumed to be 90 pet for zinc, 80 petfor copper, and 50 pet for silver. Two concentrates would be produced
11
by conventional froth flotation methods; a zinc concentrate containing52 pct zinc and 79.2 g/mt silver, and a copper concentrate containing22 pct copper. Transportation of concentrates was assumed to be bytruck and barge to smelters in British Columbia, Canada.
Cut and Fill Mine
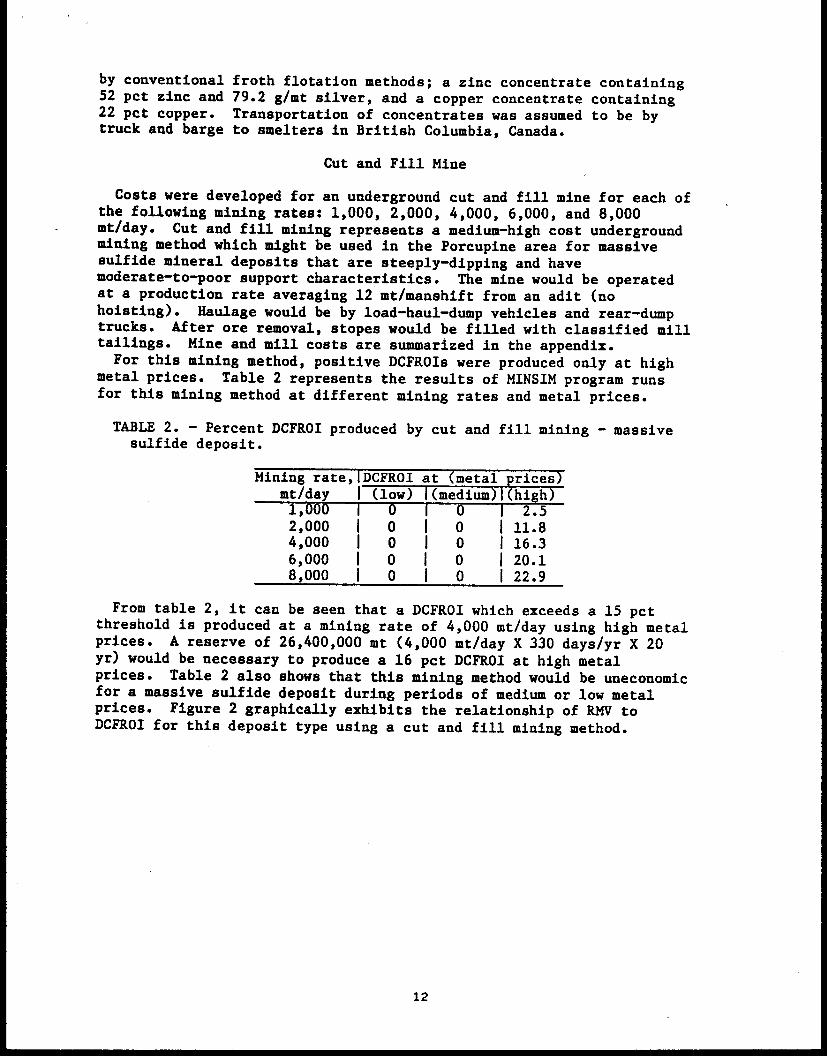
Costs were developed for an underground cut and fill mine for each ofthe following mining rates: 1,000, 2,000, 4,000, 6,000, and 8,000mt/day. Cut and fill mining represents a medium-high cost undergroundmining method which might be used in the Porcupine area for massivesulfide mineral deposits that are steeply-dipping and havemoderate-to-poor support characteristics. The mine would be operatedat a production rate averaging 12 mt/manshift from an adit (nohoisting). Haulage would be by load-haul-dump vehicles and rear-dumptrucks. After ore removal, stopes would be filled with classified milltailings. Mine and mill costs are summarized in the appendix.For this mining method, positive DCFROIs were produced only at high
metal prices. Table 2 represents the results of MINSIM program runsfor this mining method at different mining rates and metal prices.
TABLE 2. - Percent DCFROI produced by cut and fill mining - massivesulfide deposit.
Mining rate, IDCFROI at (metal prices)mt/day I (low) I(medium)j(high)1,000 I 0 1 0 1 2.52,000 1 0 1 0 1 11.84,000 1 0 I 0 1 16.36,000 1 0 I 0 1 20.18,000 1 0 1 0 1 22.9
From table 2, it can be seen that a DCFROI which exceeds a 15 pctthreshold is produced at a mining rate of 4,000 mt/day using high metalprices. A reserve of 26,400,000 it (4,000 mt/day X 330 days/yr X 20yr) would be necessary to produce a 16 pct DCFROI at high metalprices. Table 2 also shows that this mining method would be uneconomicfor a massive sulfide deposit during periods of medium or low metalprices. Figure 2 graphically exhibits the relationship of RMV toDCFROI for this deposit type using a cut and fill mining method.
12

U
6e
w
J
-I
-I
w
o-JW
0U.'Uor.
0 2 4 6 S 10 12 14 16 18 20 22 24 26 28 30
RATE OF RETURN, pct.FIGURE 2. - Diagram illustrating the effects of recoverable metalvalue on rate of return, cut and fill mine, massive sulfide deposit.
Longhole Stope Mine
Costs were developed for an underground mine using longhole stopingmethods for each of the following mining rates: 1,000, 2,000, 4,000,6,000, and 8,000 mt/day. Longhole stoping is a medium-cost miningmethod which represents the least expensive underground mining methodpossible for a deposit in the Porcupine area with steeply-dipping orezones, variable thickness, relatively competent supportcharacteristics, and fairly uniform ore grade. Mine layout and haulagewould be similar to the previous cut and fill example. Mine and millcosts are summarized in the appendix.For this mining method, positive DCFROIs were produced at medium and
high metal prices. Table 3 represents the results of MINSIM programruns for this mining method at different mining rates and metal prices.
13
- - -
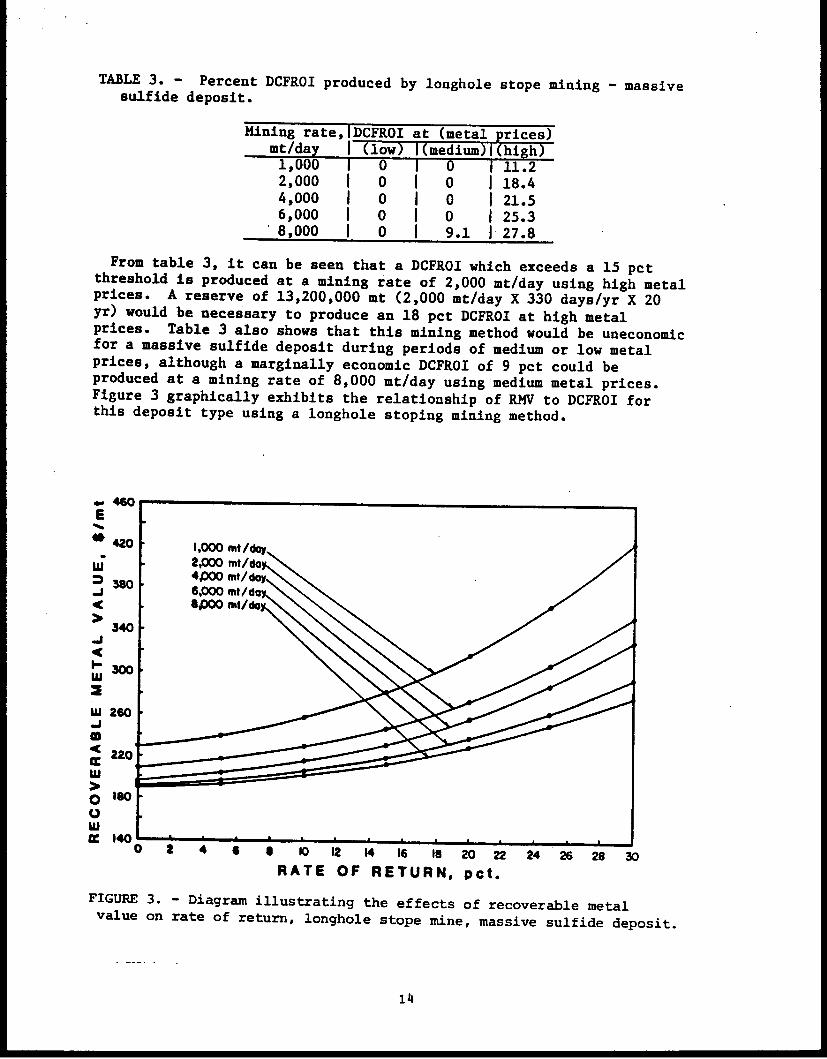
TABLE 3. - Percent DCFROI produced by longhole stope mining - massivesulfide deposit.
Mining rate,IDCFROI at (metal prices)mt/day I (low) l(medium)l(high)1,000 I 0 1 0 1T11.22,000 1 0 I 0 1 18.44,000 1 0 I 0 1 21.56,000 1 0 I 0 1 25.38,000 1 0 1 9.1 1 27.8
From table 3, it can be seen that a DCFROI which exceeds a 15 pctthreshold is produced at a mining rate of 2,000 mt/day using high metalprices. A reserve of 13,200,000 mt (2,000 mt/day X 330 days/yr X 20yr) would be necessary to produce an 18 pct DCFROI at high metalprices. Table 3 also shows that this mining method would be uneconomicfor a massive sulfide deposit during periods of medium or low metalprices, although a marginally economic DCFROI of 9 pct could beproduced at a mining rate of 8,000 mt/day using medium metal prices.Figure 3 graphically exhibits the relationship of RMV to DCFROI forthis deposit type using a longhole stoping mining method.
E
Us4642C
a38C
4'3C
: 26030
22C01 60gof
E 140- - -- - S* W& &O Oki
RATE OF RETURN, pct.
FIGURE 3. - Diagram illustrating the effects of recoverable metalvalue on rate of return, longhole stope mine, massive sulfide deposit.
1 4
Open Pit Mine
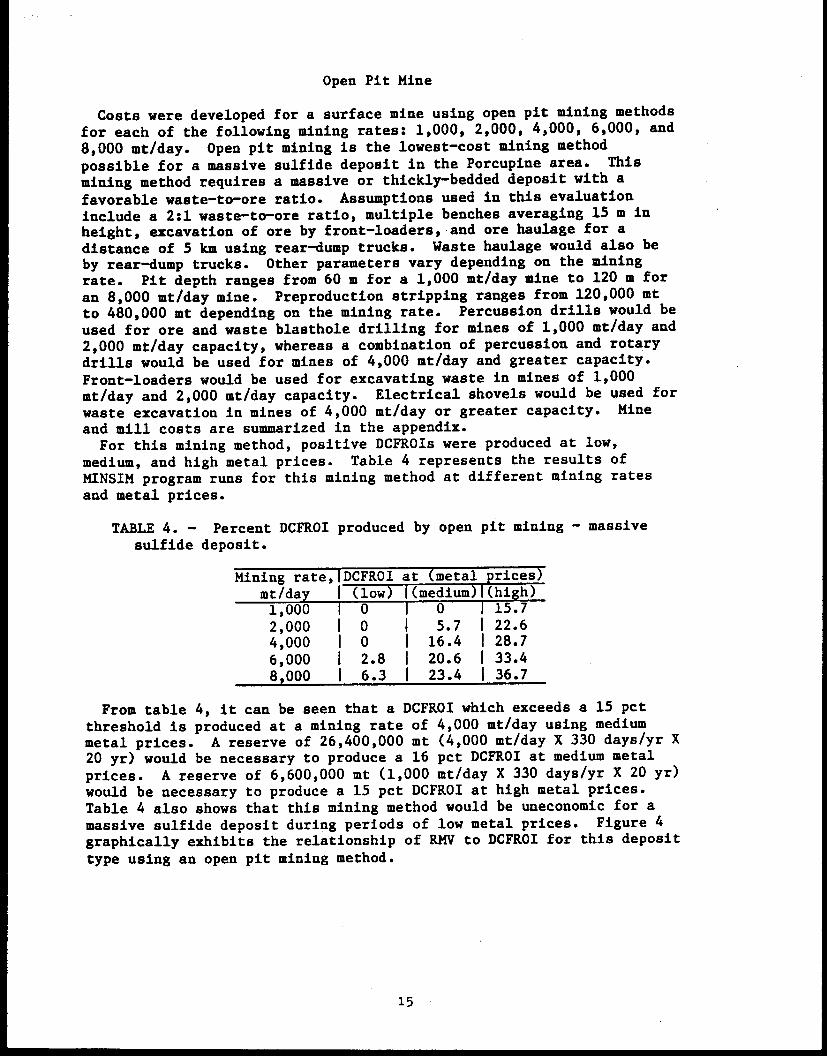
Costs were developed for a surface mine using open pit mining methodsfor each of the following mining rates: 1,000, 2,000, 4,000, 6,000, and8,000 mt/day. Open pit mining is the lowest-cost mining methodpossible for a massive sulfide deposit in the Porcupine area. Thismining method requires a massive or thickly-bedded deposit with afavorable waste-to-ore ratio. Assumptions used in this evaluationinclude a 2:1 waste-to-ore ratio, multiple benches averaging 15 m inheight, excavation of ore by front-loaders, and ore haulage for adistance of 5 km using rear-dump trucks. Waste haulage would also beby rear-dump trucks. Other parameters vary depending on the miningrate. Pit depth ranges from 60 m for a 1,000 mt/day mine to 120 m foran 8,000 mt/day mine. Preproduction stripping ranges from 120,000 mtto 480,000 mt depending on the mining rate. Percussion drills would beused for ore and waste blasthole drilling for mines of 1,000 mt/day and2,000 mt/day capacity, whereas a combination of percussion and rotarydrills would be used for mines of 4,000 mt/day and greater capacity.Front-loaders would be used for excavating waste in mines of 1,000mt/day and 2,000 mt/day capacity. Electrical shovels would be used forwaste excavation in mines of 4,000 mt/day or greater capacity. Mineand mill costs are summarized in the appendix.
For this mining method, positive DCFROIs were produced at low,medium, and high metal prices. Table 4 represents the results ofMINSIM program runs for this mining method at different mining ratesand metal prices.
TABLE 4. - Percent DCFROI produced by open pit mining - massivesulfide deposit.
Mining rate,IDCFROI at (metal prices)mt/day |(low) I(medium)1(high)1,000 1 0 1 0 15.72,000 I 0 I 5.7 I 22.64,000 I 0 I 16.4 I 28.76,000 I 2.8 I 20.6 I 33.48,000 I 6.3 I 23.4 I 36.7
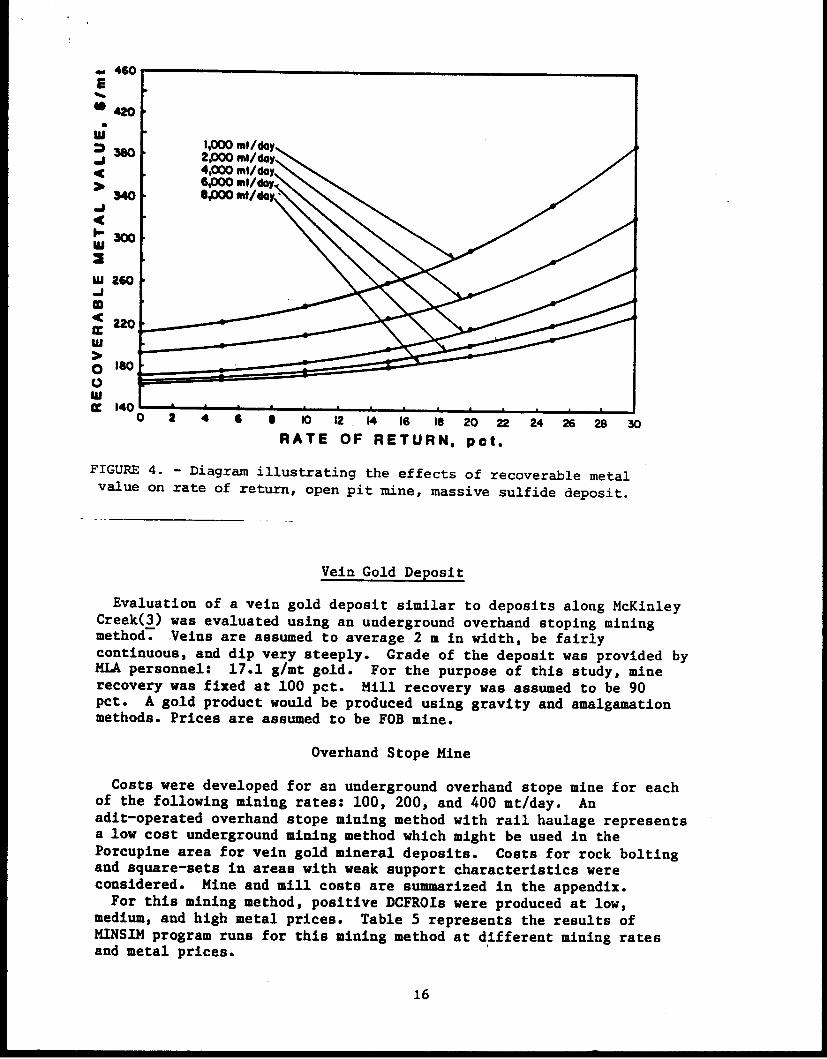
From table 4, it can be seen that a DCFROI which exceeds a 15 pctthreshold is produced at a mining rate of 4,000 mt/day using mediummetal prices. A reserve of 26,400,000 mt (4,000 mt/day X 330 days/yr X20 yr) would be necessary to produce a 16 pct DCFROI at medium metalprices. A reserve of 6,600,000 mt (1,000 mt/day X 330 days/yr X 20 yr)would be necessary to produce a 15 pct DCFROI at high metal prices.Table 4 also shows that this mining method would be uneconomic for amassive sulfide deposit during periods of low metal prices. Figure 4graphically exhibits the relationship of RMV to DCFROI for this deposittype using an open pit mining method.
15
E
*
ft.
us
1;
w-a
4I
1--W
-a0
0UCw
u a 4 6 0 10 12 14 16 le 20 22 24 26 28 30RATE OF RETURN, pct.
FIGURE 4. - Diagram illustrating the effects of recoverable metalvalue on rate of return, open pit mine, massive sulfide deposit.
Vein Gold Deposit
Evaluation of a vein gold deposit similar to deposits along McKinleyCreek(3) was evaluated using an underground overhand stoping miningmethod. Veins are assumed to average 2 m in width, be fairlycontinuous, and dip very steeply. Grade of the deposit was provided byMLA personnel: 17.1 g/mt gold. For the purpose of this study, minerecovery was fixed at 100 pct. Mill recovery was assumed to be 90pct. A gold product would be produced using gravity and amalgamationmethods. Prices are assumed to be FOB mine.
Overhand Stope Mine
Costs were developed for an underground overhand stope mine for eachof the following mining rates: 100, 200, and 400 mt/day. Anadit-operated overhand stope mining method with rail haulage representsa low cost underground mining method which might be used in thePorcupine area for vein gold mineral deposits. Costs for rock boltingand square-sets in areas with weak support characteristics wereconsidered. Mine and mill costs are summarized in the appendix.For this mining method, positive DCFROIs were produced at low,
medium, and high metal prices. Table 5 represents the results ofMINSIM program runs for this mining method at different mining ratesand metal prices.
16
= - -
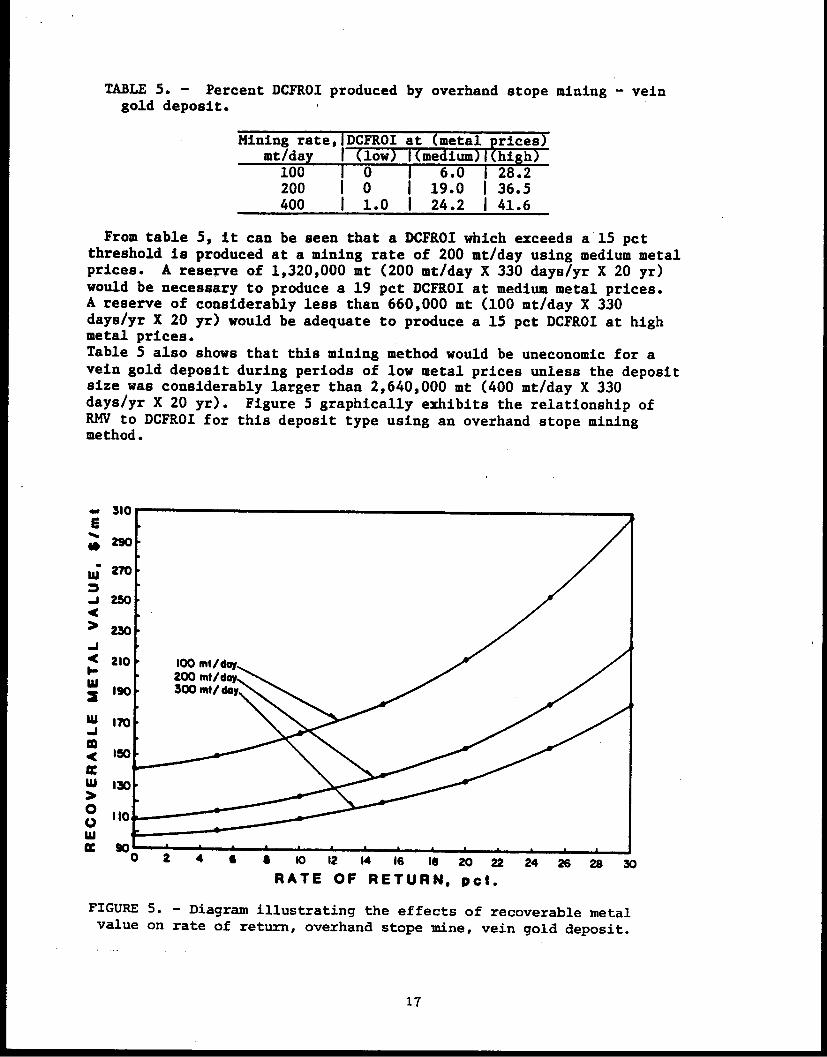
TABLE 5. - Percent DCFROI produced by overhand stope mining - veingold deposit.
Mining rate,IDCFROI at (metal prices)mt/day I (low) I(medium)l(high)
100 I 0 1 6.0 1 28.2200 1 0 1 19.0 1 36.5400 1 1.0 1 24.2 1 41.6
From table 5, it can be seen that a DCFROI which exceeds a 15 pctthreshold is produced at a mining rate of 200 mt/day using medium metalprices. A reserve of 1,320,000 mt (200 mt/day X 330 days/yr X 20 yr)would be necessary to produce a 19 pct DCFROI at medium metal prices.A reserve of considerably less than 660,000 mt (100 mt/day X 330days/yr X 20 yr) would be adequate to produce a 15 pct DCFROI at highmetal prices.Table 5 also shows that this mining method would be uneconomic for avein gold deposit during periods of low metal prices unless the depositsize was considerably larger than 2,640,000 mt (400 mt/day X 330days/yr X 20 yr). Figure 5 graphically exhibits the relationship ofRMV to DCFROI for this deposit type using an overhand stope miningmethod.
E
w
-J-I
IC
I-
w
w
0:LU
wgo
-Cu
-- - c -v We .J
RATE OF RETURN, pct.
FIGURE 5. - Diagram illustrating the effects of recoverable metalvalue on rate of return, overhand stope mine, vein gold deposit.
17
I
Disseminated Gold Deposit
Evaluation of a disseminated or stockwork gold deposit similar todeposits in the Porcupine area was undertaken using a surface open pitmining method. Grade of the deposit was provided by MLA personnel:1.71 g/mt gold. For the purpose of this study, mine recoveries werefixed at 100 pct. Mill recovery was assumed to be 90 pct. A goldproduct would be produced by gravity and amalgamation methods. Pricesare assumed to be FOB mine.
Open Pit Mine
Costs were developed for a surface mine using open pit mining methodsfor each of the following mining rates: 1,000, 2,000, 4,000, 6,000, and8,000 mt/day. Open pit mining is the lowest-cost mining methodpossible for a gold deposit of this type in the Porcupine area. Nowaste rock would be mined. A 5 km access road would be required. Oreremoval would be by percussion blasthole drilling, excavation ofblasted ore by front-loaders, and haulage by rear-dump trucks for adistance of 1 km to the mill. Pit depth would depend on the miningrate scenario, and vary from 30 m at a 1,000 mt/day mining rate to 60 mat an 8,000 mt/day mining rate. Mine and mill costs are summarized inthe appendix.
For this mining method, positive DCFROIs were produced at medium andhigh metal prices. Table 6 represents the results of MINSIM programruns for this mining method at different mining rates and metal prices.
TABLE 6. - Percent DCFROI produced by open pit mining - disseminatedgold deposit.
Mining rate, IDCFROI at (metal prices)mt/day | (low) I(medium)I(high)1,000 I 0 I 0 1 24.92,000 1 0 1 0 1 47.44,000 1 0 I 0 1 61.06,000 1 0 1 23.0 1 67.18,000 1 0 1 33.1 1 71.2
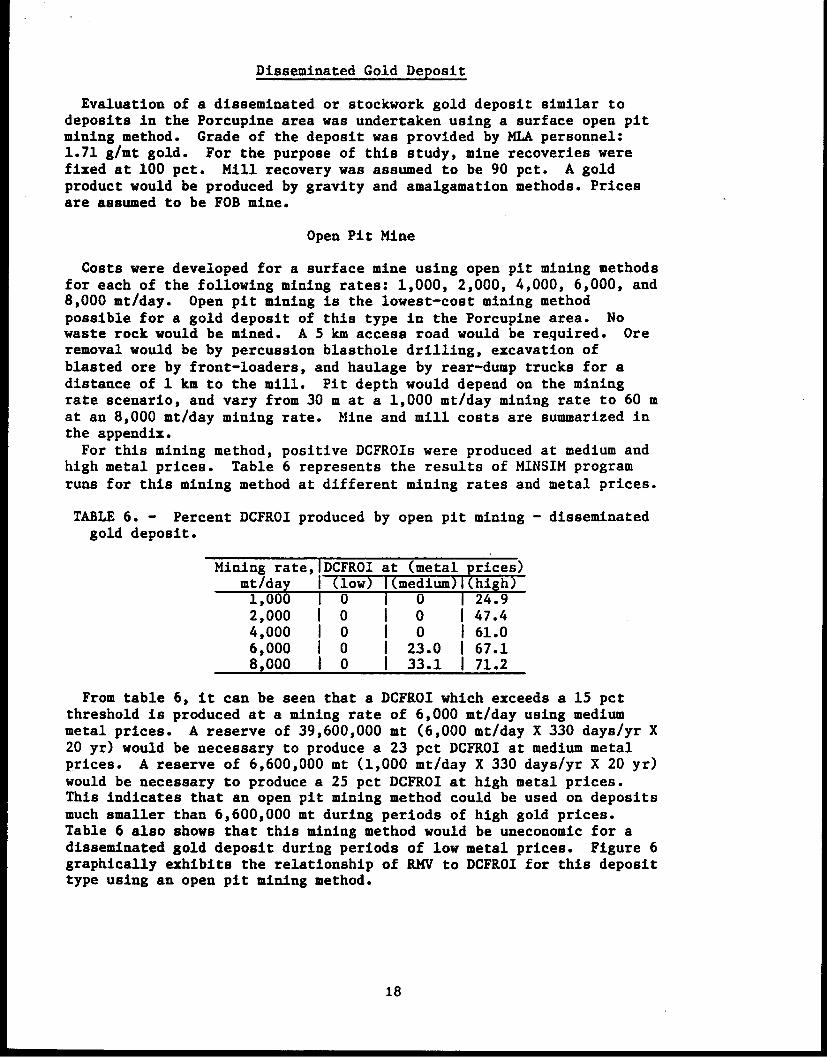
From table 6, it can be seen that a DCFROI which exceeds a 15 pctthreshold is produced at a mining rate of 6,000 mt/day using mediummetal prices. A reserve of 39,600,000 mt (6,000 mt/day X 330 days/yr X20 yr) would be necessary to produce a 23 pct DCFROI at medium metalprices. A reserve of 6,600,000 mt (1,000 mt/day X 330 days/yr X 20 yr)would be necessary to produce a 25 pct DCFROI at high metal prices.This indicates that an open pit mining method could be used on depositsmuch smaller than 6,600,000 mt during periods of high gold prices.Table 6 also shows that this mining method would be uneconomic for adisseminated gold deposit during periods of low metal prices. Figure 6graphically exhibits the relationship of RMV to DCFROI for this deposittype using an open pit mining method.
18
E
J
.J
UI
w
11-
U
a0UJw
0 2 4 6 S 10 12 4 16 1s 20 22 24 26 28 30
RATE OF RETURN. pct.
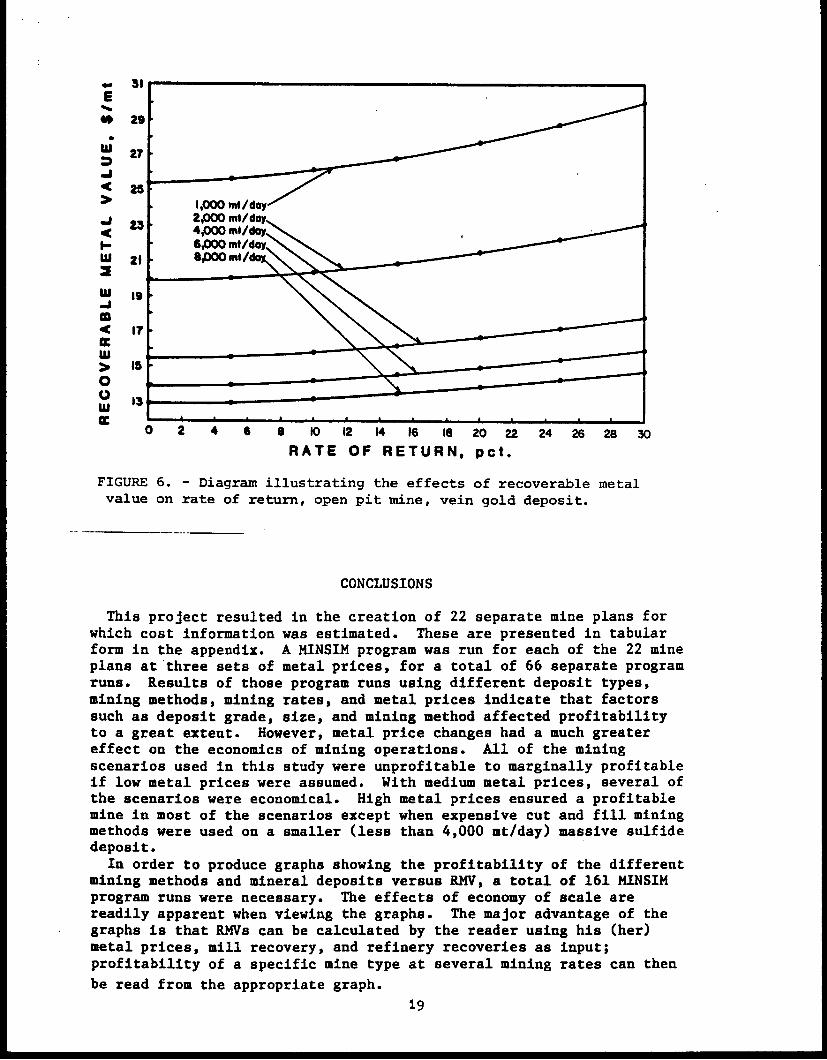
FIGURE 6. - Diagram illustrating the effects of recoverable metalvalue on rate of return, open pit mine, vein gold deposit.
CONCLUSIONS
This project resulted in the creation of 22 separate mine plans forwhich cost information was estimated. These are presented in tabularform in the appendix. A MINSIM program was run for each of the 22 mineplans at three sets of metal prices, for a total of 66 separate programruns. Results of those program runs using different deposit types,mining methods, mining rates, and metal prices indicate that factorssuch as deposit grade, size, and mining method affected profitabilityto a great extent. However, metal price changes had a much greatereffect on the economics of mining operations. All of the miningscenarios used in this study were unprofitable to marginally profitableif low metal prices were assumed. With medium metal prices, several ofthe scenarios were economical. High metal prices ensured a profitablemine in most of the scenarios except when expensive cut and fill miningmethods were used on a smaller (less than 4,000 mt/day) massive sulfidedeposit.
In order to produce graphs showing the profitability of the differentmining methods and mineral deposits versus RMV, a total of 161 MINSIMprogram runs were necessary. The effects of economy of scale arereadily apparent when viewing the graphs. The major advantage of thegraphs is that RMVs can be calculated by the reader using his (her)metal prices, mill recovery, and refinery recoveries as input;profitability of a specific mine type at several mining rates can thenbe read from the appropriate graph.
19
- ^
REFERENCES
1. Selkregg, L. L., ed. Alaska Regional Profiles, Southeast Region.Univ. AK Arctic Env. Information and Data Center, 1977, 233 pp.
2. Still, J. C. Stratiform Massive Sulfide Deposits of the Mt. HenryClay Area, Southeast Alaska. BuMines OFR 118-84, 1984, 65 pp.
3. Still, J. C. Stream Sediment, Float, and Bedrock Sampling in thePorcupine Mining Area, Southeast Alaska. BuMines OFR 173-84, 1984,6 pp.
20
APPENDIX--Detailed Cost Information
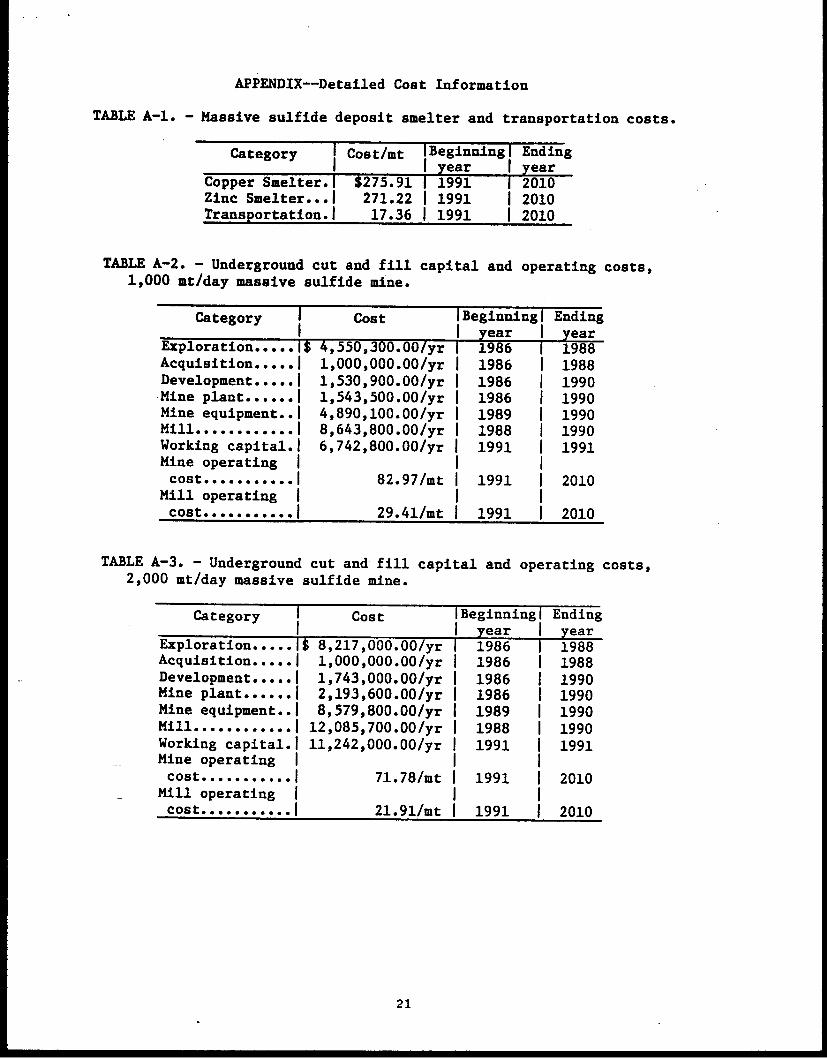
TABLE A-1. - Massive sulfide deposit smelter and transportation costs.
Category I Cost/mt IBeginningi EndingI I year I year
Copper Smelter.l $275.91 I 1991 1 2010Zinc Smelter...1 271.22 1 1991 1 2010Transportation.1 17.36 1 1991 1 2010
TABLE A-2. - Underground cut and fill capital and operating costs,1,000 mt/day massive sulfide mine.
Category I Cost IBeginningl EndingI I year I year
Exploration ..... 1$ 4 ,550,300.00/yr I 1986 1 1988Acquisition ..... | l,000,000.00/yr I 1986 I 1988Development ..... | 1,53 0,900.00/yr I 1986 I 1990Mine plant ...... | 1, 54 3,50 0.00/yr I 1986 I 1990Mine equipment..l 4 ,890,100.00/yr 1989 1990Mill*..........I 8,643 ,800.00/yr I 1988 I 1990Working capital.| 6 ,742,800.00/yr I 1991 I 1991Mine operating I l Icost* .. l82.97/mt I 1991 I 2010
Mill operating I l Icost ........... I 29.41/mt I 1991 I 2010
TABLE A-3. - Underground cut and fill capital and operating costs,2,000 mt/day massive sulfide mine.
Category I Cost IBeginninglI vear I
Exploration ..... I $ 8,217 ,000.00/yr i 1986 1988Acquisition ..... | l,000,000.00/yr I 1986 I 1988Development ..... | 1,743,000.00/yr I 1986 I 1990Mine plant ......I 2,193,600.00/yr 1986 1990Mine equipment..l 8 ,5 79,800.00/yr 1989 1990Mill ...........|. 12 ,085,700.00/yr I 1988 I 1990Working capital.| 11,242 ,000.00/yr I 1991 I 1991Mine operating I I Icost.... o ... l 71.78/mt I 1991 I 2010
Mill operating I I Icost... o.o~o ... 21.91/mt I 1991 I 2010
Endingyear
21

APPENDIX - Continued
TABLE A-4. - Underground cut and fill capital and operating costs,4,000 mt/day massive sulfide mine.
Category I Cost IBeginningi EndingI ~~~~I year I year
Exploration ..... 1$17,383,600.00/yr 1 1986 1 1988Acquisition.....I 1,666,700.00/yr I 1986 I 1988Development ..... | 3,44 9,900.00/yr | 1986 | 1990Mine plant ...... | 3,628,100.00/yr I 1986 I 1990Mine equipment..I 16,565,400.00/yr | 1989 I 1990Mill ............ I 19,400,300.00/yr I 1988 I 1990Working capital.1 19,430,400.00/yr I 1991 I 1991Mine operating I l lcost ........... 64.13/mt | 1991 I 2010
Mill operating l l Icost ........... 16.83/mt I 1991 I 2010
TABLE A-S. - Underground cut and fill capital and6,000 mt/day massive sulfide mine.
operating costs,
Category I Cost
Exploration..... ll$17,383,600.00/yrAcquisition ..... I 1,666,700.00/yrDevelopment..... | 5,127,800.00/yrMine plant......1 4,698,900.00/yrMine equipment..1 21,134,000.00/yrMill ............ I 23 ,838,900.00/yrWorking capital.1 2 7,550,800.00/yrMine operating Icost...........I 61.91/mt
Mill operating Icost......-. 14.62/mt
IBeginningiI year I
1986198619861986198919881991
1991
1991
TABLE A-6. - Underground cut and fill capital and operating costs,8,000 mt/day massive sulfide mine.
Category | Cost IBeginningi EndingI I year I year
Exploration.....1$17,383,600.00/yr 1 1986 1 1988Acquisition.....I 1,666,700.00/yr I 1986 I 1988Development.....1 6,809,400.00/yr I 1986 I 1990Mine plant......l 5,639,000.00/yr I 1986 I 1990Mine equipment..I 2 4,240,500.00/yr 1989 1990Mill ............| 2 7,78 0,000.00/yr I 1988 I 1990Working capital.1 3 5,414,400.00/yr I 1991 I 1991Mine operating I I I
costOO690060.0.l . 60.47/mt 1 1991 1 2010Hill operating | I Icost ........... l . 13.31/mt I 1991 I 2010
22
Endingyear1988198819901990199019901991
2010
2010
. I ---IIIIIIIIIII
IIIIIIIIIII
APPENDIX - Continued
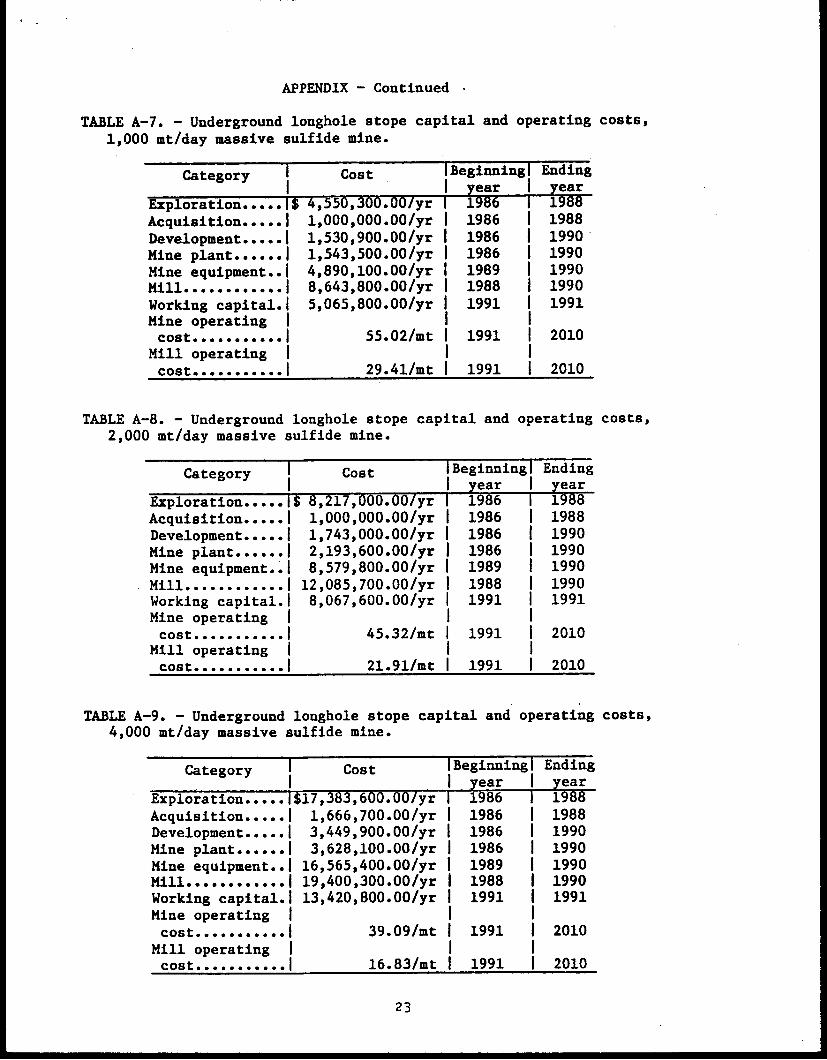
TABLE A-7. - Underground longhole stope capital and operating costs,1,000 mt/day massive sulfide mine.
Category I Cost IBeginningi EndingI I y............... .year I year
Exploration ..... SlS 4,550,300.00/yr 1 1986 1 1988Acquisition .....I 1,000,000.00/yr I 1986 I 1988Development ..... | 1,530,900.00/yr I 1986 I 1990Mine plant ...... | 1,543,500.00/yr I 1986 I 1990Mine equipment..1 4,890,100.00/yr I 1989 I 1990Mill ............I |8,643,800.00/yr I 1988 I 1990Working capital.| 5,065,800.00/yr 1 1991 I 1991Mine operating I I Icost .......... l 55.02/mt I 1991 I 2010
Mill operating I I Icost .......... l 29.41/mt I 1991 I 2010
TABLE A-8. - Underground longhole stope capital and2,000 mt/day massive sulfide mine.
operating costs,
Category
Exploration...... lSAcquisition.....IDevelopment.e...1Mine plant......lMine equipment..lMill ............Working capital.1Mine operatingcostp...........
Mill operatingcost.*.......
Cost
&- 217,000. 00/yr1,000,000.00/yr1,743,000.00/yr2,193,600.00/yr8,579,800.00/yr12,085,700.00/yr8,067,600.00/yr
45.32/mt I
21.91/mt I
IBeginningI EndingI year I year
1986198619861986198919881991
1991
1991
1988198819901990199019901991
2010
2010
TABLE A-9. - Underground longhole stope capital and4,000 mt/day massive sulfide mine.
operating costs,
Category I Cost IBeginningl EndingI I year I year
Exploration ..... 1$17,383,600.00/yr I 1986 1 1988Acquisition.....I 1,666,700.00/yr I 1986 I 1988Development ..... I 3,449,900.00/yr I 1986 I 1990Mine plant......| 3,628,100.00/yr I 1986 I 1990Mine equipment..l 16,565,400.00/yr I 1989 I 1990Mill............| 19,400,300.00/yr I 1988 I 1990Working capital.| 13,420,800.00/yr I 1991 I 1991Mine operating I I Icosto.000.0.001 l 39.09/mt I 1991 I 2010
Mill operating I I Icost- -o.-1 l 16.83/mt I 1991 I 2010
23
- - -
_ _ . _ _
I
IIIIIIIIIII
IIIIIII
APPENDIX - Continued
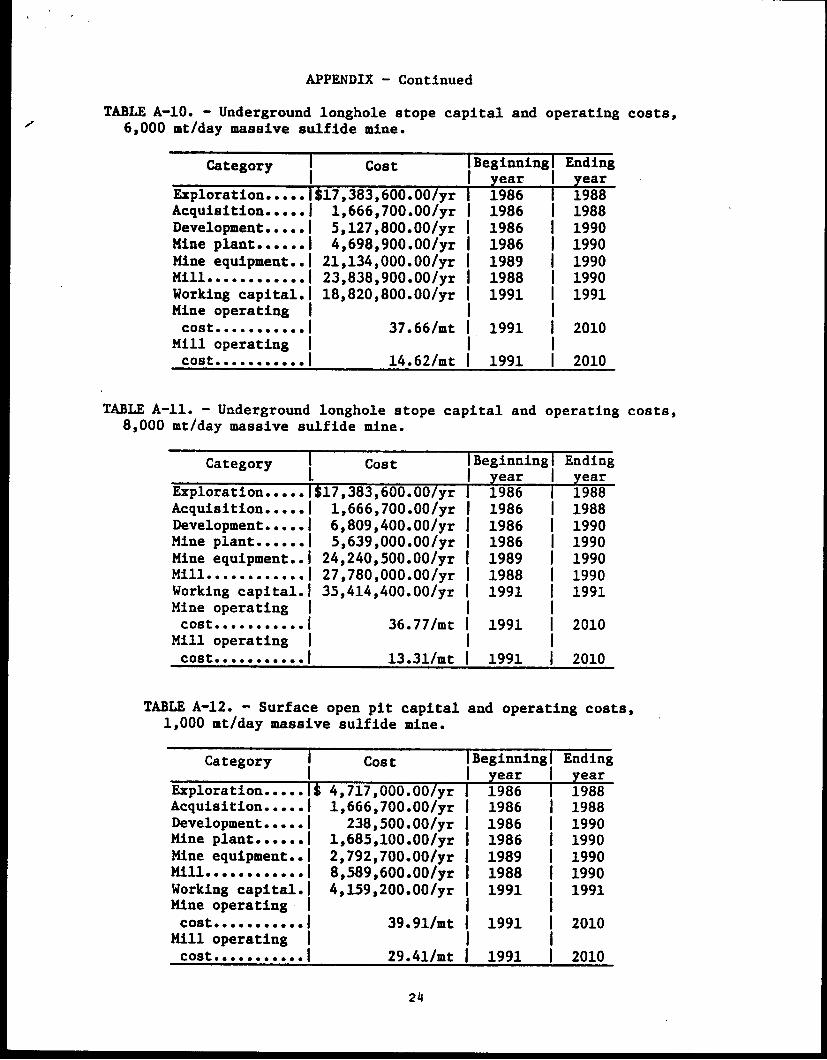
TABLE A-10. - Underground longhole stope capital and operating costs,6,000 mt/day massive sulfide mine.
Category Cost Beginningl EndingI I year I year
Exploration ..... |$17,383,600.00/yr I 1986 I 1988Acquisition ..... I 1,666,700.00/yr | 1986 I 1988Development.....i 5,127,800.00/yr I 1986 I 1990Mine plant ...... I 4,698,900.00/yr I 1986 | 1990Mine equipment..| 21,134,000.00/yr I 1989 | 1990Mill ............ 23,838,900.00/yr I 1988 I 1990Working capital.1 18,820,800.00/yr I 1991 I 1991Mine operating I I Icost.... l-0-*061 37.66/mt 1 1991 1 2010
Mill operating I I Icosto ... o..o~ool 14.62/mt 1 1991 1 2010
TABLE A-li. - Underground longhole stope capital and8,000 mt/day massive sulfide mine.
operating costs,
CategoryI
Cost
Exploration ..... l$17,383,600.00/yrAcquisition ..... | 1,666,700.00/yrDevelopment ..... | 6,809,400.00/yrMine plant......1 5,639,000.00/yrMine equipment.. I 24,240,500.00/yrMill ............ I 27,780,000.00/yrWorking capital.| 35,414,400.00/yrMine operating Icost ........... 36.77/mt
Mill operating Icost..==....*...I 13.31/mt
TABLE A-12. - Surface open pit capital1,000 mt/day massive sulfide mine.
IBeginningI year I
1986198619861986198919881991
1991
1991
and operating costs,
Category I Cost IBeginningl Ending! I year I yearExploration.....lS 4,717,000.00/yr I 1986 1 1988Acquisition.....| 1,666,700.00/yr I 1986 I 1988Development.....l 238,500.00/yr I 1986 I 1990Mine plant......l 1,685,100.00/yr I 1986 I 1990Mine equipment..l 2,792,700.00/yr | 1989 I 1990Mill............l 8 ,589,600.00/yr I 1988 I 1990Working capital.| 4,159,200.00/yr I 1991 I 1991Mine operating I I I
costOO009060l40 39.91/mt 1 1991 1 2010Mill operating I I I
costOO0.900*6*1 l 29.41/mt 1 1991 1 2010
24
Endingyear1988198819901990199019901991
2010
2010
IIIIIIIIIII
IIIIIIIIIII
APPENDIX - Continued
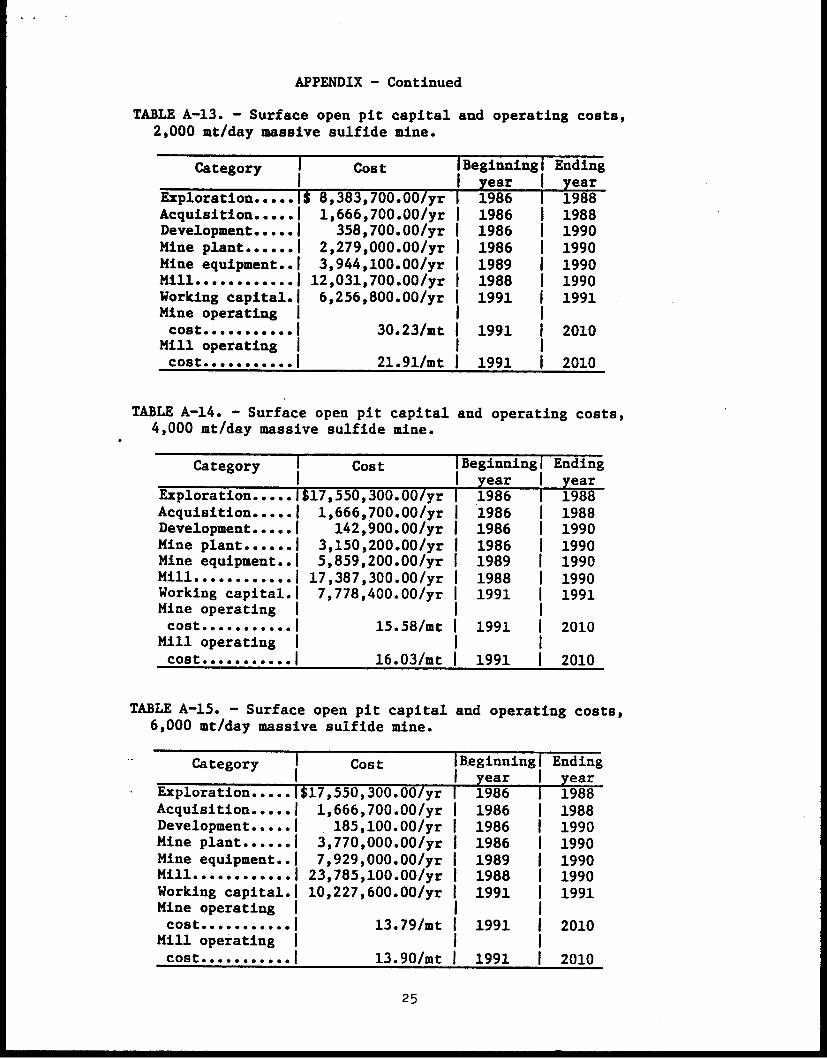
TABLE A-13. - Surface open pit capital and operating costs,2,000 mt/day massive sulfide mine.
Category Cost IBeginningi EndingI I year I year
Exploration ..... l$ 8,383,700.00/yr 1 1986 1 1988Acquisition.....l 1,666,700.00/yr I 1986 I 1988Development ..... I 358,700.00/yr I 1986 I 1990Mine plant ......I 2,279,000.00/yr I 1986 I 1990Mine equipment..l 3,944,100.00/yr I 1989 I 1990Mill............ I 12,031,700.00/yr I 1988 I 1990Working capital.| 6,256,800.00/yr I 1991 I 1991Mine operating I I I
cost*600400*l66 30.23/mt 1 1991 1 2010Mill operating I I Icost ........... I 21.91/mt 1 1991 1 2010
TABLE A-14. - Surface open pit capital4,000 mt/day massive sulfide mine.
and operating costs,
Category I Cost IBeginningl EndingIl I year I year
Exploration.....I$17,550,300.00/yr I .1986 1 1988Acquisition ..... | 1,666,700.00/yr I 1986 I 1988Development .....l 142,900.00/yr I 1986 I 1990Mine planto...... 3,150,200.00/yr 1986 1990Mine equipment..I 5,859,200.00/yr 1989 1990Mill- .e......| 17,387,300.00/yr I 1988 I 1990Working capital.| 7,778,400.00/yr 1 1991 I 1991Mine operating I I Icost.... O.... l 15.58/mt I 1991 I 2010
Mill operating I I Icost*6*06000.01 l 16.03/mt I 1991 I 2010
TABLE A-15. - Surface open pit capital6,000 mt/day massive sulfide mine.
and operating costs,
Category Cost IBeginningl EndingI I year I year
Exploration ..... 1$17,550,300.00/yr I 1986 1 1988Acquisition.....| 1,666,700.00/yr I 1986 I 1988Development ..... I 185,100.00/yr I 1986 I 1990Mine plant ...... | 3,770,000.00/yr 1986 1990Mine equipment..l 7,929,000.00/yr 1989 1990Milll............ 2 3,78 5,100.00/yr I 1988 I 1990Working capital.I 10,227,600.00/yr I 1991 I 1991Mine operating I I Icost .. 0-0.000 l 13.79/mt I 1991 I 2010
Mill operating I I Icost... 0000 ... *I 13.90/mt I 1991 I 2010
APPENDIX - Continued
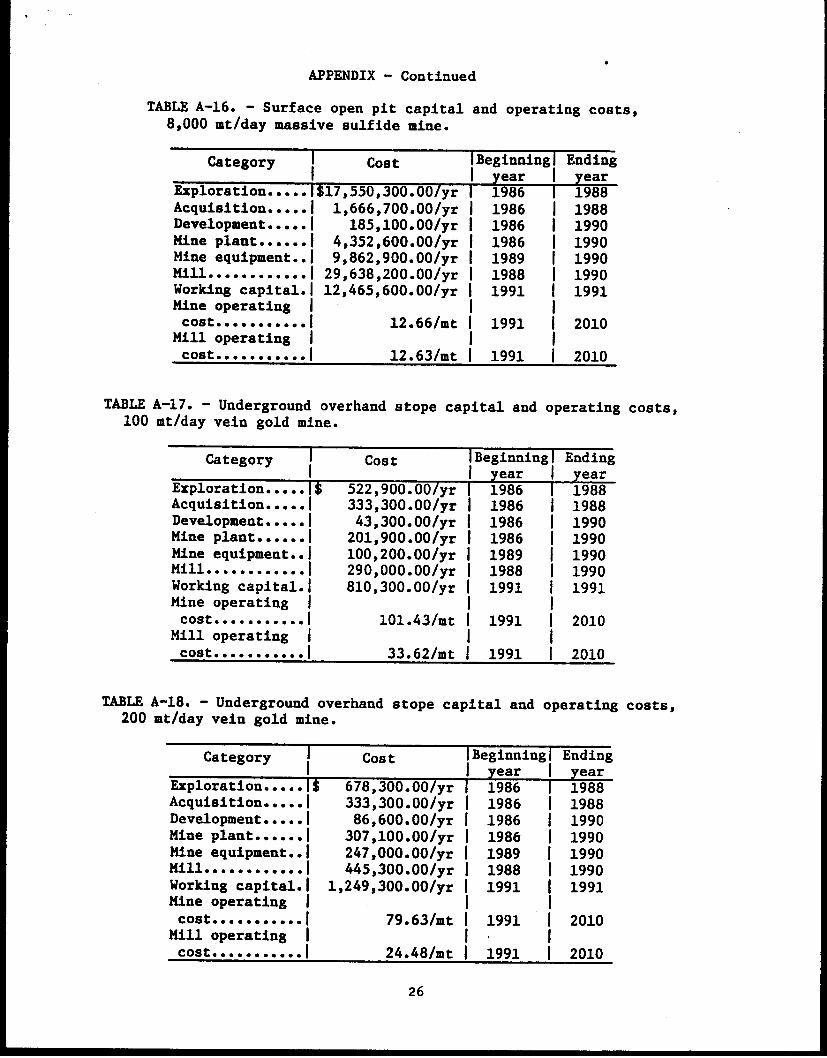
TABLE A-16. - Surface open pit capital and operating costs,8,000 mt/day massive sulfide mine.
Category I Cost IBeginningl EndingI I year I year
Exploration...... l17,550,300.00/yr I 1986 1 1988Acquisition ..... l 1,666,700.00/yr I 1986 I 1988Development.....1 185,100.00/yr I 1986 I 1990Mine plant......| 4 ,352,600.00/yr I 1986 I 1990Mine equipment..l 9 ,862,900.00/yr I 1989 I 1990Mill............ I 2 9,638,200.00/yr i 1988 | 1990Working capital.1 12,465,600.00/yr 1 1991 1 1991Mine operating I I Icost ..00....... l 12.66/mt I 1991 I 2010
Mill operating I I Icost.0 ........ . .l 12.63/mt I 1991 I 2010
TABLE A-17. - Underground overhand stope capital and operating costs,100 mt/day vein gold mine.
Category Cost IBeginninglI vear I
Exploration.....I$ 522 ,900.00/yr I i 986 I 1988Acquisition.....l 333,300.00/yr I 1986 I 1988Development ..... I 43,300.00/yr I 1986 I 1990Mine plant......I 201,900.00/yr I 1986 I 1990Mine equipment..l 100,200.00/yr I 1989 | 1990Mill ........... *I 29 0,000.00/yr I 1988 I 1990Working capital.l 810,300.00/yr I 1991 I 1991Mine operating I I Icost .00.0.0.00 l 101.43/mt 1 1991 1 2010
Mill operating I I Icost ........... I 33.62/mt 1 1991 | 2010
Endingyear
TABLE A-18. - Underground overhand stope capital and200 mt/day vein gold mine.
operating costs,
Category I Cost IBeginningi EndingI I year I year
Exploration.....3l 678 ,300.00/yr 1 1986 I 1988Acquisition.....l 333 ,300.00/yr I 1986 I 1988Development ..... l 86,600.00/yr I 1986 I 1990Mine plant ...... I 307 ,100.00/yr I 1986 I 1990Mine equipment..l 247,000.00/yr I 1989 I 1990Mill ...........ooI 445,300.00/yr I 1988 I 1990Working capital.1 1,2 49 ,300.00/yr I 1991 | 1991Mine operating I I I
costOO00.600l06 79.63/mt 1 1991 1 2010Mill operating I I Icost..0 ...... l.1 24.48/mt | 1991 1 2010
26
I
APPENDIX - Continued
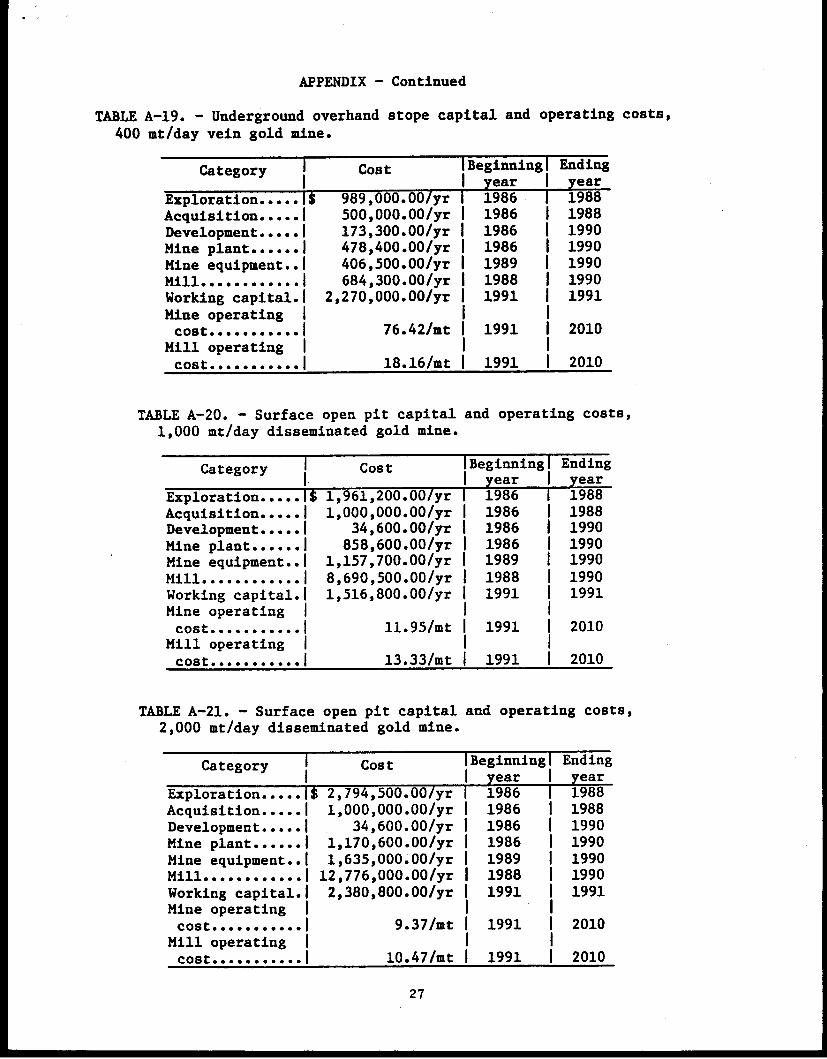
TABLE A-19. - Underground overhand stope capital and operating costs,400 mt/day vein gold mine.
Category Cost IBeginningI year I
Endingyear
Exploration ..... I$ 989,000.00/yr I 1986 i 1988Acquisition ..... I 500,000.00/yr I 1986 I 1988Development.....I 173,300.00/yr I 1986 I 1990Mine plant ...... 478,400.00/yr I 1986 I 1990Mine equipment..l 406,500.00/yr I 1989 I 1990
684,300.00/yr I 1988 I 1990Working capital.1 2,270,000.00/yr I 1991 I 1991Mine operating I I Icost*6600000.01 l 76.42/mt 1 1991 1 2010
Mill operating I I Icost*0660664l*0 18.16/mt 1 1991 1 2010
TABLE A-20. - Surface open pit capital and operating costs,1,000 mt/day disseminated gold mine.
Category I Cost IBeginningI EndingI I year I year
Exploration.....l$ 1,961,200.00/yr 1 1986 1 1988Acquisition .....I 1,000,000.00/yr I 1986 I 1988Development ..... | 34,600.00/yr I 1986 I 1990Mine plant......I 858,600.00/yr | 1986 I 1990Mine equipment..l 1,157,700.00/yr I 1989 I 1990Mill* .......... I 8,690,500.00/yr 1988 1990Working capital.| 1,516,800.00/yr I 1991 I 1991Mine operating I I Icost .......... l 11.95/mt I 1991 I 2010
Mill operating I I Icost .......... l 13.33/mt I 1991 I 2010
TABLE A-21. - Surface open pit capital and operating costs,2,000 mt/day disseminated gold mine.
Category I Cost IBeginningia ~~~~~~~~~~~~aEnding
I I year I yearExploration ..... 1$ 2,794,500.00/yr 1 1986 I 1988Acquisition ..... I 1,000,000.00/yr I 1986 I 1988Development ..... I 34,600.00/yr I 1986 I 1990Mine plant ...... | 1,170,600.00/yr I 1986 I 1990Mine equipment..| 1,635,000.00/yr I 1989 I 1990Mill ............ | 12,776,000.00/yr I 1988 I 1990Working capital.| 2,380,800.00/yr 1 1991 I 1991Mine operating I I Icost*6000009.01 l 9.37/mt 1 1991 1 2010
Mill operating I I Icost .6.0666.- l 10.47/mt 1 1991 1 2010
27
I

APPENDIX - Continued
TABLE A-22. - Surface open pit capital and operating costs,
4,000 mt/day disseminated gold mine.
Category I Cost TBeginningl EndingI I year I year
Exploration ...... l3,627,900.00/yr 1 1986 I 1988
Acquisition ..... I 1,333,300.00/yr I 1986 I 1988
Development.....l 34,600.00/yr I 1986 I 1990
Mine plant......l 1,852,800.00/yr I 1986 I 1990
Mine equipment..| 2,309,100.00/yr I 1989 I 1990Mill........... I 19,436,200.00/yr | 1988 I 1990
Working capital.| 3,712,800.00/yr I 1991 I 1991
Mine operating I I I
cost .......... l 7.24/mt I 1991 I 2010Mill operating I I I
cost .....O..*O.1 l 8.23/mt 1 1991 | 2010
TABLE A-23. - Surface open pit capital and operating costs,
6,000 mt/day disseminated gold mine.
Category I Cost IBeginningl EndingI I year y year
Exploration ..... $. f 3,627,900.00/yr i 1986 1 1988
Acquisition ..... I 1,666,700.00/yr I 1986 I 1988Developmento..... 50,000.00/yr I 1986 I 1990
Mine plant ...... 2,324,600.00/yr I 1986 I 1990
Mine equipment..l 2,825,700.00/yr I 1989 I 1990Mill ............I l27,308,800.00/yr | 1988 I 1990Working capital.| 5,000,400.00/yr I 1991 I 1991
Mine operating II I
cost*.* .... l ... I 6.36/mt I 1991 I 2010
Mill operating I I I
cost -. 0.6*96*01 | 7.53/mt I 1991 | 2010
TABLE A-24. - Surface open pit capital and operating costs,
8,000 mt/day disseminated gold mine.
Category I Cost IBeginningi EndingI I year y year
Exploration ..... $ 3,627,900.00/yr 1986 1988
Acquisition..... | 1,666,700.00/yr | 1986 I 1988Development..... 1 50,000.00/yr I 1986 I 1990Mine plant......I 2,831,200.00/yr I 1986 | 1990
Mine equipment..1 3,261,000.00/yr | 1989 I 1990Mill............| 34,814,100.00/yr I 1988 | 1990
Working capital.1 6,201,600.00/yr I 1991 I 1991Mine operating I I I
costo ......... l 5.81/mt I 1991 I 2010Mill operating I I I
cost ........ 7.11/mt I 1991 I 2010
28