Embed Size (px)
Citation preview
8/8/2019 Fe2O3 Humidity Project
http://slidepdf.com/reader/full/fe2o3-humidity-project 1/34
Studies on humidity sensing behavior of «««
M.Sc. Project -2009-10
1
Abstract
Hematite (E-Fe2O3) nanorods were successfully synthesized without any
templates by calcining the goethite (E-FeOOH) precursor in air at 300oC for 2 h.
The E-FeOOH precursor was prepared through a simple and low cost wet chemical
route by using iron sulphate (FeSO4,7H2O) and sodium acetate (CH3COONa) at 40
oC. The E-FeOOH precursor and E-Fe2O3 nanorods were characterized by using X-
ray diffraction (XRD) measurements, thermogravimetric analysis (TGA), Fourier
transform infrared (FTIR) spectroscopy, X-ray photoelectron spectroscopy (XPS)
and field emission scanning electron microscopy (FE-SEM). To demonstrate the
practical applications of the synthesized E-Fe2O3 nanorods, we investigated their
humidity sensing properties. The E-Fe2O3 nanorods exhibits humidity sensing
properties such as higher humidity response (~663% at 95% RH), response time
(~ 199 s), recovery time (~190 s), hysteresis within 1% and excellent repeatability.
Due to the fact that it has an excellent humidity sensing characteristics and can be
synthesized easily, the E-Fe2O3 nanorods would be an ideal candidate for application
in humidity sensors.
8/8/2019 Fe2O3 Humidity Project
http://slidepdf.com/reader/full/fe2o3-humidity-project 2/34
Studies on humidity sensing behavior of «««
M.Sc. Project -2009-10
2
1. Introduction
Humidity sensors are useful for the detection of the relative humidity (RH) in various
environments. The measurement and control of humidity are important in a wide variety of
commercial and industrial applications, including those associated with building ventilation
control, clean rooms in the semiconductor and automotive industries, environmental
chambers for the testing of electronics, industrial drying, and process monitoring in the
chemicals, electronics, food/beverage, pharmaceutical, cosmetics and biomedical analysis
industries.
The term moisture generally refers to the water content of any material, but for
practical reasons, it is applied only to liquids and solids, whereas the term humidity is
reserved for the water vapor content in gases. There are many ways to express moisture and
humidity, often depending on the industry or the particular application. The moisture of
gases is expressed sometimes in pounds of water vapor per million cubic feet of gas. The
moisture in liquids and solids is generally given as a percentage of water per total mass (wet-
weight basis), but may be given on a dry-weight basis. The moisture in liquids with low
water miscibility is usually expressed as parts per million by weight (PPMw).
Two common parameters associated with humidity measurement are absolute
humidity and relative humidity. The absolute humidity is the density of the water vapor
component. It can be measured, for example, by passing a measured quantity of air through
a moisture-absorbing substance (such as silica gel) which is weighted before and after the
8/8/2019 Fe2O3 Humidity Project
http://slidepdf.com/reader/full/fe2o3-humidity-project 3/34
Studies on humidity sensing behavior of «««
M.Sc. Project -2009-10
3
absorption. Absolute humidity is expressed in grams per cubic meter or in grains per cubic
foot. The absolute humidity is not generally useful in engineering practice because it is a
function of atmospheric pressure.
The RH is defined as the ratio of the water -vapor pressure present to the water -vapor
pressure required for saturation at a given temperature. The relative humidity is related to
ambient temperature. Water vapor is a natural component of air, and the RH of the water
vapor and air mixture is defined as the ratio of the mass of water vapor in a unit volume
compared to the mass of water vapor which that volume could hold if the vapour were
saturated at the mixture temperature. The RH is typically expressed as :
where P w and P s are the vapor and saturation pressures, respectively.
Humidity can be measured by instruments called hygrometers. The first hygrometer
was invented by Sir John Leslie (1766±1832). The detection of humidity is mainly based on
the response of electric devices or a change of spectral response. Electric devices are usually
composed of capacitors, resistors, or semiconductors that are sensitive to moisture, in which
their electrical resistance and/or capacitance vary depending on the degree of adsorption of
moisture. The change in color of a sensing material exposed to a humid atmosphere results
in the spectral variation. Various types of humidity sensors have been marketed, however,
they are far from satisfactory since a linear response to humidity is valid only in a limited
range and hysteresis is often involved in the measurement of the response and humidity
curves. Thus, it is very much necessary to develop a humidity sensor with complete set of
8/8/2019 Fe2O3 Humidity Project
http://slidepdf.com/reader/full/fe2o3-humidity-project 4/34
Studies on humidity sensing behavior of «««
M.Sc. Project -2009-10
4
characteristics like, good linearity, high sensitivity, low hysteresis, rapid response time and
obviously with low cost.
The materials that have been studied for the development of humidity sensors
include polymers, ceramics and composites, which have their own merits and specific
conditions of application. The importance of humidity sensing has been well understood in
most recent times and considerable attention has been focused on the development of
humidity sensitive materials.
Currently, one-dimensional (1-D) nanostructures, such as nanorods, nanowires,
nanobelts, and nanotubes, have become the focus of intensive research not only for their
peculiar properties but also for many potential applications in catalysis, electronics,
photonics, drug delivery, medical diagnostics, sensors, and magnetic materials. Hematite (E-
Fe2O3) is the most stable iron oxide with n-type semiconducting properties ( E g = 2.2 eV)
under ambient conditions. It has been intensively investigated because of its wide
applications in catalysts, pigments, magnetic materials, gas sensors, and lithium ion
batteries. For its excellent properties, much attention has been directed to the controlled
synthesis of one-dimensional (1-D) E-Fe2O3, such as nanofibers, nanorods, nanowires,
nanobelts and nanotubes by a variety of techniques and methods. Wang et al. prepared
E-Fe2O3 nanobelts and nanowires via a gas-solid reaction process under 700 and 800 °C.
Mann et al. synthesized E-Fe2O3 nanotubes by using biomacromolecules as templates.
Yi-Xie et al. prepared E-Fe2O3 nanorods through a hydrothermal process at 120 °C. The
preparation of E-Fe2O3nanotubes with alumina membranes as the substrates was also
employed by many researchers. However, the gas-solid reaction usually requires special
8/8/2019 Fe2O3 Humidity Project
http://slidepdf.com/reader/full/fe2o3-humidity-project 5/34
Studies on humidity sensing behavior of «««
M.Sc. Project -2009-10
5
equipment and high temperatures, the methods employing templates or substrates often
suffer from disadvantages related to the high cost and the removal of impurities and the
hydrothermal process usually needs tedious reaction times. It is still a challenge to develop
simple, low-cost, and environmentally friendly approaches for the synthesis of 1-D
structural E-Fe2O3.
The objectives of the present study are ±(a) to synthesize E-Fe2O3 nanorods by using
a simple wet chemical route, (b) to characterize the resulting E-Fe2O3 nanorods by using the
XRD, FTIR, TGA, XPS and FE-SEM and (c) to explore the possibility of using the
synthesized E-Fe2O3 nanorods as sensing material for humidity. In the present project work,
the E-Fe2O3 nanorods were synthesized without any templates via a low-temperature (40 °C)
solution approach. In this work, the precursor of E-FeOOH nanorods was first prepared by
using FeSO4 ·7H2O as the iron source material in the presence of CH3COONa in an aqueous
solution. The CH3COONa was used as a source of hydroxide ions during the hydrolysis of
iron salts to form iron oxyhydroxide (FeOOH). Then E-Fe2O3 nanorods were obtained by
the calcination of as- prepared E-FeOOH at 300 °C for 2 h. Humidity sensing characteristics
such as relative humidity (RH)-resistance property, humidity hysteresis, response time and
repeatability of the E-Fe2O3 nanorods were investigated.
8/8/2019 Fe2O3 Humidity Project
http://slidepdf.com/reader/full/fe2o3-humidity-project 6/34
Studies on humidity sensing behavior of «««
M.Sc. Project -2009-10
6
2. Experimental
2.1. Materials
All chemicals were of analytical grade. The iron sulphate (FeSO4, 7H2O) and
sodium acetate (CH3COONa) were purchased from E-Merck (India) and were used without
further purification.
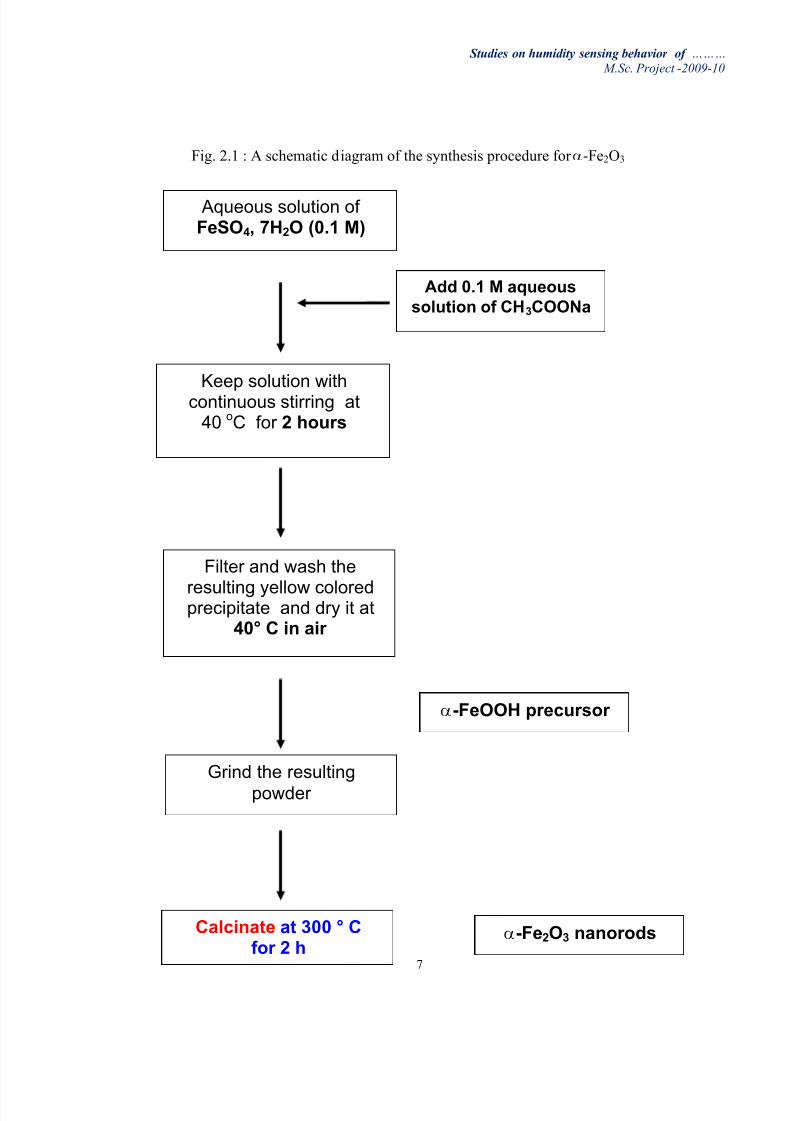
2.2. Synthesis of the E-Fe2O3 nanorods
In this work, the E-Fe2O3 nanorods were synthesized without any templates by
calcining the E-FeOOH precursor in air at 300oC for 2 h. Fig. 2.1 is a schematic
representation of the synthesis procedure. The E-FeOOH precursor was prepared through a
simple and low cost wet chemical route. The FeSO4,7H2O was used as the source of Fe2+
and the CH3COONa was used as the precipitating agent to release hydroxyl ions slowly
during the reaction. In a typical experiment, the aqueous solution containing 0.1M
F
eSO4,
7H2O and 0.1 M CH3COONa was prepared in double distilled water and stirred
continuously using a magnetic stirrer for 2 h at 40oC to obtain a yellow colored precipitate.
The resulting precipitate was filtered and washed with double distilled water and alcohol
several times to remove impurities and by products present in the product. The precipitate,
thus formed was dried at 40oC under vacuum for 2 h and grinded into a powder, which is
the E-FeOOH precursor. The E-FeOOH precursor was calcined in air at 300oC for 2 h to
obtain the E-Fe2O3 nanorods. The color of the E-FeOOH precursor was changed from
yellow to red during calcination.
8/8/2019 Fe2O3 Humidity Project
http://slidepdf.com/reader/full/fe2o3-humidity-project 7/34
Studies on humidity sensing behavior of «««
M.Sc. Project -2009-10
7
Fig. 2.1 : A schematic diagram of the synthesis procedure for E-Fe2O3
E-FeOOH precursor
Aqueous solution of FeSO4, 7H2O (0.1 M)
Add 0.1 M aqueous
solution of CH3COONa
Keep solution withcontinuous stirring at
40 oC for 2 hours
Filter and wash the
resulting yellow coloredprecipitate and dry it at
40° C in air
Grind the resulting
powder
Calcinate at 300 ° Cfor 2 h
E-Fe2O3 nanorods
8/8/2019 Fe2O3 Humidity Project
http://slidepdf.com/reader/full/fe2o3-humidity-project 8/34
Studies on humidity sensing behavior of «««
M.Sc. Project -2009-10
8
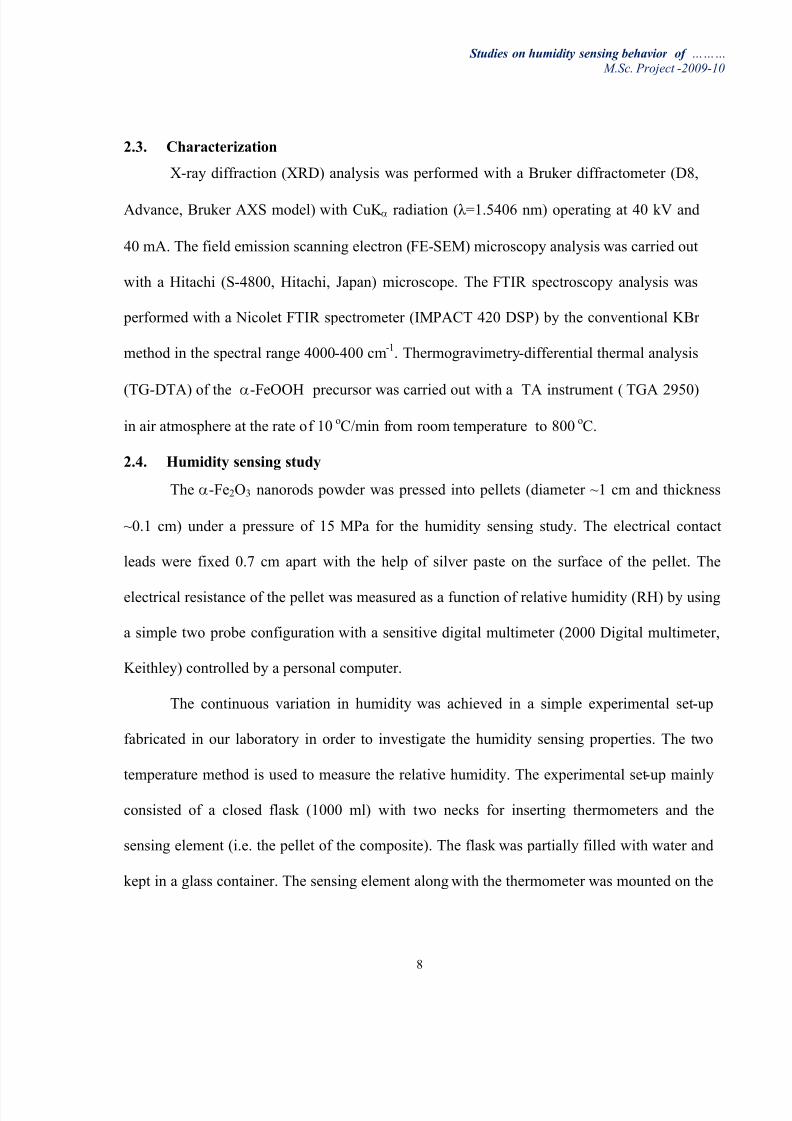
2.3. Characterization
X-ray diffraction (XRD) analysis was performed with a Bruker diffractometer (D8,
Advance, Bruker AXS model) with CuK E radiation (=1.5406 nm) operating at 40 kV and
40 mA. The field emission scanning electron (FE-SEM) microscopy analysis was carried out
with a Hitachi (S-4800, Hitachi, Japan) microscope. The FTIR spectroscopy analysis was
performed with a Nicolet FTIR spectrometer (IMPACT 420 DSP) by the conventional KBr
method in the spectral range 4000-400 cm-1
. Thermogravimetry-differential thermal analysis
(TG-DTA) of the E-FeOOH precursor was carried out with a TA instrument ( TGA 2950)
in air atmosphere at the rate of 10oC/min from room temperature to 800
oC.
2.4. Humidity sensing study
The E-Fe2O3 nanorods powder was pressed into pellets (diameter ~1 cm and thickness
~0.1 cm) under a pressure of 15 MPa for the humidity sensing study. The electrical contact
leads were fixed 0.7 cm apart with the help of silver paste on the surface of the pellet. The
electrical resistance of the pellet was measured as a function of relative humidity (RH) by using
a simple two probe configuration with a sensitive digital multimeter (2000 Digital multimeter,
Keithley) controlled by a personal computer.
The continuous variation in humidity was achieved in a simple experimental set-up
fabricated in our laboratory in order to investigate the humidity sensing properties. The two
temperature method is used to measure the relative humidity. The experimental set-up mainly
consisted of a closed flask (1000 ml) with two necks for inserting thermometers and the
sensing element (i.e. the pellet of the composite). The flask was partially filled with water and
kept in a glass container. The sensing element along with the thermometer was mounted on the
8/8/2019 Fe2O3 Humidity Project
http://slidepdf.com/reader/full/fe2o3-humidity-project 9/34
8/8/2019 Fe2O3 Humidity Project
http://slidepdf.com/reader/full/fe2o3-humidity-project 10/34
Studies on humidity sensing behavior of «««
M.Sc. Project -2009-10
10
3. Results and Discussion
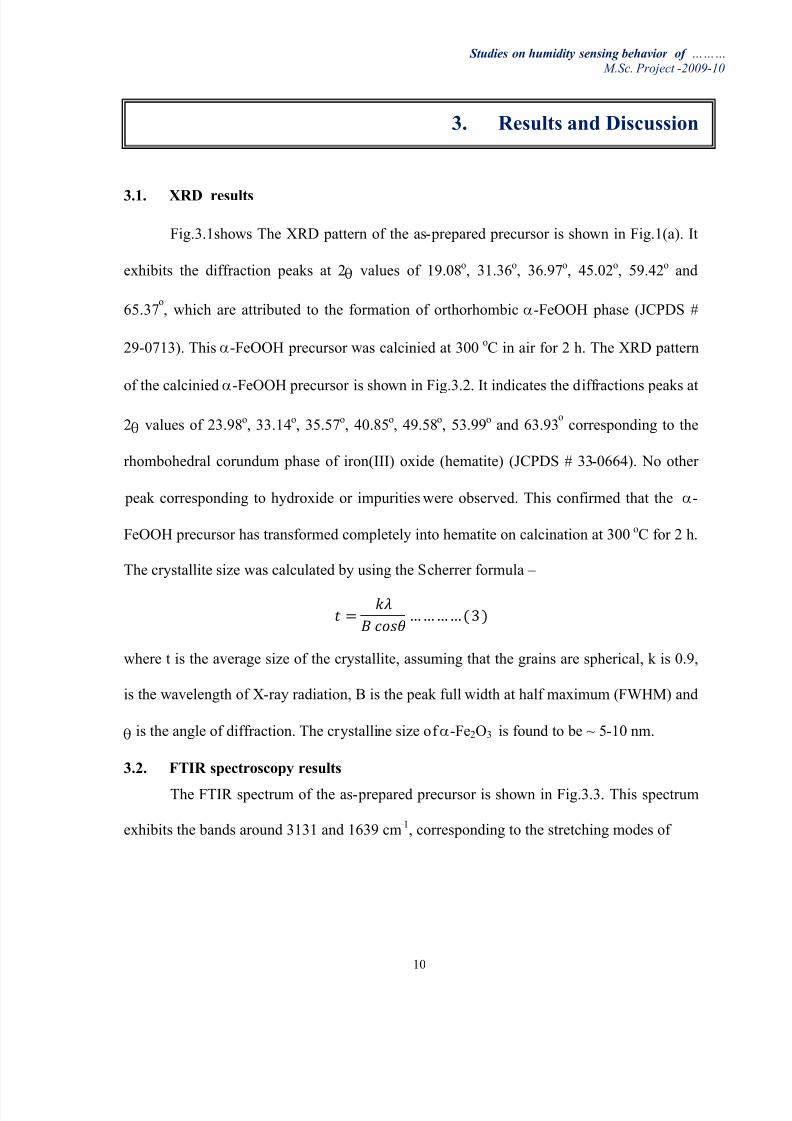
3.1. XRD results
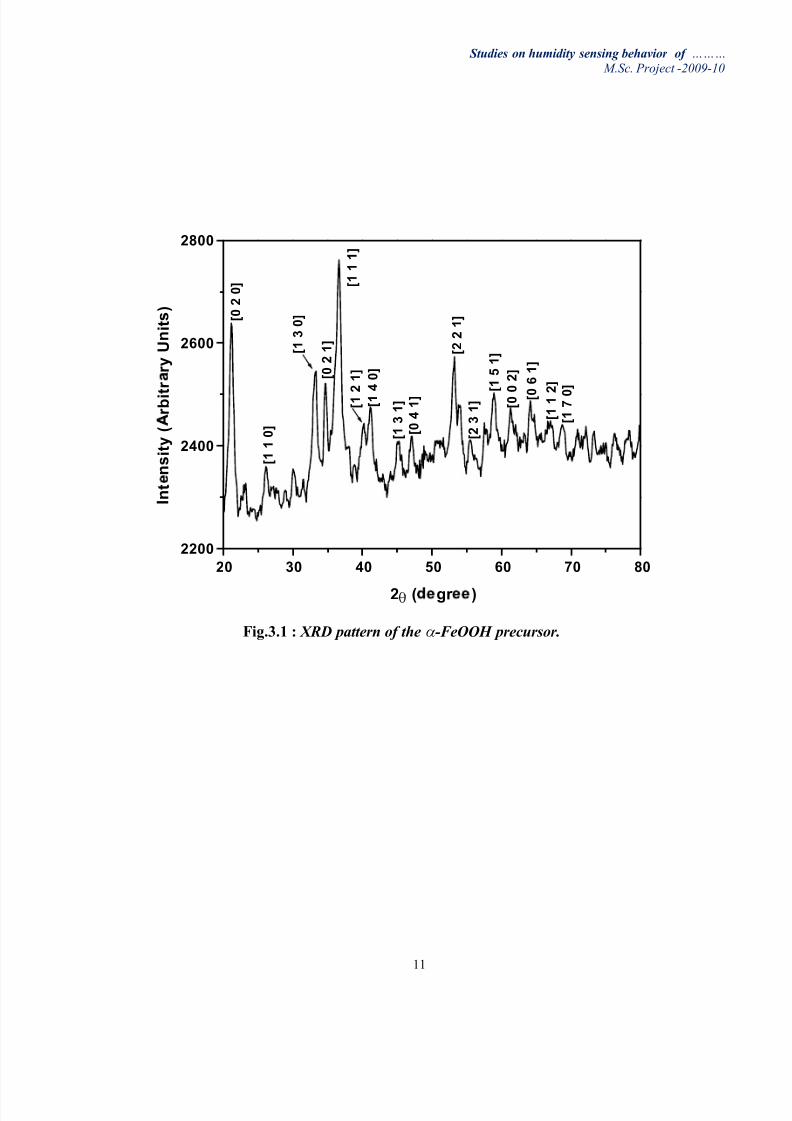
Fig.3.1shows The XRD pattern of the as- prepared precursor is shown in Fig.1(a). It
exhibits the diffraction peaks at 2 U values of 19.08o, 31.36o, 36.97o, 45.02o, 59.42o and
65.37o, which are attributed to the formation of orthorhombic E-FeOOH phase (JCPDS #
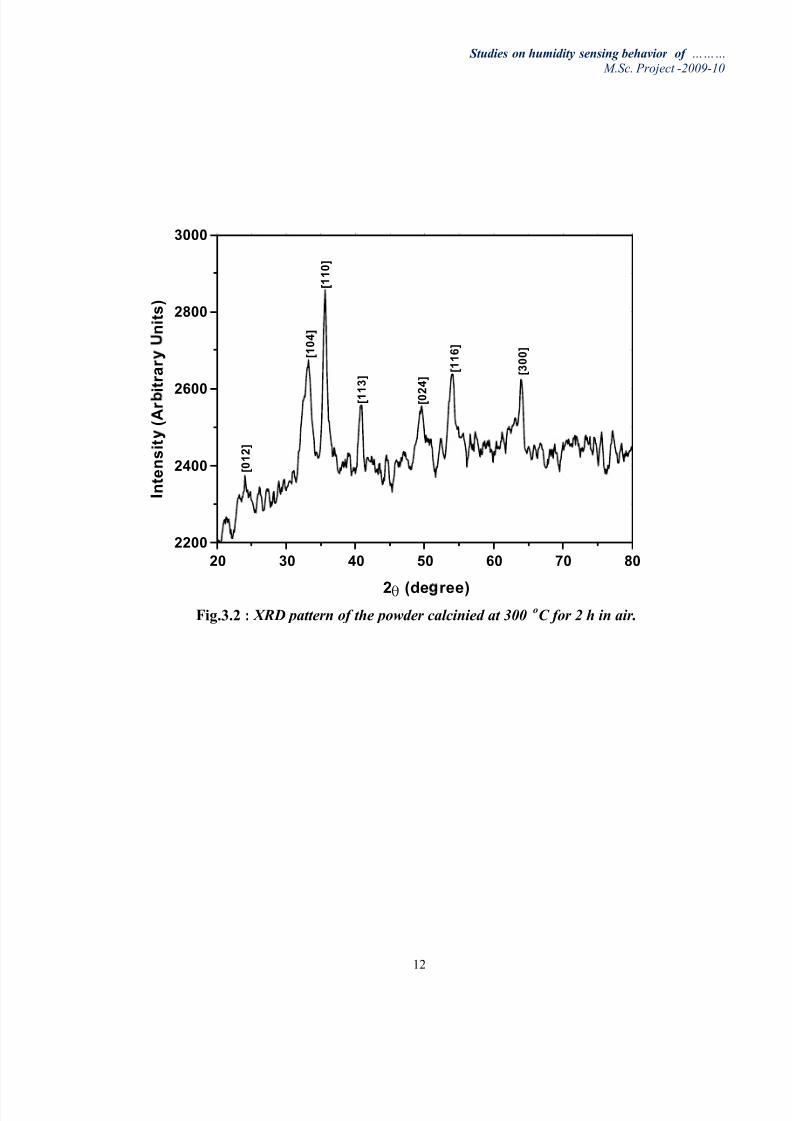
29-0713). This E-FeOOH precursor was calcinied at 300oC in air for 2 h. The XRD pattern
of the calcinied E-F
eOOH precursor is show
n inF
ig.3.2. It indicates the diffractions peaks at
2 U values of 23.98o, 33.14
o, 35.57
o, 40.85
o, 49.58
o, 53.99
oand 63.93
ocorresponding to the
rhombohedral corundum phase of iron(III) oxide (hematite) (JCPDS # 33-0664). No other
peak corresponding to hydroxide or impurities were observed. This confirmed that the E-
FeOOH precursor has transformed completely into hematite on calcination at 300oC for 2 h.
The crystallite size was calculated by using the Scherrer formula ±
where t is the average size of the crystallite, assuming that the grains are spherical, k is 0.9,
is the wavelength of X-ray radiation, B is the peak full width at half maximum (FWHM) and
U is the angle of diffraction. The crystalline size of E-Fe2O3 is found to be ~ 5-10 nm.
3.2. FTIR spectroscopy results
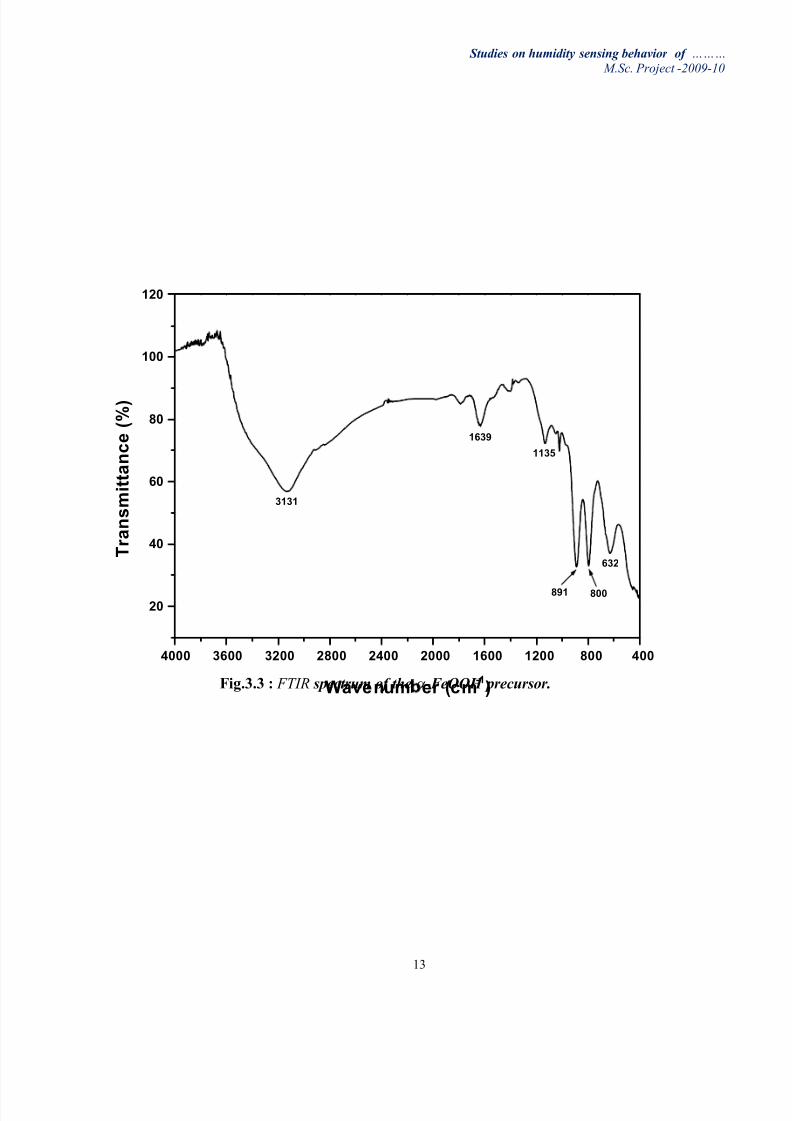
The FTIR spectrum of the as- prepared precursor is shown in Fig.3.3. This spectrum
exhibits the bands around 3131 and 1639 cm-1
, corresponding to the stretching modes of
8/8/2019 Fe2O3 Humidity Project
http://slidepdf.com/reader/full/fe2o3-humidity-project 11/34
Studies on humidity sensing behavior of «««
M.Sc. Project -2009-10
11
20 30 40 50 60 70 80
2200
2400
2600
2800
[ 1
7 0
]
[ 1
1
2 ]
[ 0
6
1 ]
[ 0
0
2 ]
[ 1
5
1 ]
[ 2
3
1 ]
[ 2
2
1 ]
[ 0
4
1 ]
[ 1
3
1 ] [
1
4
0 ]
[ 1
2
1 ]
[ 1
1
1 ]
[ 0
2
1 ]
[ 1
3
0 ]
[ 1
1
0 ]
[ 0
2
0 ]
I n t n s i t y (
r b i t
r r y U n i t s )
2 U ( gr )
Fig.3.1 : XRD pattern of the E-FeOOH precursor.
8/8/2019 Fe2O3 Humidity Project
http://slidepdf.com/reader/full/fe2o3-humidity-project 12/34
Studies on humidity sensing behavior of «««
M.Sc. Project -2009-10
12
20 30 40 50 60 70 80
2200
2400
2600
2800
3000
[ 3 0 0 ]
[ 1 1 6 ]
[ 0 2
4 ]
[ 1 1
3 ]
[ 1 1 0 ]
[ 1 0 4 ]
[ 0 1 2 ]
I n t e n s i t ( A
r i t r a r
n i t s )
2 U (de ree)
Fig.3.2 : XRD pattern of the powder calcinied at 300oC for 2 h in air.
8/8/2019 Fe2O3 Humidity Project
http://slidepdf.com/reader/full/fe2o3-humidity-project 13/34
Studies on humidity sensing behavior of «««
M.Sc. Project -2009-10
13
Fig.3.3 : FTIR spectrum of the E-FeOOH precursor.
4000 3600 3200 2800 2400 2000 1600 1200 800 400
20
40
60
80
100
120
632
800891
1135
1639
3131
T r a n s m i t t a n c e ( % )
Wavenum er (cm-1)
8/8/2019 Fe2O3 Humidity Project
http://slidepdf.com/reader/full/fe2o3-humidity-project 14/34
Studies on humidity sensing behavior of «««
M.Sc. Project -2009-10
14
OH. Two bands at ~891 and 800 cm-1 can be assigned to Fe-O-H bending vibrations in
the E-FeOOH and these bands are usually used for identification of E-FeOOH in a
qualitative phase analysis of iron oxide mixtures. The band at ~632 cm-1
corresponds to the
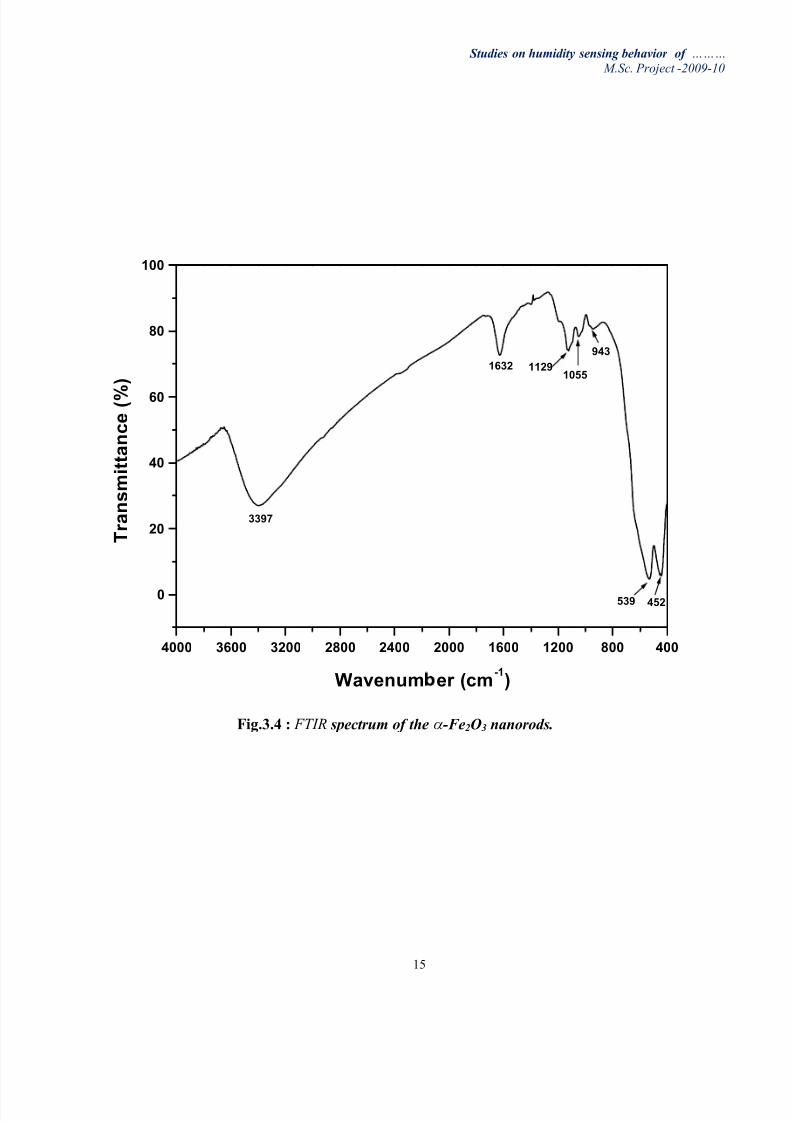
Fe-O stretching vibrations in E-FeOOH. The FTIR spectrum of the E-FeOOH precursor
calcinied at 300 oC for 2 h [Fig.3.4] exhibits the bands at ~539 and 452 cm-1 which
corresponds to the characteristic bands of ferric oxides.
3.3. TGA analysis
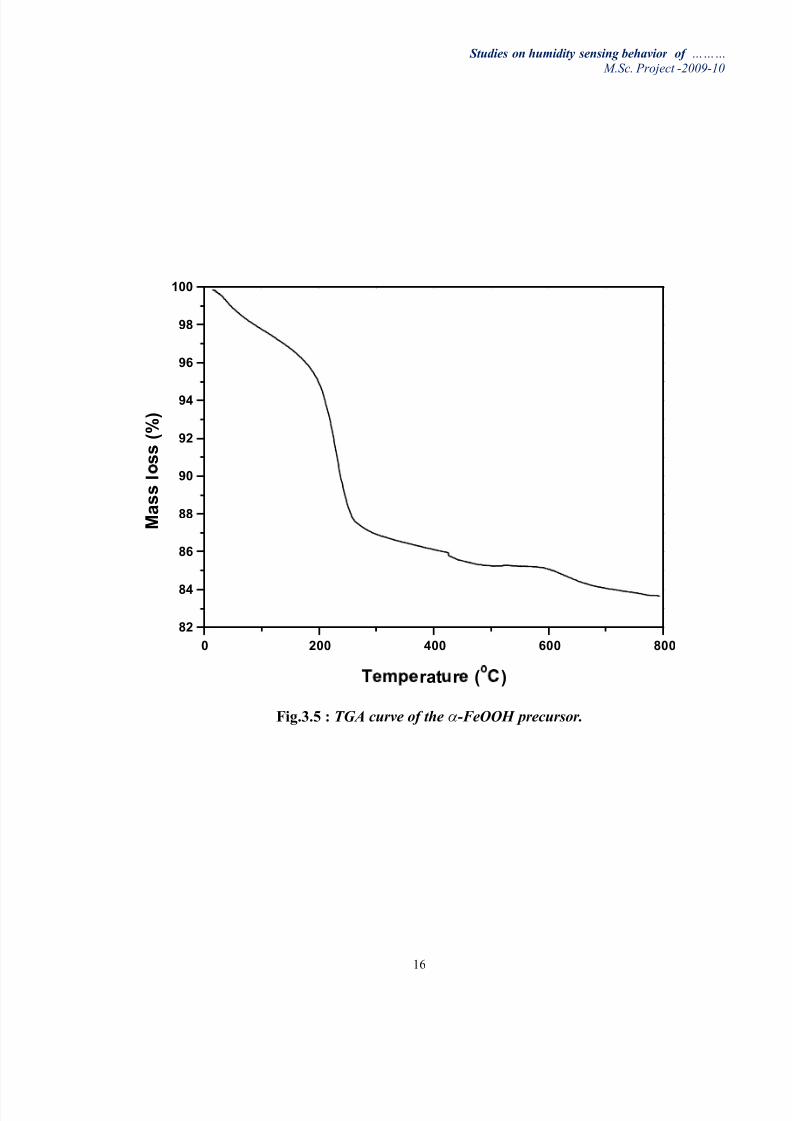
The TG curve of the as- prepared E-FeOOH precursor is shown in Fig. 3.5. It
exhibits two major weight losses in the temperature range 30-188 oC and 188-265 oC. In the
first step, the weight loss initiates practically from room temperature to 188oC, with a
weight loss of ~4% due to the desorption of physically adsorbed water. The second weight
loss step observed from 188oC and is continued up to 265
oC, with a weight loss of ~12%. It
is associated with the dehydroxylation of E-FeOOH precursor to form E-Fe2O3. This result
is in agreementw
ith the XRD andF
TIR data of the calcinied precursor w
hich show
s the
transformation of as- prepared E-FeOOH precursor to E-Fe2O3, on calcination at 300oC for 2
h.
3.4. XPS results
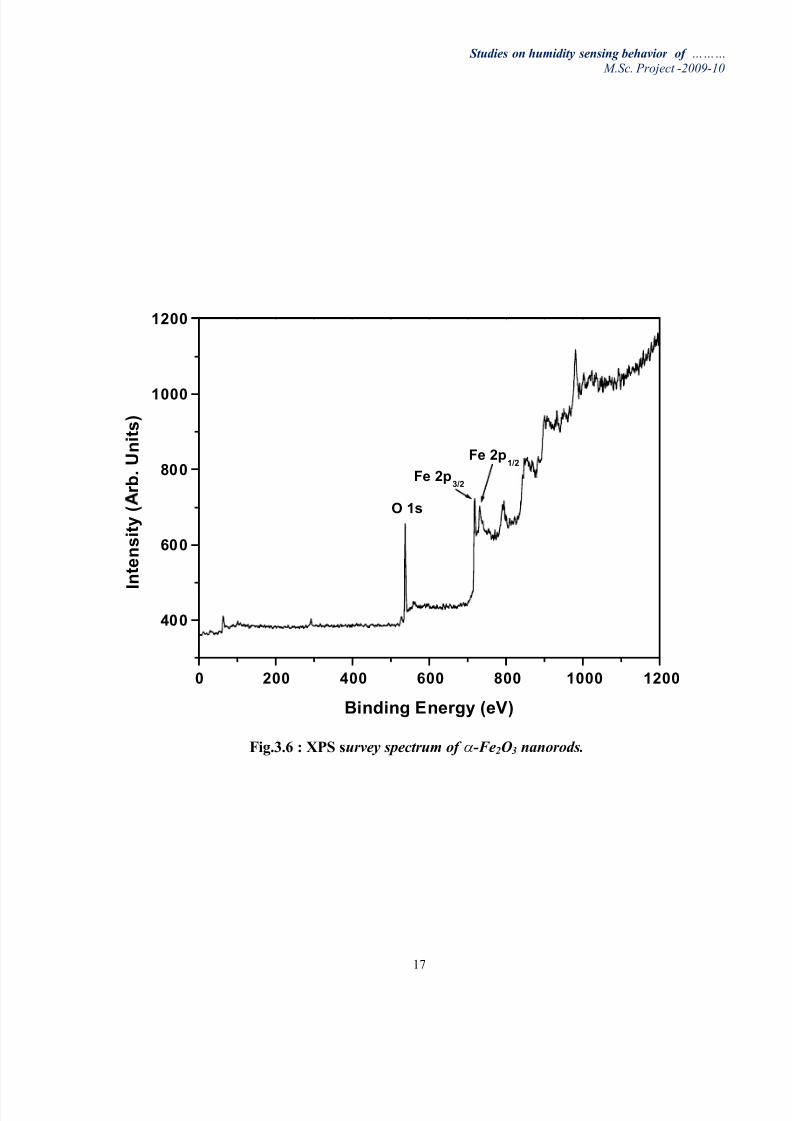
To further ascertain the formation of E-Fe2O3, the XPS analysis of the calcinied
E-FeOOH precursor was performed. The XPS survey spectrum of the calcinied E-FeOOH
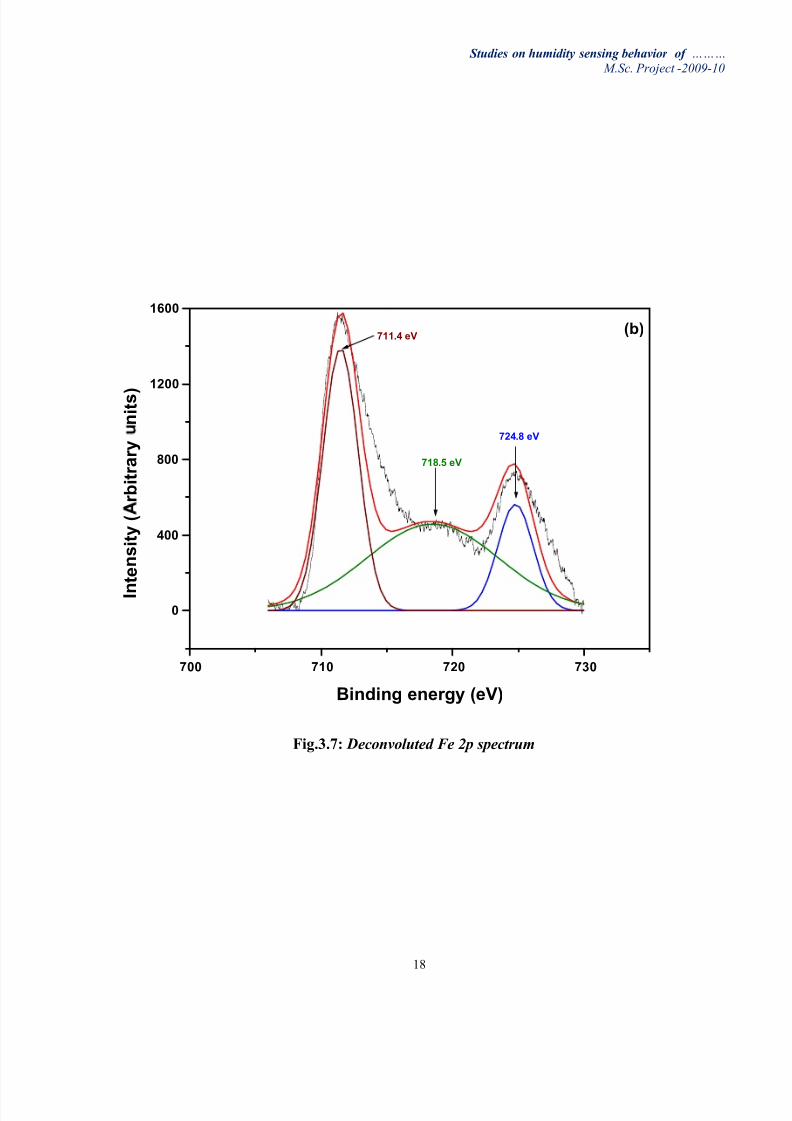
precursor [Fig.3.6] shows the presence of Fe 2p (56%) and O 1s (31%). The deconvoluted
Fe 2p spectrum [Fig.3.7] is comprised of two peaks at 711.40 and 724.80 eV, which
corresponds to the Fe 2p3/2 and Fe 2p1/2, respectively. This is consistent with the previously
8/8/2019 Fe2O3 Humidity Project
http://slidepdf.com/reader/full/fe2o3-humidity-project 15/34
Studies on humidity sensing behavior of «««
M.Sc. Project -2009-10
15
Fig.3.4 : FTIR spectrum of the E-Fe2O3 nanorods.
4000 3600 3200 2800 2400 2000 1600 1200 800 400
0
20
40
60
80
100
452539
943
105511291632
3397
T r a n s m i t t a n c e ( %
)
Wavenum er (cm-1)
8/8/2019 Fe2O3 Humidity Project
http://slidepdf.com/reader/full/fe2o3-humidity-project 16/34
Studies on humidity sensing behavior of «««
M.Sc. Project -2009-10
16
Fig.3.5 : TGA curve of the E-FeOOH precursor.
0 200 400 600 800
82
84
86
88
90
92
94
96
98
100
M a s s l
s s ( %
)
r at r (
)
8/8/2019 Fe2O3 Humidity Project
http://slidepdf.com/reader/full/fe2o3-humidity-project 17/34
Studies on humidity sensing behavior of «««
M.Sc. Project -2009-10
17
Fig.3.6 : XPS survey spectrum of E-Fe2O3 nanorods.
0 200 400 600 800 1000 1200
400
600
800
1000
1200
Fe 2p1/2
Fe 2p3/2
O 1s
I n t e n s i t y (
r b .
U n i t s )
Binding Energy (eV)
8/8/2019 Fe2O3 Humidity Project
http://slidepdf.com/reader/full/fe2o3-humidity-project 18/34
Studies on humidity sensing behavior of «««
M.Sc. Project -2009-10
18
Fig.3.7: Deconvoluted Fe 2p spectrum
700 710 720 730
0
400
800
1200
1600
724.8 eV
718.5 eV
711.4 eV(b)
I n
t e n s i t y (
r b i t r a r y
n i t s )
Binding energy (eV)
8/8/2019 Fe2O3 Humidity Project
http://slidepdf.com/reader/full/fe2o3-humidity-project 19/34
Studies on humidity sensing behavior of «««
M.Sc. Project -2009-10
19
reported values 710.8 and 724.8 eV for the bulk E-Fe2O3. The energy difference between
Fe 2p3/2 and Fe 2p1/2 peaks is 13.4 eV. This value is characteristic of Fe3+ state indicating the
formation of the E-Fe2O3 by the experimental methodology used. Furthermore, Fe3+
satellite
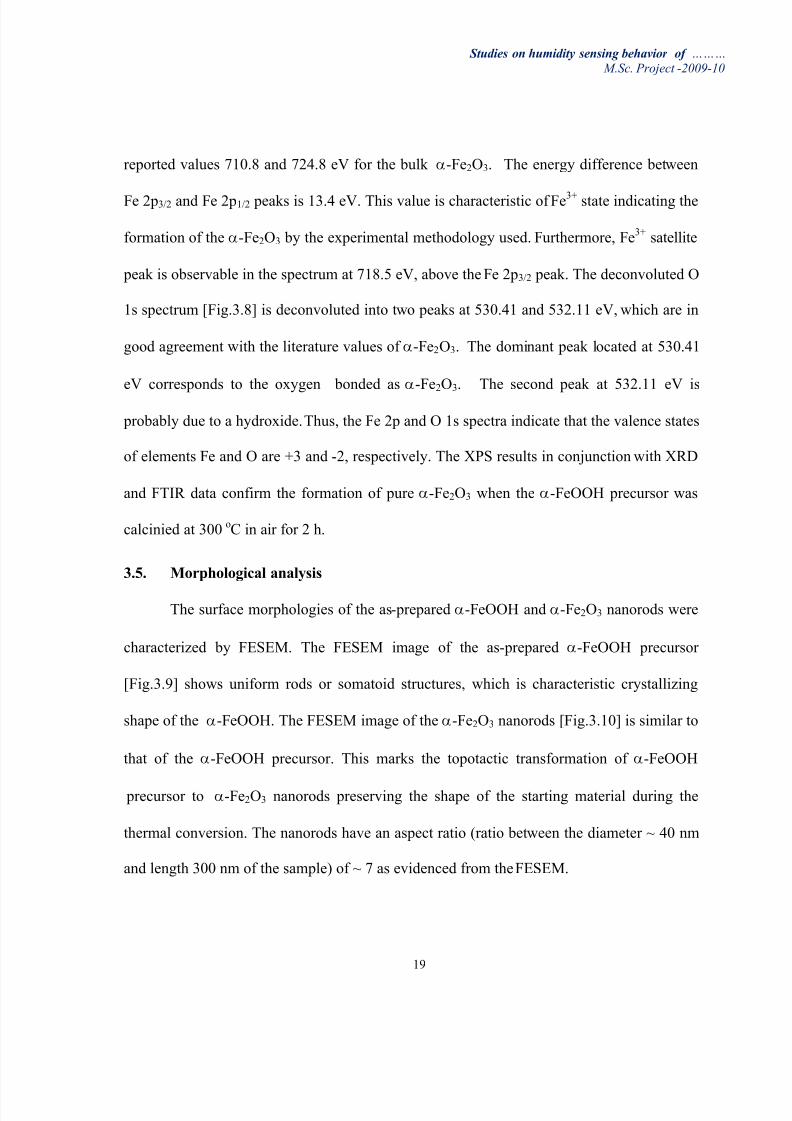
peak is observable in the spectrum at 718.5 eV, above the Fe 2p3/2 peak. The deconvoluted O
1s spectrum [Fig.3.8] is deconvoluted into two peaks at 530.41 and 532.11 eV, which are in
good agreement with the literature values of E-Fe2O3. The dominant peak located at 530.41
eV corresponds to the oxygen bonded as E-Fe2O
3. The second peak at 532.11 eV is
probably due to a hydroxide. Thus, the Fe 2p and O 1s spectra indicate that the valence states
of elements Fe and O are +3 and -2, respectively. The XPS results in conjunction with XRD
and FTIR data confirm the formation of pure E-Fe2O3 when the E-FeOOH precursor was
calcinied at 300 oC in air for 2 h.
3.5. Morphological analysis
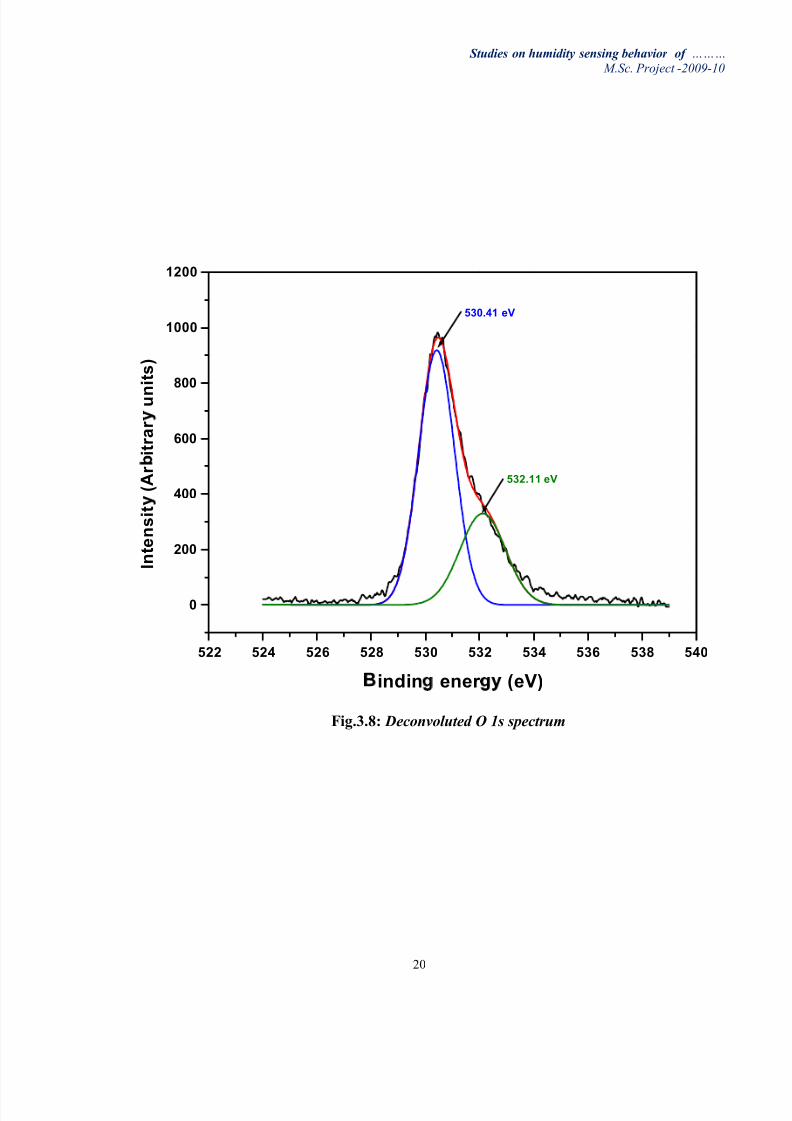
The surface morphologies of the as- prepared E-FeOOH and E-Fe2O3 nanorods were
characterized by FESEM. The FESEM image of the as- prepared E-FeOOH precursor
[Fig.3.9] shows uniform rods or somatoid structures, which is characteristic crystallizing
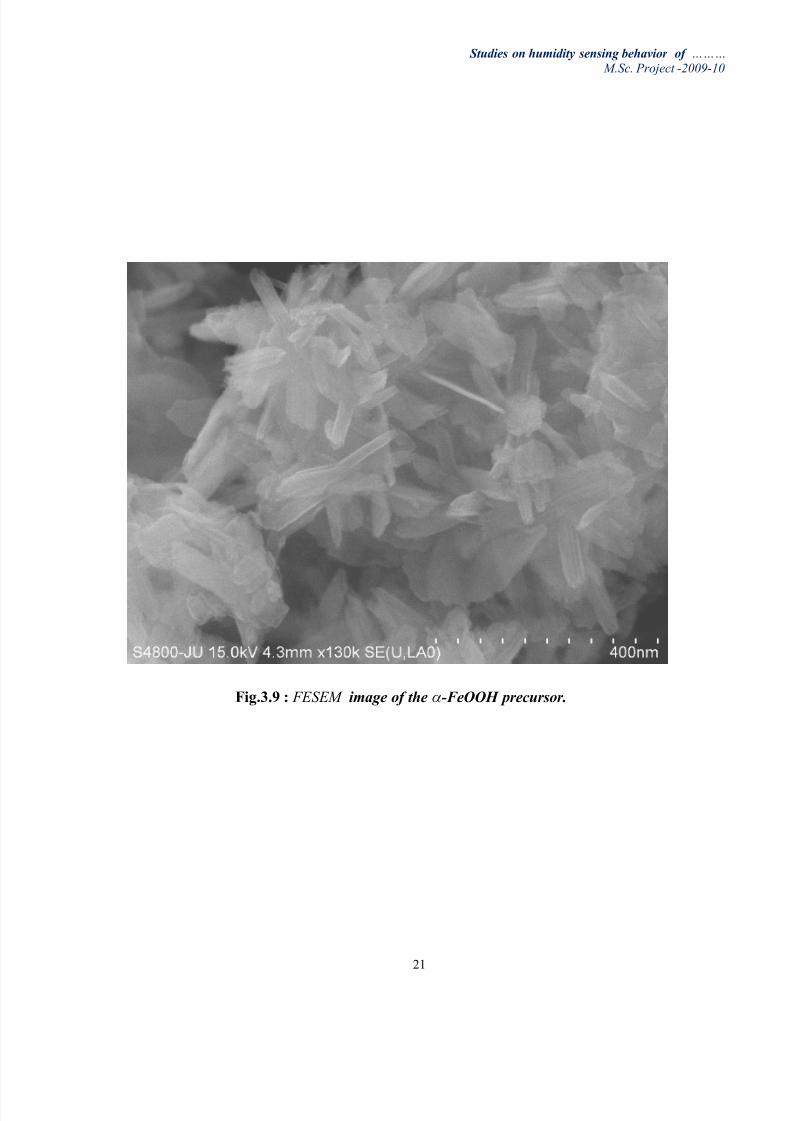
shape of the E-FeOOH. The FESEM image of the E-Fe2O3 nanorods [Fig.3.10] is similar to
that of the E-FeOOH precursor. This marks the topotactic transformation of E-FeOOH
precursor to E-Fe2O3 nanorods preserving the shape of the starting material during the
thermal conversion. The nanorods have an aspect ratio (ratio between the diameter ~ 40 nm
and length 300 nm of the sample) of ~ 7 as evidenced from the FESEM.
8/8/2019 Fe2O3 Humidity Project
http://slidepdf.com/reader/full/fe2o3-humidity-project 20/34
Studies on humidity sensing behavior of «««
M.Sc. Project -2009-10
20
Fig.3.8: Deconvoluted O 1s spectrum
522 524 526 528 530 532 534 536 538 540
0
200
400
600
800
1000
1200
532.11 eV
530.41 eV
I n t e n s i t ( A
r i t r a r u n
i t s )
indin ener (eV)
8/8/2019 Fe2O3 Humidity Project
http://slidepdf.com/reader/full/fe2o3-humidity-project 21/34
Studies on humidity sensing behavior of «««
M.Sc. Project -2009-10
21
Fig.3.9 : F E S E M image of the E-FeOOH precursor.
8/8/2019 Fe2O3 Humidity Project
http://slidepdf.com/reader/full/fe2o3-humidity-project 22/34
Studies on humidity sensing behavior of «««
M.Sc. Project -2009-10
22
Fig.3.10 : F E S E M image of the E-Fe2O3 nanorods.
8/8/2019 Fe2O3 Humidity Project
http://slidepdf.com/reader/full/fe2o3-humidity-project 23/34
Studies on humidity sensing behavior of «««
M.Sc. Project -2009-10
23
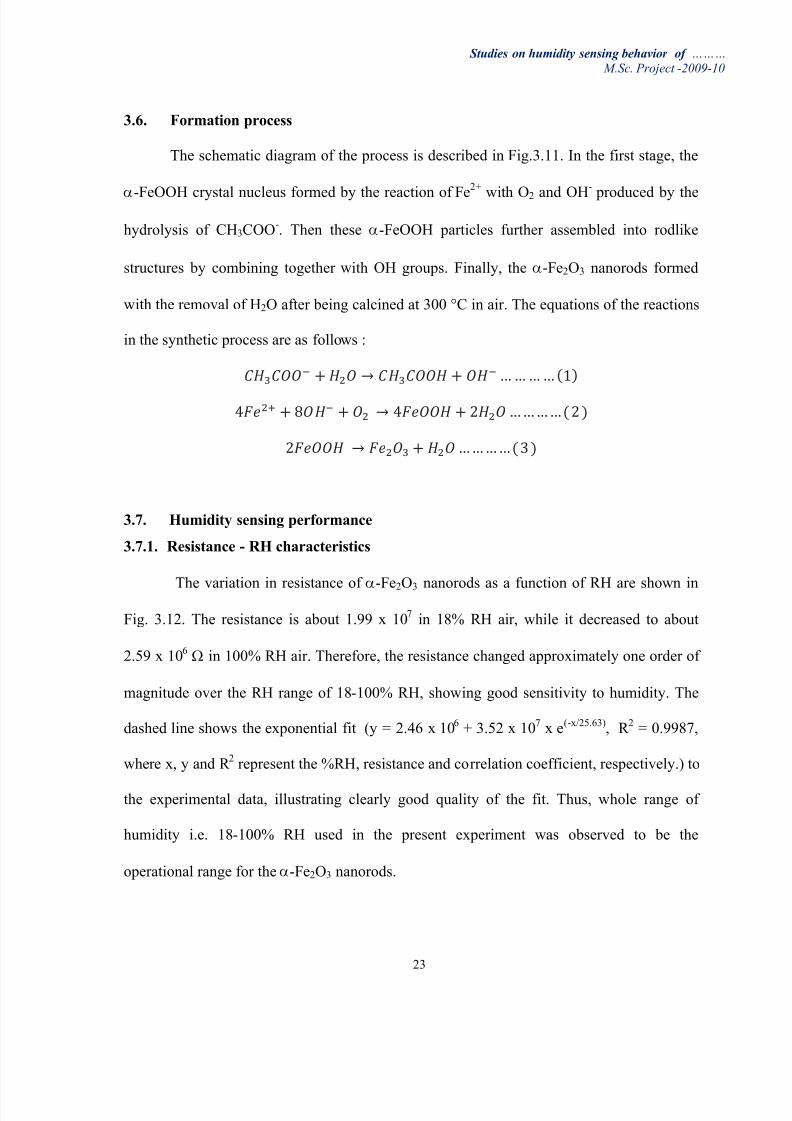
3.6. Formation process
The schematic diagram of the process is described in Fig.3.11. In the first stage, the
E-FeOOH crystal nucleus formed by the reaction of Fe2+
with O2 and OH-
produced by the
hydrolysis of CH3COO-. Then these E-FeOOH particles further assembled into rodlike
structures by combining together with OH groups. Finally, the E-Fe2O3 nanorods formed
with the removal of H2O after being calcined at 300 °C in air. The equations of the reactions
in the synthetic process are as follows :
3.7. Humidity sensing performance
3.7.1. Resistance - RH characteristics
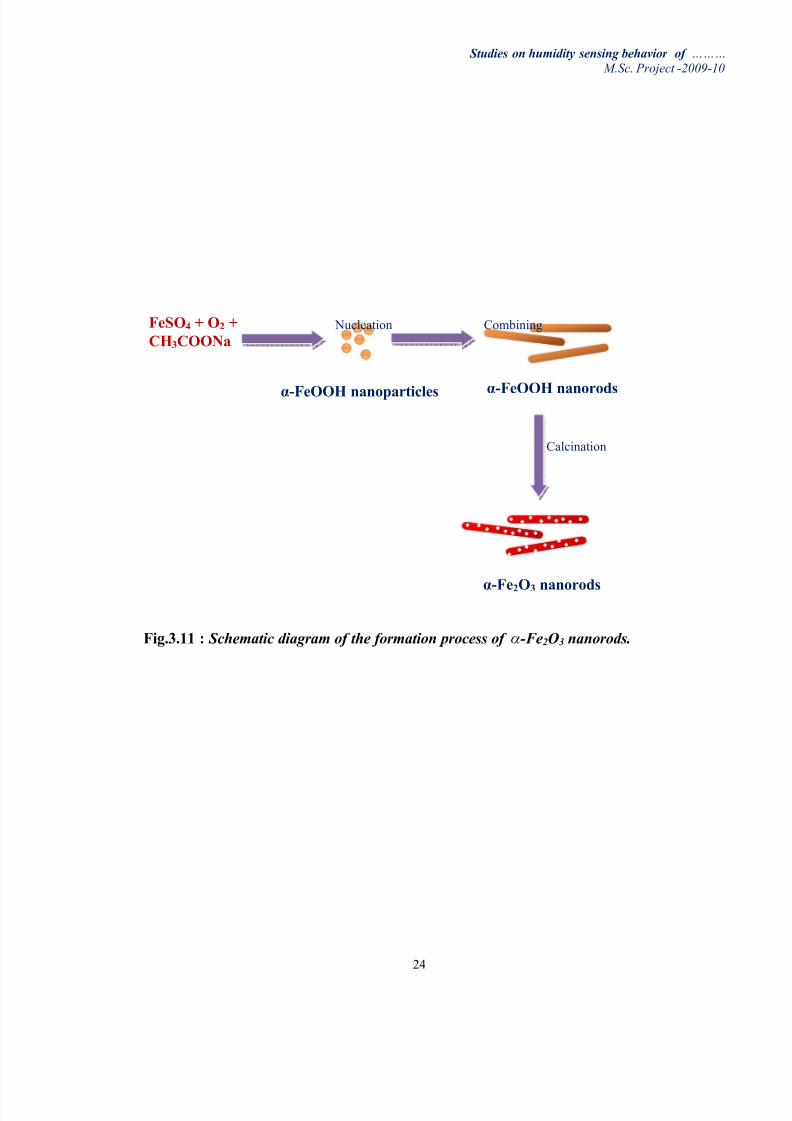
The variation in resistance of E-F
e2O3 nanorods as a function of RH are show
n in
Fig. 3.12. The resistance is about 1.99 x 10⁷
in 18% RH air, while it decreased to about
2.59 x 10⁶ ; in 100% RH air. Therefore, the resistance changed approximately one order of
magnitude over the RH range of 18-100% RH, showing good sensitivity to humidity. The
dashed line shows the exponential fit (y = 2.46 x 10⁶ + 3.52 x 10⁷ x e(-x/25.63), R 2 = 0.9987,
where x, y and R 2
represent the %RH, resistance and correlation coefficient, respectively.) to
the experimental data, illustrating clearly good quality of the fit. Thus, whole range of
humidity i.e. 18-100% RH used in the present experiment was observed to be the
operational range for the E-Fe2O3 nanorods.
8/8/2019 Fe2O3 Humidity Project
http://slidepdf.com/reader/full/fe2o3-humidity-project 24/34
Studies on humidity sensing behavior of «««
M.Sc. Project -2009-10
24
FeSO4 + O2 +
CH3COONa Nucleation Combining
Calcination
-FeOOH nanoparticles -FeOOH nanorods
-Fe2O3 nanorods
Fig.3.11 : Schematic diagram of the formation process of E-Fe2O3 nanorods.
8/8/2019 Fe2O3 Humidity Project
http://slidepdf.com/reader/full/fe2o3-humidity-project 25/34
Studies on humidity sensing behavior of «««
M.Sc. Project -2009-10
25
0 20 40 60 80 100 120
0.0
3.0x10⁶
6.0x10⁶
9.0x10⁶
1.2x10⁷
1.5x10⁷
1.8x10⁷
2.1x10⁷
R e s i s t a n c e
( ; )
%RH
Fig.3.12 : V ariation of resistance with R H for E-Fe2O3 nanorods. T he dashed line
represent the exponential fit to the experimental data.
8/8/2019 Fe2O3 Humidity Project
http://slidepdf.com/reader/full/fe2o3-humidity-project 26/34
Studies on humidity sensing behavior of «««
M.Sc. Project -2009-10
26
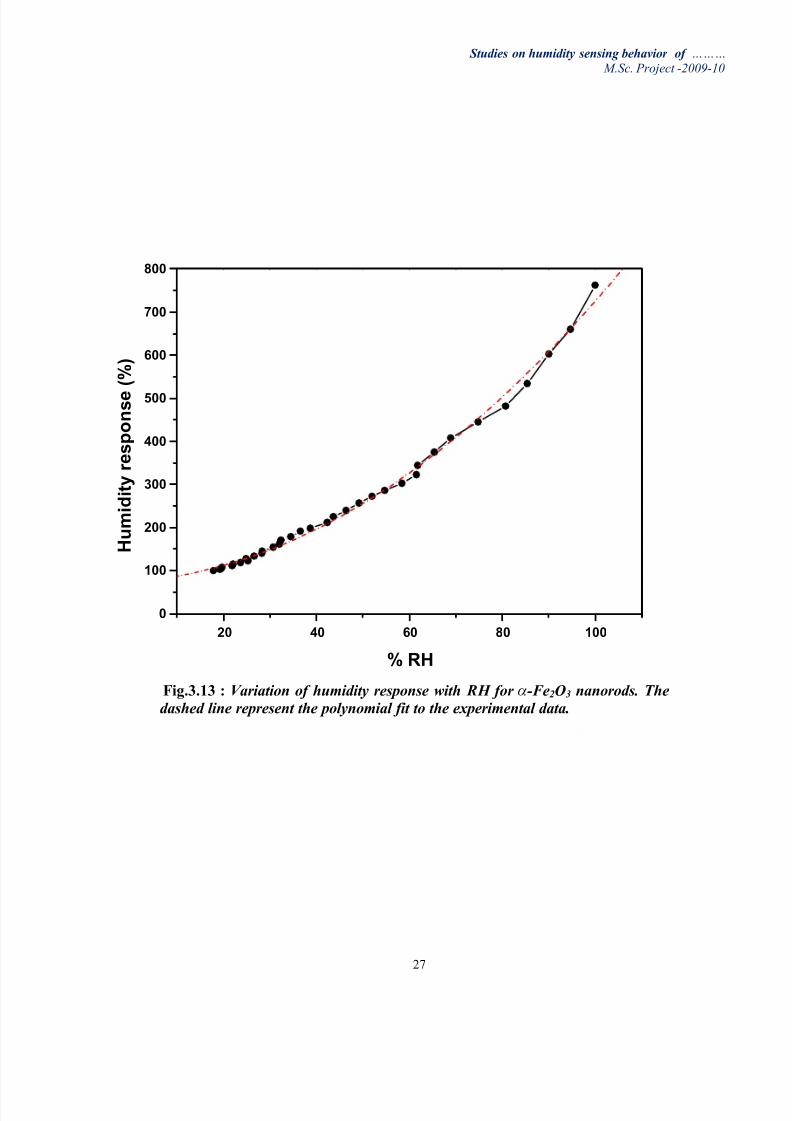
In order to reveal the characteristics of the E-Fe2O3 nanorods towards moisture, the
humidity response for detecting the humidity was calculated using the expression-
where R d and R h are the values of the resistance recorded at 18 % RH and at a particular RH,
respectively. The variation of the humidity response with RH for the E-Fe2O3 nanorods is
shown in Fig.3.13. It was observed that the humidity response increases with an increase in
the RH. It is found that the humidity response can be empirically represented as y = 73.57
+0.76 * x + 0.06 * x2, R
2= 0.9969, where x, y and R
2represents % RH, humidity response
and correlation coefficient, respectively. The dashed line shows the polynomial fit to the
experimental data, illustrating clearly good quality of the fit. Thus, the E-Fe2O3 nanorods
can be reliably used to monitor the RH in the range 18-100 % RH.
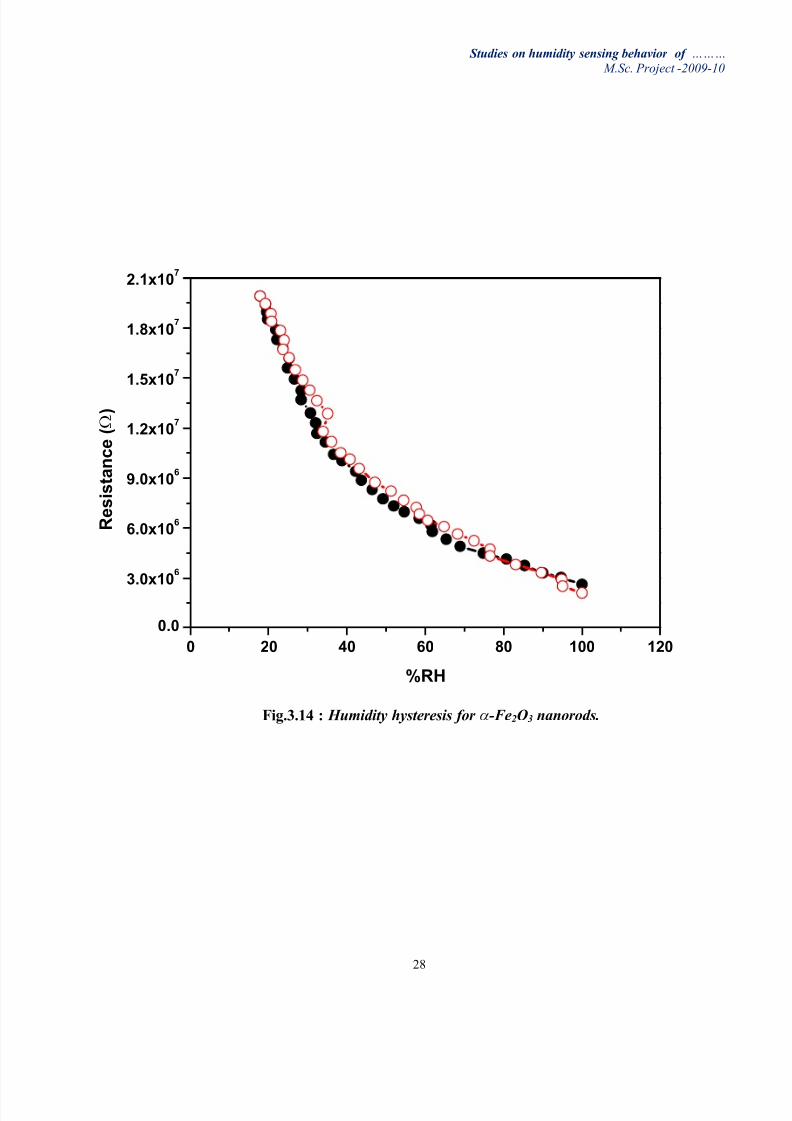
3.7.2. Hysteresis
Hysteresis is an important parameter for evaluating the performance of a humidity
sensor. The hysteresis curves for E-Fe2O3 nanorods was obtained by measuring the
resistances as a function of RH for the high (100% RH) -low (18% RH)- high (100% RH)
cycle and the corresponding hysteresis curves are presented in Fig.3.14. It is seen that the
differences in resistance values of the E-Fe2O3 nanorods for low (18% RH) ± high (100%
RH) (i.e. humidification process, black circles) and high (100% RH) - low (18% RH) (i.e.
desiccation process, red circles) are within 1%, which indicates a good reliability of E-Fe2O3
nanorods.
8/8/2019 Fe2O3 Humidity Project
http://slidepdf.com/reader/full/fe2o3-humidity-project 27/34
Studies on humidity sensing behavior of «««
M.Sc. Project -2009-10
27
20 40 60 80 100
0
100
200
300
400
500
600
700
800
H u m i d i t y r e s p o n s e
( % )
% RH
Fig.3.13 : V ariation of humidity response with R H for E-Fe2O3 nanorods. T he
dashed line represent the polynomial fit to the experimental data.
8/8/2019 Fe2O3 Humidity Project
http://slidepdf.com/reader/full/fe2o3-humidity-project 28/34
Studies on humidity sensing behavior of «««
M.Sc. Project -2009-10
28
0 20 40 60 80 100 120
0.0
3.0x10⁶
6.0x10⁶
9.0x10⁶
1.2x10⁷
1.5x10⁷
1.8x10⁷
2.1x10⁷
R e s i s t a n c e ( ; )
%RH
Fig.3.14 : Humidity hysteresis for E-Fe2O3 nanorods.
8/8/2019 Fe2O3 Humidity Project
http://slidepdf.com/reader/full/fe2o3-humidity-project 29/34
Studies on humidity sensing behavior of «««
M.Sc. Project -2009-10
29
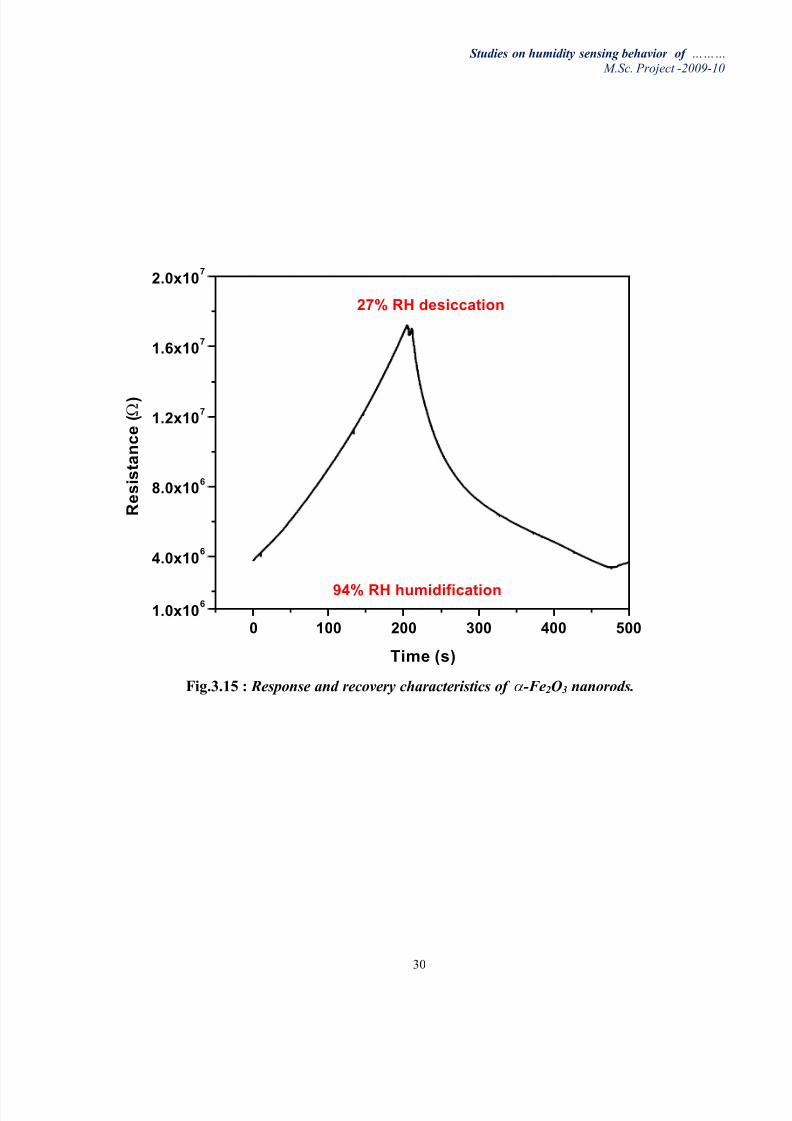
3.7.3. Response and recovery times
In order to utilize the E-Fe2O3 nanorods as a humidity sensor, it is important to
know the rate of response to the variation of RH. The resistance of E-Fe2O3 nanorods was
monitored at two extreme humid atmospheres (27% and 94% RH). The sensor was
transferred from a chamber (27% RH) to another chamber (94% RH) and then transferred
back. The resulting response and recovery characteristics are shown in Fig.3.15. Although,
the sensing element was exposed to the surrounding air (i.e. laboratory environment) during
the transfer process, the transfer time (~ 1-2 s) is much smaller than the response and
recovery times of the sensor and therefore, the correctness of this experiment is acceptable.
According to literature, the time taken by a sensor to achieve 90% of the total resistance
change is defined as response time in the case of adsorption or the recovery time in the case
of desorption. The E-Fe2O3 nanorods exhibit the response and recovery times of ~ 199 and
190 s at the humidification and desiccation steps, respectively.
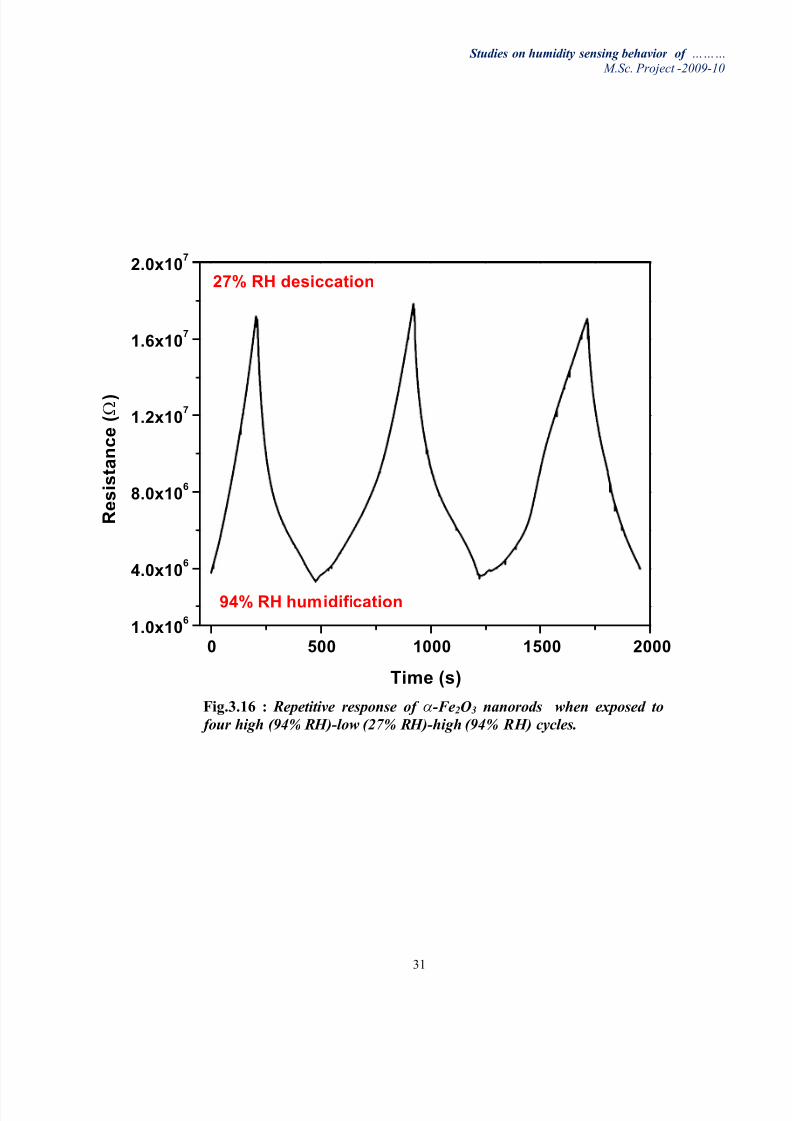
3.7.4. Reproducibility and reversibility
The reproducibility and reversibility are important parameters to consider when
evaluating the performance of a sensor. The resistance of E-Fe2O3 nanorods was measured
by exposing them repeatedly to 27% RH and then to 94% RH atmospheres to examine the
reproducibility and reversibility. The measurements were repeated for three cycles and the
resulting response and recovery characteristics are shown in Fig.3.16. It was seen that the
resistance value of the E-Fe2O3 nanorods reverts always to the original one when RH is
restored to the former state, which indicates that the humidity sensing process is extremely
reversible. The response and recovery times does not change during the four cycles of
8/8/2019 Fe2O3 Humidity Project
http://slidepdf.com/reader/full/fe2o3-humidity-project 30/34
Studies on humidity sensing behavior of «««
M.Sc. Project -2009-10
30
0 100 200 300 400 5001.0x10
6
4.0x10⁶
8.0x10⁶
1.2x10⁷
1.6x10⁷
2.0x10⁷
94% RH humidification
27% RH desiccation
R e s i s t a n c e ( ; )
Time (s)
Fig.3.15 : Response and recovery characteristics of E-Fe2O3 nanorods.
8/8/2019 Fe2O3 Humidity Project
http://slidepdf.com/reader/full/fe2o3-humidity-project 31/34
Studies on humidity sensing behavior of «««
M.Sc. Project -2009-10
31
0 500 1000 1500 20001.0x10
6
4.0x10⁶
8.0x10⁶
1.2x10⁷
1.6x10⁷
2.0x10⁷
94% RH humidification
27% RH desiccation
R e s i s t a n c e ( ; )
Time (s)
Fig.3.16 : Repetitive response of E-Fe2O3 nanorods when exposed to
four high (94% R H)-low (27% R H)-high (94% R H) cycles.

8/8/2019 Fe2O3 Humidity Project
http://slidepdf.com/reader/full/fe2o3-humidity-project 32/34
Studies on humidity sensing behavior of «««
M.Sc. Project -2009-10
32
measurements, indicating a good reproducibility of the response of the E-Fe2O3 nanorods.
Thus, the E-Fe2O3 nanorods exhibited good stability as well as an excellent reproducibility
of the response. This suggests that the E-Fe2O3 nanorods can be used as a reusable sensing
material for humidity.
8/8/2019 Fe2O3 Humidity Project
http://slidepdf.com/reader/full/fe2o3-humidity-project 33/34
Studies on humidity sensing behavior of «««
M.Sc. Project -2009-10
33
4. Conclusions
In this project work, we have presented a simple and low cost route for synthesizing
E-Fe2O3 nanorods via a template free solution approach at low temperature (40oC). The
following main findings resulted from the present investigation ±
y We have successfully synthesized the E-Fe2O3 nanorods at low cost by using a
solution approach at 40oC using FeSO4 ·7H2O as the iron source material in the
presence of CH3COONa in an aqueous solution. The resulting nanorods were
characterized by XRD, FTIR, TGA, XPS and FE-SEM.
y The formation of E-FeOOH precursor and its topotactic transformation to E-Fe2O3
upon calcinations was confirmed by XRD, FTIR, TGA, XPS and SEM analysis.
y This study thus offers a simple, low cost, short process, template free and
environmentally friendly solution approach to synthesize E-Fe2O3 nanorods.
y The E-Fe2O3 nanorods exhibits humidity sensing properties such as higher humidity
response (~663% at 95% RH), response time (~ 199 s), recovery time (~190 s),
hysteresiswithin 1% and excellent repeatability.
y Due to the fact that it has an excellent humidity sensing characteristics and can be
synthesized easily, the E-Fe2O3 nanorods would be an ideal candidate for application
in humidity sensors.
8/8/2019 Fe2O3 Humidity Project
http://slidepdf.com/reader/full/fe2o3-humidity-project 34/34
Studies on humidity sensing behavior of «««
M.Sc. Project -2009-10
References
1. C. Y. Lee and G. B. Lee, Humidity Sensors: A review, Sensor Lett. 3 (2005) 1-15.
2. Z. Chen and C. Lu, Humidity Sensors: A Review of Materials and Mechanisms,Sensor Letts. 3 (2005) 274-295.
3. S.C.Tjong, H. Chen, Mater. Sci. and Engg. R 45 (2004) 1.
4. A. B. Gaik wad, S. C. Navale, V. Samuel, A.V.Murugan, R.Ravi, Mater. Res. Bull.41 (2006) 347.
5. W. Junbo, Y. Minge, Li Yingmin, L. Chen, Y. Zhang, D. Bingjun, J. Non-
Crystalline Solids 351 (2005) 228.
6. R.S.Niranjan, Y.K.Hwang, D.K.Kim, S.H.Jhung, J.S.Chang, I.S.Mulla, Mater.Chem. And Phy. 92 (2005) 384.
7. X. Yang and Y. Lu, Mater. Lett. 59 (2005) 2484.
8. H. Gleiter, Prog. Mater. Sci. 33 (1989) 223.
9. P.G.Sanders, J.G.Barker, J.R.Weertman, J.Mater. Res. 11 (1996) 311.
10. P.K.Ghosh, S.Das, and K.K.Chattopadhyay, J. Nanoparticle Res. 7 (2005) 219.