Embed Size (px)
Citation preview
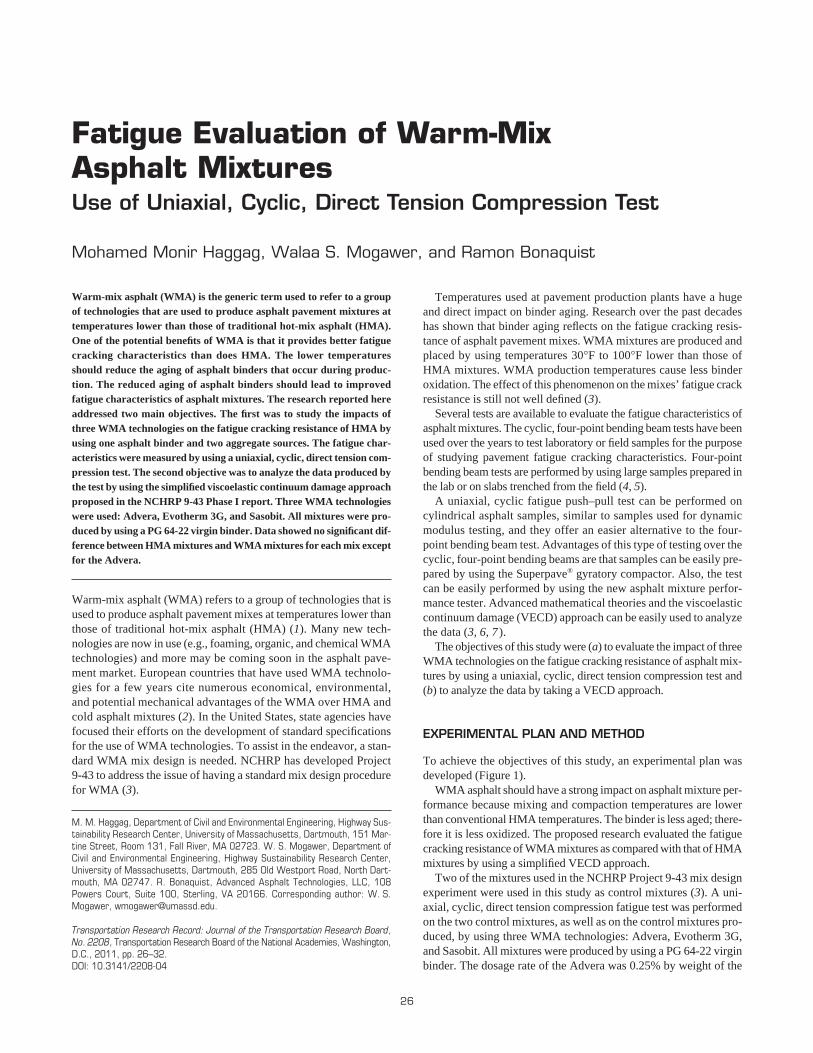
26
Temperatures used at pavement production plants have a hugeand direct impact on binder aging. Research over the past decadeshas shown that binder aging reflects on the fatigue cracking resis-tance of asphalt pavement mixes. WMA mixtures are produced andplaced by using temperatures 30°F to 100°F lower than those ofHMA mixtures. WMA production temperatures cause less binderoxidation. The effect of this phenomenon on the mixes’ fatigue crackresistance is still not well defined (3).
Several tests are available to evaluate the fatigue characteristics ofasphalt mixtures. The cyclic, four-point bending beam tests have beenused over the years to test laboratory or field samples for the purposeof studying pavement fatigue cracking characteristics. Four-pointbending beam tests are performed by using large samples prepared inthe lab or on slabs trenched from the field (4, 5).
A uniaxial, cyclic fatigue push–pull test can be performed oncylindrical asphalt samples, similar to samples used for dynamicmodulus testing, and they offer an easier alternative to the four-point bending beam test. Advantages of this type of testing over thecyclic, four-point bending beams are that samples can be easily pre-pared by using the Superpave® gyratory compactor. Also, the testcan be easily performed by using the new asphalt mixture perfor-mance tester. Advanced mathematical theories and the viscoelasticcontinuum damage (VECD) approach can be easily used to analyzethe data (3, 6, 7 ).
The objectives of this study were (a) to evaluate the impact of threeWMA technologies on the fatigue cracking resistance of asphalt mix-tures by using a uniaxial, cyclic, direct tension compression test and(b) to analyze the data by taking a VECD approach.
EXPERIMENTAL PLAN AND METHOD
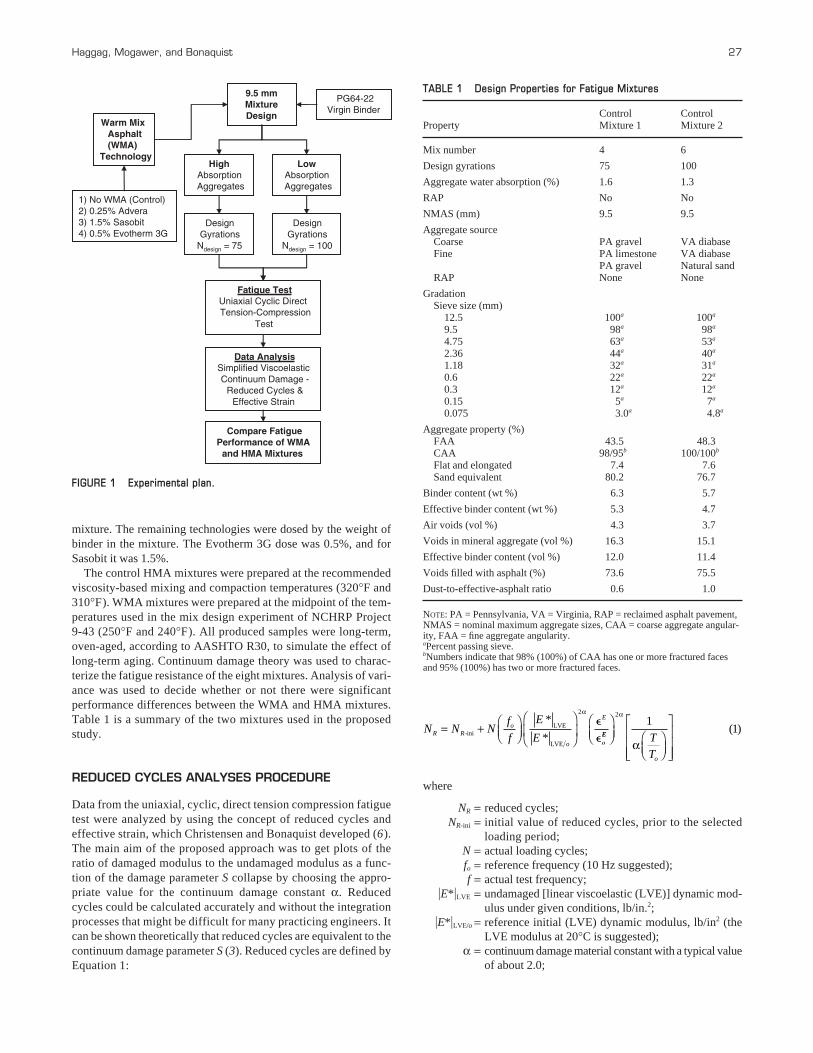
To achieve the objectives of this study, an experimental plan wasdeveloped (Figure 1).
WMA asphalt should have a strong impact on asphalt mixture per-formance because mixing and compaction temperatures are lowerthan conventional HMA temperatures. The binder is less aged; there-fore it is less oxidized. The proposed research evaluated the fatiguecracking resistance of WMA mixtures as compared with that of HMAmixtures by using a simplified VECD approach.
Two of the mixtures used in the NCHRP Project 9-43 mix designexperiment were used in this study as control mixtures (3). A uni-axial, cyclic, direct tension compression fatigue test was performedon the two control mixtures, as well as on the control mixtures pro-duced, by using three WMA technologies: Advera, Evotherm 3G,and Sasobit. All mixtures were produced by using a PG 64-22 virginbinder. The dosage rate of the Advera was 0.25% by weight of the
Fatigue Evaluation of Warm-Mix Asphalt MixturesUse of Uniaxial, Cyclic, Direct Tension Compression Test
Mohamed Monir Haggag, Walaa S. Mogawer, and Ramon Bonaquist
Warm-mix asphalt (WMA) is the generic term used to refer to a groupof technologies that are used to produce asphalt pavement mixtures attemperatures lower than those of traditional hot-mix asphalt (HMA).One of the potential benefits of WMA is that it provides better fatiguecracking characteristics than does HMA. The lower temperaturesshould reduce the aging of asphalt binders that occur during produc-tion. The reduced aging of asphalt binders should lead to improvedfatigue characteristics of asphalt mixtures. The research reported hereaddressed two main objectives. The first was to study the impacts ofthree WMA technologies on the fatigue cracking resistance of HMA byusing one asphalt binder and two aggregate sources. The fatigue char-acteristics were measured by using a uniaxial, cyclic, direct tension com-pression test. The second objective was to analyze the data produced bythe test by using the simplified viscoelastic continuum damage approachproposed in the NCHRP 9-43 Phase I report. Three WMA technologieswere used: Advera, Evotherm 3G, and Sasobit. All mixtures were pro-duced by using a PG 64-22 virgin binder. Data showed no significant dif-ference between HMA mixtures and WMA mixtures for each mix exceptfor the Advera.
Warm-mix asphalt (WMA) refers to a group of technologies that isused to produce asphalt pavement mixes at temperatures lower thanthose of traditional hot-mix asphalt (HMA) (1). Many new tech-nologies are now in use (e.g., foaming, organic, and chemical WMAtechnologies) and more may be coming soon in the asphalt pave-ment market. European countries that have used WMA technolo-gies for a few years cite numerous economical, environmental,and potential mechanical advantages of the WMA over HMA andcold asphalt mixtures (2). In the United States, state agencies havefocused their efforts on the development of standard specificationsfor the use of WMA technologies. To assist in the endeavor, a stan-dard WMA mix design is needed. NCHRP has developed Project 9-43 to address the issue of having a standard mix design procedurefor WMA (3).
M. M. Haggag, Department of Civil and Environmental Engineering, Highway Sus-tainability Research Center, University of Massachusetts, Dartmouth, 151 Mar-tine Street, Room 131, Fall River, MA 02723. W. S. Mogawer, Department ofCivil and Environmental Engineering, Highway Sustainability Research Center,University of Massachusetts, Dartmouth, 285 Old Westport Road, North Dart-mouth, MA 02747. R. Bonaquist, Advanced Asphalt Technologies, LLC, 108Powers Court, Suite 100, Sterling, VA 20166. Corresponding author: W. S.Mogawer, [email protected].
Transportation Research Record: Journal of the Transportation Research Board,No. 2208, Transportation Research Board of the National Academies, Washington,D.C., 2011, pp. 26–32.DOI: 10.3141/2208-04
mixture. The remaining technologies were dosed by the weight ofbinder in the mixture. The Evotherm 3G dose was 0.5%, and forSasobit it was 1.5%.
The control HMA mixtures were prepared at the recommendedviscosity-based mixing and compaction temperatures (320°F and310°F). WMA mixtures were prepared at the midpoint of the tem-peratures used in the mix design experiment of NCHRP Project 9-43 (250°F and 240°F). All produced samples were long-term,oven-aged, according to AASHTO R30, to simulate the effect oflong-term aging. Continuum damage theory was used to charac-terize the fatigue resistance of the eight mixtures. Analysis of vari-ance was used to decide whether or not there were significantperformance differences between the WMA and HMA mixtures.Table 1 is a summary of the two mixtures used in the proposedstudy.
REDUCED CYCLES ANALYSES PROCEDURE
Data from the uniaxial, cyclic, direct tension compression fatiguetest were analyzed by using the concept of reduced cycles andeffective strain, which Christensen and Bonaquist developed (6).The main aim of the proposed approach was to get plots of theratio of damaged modulus to the undamaged modulus as a func-tion of the damage parameter S collapse by choosing the appro-priate value for the continuum damage constant α. Reducedcycles could be calculated accurately and without the integrationprocesses that might be difficult for many practicing engineers. Itcan be shown theoretically that reduced cycles are equivalent to thecontinuum damage parameter S (3). Reduced cycles are defined byEquation 1:
Haggag, Mogawer, and Bonaquist 27
where
NR = reduced cycles;NR-ini = initial value of reduced cycles, prior to the selected
loading period;N = actual loading cycles;fo = reference frequency (10 Hz suggested);f = actual test frequency;
�E*�LVE = undamaged [linear viscoelastic (LVE)] dynamic mod-ulus under given conditions, lb/in.2;
�E*�LVE/o = reference initial (LVE) dynamic modulus, lb/in2 (theLVE modulus at 20°C is suggested);
α = continuum damage material constant with a typical valueof about 2.0;
N N Nf
f
E
ER Ro
o
E
= + ⎛⎝⎜
⎞⎠⎟
⎛
⎝⎜
⎞
⎠⎟-ini
LVE
LVE
*
*
2α
�
��EE
o
TT
⎛⎝⎜
⎞⎠⎟ ⎛
⎝⎜⎞⎠⎟
⎡
⎣
⎢⎢⎢
⎤
⎦
⎥⎥⎥
21
1α
α( )
HighAbsorptionAggregates
LowAbsorptionAggregates
1) No WMA (Control)2) 0.25% Advera3) 1.5% Sasobit4) 0.5% Evotherm 3G
Warm MixAsphalt(WMA)
Technology
9.5 mmMixtureDesign
DesignGyrations
Ndesign = 75
DesignGyrations
Ndesign = 100
PG64-22Virgin Binder
Fatigue TestUniaxial Cyclic DirectTension-Compression
Test
Data AnalysisSimplified ViscoelasticContinuum Damage -
Reduced Cycles &Effective Strain
Compare FatiguePerformance of WMA
and HMA Mixtures
FIGURE 1 Experimental plan.
TABLE 1 Design Properties for Fatigue Mixtures
Control ControlProperty Mixture 1 Mixture 2
Mix number 4 6
Design gyrations 75 100
Aggregate water absorption (%) 1.6 1.3
RAP No No
NMAS (mm) 9.5 9.5
Aggregate sourceCoarse PA gravel VA diabaseFine PA limestone VA diabase
PA gravel Natural sandRAP None None
GradationSieve size (mm)
12.5 100a 100a
9.5 98a 98a
4.75 63a 53a
2.36 44a 40a
1.18 32a 31a
0.6 22a 22a
0.3 12a 12a
0.15 5a 7a
0.075 3.0a 4.8a
Aggregate property (%)FAA 43.5 48.3CAA 98/95b 100/100b
Flat and elongated 7.4 7.6Sand equivalent 80.2 76.7
Binder content (wt %) 6.3 5.7
Effective binder content (wt %) 5.3 4.7
Air voids (vol %) 4.3 3.7
Voids in mineral aggregate (vol %) 16.3 15.1
Effective binder content (vol %) 12.0 11.4
Voids filled with asphalt (%) 73.6 75.5
Dust-to-effective-asphalt ratio 0.6 1.0
NOTE: PA = Pennsylvania, VA = Virginia, RAP = reclaimed asphalt pavement,NMAS = nominal maximum aggregate sizes, CAA = coarse aggregate angular-ity, FAA = fine aggregate angularity.aPercent passing sieve.bNumbers indicate that 98% (100%) of CAA has one or more fractured facesand 95% (100%) has two or more fractured faces.
�E = effective applied strain level, applied strain minus theendurance limit strain;
�oE = reference effective strain level (0.0002 suggested); and
= shift factor at test temperature T relative to referencetemperature To.
The use of the concept of reduced cycles and effective strain isaccompanied by many advantages compared with other continuumdamage approaches (3). Here are some of the advantages:
1. Reduced cycles are shown to be theoretically equivalent to thecontinuum damage parameter S.
2. Reduced cycles can be calculated accurately by using the pre-viously discussed equation.
3. Numerical integration is avoided, and assumptions are usedthat concern the relationship between damage ratio C and S.
4. The concept of reduced cycles is much easier for many prac-ticing engineers to understand.
5. The outcome of the proposed approach can be used for directfatigue performance comparisons between asphalt mixtures.
6. The proposed analysis provides information on the endurancelimits of mixtures tested.
The following procedure describes the analysis of uniaxial fatiguedata by using continuum damage, reduced cycles, and an effectivestrain approach (3). The same procedure was followed in this study.
1. Choose the reference conditions. A strain of 0.000200, peak topeak, and a temperature of 68°F (20°C) are suggested to be used asreference strain and temperature values, respectively. The undam-aged modulus or LVE modulus at 68°F (20°C) should be used as thereference modulus. A frequency of 10 Hz should be used as the ref-erence frequency (most commonly used frequency in fatigue tests).
2. Determine time–temperature shift factors through the mastercurves that resulted from performance of dynamic modulus on twosamples that were produced by using the target mix.
3. Test a total of four to eight samples by using the uniaxial push–pull test, with two to four samples at both 39.2°F (4°C) and 68°F(20°C). Different temperatures can be used, although some difficul-ties might arise from the use of higher or lower temperatures andstrains and the running of the proposed analysis.
4. Calculate C and the reduced cycles for each test with the aid ofa spreadsheet. C can be calculated by using Equation 2:
where �E*�n is damaged modulus at cycle n.Reduced cycles can be used with Equation 1. A value of two can
be used for the continuum damage constant α and an endurancelimit strain of zero. Variation of strain values during the test can becompensated for by splitting the data into segments, and by calcu-lating reduced cycles for each segment separately. Add this value tothe value preceding it.
The LVE modulus can be estimated by visual examination of aplot of �E*� as a function of loading cycles at the lowest tested strainlevel. The estimated LVE modulus should be within a few percentagepoints of the highest observed value.
In some cases, macro damage (localization) might take place. Theproposed continuum damage approach is not applicable after the
CE
En=
*
*( )
LVE
2
α T
To
⎛⎝⎜
⎞⎠⎟
28 Transportation Research Record 2208
localization point. During the test, the modulus should decreasesmoothly otherwise. Data after macro damage should be discardedfrom the analysis.
5. Fit Equation 3 to the C versus NR data.
where K1 = cycles to 50% damage (the fatigue half-life) and K2 = fitting parameter.
Linear regression can be used for the fitting by performing alogarithmic transformation of Equation 3 to produce the following:
where A = −K2 (ln K1) and B = K2.While the proposed continuum damage approach is applied at low
strains, the measured sample modulus can approach the LVE, whichcauses noisy data when Equation 4 is used. A weighted, least-squares approach to linear regression should be used for this reason,with a weight of NR
0.5. With this approach, little weight is given todata with little or no damage, while more weight is given to data pointsthat present more damage. Less-weight data will have negligible effecton function that relates C and NR and, also, better distribution of theresiduals.
6. Use trial and error, and keep the continuum damage constantα at 2.00, to adjust the endurance limit strain for the data at 68°F(20°C) until the R2 value for the regression is maximized. Thenadjust the endurance limit strain value for the data at 39.2°F(4°C); again, until the R2 value for the regression is maximized.It is recommended not to change the value of α to decrease the number of variables. If all trials did not result in complete convergence, try other α values, which might result in completeconvergence.
7. Determine the value of the fatigue half-life K1 and appropriatelimits; ±2-s limits are suggested for standard presentation of data.The fatigue response of two materials for which these confidencelimits do not overlap should be considered statistically different.This is a conservative approach.
A proposed standard practice for continuum damage fatigueanalysis, on the basis of the improved procedure, was developedunder the Asphalt Research Consortium. It included a document inthe form of an AASHTO standard practice and an accompanyingMicrosoft Excel workbook to perform the analysis.
RESULTS AND DATA ANALYSIS
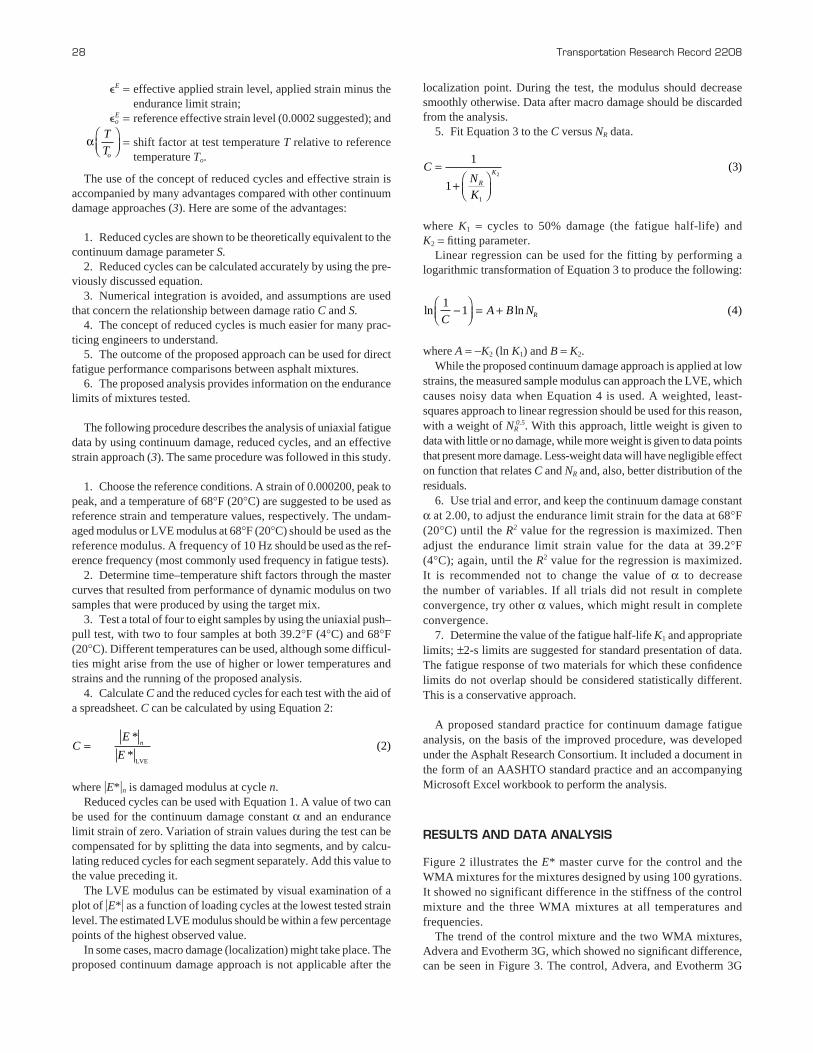
Figure 2 illustrates the E* master curve for the control and theWMA mixtures for the mixtures designed by using 100 gyrations.It showed no significant difference in the stiffness of the controlmixture and the three WMA mixtures at all temperatures and frequencies.
The trend of the control mixture and the two WMA mixtures,Advera and Evotherm 3G, which showed no significant difference,can be seen in Figure 3. The control, Advera, and Evotherm 3G
ln ln ( )1
1 4C
A B NR−⎛⎝⎜
⎞⎠⎟
= +
CNK
R
K=
+ ⎛⎝⎜
⎞⎠⎟
1
1
3
1
2( )
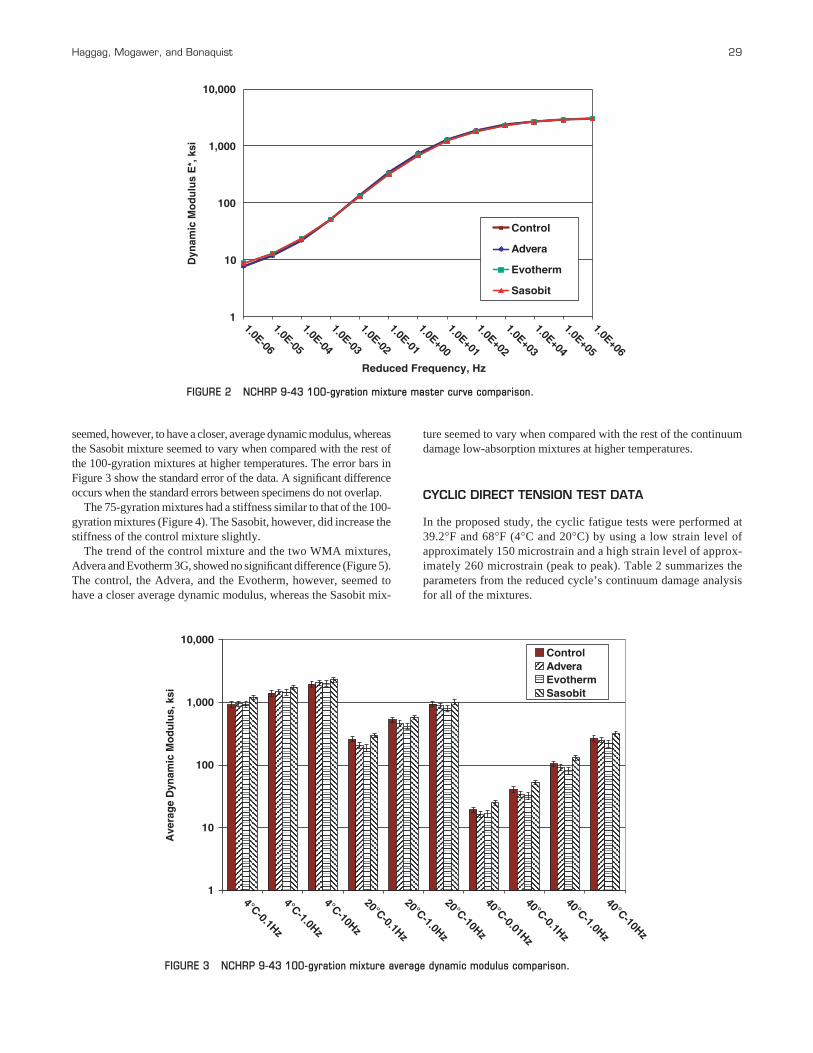
seemed, however, to have a closer, average dynamic modulus, whereasthe Sasobit mixture seemed to vary when compared with the rest ofthe 100-gyration mixtures at higher temperatures. The error bars inFigure 3 show the standard error of the data. A significant differenceoccurs when the standard errors between specimens do not overlap.
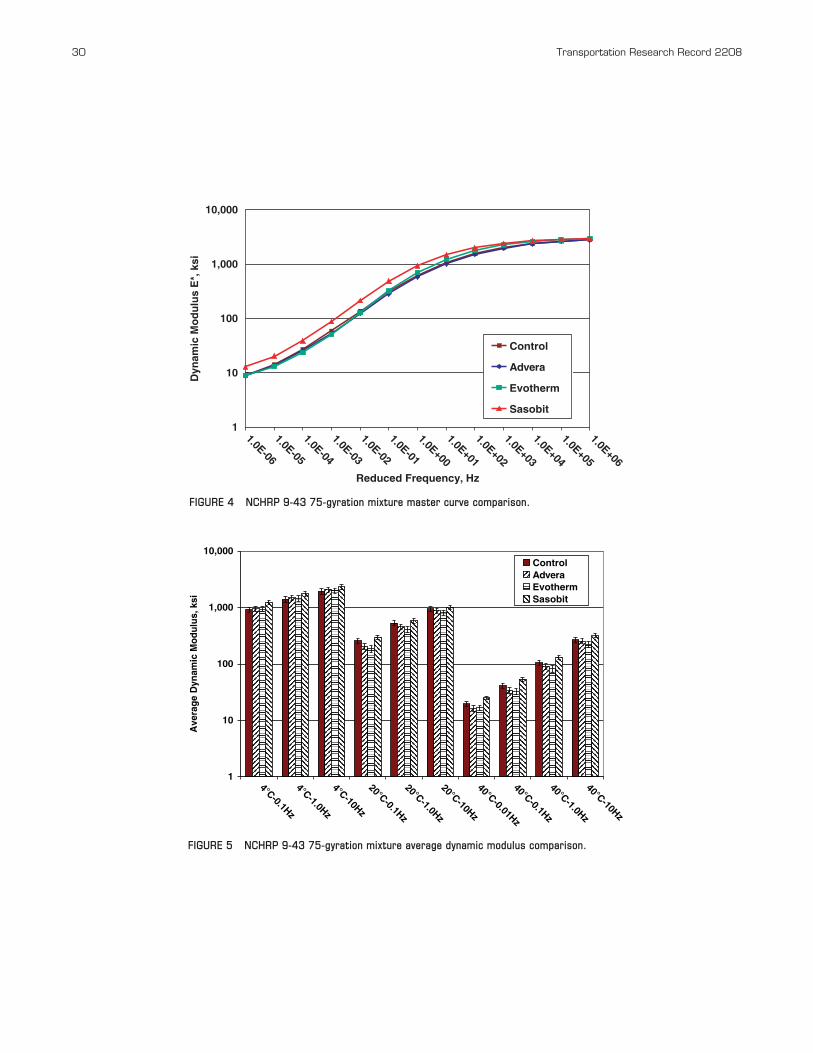
The 75-gyration mixtures had a stiffness similar to that of the 100-gyration mixtures (Figure 4). The Sasobit, however, did increase thestiffness of the control mixture slightly.
The trend of the control mixture and the two WMA mixtures,Advera and Evotherm 3G, showed no significant difference (Figure 5).The control, the Advera, and the Evotherm, however, seemed tohave a closer average dynamic modulus, whereas the Sasobit mix-
Haggag, Mogawer, and Bonaquist 29
ture seemed to vary when compared with the rest of the continuumdamage low-absorption mixtures at higher temperatures.
CYCLIC DIRECT TENSION TEST DATA
In the proposed study, the cyclic fatigue tests were performed at39.2°F and 68°F (4°C and 20°C) by using a low strain level ofapproximately 150 microstrain and a high strain level of approx-imately 260 microstrain (peak to peak). Table 2 summarizes theparameters from the reduced cycle’s continuum damage analysisfor all of the mixtures.
1
10
100
1,000
10,000
1.0E-06
1.0E-05
1.0E-04
1.0E-03
1.0E-02
1.0E-01
1.0E+00
1.0E+01
1.0E+02
1.0E+03
1.0E+04
1.0E+05
1.0E+06
Reduced Frequency, Hz
Dyn
amic
Mo
du
lus
E*,
ksi
Control
Advera
Evotherm
Sasobit
FIGURE 2 NCHRP 9-43 100-gyration mixture master curve comparison.
1
10
100
1,000
10,000
4°C-0.1Hz
4°C-1.0Hz
4°C-10Hz
20°C-0.1Hz
20°C-1.0Hz
20°C-10Hz
40°C-0.01Hz
40°C-0.1Hz
40°C-1.0Hz
40°C-10Hz
Ave
rag
e D
ynam
ic M
od
ulu
s, k
si
ControlAdveraEvothermSasobit
FIGURE 3 NCHRP 9-43 100-gyration mixture average dynamic modulus comparison.
30 Transportation Research Record 2208
1.0E-06
1.0E-05
1.0E-04
1.0E-03
1.0E-02
1.0E-01
1.0E+00
1.0E+01
1.0E+02
1.0E+03
1.0E+04
1.0E+05
1.0E+06
Reduced Frequency, Hz
Control
Advera
Evotherm
Sasobit
1
10
100
1,000
10,000D
ynam
ic M
od
ulu
s E
*, k
si
FIGURE 4 NCHRP 9-43 75-gyration mixture master curve comparison.
ControlAdveraEvothermSasobit
1
10
100
1,000
10,000
4°C-0.1Hz
4°C-1.0Hz
4°C-10Hz
20°C-0.1Hz
20°C-1.0Hz
20°C-10Hz
40°C-0.01Hz
40°C-0.1Hz
40°C-1.0Hz
40°C-10Hz
Ave
rag
e D
ynam
ic M
od
ulu
s, k
si
FIGURE 5 NCHRP 9-43 75-gyration mixture average dynamic modulus comparison.
Haggag, Mogawer, and Bonaquist 31
0.2
0.4
0.6
0.8
1.0
1 10 100 1,000 10,000
Reduced Cycles
|E*|
/|E*|
LV
E
Control
Advera
Evotherm
Sasobit
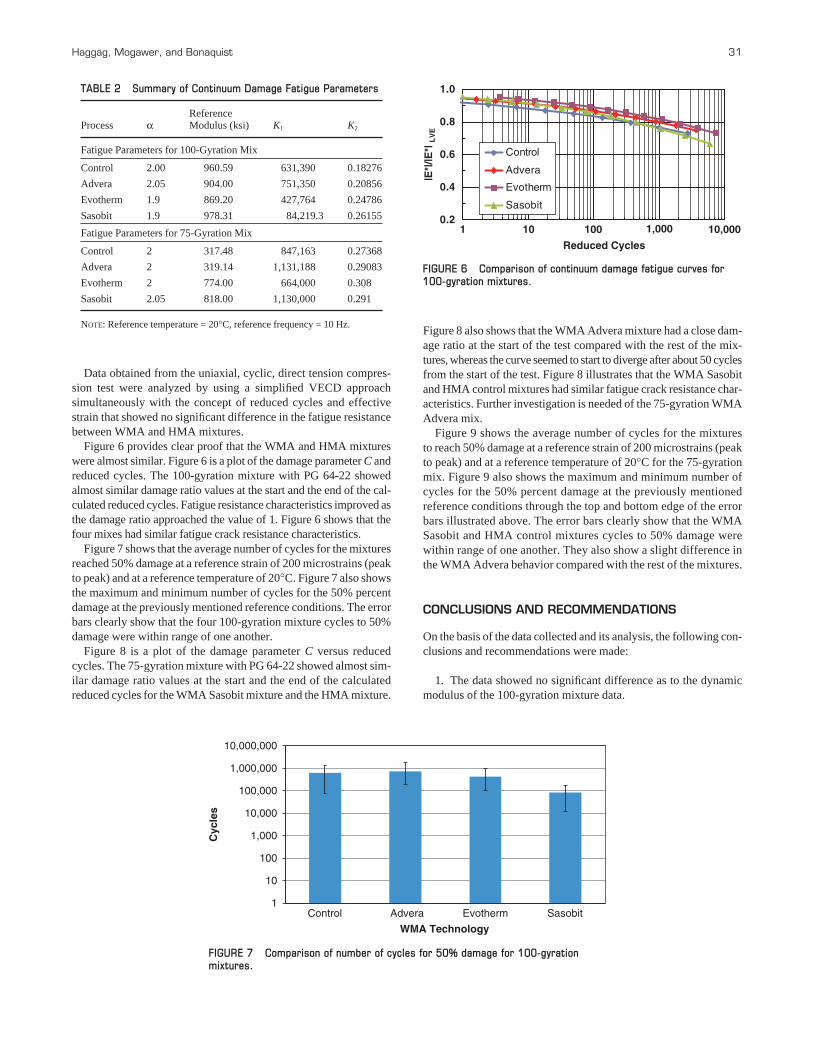
FIGURE 6 Comparison of continuum damage fatigue curves for100-gyration mixtures.
Data obtained from the uniaxial, cyclic, direct tension compres-sion test were analyzed by using a simplified VECD approachsimultaneously with the concept of reduced cycles and effectivestrain that showed no significant difference in the fatigue resistancebetween WMA and HMA mixtures.
Figure 6 provides clear proof that the WMA and HMA mixtureswere almost similar. Figure 6 is a plot of the damage parameter C andreduced cycles. The 100-gyration mixture with PG 64-22 showedalmost similar damage ratio values at the start and the end of the cal-culated reduced cycles. Fatigue resistance characteristics improved asthe damage ratio approached the value of 1. Figure 6 shows that thefour mixes had similar fatigue crack resistance characteristics.
Figure 7 shows that the average number of cycles for the mixturesreached 50% damage at a reference strain of 200 microstrains (peakto peak) and at a reference temperature of 20°C. Figure 7 also showsthe maximum and minimum number of cycles for the 50% percentdamage at the previously mentioned reference conditions. The errorbars clearly show that the four 100-gyration mixture cycles to 50%damage were within range of one another.
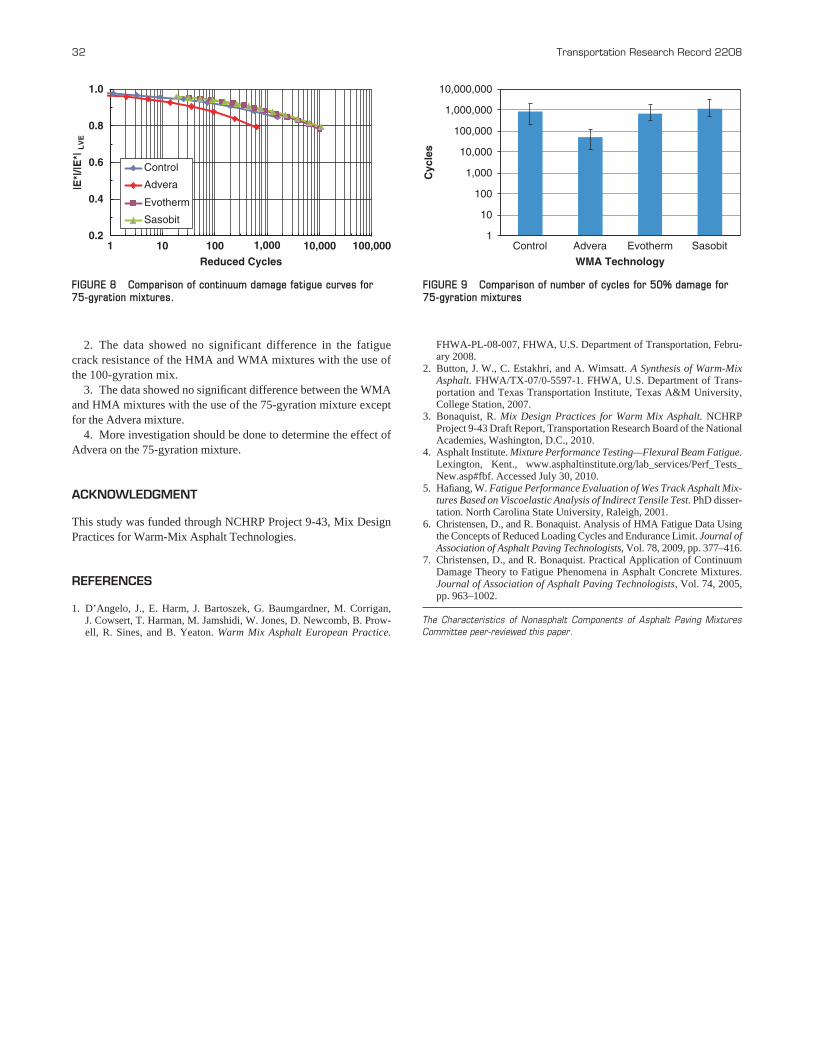
Figure 8 is a plot of the damage parameter C versus reducedcycles. The 75-gyration mixture with PG 64-22 showed almost sim-ilar damage ratio values at the start and the end of the calculatedreduced cycles for the WMA Sasobit mixture and the HMA mixture.
TABLE 2 Summary of Continuum Damage Fatigue Parameters
ReferenceProcess α Modulus (ksi) K1 K2
Fatigue Parameters for 100-Gyration Mix
Control 2.00 960.59 631,390 0.18276
Advera 2.05 904.00 751,350 0.20856
Evotherm 1.9 869.20 427,764 0.24786
Sasobit 1.9 978.31 84,219.3 0.26155
Fatigue Parameters for 75-Gyration Mix
Control 2 317.48 847,163 0.27368
Advera 2 319.14 1,131,188 0.29083
Evotherm 2 774.00 664,000 0.308
Sasobit 2.05 818.00 1,130,000 0.291
NOTE: Reference temperature = 20°C, reference frequency = 10 Hz.Figure 8 also shows that the WMA Advera mixture had a close dam-age ratio at the start of the test compared with the rest of the mix-tures, whereas the curve seemed to start to diverge after about 50 cyclesfrom the start of the test. Figure 8 illustrates that the WMA Sasobitand HMA control mixtures had similar fatigue crack resistance char-acteristics. Further investigation is needed of the 75-gyration WMAAdvera mix.
Figure 9 shows the average number of cycles for the mixturesto reach 50% damage at a reference strain of 200 microstrains (peakto peak) and at a reference temperature of 20°C for the 75-gyrationmix. Figure 9 also shows the maximum and minimum number ofcycles for the 50% percent damage at the previously mentionedreference conditions through the top and bottom edge of the errorbars illustrated above. The error bars clearly show that the WMASasobit and HMA control mixtures cycles to 50% damage werewithin range of one another. They also show a slight difference inthe WMA Advera behavior compared with the rest of the mixtures.
CONCLUSIONS AND RECOMMENDATIONS
On the basis of the data collected and its analysis, the following con-clusions and recommendations were made:
1. The data showed no significant difference as to the dynamicmodulus of the 100-gyration mixture data.
1
10
100
1,000
10,000
100,000
1,000,000
10,000,000
Control Advera Evotherm Sasobit
WMA Technology
Cyc
les
FIGURE 7 Comparison of number of cycles for 50% damage for 100-gyrationmixtures.
2. The data showed no significant difference in the fatiguecrack resistance of the HMA and WMA mixtures with the use ofthe 100-gyration mix.
3. The data showed no significant difference between the WMAand HMA mixtures with the use of the 75-gyration mixture exceptfor the Advera mixture.
4. More investigation should be done to determine the effect ofAdvera on the 75-gyration mixture.
ACKNOWLEDGMENT
This study was funded through NCHRP Project 9-43, Mix DesignPractices for Warm-Mix Asphalt Technologies.
REFERENCES
1. D’Angelo, J., E. Harm, J. Bartoszek, G. Baumgardner, M. Corrigan, J. Cowsert, T. Harman, M. Jamshidi, W. Jones, D. Newcomb, B. Prow-ell, R. Sines, and B. Yeaton. Warm Mix Asphalt European Practice.
32 Transportation Research Record 2208
FHWA-PL-08-007, FHWA, U.S. Department of Transportation, Febru-ary 2008.
2. Button, J. W., C. Estakhri, and A. Wimsatt. A Synthesis of Warm-MixAsphalt. FHWA/TX-07/0-5597-1. FHWA, U.S. Department of Trans-portation and Texas Transportation Institute, Texas A&M University,College Station, 2007.
3. Bonaquist, R. Mix Design Practices for Warm Mix Asphalt. NCHRPProject 9-43 Draft Report, Transportation Research Board of the NationalAcademies, Washington, D.C., 2010.
4. Asphalt Institute. Mixture Performance Testing—Flexural Beam Fatigue.Lexington, Kent., www.asphaltinstitute.org/lab_services/Perf_Tests_New.asp#fbf. Accessed July 30, 2010.
5. Hafiang, W. Fatigue Performance Evaluation of Wes Track Asphalt Mix-tures Based on Viscoelastic Analysis of Indirect Tensile Test. PhD disser-tation. North Carolina State University, Raleigh, 2001.
6. Christensen, D., and R. Bonaquist. Analysis of HMA Fatigue Data Usingthe Concepts of Reduced Loading Cycles and Endurance Limit. Journal ofAssociation of Asphalt Paving Technologists, Vol. 78, 2009, pp. 377–416.
7. Christensen, D., and R. Bonaquist. Practical Application of ContinuumDamage Theory to Fatigue Phenomena in Asphalt Concrete Mixtures.Journal of Association of Asphalt Paving Technologists, Vol. 74, 2005,pp. 963–1002.
The Characteristics of Nonasphalt Components of Asphalt Paving MixturesCommittee peer-reviewed this paper.
1
10
100
1,000
10,000
100,000
1,000,000
10,000,000
Control Advera Evotherm Sasobit
WMA Technology
Cyc
les
FIGURE 9 Comparison of number of cycles for 50% damage for75-gyration mixtures
Control
Advera
Evotherm
Sasobit
0.2
0.4
0.6
0.8
1.0
1 10 100 1,000 100,00010,000
Reduced Cycles
|E*|
/|E*|
LV
E
FIGURE 8 Comparison of continuum damage fatigue curves for 75-gyration mixtures.