Embed Size (px)
Citation preview

FATIGUE BEHAVIOR OF WELDED AND MECHANICAL SPLICES
IN REINFORCING STEEL
FINAL REPORT
Prepared for National Cooperative Highway Research Program
Transportation Research Board National Research Board
C. Paulson and J.M. Hanson Wiss, Janney, Elstner Associates, Inc.
Chicago and Northbrook, Illinois
December 1991


Acknowledgement
· . This work was sponsored by the Americal1 Associatfon of State Highway and Transportation Officials~ ··in cooperatiollt with the Federal Highway AdJl1illistration, ·and was conducted in the National C:ooperative Highway :R~earch Progranr which Js . a<lmini$~ered by the Transportation Research .Board Oft:h~ NationaJ, Research Council/ · · ·
Disclaimer
This copy is an uncorrected draft as . submitted by the research agency. A decision concerning acceptance by the Transportation Research Board, and
.· publicati~nfathe regular NCHRP series Willriotbe made until a complete technical review· has been made and discussed with the researchers. Tiie opinions and conclusions expressed or implied iil the report are those of the research agency. They are not necessarily those of the Transportation Research Board, the National Research Council, the Federal Highway Administration, the American · Association of State Highway and Transportation Officials, or of the individual states participating in the National Cooperative Highway Research Program.


CONTENTS
LIST OF FIGURES . . . . . . . . . . . . . . . . . . . . . . . . . . . . . . . . . . . . . . . . . . . . . . . . . . . . . . . . . u
LIST OF TABLES . . . . . . . . . . . . . . . . . . . . . . . . . . . . . . . . . . . . . . . . . . . . . . . . . . . . . . . . . . iv
ACKNOWLEDGMENTS.................................................... vi
ABSTRACT . . . . . . . . . . . . . . . . . . . . . . . . . . . . . . . . . . . . . . . . . . . . . . . . . . . . . . . . . . . . . . . vi
SUMMARY .............................................................. 1
CHAPTER ONE - INTRODUCTION AND RESEARCH APPROACH . . . . . . . . . . . . . . . . . . 2 Background Research Approach Supplemental Testing Program
CHAPTER TWO - FINDINGS . . . . . . . . . . . . . . . . . . . . . . . . . . . . . . . . . . . . . . . . . . . . . . . 12 Literature Review Experimental Investigation Statistical Analyses Discussion of Results
CHAPTER THREE - INTERPRETATION AND APPLICATION ..................... 29 Design Factors Affecting the Fatigue Performance of Splices Other Factors Affecting the Fatigue Performance of Splices Development of a Design Provision for Fatigue Suggested Revisions to the AASHTO Specifications Pertaining to Fatigue Design of Splices Commentary on the Suggested Specification for Fatigue Design Considerations for Fatigue Testing of Splices and Analysis of Data
CHAPTER FOUR - CONCLUSIONS AND RECOMMENDATIONS . . . . . . . . . . . . . . . . . . 42 Conclusions Regarding Fatigue Behavior of Reinforcing Bar Splices Recommendations for Future Research Concluding Remarks
REFERENCES ........................................................... 45
APPENDIX A - REVIEW OF LITERATURE . . . . . . . . . . . . . . . . . . . . . . . . . . . . . . . . . . . A-1
APPENDIX B - EXPERIMENTAL INVESTIGATION . . . . . . . . . . . . . . . . . . . . . . . . . . . . B-1
APPENDIX C - ANALYSIS OF TEST RESULTS . . . . . . . . . . . . . . . . . . . . . . . . . . . . . . . . C-1

LIST OF FIGURES
Fig. 1 - Representative S-N curve for steel reinforcing bars 3 Fig. 2a - Representative splices from the experimental investigation: non-threaded mechanical
connectors 5 Fig. 2b - Representative splices from the experimental investigation: threaded mechanical
connectors 5 Fig. 2c - Representative splices from the experimental investigation: welded splices 6 Fig. 3 - View of an air test setup 9 Fig. 4 - View of a beam test setup 10 Fig. 5 - Representative splice fatigue test data from published literature 13 Fig. 6 - Fatigue test data for conventional lapped bar splices 15 Fig. 7a - Fatigue test data: No. 5 bars and splices 19 Fig. 7b - Fatigue test data: No. 5 bars and splices (continued) 19 Fig. 7c - Fatigue test data: No. 8 bars and splices 20 Fig. 7d - Fatigue test data: No. 8 bars and splices (continued) 20 Fig. 8 - Mean fatigue limits at 5 million cycles 23 Fig. 9 • Lower 95-percent tolerance limits at 5 million cycles 23 Fig. 10 - Effect of misalignment on mean fatigue limits 24 Fig. 11 • Comparison of fatigue test data for cold-swaged coupling sleeves 28 Fig. 12 - Comparison of fatigue test data for taper-threaded couplers 28 Fig. 13 - Comparison of lower 95-percent tolerance limits with AASHTO fatigue categories 32 Fig. 14 - Comparison of lower 95-percent tolerance limits with proposed splice fatigue
categories 32 Fig. 15 - Sample calculation for analysis of staircase data 40 Fig. A·l - Reference fatigue lines for Grade 60, No. 8 unspliced North American reinforcing
bars A-12 Fig. A-2 - Cold-swaged steel coupling sleeves tested in air at 7 ksi minimum stress Fig. A-3 - Cold-swaged steel coupling sleeves tested in beams at 10 ksi minimum stress Fig. A-4 - Cold-swaged steel coupling sleeves tested in beams Fig. A-5 - Cold-swaged steel coupling sleeves tested in air at 18 ksi minimum stress
A-12 A-13 A-13 A-14
Fig. A-6 • Grout-filled coupling sleeves tested in air (Japanese tests) A-14 Fig. A-7 • Grout-filled coupling sleeves tested in air (North American tests) A-15 Fig. A-8 - Integrally-forged couplers with upset threads, 12 mm (1/2 in.) diameter, tested in air A-15 Fig. A-9 ·Integrally-forged couplers with upset threads, 25 mm (1 in.) diameter, tested in air A-16 Fig. A-10 - Straight-threaded sleeves tested in beams A-16 Fig. A-11 - Taper-threaded couplers tested in beams A-17 Fig. A-12 ·Comparison of mean fatigue life for various weld joint types for a stress cycle of 2 to
28 ksi A-17 Fig. A-13 - Direct butt 60 degree single-V groove welds tested in air at -17 ksi (compression)
minimum stress A-18 Fig. A-14 - Direct butt 60 degree single-V groove weld splices tested in air at 2 ksi minimum
stress A-18 Fig. A-15 - Direct butt 60 degree single-V groove weld splices tested in air at 20 ksi minimum
stress A-19 Fig. A-16 • Direct butt 60 degree single-V groove weld splices tested in beams at an average
minimum stress of 4 ksi A-19 Fig. A-17 ·Comparison of data for direct butt 60 degree single-V groove weld splices tested with
varying specimen type A-20 Fig. A-18 - Comparison of data for gas pressure welded splices with varying weld bulge size A-20
11

Fig. A-19 - Range of estimated fatigue limit at 2 million cycles for various welded joints in a cold-twisted, deformed bar A-21
Fig. A-20 • Conventional lapped bar splices tested in beams A-21 Fig. B-1 ·Details of socket grip B-31 Fig. B-2 - Schematic diagram of typical air test specimen B-32 Fig. B-3 - Test setup for axial tension tests in air B-33 Fig. B-4 • Test data from first pilot test series B-34 Fig. B-5 • Test data for unspliced specimens from both groups of pilot tests B-34 Fig. B-6a - Cold-swaged steel coupling sleeve B-35 Fig. B-6b • Two-piece cold-swaged steel coupling sleeve with threaded ends B-35 Fig. B-6c • Grout-filled coupling sleeve B-36 Fig. B-6d - Steel-filled coupling sleeve B-36 Fig. B-6e • Taper-threaded steel coupler B-37 Fig. B-6f ·Straight-threaded coupler with NC thread B-37 Fig. B-6g - Steel coupling sleeve with wedge B-38 Fig. B-6h • Double-lap weld splice B-38 Fig. B-6i ·Single-lap weld splice B-39 Fig. B-7 • Components of misalignment for axial tension specimens B-4D Fig. B-8 - Measurement of offset of bar at splice with respect to an ideal centerline B-41 Fig. B-9 - Details of concrete test beam B-42 Fig. B-10 - Details of beam test setup B-43 Fig. B-11 • Load pattern for concrete test beams tested statically B-44 Fig. B-12 • Load-deformation curves for unspliced reinforcing bar B-45 Fig. B-13 • Comparison of calculated and measured stresses for static test beam containing single
lap welded splice B-46 Fig. B-14a • Fatigue test data for unspliced No. 5 bar B-47 Fig. B-14b • Fatigue test data for unspliced No. 8 bar B-47 Fig. B-15a • Fatigue test data for No. 5, cold-swaged sleeves B-48 Fig. B-15b • Fatigue test data for No. 5, cold-swaged sleeves with epoxy-coated bar B-48 Fig. B-15c - Fatigue test data for No. 5, threaded-swaged sleeves B-48 Fig. B-15d • Fatigue test data for No. 8, threaded-swaged sleeves B-49 Fig. B-15e • Fatigue test data for No. 8, grout-filled sleeves B-49 Fig. B-15f - Fatigue test data for No. 8, steel-filled sleeves B-49 Fig. B-15g • Fatigue test data for No. 8, taper-threaded couplers B-50 Fig. B-15h • Fatigue test data for No. 8, straight-threaded couplers B-50 Fig. B-15i • Fatigue test data for No. 5, wedge-sleeve couplings B-50 Fig. B-15j ·Fatigue test data for No. 8, double-lap welds B-51 Fig. B-15k ·Fatigue test data for No. 5, modified double-lap welds B-51 Fig. B-151 ·Fatigue test data for No. 5, single-lap welds B-51 Fig. B-16 ·Fatigue fractures of No. 8, unspliced bar B-52 Fig. B-17a • Fatigue fractures of No. 5, cold-swaged coupling sleeves B-53 Fig. B-17b ·Fatigue fracture of No. 8, grout-filled coupling sleeve B-53 Fig. B-17c ·Fatigue fractures of No. 8, steel-filled coupling sleeves B-54 Fig. B-17d • Fatigue fracture of No. 5, wedge-sleeve coupling B-54 Fig. B-17e ·Fatigue fractures of No. 8, threaded-swaged sleeves B-55 Fig. B-17f ·Fatigue fracture of No. 8, taper-threaded couplers B-55 Fig. B-17g • Fatigue fractures of No. 8, straight-threaded couplers B-56 Fig. B-17h • Fatigue fractures of No. 8, double-lap welded splices B-56 Fig. B-17i • Fatigue fracture of No. 5, modified double-lap welded splice B-57 Fig. B-17j ·Fatigue fracture of No. 5, single-lap welded splice B-57
ill
Fig. C-la ·Staircase data for unspliced No. 5 bars C-16 Fig. C-lb ·Staircase data for unspliced No. 8 bars C-16 Fig. C-2a ·Staircase data for No. 5, cold-swaged sleeves C-17 Fig. C-2b ·Staircase data for No. 5, cold-swaged sleeves with epoxy-coated bars C-17 Fig. C-2c ·Staircase data for No. 5, threaded-swaged sleeves C-17 Fig. C-2d ·Staircase data for No. 8, threaded-swaged sleeves C-18 Fig. C-2e ·Staircase data for No. 8, grout-filled sleeves C-18 Fig. C-2f ·Staircase data for No. 8, epoxy-coated grout-filled sleeves with epoxy-coated bar C-18 Fig. C-2g ·Staircase data for No. 8, steel-filled sleeves C-19 Fig. C-2h ·Staircase data for No. 8, taper-threaded couplers C-19 Fig. C-2i • Staircase data for No. 8, straight-threaded couplers C-19 Fig, C-2j • Staircase data for No. 5, wedge-sleeve couplings C-20 Fig. C-2k ·Staircase data for No. 8, double-lap welds C-20 Fig. C-21 ·Staircase data for No. 5, modified double-lap welds C-20 Fig. C-2m ·Staircase data for No. 5, single-lap welds C-21 Fig. C-3a • Plot of e vs. N for No. 5, cold-swaged sleeves C-22 Fig. C-3b • Plot of e vs. N for No. 5, cold-swaged sleeves with epoxy-coated bars C-22 Fig. C-3c • Plot of e vs. N for No. 5, threaded-swaged sleeves C-22 Fig. C-3d • Plot of e vs. N for No. 8, threaded-swaged sleeves C-23 Fig. C-3e • Plot of e vs. N for No. 8, grout-filled sleeves C-23 Fig. C-3f • Plot of e vs. N for No. 8, epoxy-coated grout-filled sleeves with epoxy-coated bars C-23 Fig. C-3g • Plot of e vs. N for No. 8, steel-filled sleeves C-24 Fig. C-3h • Plot of e vs. N for No. 8, taper-threaded couplers C-24 Fig. C-3i • Plot of e vs. N for No. 8, straight-threaded couplers C-24 Fig. C-3j • Plot of e vs. N for No. 8, double-lap welds C-25 Fig. C-3k ·Plot of e vs. N for No. 5, modified double-lap welds C-25 Fig. C-4a • S-N plot of finite life data for unspliced No. 5 bars C-26 Fig. C-4b • S-N plot of finite life data for unspliced No. 8 bars C-26 Fig. C-Sa • S-N plot of finite life data for No. 8, taper-threaded couplers C-27 Fig. C-Sb • S-N plot of finite life data for No. 8, double-lap welds C-27
LIST OF TABLES
Table 1 · Arrangement of test program Table 2 ·Average properties of unspliced reinforcing bars Table 3 ·Average properties of splices Table 4 • Fatigue limits at 5 million cycles from staircase analysis Table 5 • Assignment of splice test groups to proposed splice fatigue categories Table 6 • Tolerance limit factors Table B-1 • Bar groups Table B-2 • Splice types Table B-3 • Arrangement of test program Table B-4 • Nominal test beam dimensions Table B-5 • Physical properties of reinforcing bars Table B-6 • Chemistry of reinforcing bars Table B-7 ·Average misalignment of specimens tested in air Table B-8 - Static strength of splices in air Table B-9 - Residual deformation of connectors in air
iv
7 16 17 22 33 41
B-17 B-17 B-18 B-19 B-19 B-19 B-20 B-21 B-22

Table B-10 - Test beam concrete properties Table B-11 - Measured test beam properties Table B-12 - Fatigue data for unspliced bars Table B-13a - Fatigue data for spliced bars Table B-13b - Fatigue data for spliced bars (continued) Table B-13c - Fatigue data for spliced bars (continued) Table B-13d - Fatigue data for spliced bars (concluded) Table B-14a - Location of fatigue fractures for non-threaded mechanical connectors Table B-14b - Location of fatigue fractures for threaded mechanical connectors Table B-14c - Location of fatigue fractures for welded splices Table C-1 - Tolerance limit factors Table C-2 - Summary of staircase analyses, as-tested data Table C-3 - Summary of staircase analyses, adjusted data Table C-4 · Final summary of staircase analyses Table C-5 · Multiple linear regression analyses on long-life failure data Table C-6 • Supplemental regression analyses on long-life failure data Table C-7 • Summary of analyses on long-life data: staircase analysis and regression on failure
B-22 B-22 B-23 B-24 B-25 B-26 B-27 B-28 B-29 B-30
C-9 C-10 C-11 C-11 C-12 C-13
data C-14 Table C-8 - Statistical comparison of mean fatigue limits C-14 Table C-9 • Multiple linear regression analyses on finite-life data C-15 Table C-10 - Best fit s-n lines with slope -0.0407 C-15 Table C-11 ·Estimates of stress range at 500,000 cycles from best fit lines with slope of -0.0407 C-15
v

ACKNOWLEDGMENTS
The research reported herein was performed under NCHRP Project 10-35 by Wiss, Janney, Elstner Associates, Inc. of Northbrook, Illinois, with Materials Research Laboratories, Inc. of Glenwood, Illinois serving as a subcontractor.
Conrad Paulson and John M. Hanson, of Wiss, Janney, Elstner Associates were the principal investigator and co-principal investigator, respectively. The work at Materials Research Laboratories was conducted under the supervision of John E. O'Donnell. Dr. E.J. Ripling of Materials Research Laboratories provided assistance as project advisor. G. Hedien was the principal technician at Wiss, Janney, Elstner Associates during the investigation, and K. O'Donnell was the principal technician at Materials Research Laboratories.
Splices used in the test program were provided by: Barsplice Products, Inc., Dayton, Ohio; Dayton Superior Corp., Miamisburg, Ohio; Erico Products, Inc., Cleveland, Ohio; and Splice Sleeve North America, Inc., Sacramento, California. The assistance of these companies is appreciated.
ABSTRACT
This report presents the findings of a literature review, experimental investigation, and statistical data analysis of the fatigue behavior of welded joints and mechanical connections in reinforcing bars. Approximately 25 different types of common welded and mechanical splices for reinforcing bars were identified in the literature. About 180 fatigue-related tests of mechanical connectors and 100 tests of welded splices were obtained from published and unpublished test reports. The experimental investigation carried out 231 fatigue tests on seven types of mechanical connectors, two welded joint configurations, and two sizes of unspliced bars. Two types of mechanical connectors were each tested in two groups: one group using epoxy-coated bars and the other group using uncoated bars. Most specimens were tested in axial tension in air, but two types of splices with offset bars were tested while embedded in a concrete beam. The majority of the tests were used to determine a fatigue limit at 5 million cycles.
The findings of the study indicate that there is a large variation of fatigue strength with type of splice. The range of the stress cycle is the predominant factor determining the fatigue life of the splice. Under constant-amplitude stress cycles, the data support the view that splices exhibit a fatigue limit stress range below which they will sustain a virtually unlimited number of cycles. Bar size and minimum stress each appear to have a small effect on fatigue behavior. Use of epoxy coated bars was not detrimental to fatigue performance of the particular mechanical connectors tested with both uncoated and epoxy-coated bars. Fatigue design provisions for reinforcing bar splices, suitable for incorporation into the AASHTO Bridge Design Specification, were developed.
vi

SUMMARY
NCHRP PROJECT 10-35: FATIGUE BEHAVIOR OF MECHANICAL AND WELDED SPLICES IN REINFORCING STEEL
Fatigue tests on 231 splices and unspliced bars were carried out. Of the approximately
25 types of splices that are commonly made using mechanical connectors or by
welding, this investigation included seven different mechanical connectors and two
different welded joint configurations. Most specimens were tested in axial tension in
air, but two types of splices with offset bars were tested while encased in a concrete
beam. Two types of splices with epoxy-coated bars were tested.
For any one type of splice subjected to cyclic stresses, the range of the stress
cycle was the predominant factor determining the fatigue life of the splice. A mean
fatigue limit stress range at 5 million cycles was found for each type of splice tested in
the present investigation, and a design fatigue limit for each splice was statistically
derived from the mean fatigue limit. At stress ranges below the design fatigue limit,
the splice can sustain a virtually unlimited number of stress cycles, from a practical
point of view, without fatigue damage.
There is large variability in the design fatigue limit with type of splice. Grout
filled coupling sleeves exhibited the highest fatigue limit. at 21 ksi, while welded splices
and two-piece cold-swaged sleeves with threaded ends exhibited the lowest at about
4 ksi. Grade 60 reinforcing bar commonly has a design fatigue limit greater than
20 ksi. Splicing of epoxy-coated bars with a cold-swaged sleeve or a grout-filled sleeve
was not detrimental to fatigue performance of the splice.
The locations of the fatigue fractures varied with type of splice. Non-threaded
mechanical connectors most often fractured through the reinforcing bar at the end of
the splice, threaded mechanical connectors fractured through the threads at the first
engaged thread, and welded splices through the reinforcing bar at a weld termination.
Some mechanical connectors, however, fractured through the connector itself.
Revisions to the AASHTO specifications were suggested to incorporate fatigue
of splices. Splices were divided into three groups according to minimum design stress
ranges of 18, 12 and 4 ksi. An increase in stress range was allowed for cycles of
loading less than 1 million cycles.
1

CHAPTER ONE
INTRODUCTION AND RESEARCH APPROACH
Background
There are a variety of proprietary mechanical connectors (1,2) and welded joints (2,3) that may be used to make a direct physical connection (i.e., splice) of reinforcing bars in lieu of conventional lapped bar splices. These direct connections are used under many circumstances in new construction, based on economics and practicality. ACI Committee 439 (J) has noted the following situations where mechanical connectors would probably be used instead of conventional lapped bar splices: with No. 14 and No. 18 bars, since lapped splices of bars in these sizes are not permitted by codes; where spacing of bars is insufficient to permit lap splicing; when design requirements for lapped splices result in long lap lengths; in "tension tie members" (J); and at construction joints or joints providing for future construction where it is not desirable to have long lengths of bar projecting from existing construction. Presumably, welded splices could also be used in many of these same situations.
With rehabilitation projects, there are additional circumstances under which a welded joint or a mechanical connector could be more economical than a conventional lapped bar splice. In bridge widening projects, for example, a lesser amount of sound concrete may need to be removed from an existing structure when making a mechanical or welded connection as compared to a conventional lapped bar splice. In staged construction projects, where working room between stages may be limited, mechanical and welded splices can be made in less space than lapped bars splices.
Particularly with bridge rehabilitation construction, it may be desirable to place splices in regions of repeated stress cycles so that removal of sound concrete can be minimized or so that staged construction can be facilitated. For the condition of repeated stress cycles, whether new construction or rehabilitation, the fatigue behavior of splices must be known to ensure the proper serviceability and longevity of the structure.
Many hundreds of fatigue tests have been carried out on (unspliced) reinforcing bar specimens and are reported in the literature. A comprehensive literature review and experimental investigation on fatigue of reinforcing bars has been carried out ( 4). The effects of such parameters as stress range, minimum stress, size of bar, grade of steel and bar deformation geometry have been determined through test programs and statistical studies. These effects can be considered well known. Current bridge design specifications (5) include provisions for fatigue of reinforcing bars.
In comparison to unspliced reinforcing bars, information directly related to the fatigue behavior of mechanical connectors and welded joints is very limited. Fewer than 40 individual tests of mechanical splices and about 100 tests of welded splices are reported in published literature. Unpublished reports reviewed for the research work reported herein include data for about 140 additional tests on mechanical connectors, the majority of which were for one particular device. Considering the variety of connectors and welds suitable for splicing reinforcing bars, the limited amount of fatigue data is particularly surprising. Further, it may be noted that there are no reported in-service fatigue failures of reinforcing bar splices.
A consequence of the limited research on fatigue of reinforcing bar splices is that major U.S. codes and design specifications (3,5,6) do not include comprehensive fatigue design criteria for reinforcing bar splices, whether conventionally lapped bars, welded splices, or mechanical connections. Because it may be advantageous to use mechanical connectors or welds to connect reinforcing bars in regions of repeated stress cycles, the fatigue strength of spliced reinforcing bars could be a significant design consideration.
2

Objective. The objective of this investigation was to evaluate the fatigue behavior of, and develop practical fatigue design guidelines for, welded and mechanical splices for reinforcing bars in bridges. This was accomplished by carrying out the following tasks:
• Reviewing and summarizing available literature. • Developing and carrying out a laboratory fatigue test program. • Evaluating test results and other data obtained from literature. • Developing recommended design guidelines.
Terminology. As used in this report, the term "splice" generally refers to the joining of two reinforcing bars by welding or with a mechanical connector. However, the current AASHTO Specifications (5) refer to welded splices and mechanical connectors, and this terminology is maintained in the development of design guidelines. Commonly-accepted generic names for mechanical connectors (1,2) and welded joints (2,3) are used herein.
A representative curve relating stress range, fr, and fatigue life, N, for reinforcing bars is shown in Fig. 1. This curve, adapted from Reference (4), shows the effect of a constant-amplitude stress range on fatigue life for a constant minimum stress,fmin· Tests on welded and mechanical splices were carried out in both the finite-life and long-life regions in the investigation reported herein.
Low Cycle Region Finite Life
Region Long Life
Region
t = tensile strength k = constant minimum
stress
S-N Curve
Limit-..._ -~---------
Cycles of Loading, N
Fig. 1 - Representative S-N curve for steel reinforcing bars
3

Research Approach
Literature Review. A review of published and unpublished reports on fatigue tests of reinforcing bar splices was carried out. Related literature from domestic and foreign sources was also reviewed, including design specifications, performance test specifications, and reports on high-stress, low cycle tests of spliced reinforcing bars. A full account of the literature review is presented in Appendix A. The findings are summarized in Chapter 2.
Experimental Investigation. Fatigue tests on seven proprietary mechanical connectors and two welded joint configurations were included in this investigation. The test program was carried out so as to permit a statistical evaluation of the constant amplitude stress range below which each type of splice tested could sustain 5 million cycles of loading. A staircase test procedure was used to establish this stress range, which was regarded as the fatigue limit. In one of the staircase test series, the spliced bars were epoxy-coated. A supplemental testing program also studied splices made with epoxy-coated bars. Replicate tests were also carried out on two types of splices at stress ranges intended to cause failures above the fatigue limit. Two sizes of bars were used, No. 5 and No. 8. Unspliced bars of both sizes were also tested in fatigue. A constant minimum stress of 3 ksi was used for all testing.
Since the objective of the investigation was to evaluate the fatigue behavior of reinforcing bar splices, it was desirable to minimize the effect of the reinforcing bar itself as a test variable. This was accomplished by striving to select a bar with above-average fatigue characteristics, and then by fabricating all specimens of a given size from the same lot of reinforcing bar.
Sample reinforcing bars were obtained from four bar producers. Although no direct measurement of bar geometry was attempted, selection of a desirable bar was readily accomplished by visual examination considering both appearance of the geometry at the base of the transverse lugs and at the rolled-on manufacturer's bar mark. Two of the four sample bars exhibited relatively smooth lug geometry. However, the manufacturer's mark on one bar had distinctly smoother features, having a relatively gentle transition from the barrel of the bar to all components of the mark. Bars from this manufacturer were therefore chosen for the test program.
The consideration of the types of splices to be included in the experiment was initially limited to those believed suitable for bridge rehabilitation projects. However, a survey of bridge engineers from ten states conducted as part of the research reported herein indicated a broad interest in mechanical connectors of all types, including connections made with epoxy-coated bar. Therefore, additional types of splices were considered for the experimental program, with the final selections made after the review and approval of the Advisory Panel for this project. A limited number of welded joints were studied in the test program. Representative splices selected for the experimental investigation are shown in Figs. 2a, 2b and 2c.
Two methods of loading were used: axial tension in air and flexural tension while embedded in a concrete beam. The air test method was used when the axes of the bars being joined were collinear after splicing, whereas the beam test method was used for splices where the axes of the bars being joined were offset at the splice location. In order to provide a comparison of similar splices tested both in air and in beams, a modified double-lap weld configuration utilizing No. 5 lap bars and No. 8 main bars was included for testing in air. It was anticipated that the modified double-lap splice would fracture through the No. 5 bars, in a manner similar to that of a No. 5 single-lap weld tested in a beam.
In the experimental investigation reported herein, 200 long-life fatigue tests and 31 finite-life fatigue tests on welded joints, mechanical connectors and unspliced bars were carried out. All of the splices were made using either No. 5 or No. 8, Grade 60 bars. No. 5 bars are commonly used in bridge decks. No. 8 bars may occasionally be used in bridge decks, and they are used extensively in main members.
The majority of the tests were conducted in axial tension in air. Tests in air are more economical than tests on concrete beams. For the axial tension splice specimens tested in air, misalignment of the
4

Fig. 2a · Representative splices from the experimental investigation: non-threaded mechanical connectors
Fig. 2b · Representative splices from the experimental investigation: threaded mechanical connectors
5

Fig. 2c - Representative splices from the experimental investigation: welded splices
joined bars at the splice location was measured as an offset of the longitudinal axis of the splice with respect to that of an ideally straight test specimen. For two splice configurations in which there was an offset between the longitudinal axes of the bars being joined at the splice location, the spliced bars were embedded in a rectangular concrete beam for testing. These beams had a nominal effective depth of 6 in., representative of a bridge deck.
The fatigue tests were arranged as shown in Table 1. Test groups are designated by X if tested in air or by Y if tested in a beam. The groups were formed on the basis of type of splice, bar size and bar coating, for a total of 19 unique groups: four groups of unspliced bars, ten groups of mechanical connectors, and four groups of welded splices. Tests on 15 of the groups were in the long-life region; four were in the finite-life region. The only intended variable within each group was stress range. A nominal minimum stress of 3 ksi was used for each group. As pointed out in the last section of this chapter, the test group on epoxy-coated bars in a grout-filled coupling sleeve was a supplemental testing program carried out using the same procedures as in this investigation, and therefore considered as part of this test program.
Twelve to 16 tests were planned for each long-life group. These tests were intended to give an estimate of the 5 million cycle fatigue limit. A staircase test procedure was used (7,8), which permits a statistical evaluation of the mean fatigue limit.
Six tests were planned for each finite-life group. Groups of unspliced bars, the taper-threaded steel coupler, and the double-lap welded splice were included. The tests were planned to be carried out at two stress range levels and were intended to provide information about finite-life fatigue behavior between 100,000 to 1 million cycles.
All of the No. 5 bars came from a single lot. All of the No. 8 bars also came from a single lot. The supplier of the bars was able to provide epoxy-coated bars from these same lots.
6

TABLE 1 - ARRANGEMENT OF TEST PROGRAM
Splice Type No. 5 Bars No. 8 Bars
Long-Life Finite-Life Long-Life Finite-Life Tests a Testsa Testsa Testsa
Unsnliced Bars x x x x
Mechanical Connectors
Cold-swaged steel coupling sleeve x xb
Two-piece cold-swaged steel x x
coupling sleeve with threaded ends
Grout-filled coupling sleeve x
xb,c
Steel-filled coupling sleeve x
Taper-threaded steel coupler x x
Straight-threaded coupler x
(bar not upset at threads)
Steel coupling sleeve with wedge y
Welded Joints
Double-lap xd xe xe
Single-lap y
Notes: a) X denotes a group tested in air; Y denotes a group tested in beams. b) Fabricated using epoxy-coated bar. c) From supplemental testing program. d) Modified configuration using a No. 8 main bar and No. 5 side bars, where fractures through the
No. 5 side bars were intended to simulate fractures of No. 5 single-lap joints. e) No. 8 main bar with No. 8 side bars, as shown in Fig. 2c. -
Nearly all splice fabrication took place in the laboratory. Outside services were used for cutting threads into bars for threaded couplers. Materials and assembly instructions for the various proprietary mechanical connectors, including any special tools required for assembly, were obtained directly from the connector manufacturer. All proprietary splice producers were invited to provide training for agency personnel in the laboratory; three producers provided such training. Welded splices were fabricated in accordance with A WS Dl.4 (3).
Every attempt was made to fabricate specimens so that the longitudinal axes of the spliced bars were in concentric alignment across the splice; that is, any misalignment of bars in the assembled specimen was minimized. However, no attempt was made to straighten any splice which was noticeably misaligned. Furthermore, misalignment of the bars was measured for each specimen tested in fatigue and was subsequently considered a measured parameter in the test program.
To minimize the effects of personnel, procedures, and equipment, cut lengths of reinforcing bar were randomly assigned to particular test groups, and the order of testing splices within a group was also randomized. Fatigue tests in different splice groups were not randomized across groups because it was frequently necessary to use the test results from one group to guide selection of stress ranges for other groups. However, tests for some groups were intermingled for convenience of test machine scheduling.
7

Within each test group, loads were applied to specimens according to the staircase procedure for the long-life tests, and in a predetermined random order for the finite-life tests. Testing continued until either the specimen fractured in fatigue or the specimen ran out (did not fail) after 5 million cycles.
In a staircase test, the stress range for a given test specimen is dependent upon the result of the test on the preceding specimen. If a given specimen runs out within the designated number of cycles, the following specimen is tested at a higher stress range. Conversely, if the specimen fails before reaching the designated number of cycles, the following specimen is tested at a lower stress range. A 5 million cycle limit for runout and an increment of 1 ksi between successive test stress ranges were chosen for the present investigation, because these values had previously been used in tests of unspliccd reinforcing bar ( 4).
Staircase test sequence having data suitable for analysis was considered to begin with the first sequence of a runout followed by a failure, or a failure followed by a runout. It was anticipated that from one to four specimens would be expended before the first occurrence of a failure-runout or runoutfailure sequence. Staircase testing then was planned to continue for ten additional specimens, giving a total of twelve data points suitable for staircase analysis. Consequently, the actual number of specimens tested in a particular long-life test group varied from 12 to 16. In total, 200 long-life tests were carried out.
Finite-life tests of unspliced bars were initially planned for stress ranges of 32.5 ksi and 40.0 ksi. Based on previous research on fatigue of unspliced bars (4), fatigue lives in the range of 100,000 to 1 million cycles were anticipated for specimens tested at these stress ranges. However, unspliced bars of both sizes tested at 32.5 ksi frequently had fatigue lives greater than 1 million cycles, indicating that this stress range approached the long-life region of the fatigue curve. Additional tests of unspliced bars in both sizes were therefore scheduled at a stress range of 47.5 ksi to provide a second stress range distinctly in the finite-life portion of the fatigue curve. Some adjustment in the planned finite-life stress ranges for spliced specimens was also necessary. The taper-threaded couplers were tested at 40.0 and 47.5 ksi stress ranges, whereas the double-lap welds were tested at 32.5 and 40.0 ksi stress ranges. A total of 31 finite-life tests were carried out.
For most specimens, the axes of the bars being joined were intended to be collinear after splicing. It was planned that the fatigue tests of these splices and also the unspliced bars would be carried out in axial tension in air. However, gripping was a concern in other fatigue investigations (9,10) where specimens were tested in air. Therefore, an early task in the research work reported herein was a series of pilot tests carried out to evaluate gripping procedures. The pilot testing showed that a grout-filled, cylindrical steel socket would be a suitable grip. The cylindrical socket also served as the interface to the test machine. As an added measure to avert fatigue fractures in the grip region, the portion of the reinforcing bar embedded in the grout was treated by shot peening.
For the main test program, all axial fatigue specimens were tested using the grip procedures developed during the pilot tests. Three similar axial test machine setups were available, allowing simultaneous testing of up to three specimens. Loads were applied and controlled by an MTS closedloop, hydraulic servo-control system. Rate of loading was from 18 to 29 Hz for the long-life tests and 5 to 15 Hz for the finite-life tests. An axial tension test machine setup, with a splice specimen attached by the grout-filled sockets, is shown in Fig. 3.
Two of the selected splices were lap joints; that is, the longitudinal axes of the joined bars were offset at the splice location. These splices, the single-lap welded joint and the steel coupling sleeve with wedge, were tested in concrete beams. Each test beam contained a single No. 5, spliced reinforcing bar as the primary reinforcing steel in a 7 ft long rectangular concrete beam having a width of 6 in., an overall height of 8 in., and a nominal effective depth for the reinforcing bar of 6 in. Specimens were tested as simply supported beams on spans of 6 ft-0 in. or 6 ft-8 in., with two equal loads placed nominally at third-points of the span. Shear reinforcing was placed in each shear span. At both ends of a splice, crack formers each consisting of a 1-5/8 in. high piece of thin sheet metal were placed in
8

the bottom of the beam section in order to ensure development of flexural cracks at what were considered likely fracture locations.
Beams were cast in the predetermined random order of testing. Concrete was mixed using Type I portland cement, Eau Claire sand, and Eau Claire normal weight aggregate having a maximum size of 3/4 in. Design compressive strength of the concrete was 5000 psi in 14 days. Slump of the concrete was from 3 to 6 in., and air content was from 3.5 to 6.5 percent. Cylinders for strength testing were taken from the batch placed in the middle of each beam. Concrete was consolidated with a vibrator, and top surfaces were screeded and finished with a float after casting. After forms were stripped, the beams were stored in the laboratory at ambient temperature and humidity.
Two beam test frame setups were available, allowing simultaneous testing of two beams. In both setups, MTS hydraulic, servo-controlled fatigue test machines were used. Cyclic loads were applied at a rate of 5 to 10 Hz. A test setup with a representative test beam is shown in Fig. 4. Deflection of a beam was monitored by an L VDT located at midspan. In selected beams, the reinforcing bar was instrumented with strain gages adjacent to the splice.
Repeated loading for a beam tested in fatigue was intended to start 14 to 30 days after the test beam was cast. Compressive strength and modulus of the test beam concrete were determined on the day that each test was started. The fatigue tests began with an initial static load cycle intended to
Fig. 3 - View of an air test setup
9

develop cracks in the beam. The initial static cracking load cycle was followed by a single static load cycle having the intended minimum and maximum test loads. Midspan deflection was monitored on a strip chart recorder during this cycle. Repeated loading was then initiated, with the servo-controller programmed so that the beam deflection during repeated loading matched the beam deflection observed during the static cycle having the intended test load levels. Periodically, repeated loading was halted, the intended loads again applied statically with midspan deflection monitored on the strip chart, and repeated loading resumed to match the new static deflection. Tests on beams instrumented with strain gages indicated close agreement between strains measured during static and dynamic loading.
At the end of a test on a specimen which fractured in fatigue, the connector or weld and short lengths of adjoining bar were removed from the specimen. Fracture surfaces were coated with a preservative to prevent rusting. Air test specimens which did not fail in fatigue were statically tested in axial tension to failure as part of the process of removing the grip sockets from the test specimen. Beams which ran out after 5 million cycles at the intended stress range were re-tested under a single point load at midspan until a fatigue failure occurred, and then the splice was extracted.
Physical tests were carried out on splice specimens from each test group. Specimens from each test group were tested to static failure in air. Yield strength, tensile strength, and elongation were recorded for unspliced bars; tensile strength and mode of failure were recorded for splices. Static strength tests were also carried out on beam specimens. For representative specimens from the two groups of unspliced bar, the chemical content was analyzed and the bar area was determined by weighing measured lengths of bar.
Residual axial deformation tests were conducted on three to six specimens from each group of mechanical connectors except the wedge-sleeve coupling. The wedge-sleeve splice was excluded because of in-plane rotation due to eccentricity between the axes of the bars being connected. Loads were applied in three stages: an initial load corresponding to a stress in the bar of 3 ksi; a peak load corresponding to a stress of 30 ksi; and a final load corresponding again to a stress of 3 ksi. A pair of
Fig. 4 · View of a beam test setup
10

LVDT's straddling the splice were read at each stage. Residual deformation was computed by taking the difference between the final reading at 3 ksi and the initial reading at 3 ksi.
Detailed descriptions of the experimental program and the test procedures used are given in Appendix B.
Statistical Analysis. Data from the long-life and finite-life fatigue tests were analyzed to obtain estimates of mean fatigue strength and standard deviation of the data. Published and unpublished splice fatigue test data summarized in Appendix A were also considered for inclusion in the data analyses. Data from long-life test groups were used to determine the 5 million cycle fatigue limit by staircase analysis. Measurements of alignment of the specimens tested in air were also analyzed to account for the effects of the measured misalignment or eccentricity of the spliced bars. Two-sided tolerance limits, such that it is 95 percent probable that 95 percent of the data fall between the limits, were determined from the estimates of mean and standard deviation. Data from finite-life test groups were analyzed by linear regression to determine the relationship between stress range and fatigue life in the finite-life region of the S-N curve.
Long-life staircase data were analyzed using two different procedures. The first staircase analysis procedure (8) employed a weighted-average technique for the calculation of the mean, and a quasiempirical technique to estimate the standard deviation. The second procedure ( 4) used a maximum probability approach to simultaneously estimate both the mean and standard deviation. Initial estimates of standard deviation for several groups were outside a range of reliability developed from known limitations of classical staircase analysis (11,12,13); procedures were developed for re-analysis of data from these groups.
To study the effects of eccentricity on splices tested in air, multivariate linear regression (14) analyses were performed on failure data from the long-life fatigue tests. The effect of stress range was minimized by analyzing data which were usually no more than one staircase interval above the staircase mean fatigue limit of the appropriate test group. In the regressions, the dependent variable was the logarithm of the number of cycles at failure. The independent variables, eccentricity and stress range, were introduced in different combinations into separate regressions.
Multivariate regression ( 14) analyses were carried out on the four groups of finite life test data. Each test group was independently analyzed by the least squares method. The dependent variable was the logarithm of the number of cycles at failure and stress range was the independent variable. For test groups of specimens having eccentricity, regressions were also performed with both stress range and eccentricity as independent variables. Data were limited to failures occurring at less than 1 million cycles.
Historically ( 4), reinforcing steel fatigue design limits are derived from fatigue test data by taking the lower limit of the two-sided tolerance limits (14,15) such that it is 95 percent probable that 95 percent of the data fall between the limits. Similar limits were developed for each group of long-life test data.
A full account of the statistical analysis is presented in Appendix C.
Supplemental Testing Program
A separate supplemental testing program was carried out for the producer of the proprietary mechanical connector referred to in this report as the grout-filled coupling sleeve, to investigate the fatigue behavior of epoxy-coated reinforcing bars spliced with epoxy-coated grout-filled sleeves (16). This testing program utilized the same procedures and equipment as the investigation reported herein, and the epoxy-coated bars were supplied from the same lot of bars used to make splices in this investigation. Information on these tests is included in Appendix A. Data from the study is analyzed in Appendix C, and results of the analysis are included in Chapters 2 and 3.
11

CHAPTER TWO
FINDINGS
Literature Review
Research on the fatigue behavior of reinforcing bar splices, whether by welded joints, by proprietary mechanical connectors or by conventional lapped bar splices, is limited. Much of the work pertaining to proprietary mechanical connectors is unpublished. Prior investigations and other written works relevant to the present study are reviewed in detail in Appendix A.
From NCHRP Report 164 (4), it is known that the significant variables affecting fatigue behavior of reinforcing bars are stress range and deformation geometry, where deformation geometry is characterized by the ratio of the radius at the base of the rolled-on deformation to its height, r/h. Minimum stress has a lesser effect. Grade of steel and bar size have a minor effect that is not significant from a design point of view.
Where bars are spliced, the type of splice becomes a significant variable if the fatigue strength of the splice is less than that of the unspliced reinforcing bar. As discussed in Chapter 1, there are a wide variety of proprietary mechanical splices on the market. Previous research, even though limited, shows that the fatigue strength of spliced bars may be substantially less than that of the unspliced bar.
Two methods of testing have been used in previous experimental investigations: specimens tested in axial tension in air, and specimens tested after embedment as flexural reinforcement in concrete beams. In previous research where splices were tested in air, the misalignment in the test specimen at the splice location was not reported, although presumably some existed. Measurements of deformation geometry (the ratio r/h) for reinforcing bars used in fabricating splices have also not been previously reported.
Consequently, it is possible that the effects of these unmeasured parameters may mask the effects of controlled or measured test variables, making it difficult to compare data from different investigations. However, most investigations report basic properties such as tensile strength and sectional area for the reinforcing bar used to fabricate test splices. From this information, and by using the commonlyaccepted ( 4,5) value of 0.3 for the parameter r /h, a representative fatigue strength for the unspliced bar used in each particular test can be determined from published equations ( 4). The fatigue performance of splices can then be compared relative to representative lines based on these equations.
Effect of Type of Splice. For most prior investigations reviewed in Appendix A, the fatigue performance of a splice was reduced in comparison to the representative fatigue curve for the unspliced bar. The reduction in performance varied with type of splice. When the locations of fractures were reported, nearly every fatigue failure of a mechanical splice occurred through the bar at the end of the connector, not in the mechanical connector itself. This was also true for welded splices, as would be expected.
Effect of Stress Range. Although data from previous investigations indicate that fatigue life for splices is reduced when compared to that of the unspliced bar, the slope of the S-N curve in the finitelife region appears to be about the same as that of unspliced bar. In the long-life region, some of the data lend support to the assertion that there is a constant-amplitude stress cycle fatigue limit for splices, which is again reduced when compared to that of unspliced bar.
Illustrative splice fatigue test data are shown in Fig. 5 for 60 deg. single-V groove weld butt splices of No. 7 bars tested both in beams (17) and in air (9). Representative fatigue lines corresponding to the unspliced bar are also shown in the figure. Many splice fatigue failure points fall below the dashed line, which is the representative line for the mean fatigue life of the unspliced bars. In addition, several
12

Stress Range (ksi) Stress Range (MPa) 60~~~~~~~~~~~~~~~~~~~~~~~~~~~----,
50
40
30
20
10
0
Representative fatigue lines for unspliced bar:
Mean fatigue life
-- Design limits
0
0 0
Butt weld in air
Butt weld in beam
0 O• 0
• O•
400
300
200
100
O'--~--'~--'--'---'--'--'---'--'-'-~~-'---'---'--'----'--'--'--'-'--~~-'-~~~~~~o
0.01 0.1 1 10 N, Number of Cycles (millions)
Fig. 5 • Representative splice fatigue test data from published literature
splice fatigue failures occurred at lives less than representative design limits for the corresponding unspliced bar, shown as the heavy, solid line. Most of the splice fatigue tests that were reviewed in Appendix A reported data falling below the design life reference lines for the unspliced bar.
Few previous investigations carried out statistical studies of the fatigue behavior of splices in the long-life region. Two investigations studied 2 million cycle fatigue limits (18,19), and one investigation carried out concurrently with the present investigation studied a 5 million cycle fatigue limit (16). Fatigue limits for splices were usually less than that of unspliced bars.
Effect of Minimum Stress. Minimum stress was a controlled variable in a series of tests on welded joints (9). Fatigue test data for the same splice configuration fabricated from the same lot of reinforcing bars and tested at three distinct minimum stress levels were compared. A decrease in both fatigue life and fatigue limit occurred with increasing minimum stress. When the data were compared to the representative fatigue lines for unspliced bar, the relative effect of minimum stress on fatigue life of the welded splices appeared to be about the same as that for unspliced bars (4). For ordinary levels of minimum stress, this effect is small. Minimum stress levels of compression should be considered in determining stress range, apparently because of residual stresses on the surface.
Method of Testing. Tests on splices embedded in concrete beams should most closely represent in-service conditions. Maximum force in the bar or splice occurs at the flexural cracks in the beam. Conversely, for specimens tested in air, the absence of confining concrete is not representative of inservice conditions. The force is uniform along the length of the test specimen in air.
With specimens tested in air, the effect of misalignment of the splice element with the bars is a concern. Misalignment may cause secondary bending stresses in the splice. In beam specimens, secondary stresses due to misalignment are minimized, if not eliminated, by the encasing concrete.
13

Uncertainties also exist with beam tests. There is an effect due to stress gradient across the depth of the bar. Since the maximum force occurs at the cracks, the number of potential fatigue crack initiation sites depends upon the crack pattern and may be reduced in comparison to a specimen tested in air. In addition, stresses are obtained either by theoretical calculations or by strain measurements, both of which may have some error.
Method of loading can be considered a controlled variable when test data for welded splices tested in beams (17) are compared with data for the same splice configuration tested in air (9). The type of splice, a direct butt splice of No. 7 bars using a 60 deg. single-V weld, is the same for both test series, and it is reported that the spliced bars for both test series were fabricated from the same lot of reinforcing bar (17). Data at the same minimum stress level of 2 ksi from both experiments were shown previously in Fig. 5. The fatigue lives of air test specimens appear somewhat reduced when compared to those of splices in beams. These data suggest that testing in air may be a more severe test condition than testing in beams.
An effort was made to compare swaged splices tested in axial tension (20) with swaged splices tested in beams (21,22). It was found that the splices tested in beams generally had longer fatigue lives at a given stress range than splices tested in air. However, it is likely that the reinforcing bars and the swaged connectors for each experiment came from different sources. Thus, variables related to the reinforcing bar, the production lot of the coupler, and assembly of the coupler were not controlled, making the comparison difficult. Nevertheless, these data also suggest that testing in air may be the more severe test condition.
In light of these comparisons, it appears that testing in air may be a more severe condition than testing in beams. However, it also appears that the effect of method of loading is probably not large in relation to type of splice.
Fatigue Tests on Conventional Lapped Bar Splices. Published data for fatigue tests on conventional lapped bar splices are even less than that for tests on welded joints or mechanical connectors. In one report on fatigue tests of mechanical splices in concrete beams (21), two beam specimens which were tested under identical conditions contained lapped splices of 25 mm bars. One beam which contained a lapped splice with cranked bars (end of one bar offset by bends at the splice region) failed by fracture of a bar at a bend after approximately 100,000 cycles, whereas the other beam which contained a splice with straight bars ran out after 4 million cycles.
Another series of comparative tests (22) on 20 mm bars were carried out on six beams containing unspliced bars, three beams with conventional lapped bar splices, and five beams with lap splices having cranked bars. Data are illustrated in Fig. 6, along with data from the two tests mentioned in the previous paragraph. The fatigue performance of the lap splice having cranked bars was significantly reduced compared to that of unspliced bars, whereas beams with conventional lapped bars had longer fatigue lives than beams with unspliced bars.
In another report (24), fatigue tests were run on ten concrete slab specimens: five specimens contained parallel lapped bars, and five specimens contained unspliced bars. Specimens containing the lapped bars fractured at the end of the lap and typically sustained a greater number of cycles before failing than the specimens containing the unspliced bars.
The data from these investigations suggest that, under flexural loading, the fatigue performance of conventional lapped splices with straight bars is not reduced relative to that of the unspliced bar, but that lapped splices with cranked bars do have a significantly reduced fatigue performance. The observation of longer fatigue life for a beam with a lap splice, where fractures typically occur at the ends of the laps, compared to a beam with unspliced bar, where fractures typically occur near midspan, may in part be attributed to slightly increased stresses due to the selfweight of the beam.
14

Stress Range (ksi) Stress Range (MPa) 60~~~~~~~~~~~~~~~~~~~~~~~~~--,
50
40
30
20 0 25 mm lapped bars
<> 25 mm cranked lap
* 20 mm unspliced bar 10
+ 20 mm lapped bars
x 20 mm cranked lap
<>
x x
0
400
300
00
. 100
O'--~-'-~-'---'--L...l..-'-'-..1...L~~-'---L-'--'--'--'....w.-'--~--'-~-'--'--'--'--'-'-'-'0
0.01 0.1 1 10
N, Number of Cycles (millions)
Fig. 6 - Fatigue test data for conventional lapped bar splices
Review of Design Specifications. The AASHTO "Standard Specifications for Highway Bridges" (5) has no fatigue considerations for spliced reinforcing bars. For unspliced bars, however, AASHTO does have explicit fatigue considerations, which have the same experimental basis ( 4) as discussed previously for the representative fatigue lines of unspliced bars. The ACI Building Code (6) has no provision directly concerned with fatigue of reinforcing bars spliced by welds or mechanical connectors. Except for a brief mention of tests on butt welded splices, ACI Committee 215 (25) does not discuss mechanical or welded splices. The only fatigue consideration for spliced reinforcing bars contained in a U.S. design specification was found in a footnote to a table in the "Structural Welding Code -Reinforcing Steel", AWS Dl.4 (3), which requires that "Under fatigue, load reversal, impact, or seismic loading, the repetitive service load shall not exceed 20 ksi in the bar at the point of weld."
The Japan Society of Civil Engineers has promulgated recommendations (26) for reinforcing bar splice design, fabrication, and evaluation, which include requirements for fatigue strength in addition to requirements for static strength and high stress, low cycle strength. The fatigue performance requirement is a minimum fatigue strength of 10 kg/mm2 (14.2 ksi) at 2 million cycles and is limited to instances where "the effect of repeated service loads is significant". An appendix to the recommendations gives comprehensive test procedures to be used in establishing the fatigue characteristics for any method of splicing.
15

Experimental Investigation
This section summarizes the test results obtained in this investigation. A full description of the experimental work is given in Appendix B. Subsequent sections of this chapter summarize the statistical analysis of the test data and also discuss the effects of test variables.
Properties of Reinforcing Bars. Bar area, yield strength, tensile strength, elongation and chemical content were determined from tests on samples selected at random from both the No. 5 and No. 8 control bar lots. Average properties of unspliced bars are given in Table 2. Properties conform to the requirements of ASTM A615 (27).
Properties of Splices. Tensile strength, residual axial deformation, and misalignment of the spliced bars at the splice location were measured on specimens from each test group. Average values of the measured properties for splices are listed in Table 3.
Tensile strengths of splices were determined from tests in air on two specimens selected at random from each test group of splices, except for the steel coupling sleeve with wedge and the single-lap welded splice. Although tensile tests were conducted on these two types of splices, they are not reported because bending in air caused by the offset of the bars at the splice is not representative of in-beam behavior, and the strength was reduced because of the bending. For the strengths reported in Table 3, the most common mode of static failure was a fracture through the reinforcing bar in the free length between the test machine grips and the weld or mechanical connector. In several instances the bar slipped or pulled out from the sleeve of a mechanical connector. Other less-common fractures occurred though the threaded segment of the bar at the connector, through weld material, or through the mechanical connector itself.
AASHTO (5) and ACI 318-89 (6) require that a welded splice or mechanical connector develop in tension 125 percent of the specified yield strength of the reinforcing bar. Although all of the average strengths reported in Table 3 meet this criteria, tests on two individual splice specimens did not. The failure mode in each instance was one of the less-common fractures noted above. Individual test results are given in Table B-8 of Appendix B.
Tests to measure residual axial deformation were carried out on three to six specimens from each group of mechanical connectors tested in air, before a given specimen was tested in fatigue. Residual axial deformation was considered as the apparent permanent set or permanent elongation, measured across the splice, remaining after a single, initial static load cycle between 3 ksi and 30 ksi. The magnitude of residual deformation was nominally the same for all types of connectors tested except the two-piece cold-swaged steel coupling sleeve. There are no code requirements for residual deformation.
TABLE 2 • AVERAGE PROPERTIES OF UNSPLICED REINFORCING BARS
Bar Area Tensile Properties Chemical Content Size
Observed Tensile Elongation Element (percent) Yield Point Strength in 8 in.
(in2) (ksi) (ksi) (percent) c Mn p s No. 5 0.305 60.2 101.3 16 0.48 0.74 0.024 0.036
No. 8 0.756 69.1 111.7 15 0.39 0.90 0.050 0.047
16

TABLE 3 - AVERAGE PROPERTIES OF SPLICES
Splice Type Bar Type Tensile Residual Misalign-Strength Deformation ment
(ksi) (in.) (in.)
No. 5 97.2 .002 .11 Cold-swaged steel coupling sleeve
No. 5, Epoxy 99.5 .002 .11
Two-piece cold-swaged steel coupling No. 5 97.6 .014 .15
sleeve with threaded ends No. 8 78.2 .018 .05
Grout-filled coupling sleeve No. 8 106.1 .003 .17 Epoxy-coated grout-filled coupling sleevea No. 8, Epoxy 107.4 .005 .15
Steel-filled coupling sleeve No. 8 106.8 .003 .16
Tapered-threaded steel coupler No. 8 101.1 .003 .02
Straight-threaded coupler No. 8 76.1 .004 .04 (bar not upset at threads)
Steel coupling sleeve with wedge No. 5 - - -Double-lap welded splice No. 8 95.1 - .05
Modified double-lap welded splice No. 5 99.0 - .03
Single-lap welded splice No.5 - - -Note: a) From supplemental testing program, see Chapter 1.
For each splice specimen tested in fatigue in air, the misalignment of the splice was measured prior to the fatigue test on the specimen. Misalignment was the least for threaded couplings where threads are cut into the bar, and for welded splices.
Properties of Test Beams. Two splice configurations, the single-lap welded splice and the steel coupling sleeve with wedge, were tested while embedded in a concrete beam. The average strength and modulus of the test beam concrete were 5,040 psi and 4,590 ksi, respectively.
Midspan deflection of each test beam was monitored throughout cyclic loading. Except immediately prior to fatigue failure, the range of deflection was generally constant throughout a test. Minimum deflection, however, increased with time. This phenomena was observed in other fatigue tests ( 4) and may be attributed to time-dependent deformations.
Stress in a reinforcing bar was calculated using the usual linear-elastic, cracked section, reinforced concrete theory. Measured material properties and test beam dimensions were used in the calculations. To verify the calculations, static tests were carried out on beams instrumented with strain gages on the main reinforcing bar near the splice location. Experimental and calculated stresses agreed within 10 percent for beams containing single-lap welds. However, a significant disparity was noted for beams containing the wedge-sleeve couplings, which was attributed to the strain gages being typically located several inches from crack formers in these beams. The gages were immediately adjacent to crack formers in beams containing single lap welded splices. Nevertheless, because of the generally good agreement between experimental and calculated stresses for beams containing single-lap welded splices, the reported test stress ranges for all beams were based on calculated stress levels.
17

Results of Fatigue Tests. Fatigue test results for all splices from the experimental investigation are shown in Figs. 7a and 7b for No. 5 specimens, and in Figs. 7c and 7d for No. 8 specimens. Fatigue test results for the appropriate size unspliced bar are also shown on each figure. All fatigue test results are tabulated in Appendix B. The logarithm of the number of cycles to failure or at runout was plotted versus the test stress range. All tests were performed at a constant minimum stress of 3 ksi. The sloping segments of the dashed lines shown on the figures represent, for the appropriate finite-life data, best fit lines using an assumed slope typical of finite-life fatigue performance of unspliced reinforcing bar (4). The horizontal segments represent the mean fatigue limits determined from staircase analyses on the appropriate long-life data. The types of splices tested in this investigation were shown previously in Figs. 2a, 2b and 2c, and are schematically illustrated in Figs. B-6a through B-6i of Appendix B. Representative fatigue fractures for splices are shown in Figs. B-17a through B-17j of Appendix B.
The lowest stress range at which a fatigue fracture occurred in a splice was 6 ksi for a No. 5, twopiece cold-swaged steel coupling sleeve with threaded ends tested in air. Two specimens fractured at this stress range, one after 1,715,000 cycles and the other after 4,695,000 cycles. The specimens fractured through the male threaded half of the swaged coupling sleeve, initiating at the exterior root of the first fully engaged thread. For the same splice type, the highest stress range at which a runout occurred was 7.0 ksi.
The highest stress range at which a runout occurred at 5 million cycles in a splice was 25.0 ksi for a No. 8, grout-filled coupling sleeve. For the same splice type, the lowest stress range at which a fatigue fracture occurred was 24.0 ksi. Four specimens fractured at this stress range in 1,563,000 to 2,862,000 cycles. All fractures occurred transversely through the middle of a sleeve, initiating at various sites in the sleeve casting.
The least number of cycles in which a fatigue failure occurred for a long-life test was in 160,000 cycles at 19.7 ksi for a No. 5, single-lap welded splice tested in a concrete beam. The fracture occurred through the bar, initiating at the weld termination. Examination of the weld revealed a large undercut at the fracture location. The relatively short life may be attributed to stress concentration caused by the undercut. Other specimens of the same configuration and tested at about the same stress range either failed at greater than 1 million cycles or ran out after 5 million cycles. Because number of cycles does not directly enter into the staircase analysis, the reduced number of cycles for this specimen has no effect on analysis results.
Because test machines were allowed to run unattended over nights and on weekends, tests on some specimens continued beyond 5 million cycles of loading. The greatest number of cycles for a runout was 10,600,000 cycles for cold-swaged steel coupling sleeve with No. 5, epoxy-coated bar tested at 20.0 ksi. The greatest number of cycles at which a failure occurred was 9,200,000 cycles for a double-lap weld tested at 9.0 ksi. In a staircase analysis, however, any failure occurring at more than 5 million cycles was treated as a runout occurring at 5 million cycles. It should be noted that test machine scheduling did not permit testing specimens of all splice types to comparable numbers of cycles.
Descriptions of Fatigue Fractures. Fatigue fractures of all unspliced bar specimens, with one exception, initiated at the base of a transverse lug. The fracture of one No. 5 bar initiated at a bar mark. The fatigue fracture initiation sites for unspliced bars from the present investigation were similar to those reported in other experimental investigations on fatigue of unspliced bars ( 4).
Representative fatigue fractures for splices are shown in Figs. B-17a through B-17j of Appendix B. Splices made with non-threaded mechanical connectors typically but not always fractured through the reinforcing bar at or near the end of the connector, initiating at the base of a transverse lug. This was the only mode of fracture observed for cold-swaged steel coupling sleeves and steel coupling sleeves with wedge, and was the predominant mode for steel-filled coupling sleeves. Some steel-filled sleeves fractured transversely through the middle of the sleeve, initiating at multiple sites in the steel filler metal or the sleeve metal. Except for one specimen which fractured through the reinforcing bar, all groutfilled coupling sleeves fractured transversely through the sleeve, initiating at various features in the steel
18

Stress Range (ksi) Stress Range (MPa)
40
30 -
20 -
10 r- * +Failure
0 Runout
Mean
~~ ' ' ' ' '
- 300
* '* +
' ' ' ' ' * ' Unspliced bars
', * #! * '---------~---~----
Steel sleeves with wedge------±---~--1--+---~-----.Z +o o Cold-swaged sleeveo.c----------------7tj----- o
with epoxy-coated bar X 8 O (,
200
- 100
* * Threaded-swaged sleeves-------*"-iiS. ___ _,~---
0 '--~~~~~~~~~~~~~~~~'--~~~~~~~~~-~·~~~~ 0
0.01 0.1 I 10
N, Number of Cycles (millions)
Fig. 7a - Fatigue test data: No. 5 bars an~ splices
Stress Range (ksi) Stress Range (MPa) 50 ,--~~~~~~~~~~~~-.,--~~~~~~~~~~~~~~~~~---,
' ' ' ' ' ', - 300
40
30
20 r-
10 r- * +Failure
0 Runout
Mean
' ' ' ' ' ' '" Mean line for unspliced bars
' ' ' ', ______________________ _
200
++ Single-lap welds ________ T _______ .f_g_ ____ _
+ x @
Cold-swaged sleeves --------1<2<---:><----11----e CD
§ 100
* , Modified lap welds ·--------K------~0---
0 '--~~-'-~"---'-''--'-'ll_Ll-'-J.11_,_ '~~~'~--L'~.1--li_llL.L..lll~l~l~~~'--~''--~l--1--1..-LLI..JO
0.01 0.1 I 10
N, Number of Cycles (millions)
Fig. 7b - Fatigue test data: No. 5 bars and splices (continued)
19

Stress Range (ksi) Stress Range (MP a) 50
\ \ \ \
\ \ \ \ \ \
\ \ \ \ \ \
\ 300 \ \
~ ++ ',* ** ', * 40 ' \ \ \ \ \
\ \ \ \ \ \ Unspli<;ed bars \
\ \
\ \ * \
\ \ ' 'lt* \ \ ~ * * ' ' \
\ ' \ '*' ** l 30 \
' \
' '*1-------;;----- ----· \ ' 200 ' \
' ' \ \
' \ ',Taper-threaded couplers \
\ +, ' \ ''----1-+-----i?----20 ' \
' \ Steel filled sleeves \
',, --~-"".2"'-~--"- 100
10 * +Failure ',, ____ ;~~~~:~-w l;sw-: 0 Runout
Mean
0 '--~~-'--~-'-----'----'--'-~~~~--''-------'-~-'---'--'--'--'--'--'-~~---'-~---'----'----'---'--'-L.W 0 0.01 0.1 1 10
N, Number of Cycles (millions)
Fig. 7c - Fatigue test data: No. 8 bars and splices
Stress Range (ksi) Stress Range (MPa) 50 .-~~~~~~~~~~~~~~~~~~~~~~~~~~~~~~~
\ \
' \ \
' ' ' ' - 300
40
30
20
10 >- * +Failure
O Runout
0 0.01
Mean
' \ \ ', Mean line for unspliced bars
\ \
\
' \ \
'------------+-------·
+ Grout-filled ~l_e_e.Y.!'1'+7++-+-----e---9--
00 00
x
Standard coupler with NC threads
x ~----;-~----x-~----1t,%-----""*-----~----)f---~--~
Threaded-swaged sleeves
200
100
I I I I I I
0.1 1 ' '""o
10
N, Number of Cycles (millions)
Fig. 7d - Fatigue test data: No. 8 bars and splices (continued)
20

sleeve. Splices made with threaded mechanical connectors fractured most often through the threaded
segment of the reinforcing bar, initiating at the root of the first engaged thread immediately at the end of the coupler. All taper-threaded steel couplers fractured in this mode, as did most straight-threaded couplers. A few straight-threaded couplers fractured transversely through the coupler, initiating at the root of an internal cut thread. All two-piece cold-swaged steel coupling sleeves with threaded ends fractured in the male threaded half of the swaged coupling sleeve, initiating at the root of the first fully engaged male thread. For threaded couplers tested at finite-life stress ranges, additional fatigue crack initiation sites were also observed on other engaged threads besides the first engaged thread.
Welded splices always fractured transversely through the bar, initiating at a weld termination. No. 8 double-lap welded splices in long-life tests fractured through the main bar at a weld termination. However, some specimens in finite-life tests fractured through the lap bars at a weld termination. All modified double-lap welded splices fractured through the No. 5 lap bars at a weld termination. Also, all single-lap welded splices tested in beams fractured through the bar at a weld termination.
Statistical Analvses
Statistical analysis was used to quantify the effects observed from the test data, and to place tolerance limits on the data. These limits are useful in establishing fatigue design criteria. A full description of the statistical analyses carried out on the test data is given in Appendix C.
In the planning and execution of the test program, every effort was made to use randomization to the greatest extent possible in order to minimize any bias due to personnel and test procedures.
Statistical procedures to test the validity of the assumption of a log-normal distribution of fatigue lives typically involve chi-square tests (28). However, the number of tests in any group of long-life or finite-life tests was too few to permit using the chi-square test. Consequently, a qualitative assessment was obtained by comparing fatigue data on unspliced bars from the present investigation with that of a previous investigation (4) on large groups of unspliced bar. The values for standard deviation from staircase analyses on long-life data reported herein are of the same order of magnitude as typical estimates of standard deviation from the previous investigation. Extending the comparison to regression analyses on finite-life data of unspliced bars, regression coefficients and standard errors of estimates for the coefficients are of generally similar values. Therefore, the assumption of a log-normal distribution for fatigue lives in the present experimental investigation appears reasonable.
As pointed out in Chapter 1, a supplemental testing program (16) was carried out on epoxy-coated grout-filled coupling sleeves with No. 8, epoxy-coated reinforcing bars. These reinforcing bars came from the same lot of bars used in the experimental investigation reported herein. The coupling sleeves also were from the same manufacturer as the grout-filled sleeves used in this investigation, although a different production lot. Analysis of this data is included herein for the purpose of making comparisons.
Analysis of Long-Life Test Data. Each group of long-life test data was analyzed independently using two different staircase analysis procedures (4,8). Generally equal estimates of the mean fatigue limit for a group of data were obtained from both procedures, but estimates of standard deviation differed significantly for some groups. For test groups where estimates of standard deviation differed significantly between the two procedures, it was consistently noted that the estimates fell outside of the range of known reliable estimates. Techniques were developed for re-analysis of the data from which reliable estimates of standard deviation could be obtained. Upon re-analysis, generally equal estimates for both mean and standard deviation were obtained from the two procedures. Mean fatigue limits at 5 million cycles for each test group are given in Table 4, and are compared in Fig. 8
Statistical tolerance limits (14,15) were also determined for each group of staircase test data using the respective estimates of mean and standard deviation. These limits are commonly determined such
21
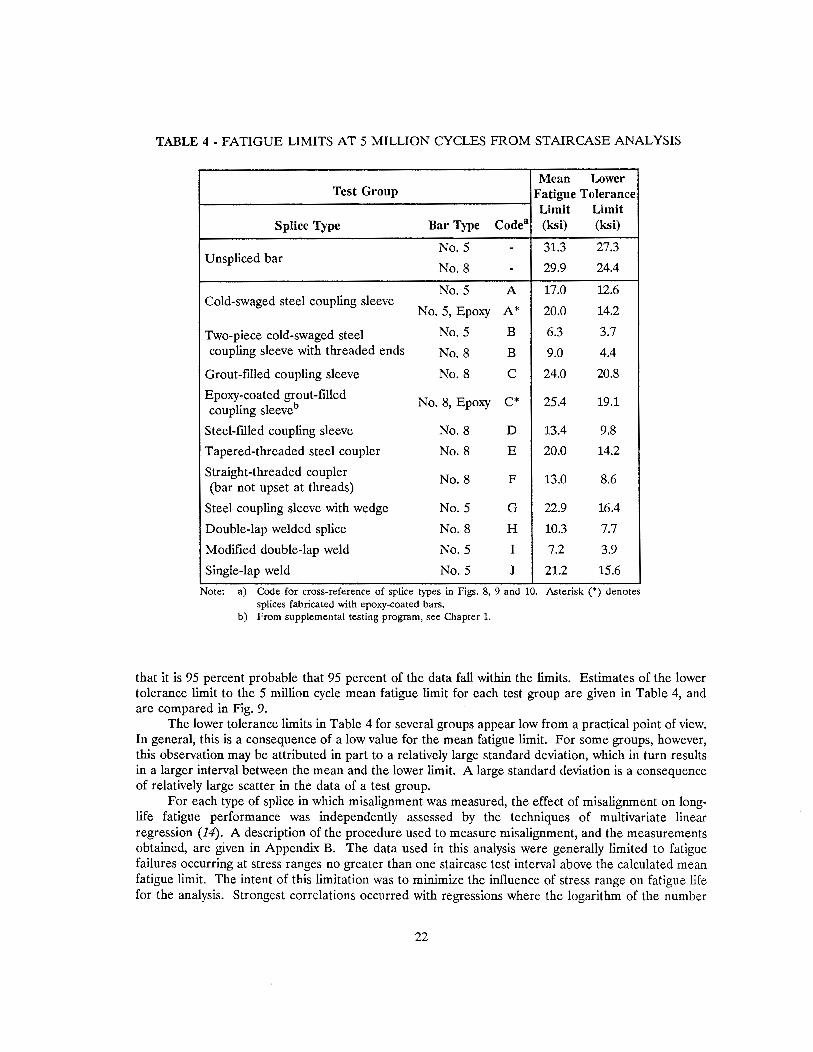
TABLE 4 - FATIGUE LIMITS AT 5 MILLION CYCLES FROM STAIRCASE ANALYSIS
Mean Lower Test Group Fatigue Tolerance
Limit Limit Splice Type Bar Type Code3 (ksi) (ksi)
No. 5 - 31.3 27.3 U nspliced bar
No. 8 29.9 24.4 -No. 5 A 17.0 12.6
Cold-swaged steel coupling sleeve No. 5, Epoxy A* 20.0 14.2
Two-piece cold-swaged steel No. 5 B 6.3 3.7
coupling sleeve with threaded ends No. 8 B 9.0 4.4
Grout-filled coupling sleeve No. 8 c 24.0 20.8
Epoxy-coated grout-filled coupling sleeveb No. 8, Epoxy C* 25.4 19.1
Steel-filled coupling sleeve No. 8 D 13.4 9.8
Tapered-threaded steel coupler No. 8 E 20.0 14.2
Straight-threaded coupler No. 8 F 13.0 8.6
(bar not upset at threads)
Steel coupling sleeve with wedge No. 5 G 22.9 16.4
Double-lap welded splice No. 8 H 10.3 7.7
Modified double-lap weld No. 5 I 7.2 3.9
Single-lap weld No. 5 J 21.2 15.6
Note: a) Code for cross-reference of splice types in Figs. 8, 9 and 10. Asterisk (*) denotes splices fabricated with epoxy-coated bars.
b) From supplemental testing program, see Chapter 1.
that it is 95 percent probable that 95 percent of the data fall within the limits. Estimates of the lower tolerance limit to the 5 million cycle mean fatigue limit for each test group are given in Table 4, and are compared in Fig. 9.
The lower tolerance limits in Table 4 for several groups appear low from a practical point of view. In general, this is a consequence of a low value for the mean fatigue limit. For some groups, however, this observation may be attributed in part to a relatively large standard deviation, which in turn results in a larger interval between the mean and the lower limit. A large standard deviation is a consequence of relatively large scatter in the data of a test group.
For each type of splice in which misalignment was measured, the effect of misalignment on longlife fatigue performance was independently assessed by the techniques of multivariate linear regression (14). A description of the procedure used to measure misalignment, and the measurements obtained, are given in Appendix B. The data used in this analysis were generally limited to fatigue failures occurring at stress ranges no greater than one staircase test interval above the calculated mean fatigue limit. The intent of this limitation was to minimize the influence of stress range on fatigue life for the analysis. Strongest correlations occurred with regressions where the logarithm of the number
22

30
25
20
15
10
5
0
Stress Range (MPa)
Unsp!iced No. 5 bar Unspliced No. 8 bar
No. 5 splices No. 8 splices
G J A* A B C* C E D F H B
Splice Type
Fig. 8 · Mean fatigue limits at 5 million cycles (see Table 4 for definition of Splice Type codes)
Stress Range (ksi) 35~~~~~~~~~~~~~~~~~~~~~~~~~
Stress Range (MPa)
30
25
20
15
10
5
0
Unspliced No. 5 bar
Unspliced No. 8 bar
No. 5 splices No. 8 splices
I I I G J A* A B c c• E D F H B
Splice Type
Fig. 9 · Lower 95-percent tolerance limits at 5 million cycles (see Table 4 for definition of Splice Type codes)
23
200
150
100
200
150
100
50
0

of cycles to failure, log N, was taken as the dependent variable and stress range and measured misalignment were introduced together as independent variables. Rational regression coefficients were obtained for each splice type with measured misalignment except the steel-filled coupling sleeves and the standard double-lap welded splices. F-variate tests (28) indicated a statistical significance of greater than 80 percent for the correlation coefficients of many groups, indicating that it was more than 80 percent probable that these correlation coefficients were non-zero. Revised estimates of the mean fatigue limit were obtained from the appropriate regression equation for each test group having rational regression coefficients.
Figure 10 compares mean limits revised for misalignment with mean limits from the staircase analysis. The revised estimates are generally 1.0 to 2.0 ksi greater than mean fatigue limits obtained from staircase analysis. The effect of misalignment on the mean fatigue limit is small in comparison to the effect of splice type. Consequently, further discussion of fatigue limits in the remainder of this report will be restricted to limits from staircase analysis unless otherwise indicated.
Statistical comparisons of the mean fatigue limits for selected groups were carried out by using a t-test of the difference between two independent means (28). Comparisons were made for: coldswaged steel coupling sleeves with uncoated bar versus those with epoxy-.coated bar; grout-filled coupling sleeves with uncoated bar versus epoxy-coated grout-filled sleeves with epoxy-coated bar; and the modified double-lap welded splice tested in air versus the single-lap welded splice tested in beams. In all cases the comparison indicated that the means were not equal.
No statistically significant relationship between long-life fatigue performance of a splice configuration and tested tensile strength could be established in the present investigation.
Analysis of Finite-Life Test Data. Each of the four groups of finite-life test data were analyzed independently using multivariate linear regression (14). Test groups having finite-life data included the two sizes of unspliced bars, the taper-threaded steel couplers, and the standard double-lap welded splices. All groups were tested in air. Misalignment was measured for the specimens in the latter two groups.
35
30
25
20
15
10
5
0
Stress Range (ksi)
~ Unadjusted
CJ Adjusted
- No. 5 splices -
I --
~ A* A B
-
c• Splice Type
-
c
Stress Range (MPa)
No. 8 splices
I -
I E F B
Fig. 10 • Effect of misalignment on mean fatigue limits (see Table 4 for definition of Splice Type codes)
24
200
150
100
50
0

The analyzed data were limited to failures occurring in less than 1 million cycles. The logarithm of the number of cycles to failure, log N, was taken as the dependent variable, and stress range was the independent variable. From 75 to 99 percent of the variation in the data was accounted for by these regressions, and correlation coefficients with a statistical significance greater than 95 percent were obtained for each test group. For both splices and unspliced bars from the present investigation, an increase in stress range resulted in a decrease in fatigue life. The magnitude of this effect is consistent with that observed for unspliced bars from a previous investigation (4).
For the two test groups in which misalignment was measured, additional regressions were carried out with both misalignment and stress range as independent variables. Introduction of misalignment as an additional independent variable did not greatly increase correlation or greatly change regression coefficients for these two groups.
Because type of splice is not a quantified variable, it was not possible to analyze finite-life data pooled from all test groups. Therefore, best fit lines using an assumed constant slope, taken from a regression analysis ( 4) on a large pool of reinforcing bar fatigue data from a previous investigation, were developed for the finite-life data. Best fit lines for the finite-life data from the present investigation were shown previously as the sloping segments of the dashed lines in Figs. 7a through 7d.
Discussion of Results
The observed effects of the controlled and measured test variables, based on the results of the tests and statistical analyses from this investigation, are discussed in this section. Observations from previous investigations are also included.
Effects of Splice Type. Fatigue test data from this investigation were shown previously in Figs. 7a through 7d. As may be seen in the figures, splicing has a pronounced effect on fatigue performance in both the finite-life and long-life regions of the S-N curve. For each type of splice, this effect is always a reduction in the fatigue performance of a splice relative to that of the unspliced bar. The magnitude of the effect varies with the type of splice. It also appears that the relative reduction for a given splice type may vary from the finite-life region to the long-life region.
Effect of Bar Size. In this investigation, the mean fatigue limit of the unspliced No. 5 bars was 31.3 ksi, compared to 29.9 ksi for the No. 8 bars. The decrease in fatigue limit for the larger diameter bar was slight, and was probably due mainly to somewhat sharper surface geometry.
The fatigue performance of two-piece cold-swaged steel coupling sleeves with threaded ends improved with increasing bar size, from 6.3 ksi for connectors with No. 5 bars to 9.0 ksi for connectors with No. 8 bars. Fatigue fractures for this type of splice occurred in the mechanical connector itself, not in the reinforcing bar. This points out that there may very well be variations in physical characteristics of the same splice type for different bar sizes that affect fatigue performance.
The results of a previous investigation (22) on cold-swaged sleeves, taper-threaded couplers, and straight-threaded couplers, however, indicated that fatigue performance of splices decreased with increasing bar size. It should be noted that the fatigue fractures in these splices typically occurred in the reinforcing bar at the splice.
In general, it appears that the effect of bar size is small in relation to the effect of splice type, but the potential for variations in the physical characteristics of the same splice type in different sizes must be kept in mind.
25

Effect of Coating. The results of this and another investigation (16) can be used to assess the relative fatigue performance of splices in which either the bars or the splice itself are epoxy-coated. In two comparisons, the fatigue performance of a splice having epoxy-coated elements was greater than that of an otherwise identical splice without epoxy-coated elements.
In this investigation, long-life fatigue tests were carried out on a cold-swaged steel coupling sleeve with both uncoated and epoxy-coated No. 5 bar. The mean fatigue limit increased from 17.0 ksi for splices made with uncoated bars to 20.0 ksi for splices with epoxy-coated bars. The lower tolerance limit also increased, from 12.6 ksi to 14.2 ksi. For both groups of splices, fractures occurred through the reinforcing bar at the end of the swaged sleeve It is speculated that the blast-cleaning of the reinforcing bars before epoxy coating may reduce stress concentrations at initiation sites on the bar surface, thereby improving fatigue performance.
The fatigue performance of grout-filled coupling sleeves from this investigation may be compared to that of epoxy-coated grout-filled coupling sleeves with epoxy-coated reinforcing bars tested in a supplemental investigation (16). The mean fatigue limit increased from 24.0 ksi for uncoated sleeves to 25.4 ksi for epoxy-coated sleeves, but the lower tolerance limit decreased from 20.8 ksi to 19.1 ksi. Fractures for both groups of splices almost always occurred through the middle of the sleeves, initiating on the inside of the sleeve. Blast-cleaning of the inside of the sleeve may potentially reduce stress concentrations on the surface of the sleeve. However, since only the exterior of the sleeves were coated with epoxy, it is not certain that the insides of the sleeves were blast-cleaned. Consequently, since the uncoated sleeves and epoxy-coated sleeves were obtained from different production lots, it is believed that production variations may account for the observed difference in fatigue performance.
Therefore, it appears that in at least one instance splices with epoxy-coated elements have an improved fatigue performance relative to splices without epoxy coatings. As with the effect of bar size, the magnitude of the effect of epoxy-coating is small when compared to the effect of type of splice.
Effect of Method of Testing. For unspliced reinforcing bar, "actual service conditions in highway bridges are simulated most closely when the test bar is embedded as the main reinforcing element in a concrete beam subjected to bending", as compared to a specimen tested in axial tension in air, because "axial tension tests in air are not representative of the complex interaction between concrete and reinforcement in a concrete beam" ( 4). Additionally, distribution of stresses and the number of probable fracture initiation sites for the test specimen in air differ from a test bar embedded in a concrete beam. A bar in a beam has a stress gradient across the depth of the bar, and the stress is maximum only close to the location of a crack, whereas stress is uniform across the section and throughout the length for an air test specimen.
Arguably, the same conditions apply to a spliced reinforcing bar as well. However, the crack initiation sites for a splice are both limited and well-defined for most splice configurations, generally occurring in the bar at the end of the splice, through threaded elements, or through the middle of the splice itself. The surrounding concrete serves to restrain any transverse displacement of the splice. The consequence is that forces in a splice encased in a concrete beam may be considered generally axial. Further, the investigators who tested reinforcing bars in concrete beams also acknowledge that "Axial tension fatigue tests, where care is taken not to introduce any bending forces to the test specimen, would satisfy the requirement for uniform test conditions" necessary to determine the location of the critical surface geometry of reinforcing bar ( 4). Finally, the statistical effect of a stress gradient in a concrete beam on fatigue performance of unspliced reinforcing bar is known to be relatively small and is negligible for design purposes ( 4). Presumably, these observations about critical location and stress gradient also extend to splices in concrete beams.
In this investigation, method of loading was intended to be a controlled variable in the comparison of tests in air on modified double-lap welded splices having No. 5 side bars with tests in concrete beams on No. 5 single-lap welded splices. The double-lap weld configuration was modified so that probable fatigue fracture initiation sites were similar to probable initiation sites for a single-lap weld. Evaluation
26

of test results showed a very large difference in the mean fatigue performance for the two test groups, even when the effect of axial misalignment on the test data was considered. The mean fatigue limit for the single-lap welded No. 5 bars tested in concrete beams was 21.2 ksi, compared to 7.2 ksi by staircase analysis and 9.3 ksi when adjusted for misalignment for the modified double-lap weld tested in air. Because of the large difference, a careful review of the test procedures and measurements was made, without finding any error. A limited finite element analysis of the modified double-lap welded joint indicated a significant bending stress gradient across the side bars due to a tendency for the side bars to pinch together when the main bars are in axial tension. The analysis also indicated that the stress gradient was less for the same splice embedded in a concrete beam. Additionally, the bending stress gradient due to pinching observed in the double-lap splice does not occur in a single lap splice embedded in a concrete beam. It should also be recognized that, even though the single-lap splice tested in concrete was only 2 in. long, there is opportunity for the encasing concrete to share in the force transfer. While it is believed that the mean fatigue limit of the modified double-lap weld tested in air is lower than it would have been if tested in concrete, the mean fatigue limit for the single-lap weld tested in concrete seems too high. Unfortunately, this difference is not resolvable with the available data.
Nevertheless, the effect of method of loading can be assessed though comparisons of test data from this investigation with test data from previous investigations. Data for the No. 5 cold-swaged sleeves tested in air in this investigation are compared in Fig. 11 with data from other investigations for 25 mm sleeves tested in beams (21), 20 mm and 32 mm sleeves in beams (22) and 22 mm sleeves in air (20). Figure 12 compares data for No. 8 taper-threaded couplers tested in air from this investigation with data for 20 mm and 32 mm couplers tested in beams (22). The data in Fig. 12 indicate similar fatigue performance for the No. 8 couplers tested in air and 32 mm couplers tested in beams. (It should be noted that the 20 mm couplers in Fig. 12 exhibit the anomaly of having a fatigue performance which is better than that of 20 mm unspliced bars tested in beams in the same investigation.) However, the data shown in Fig. 11 indicate that testing in air is the more severe condition. Previous in-air and inbeam tests on V-butt welded joints (9,17), compared earlier in Fig. 5, also indicate that testing in air is the more severe condition.
These comparisons lead to the view that data from axial tension fatigue tests on splices in air will generally provide a conservative prediction of the fatigue performance of splices encased in concrete beams.
27

Stress Range (ksi) 60
50
<>
40 <>
30
20 In beam, 25 mm
0 In beam, 20 mm
<> In beam, 32 mm 10 ~
+ In air, 22 mm
x In air, No. 5
<>
<> +
+
x x +
Stress Range (MPa)
0
x
+
400
300
- 200
er ()"
O'--~~'---'---'--'-'-~~~~-'-~--'--'--'---'-~~~~~~-'---'---'-~~o
0.01
Stress 60
50
40
30
20
0 10
<>
x
0 0.01
0.1 1 N, Number of Cycles (millions)
Fig. 11 · Comparison of fatigue test data for cold-swaged coupling sleeves
10
Range (ksi) Stress Range (MPa)
~ 0
<> 0 xx JK 0
<> 0
<>
<> x 2· <>
x?: ~ >--..
In beam, 20 mm
In beam, 32 mm
In air, No. 8
0.1 1 10 N, Number of Cycles (millions)
Fig. 12 - Comparison of fatigue test data for taper-threaded couplers
28
400
300
200
100
0

CHAPTER THREE
INTERPRETATION AND APPLICATION
The findings presented in Chapter Two add a substantial amount of information to the technical literature on fatigue of splices in reinforcing bars. As was expected at the outset, there is large variability in fatigue strength with the type of splice. Grout-filled coupling sleeves exhibited the best fatigue behavior. At 5 million cycles, there was a 95 percent level of confidence that 97.5 percent of the splices represented by those tested would sustain a stress range of 20.8 ksi. Welded splices and twopiece cold-swaged sleeves with threaded ends exhibited the worst behavior, with a corresponding stress range of 3.7 ksi. The other types of splices that were tested were distributed between these values.
There are several issues which must be considered in using the findings of Chapter 2 to develop a design provision for fatigue of splices. Perhaps foremost is the issue that mechanical connectors are proprietary products, and hence subject to control by the manufacturer as well as to modification at any time so long as specified requirements are met. The significance of this issue is realized by the observation that the findings reported herein are primarily related to stress in the reinforcing bar being spliced, not to stress in the connector. Indeed, a manufacturer of a connector with poor fatigue performance may be able to improve the fatigue strength of that connector by simply increasing its cross sectional area, i.e., reducing the stress in the connector. Fatigue performance might also be improved by altering details affecting stress concentrations in the connector.
Another issue is that, at present, the only commonly specified requirement for a welded splice or a mechanical connector is that it must develop a tensile strength of at least 125 percent of the specified yield strength of the bar being connected. This requirement has at best only an indirect bearing on the fatigue strength of the splices. The available technology on mechanical connectors, and to some degree on welded splices, is not adequate for rational, analytical assessment of fatigue strength. Consequently, fatigue strength of splices must be based substantially on fatigue testing.
A third issue is the importance of recognizing that data on fatigue of splices, while significantly increased by this investigation, are still limited with respect to all of the splices available for use in bridge construction. At least ten different general types of mechanical connectors suitable for use in tension splices are listed by ACI Committee 439 (1) and are presumed to be readily available for use in bridge construction in the United States. Considering that there are multiple manufacturers for some types of connectors, and also that any given manufacturer may offer several optional configurations for a general type of splice, it is believed that the number of mechanical connectors with potentially differing fatigue performance is in the range of 20 to 30. This investigation studied seven of these configurations, or roughly one-fourth to one-third of the available types of splices.
Further, the number of potentially different splices increases by an order of magnitude when size of bar being connected is considered. The details and the dimensions of the connector relative to reinforcing bar diameter appear to vary with bar size for many mechanical connectors. Additional variability occurs with consideration of epoxy-coated bars. Blast cleaning of bars and connectors in preparation for coating with epoxy may smooth the surface of the bar or connector, thereby affecting fatigue behavior. It can also be speculated that the presence of a coating may affect force transfer within a splice. Whereas these factors appear to be of lesser significance from a design point of view, the number of splices which have been tested in fatigue, nevertheless, represent an even smaller fraction of the available splice systems with potentially different fatigue performance.
Considering the ramifications of all of these issues, the question arise as to whether a prescriptive design requirement is suitable for the AASHTO specifications (5). A performance requirement to the effect that a mechanical connector shall sustain a stress range specified by the designer for a certain number of cycles would have apparent advantages. However, with such a requirement, a designer needs to be quite familiar with the types of splices that are available, the suitability of these splices for a
29

specific project, and the basis for assessing whether their performance will be satisfactory. Thus, it is believed that a prescriptive design requirement is of value, and that the knowledge gained in this investigation can be used to set limits which certain types of splices can meet or exceed.
Design Factors Affecting the Fatigue Performance of Splices
In design of a splice, the bridge engineer can select the type of splice and limit the stress range in the bar at the splice. As pointed out before, a reduction in fatigue performance of spliced bars relative to the fatigue performance of unspliced bars was noted for each splice configuration tested in this investigation. The magnitude of reduction varied with type of splice. Data and best fit curves for splices tested in the present investigation were shown previously in Figs. 7a through 7d.
In Article 8.16.8 of the AASHTO specifications (5), fatigue is considered to be a serviceability requirement, and therefore stress ranges are limited to values computed on the basis of "straight-line theory of stress and strain in flexure" without incorporation of a strength factor. The specification limits the range between a maximum tensile stress and a minimum stress in straight reinforcing bars to the following, which is Equation 8-60 of the specifications:
where:
fr 21 - 0.33 /min + 8 (r/h)
fr stress range in kips per square inch; f min algebraic minimum stress level, tension positive,
compression negative, in kips per square inch; r/lz ratio of base radius to height of rolled-on transverse
deformations; where the actual value is not known, use 0.3.
The above expression is based on long-life fatigue behavior of straight reinforcing bars from NCHRP Report 164 (4). The value of the fatigue limit stress range determined from AASHTO Eq. 8-60 is almost invariably above 20 ksi. Since actual ranges of stress under service loads seldom exceed 20 to 25 ksi, the higher allowable stress range that could be justified in the finite-life region becomes unimportant.
As pointed out in Chapter 2, there appears to be a similar limiting stress range, the fatigue limit, below which a spliced reinforcing bar may be expected to sustain an unlimited number of cycles, from a practical point of view, without failure. A fatigue limit was observed for each type of splice tested in the present investigation. Mean fatigue limits, determined at 5 million cycles, were compared previously in Fig. 8. A splice subjected to a stress cycle equal to the 5 million cycle mean fatigue limit has a 50 percent probability of failing in fatigue before 5 million cycles, or, conversely, the splice has a 50 percent probability of surviving 5 million cycles.
For design purposes, the limiting stress range, i.e., the design fatigue limit, may be determined as the lower 95-percent tolerance limit to the 5 million cycle mean fatigue limit. Lower tolerance limits statistically account for the observed scatter in fatigue life. Spliced bars subjected to stress ranges below the lower 95-percent tolerance limit have a near 100 percent probability of surviving 5 million cycles without a fatigue failure. Lower 95-percent tolerance limits for each splice configuration tested were
· compared previously in Fig. 9. However, with the fatigue limit for some splices as low as 4 ksi, some increase in the allowable stress range may be needed for splices in the finite-life region. While the data obtained in this investigation in the finite-life region is very limited, it does appear that some increase can be allowed. The data of the present investigation and the investigations reviewed in Appendix A indicate that the finite-life effect of stress range for splices can be approximately represented by the finite-life effect of stress range for unspliced reinforcing bars from NCHRP Report 164 (4).
30

It should be noted that the ability to accurately predict low stress ranges is limited. Actual stresses may be higher than calculated stresses because of volume change effects and cracking. For higher levels of stress, this potential variability from calculated stress is of less consequence. But with low magnitudes of stress, and hence also low ranges of stress, the magnitude of the potential variability from calculated stress may be of the same order as the calculated stress. This suggests that additional conservatism might be appropriate for splices with lower fatigue limits. On the other hand, given the redundancy of multiple bars in a concrete member, the failure of a single splice will probably not endanger the structural system. Rather, crack width and deflections will increase as failures occur, providing some warning of the developing problem.
Other Factors Affecting the Fatigue Performance of Splices
Variation in the weld or mechanical connector itself may affect fatigue performance of the splice system, especially where fatigue fractures occur through the weld or mechanical connector. Surface defects on mechanical connectors are potential fatigue crack initiation sites which may vary in severity with production lots. Some sleeve-type mechanical connectors allow considerable tolerance in the position of the longitudinal axis of the reinforcing bar relative to that of the splice. The offset between the axes of the sleeve and bar can be significant for some splices and, even when embedded in a concrete beam, may cause a stress gradient in the sleeve itself. These factors could potentially increase or decrease the fatigue performance of a splice system.
Depending upon the relative fatigue performance of the splice itself (i.e.: the weld metal or the mechanical connector), it is conceivable that the location of the fatigue fracture could change from the reinforcing bar to the splice or vice-versa due to variation in the fatigue performance of either the reinforcing bar or the splice.
Variation of the fatigue performance of the unspliced bar may also affect the fatigue performance of the splice system. For a splice configuration where fatigue fractures initiate in the reinforcing bar at a bar deformation, splices fabricated using a bar with a relatively poor fatigue performance could have a lower fatigue limit than if a bar with a relatively superior fatigue performance were used.
There are certain aspects of mechanical and welded splices, such as workmanship during installation and inspection of the complete splice, which will affect a splice, including static strength, stiffness and ductility in addition to fatigue. It is imperative that a splice be properly made so that all of these strength and performance requirements are met. In fact, design provisions are usually predicated on the assumption that splices are properly made to a minimum level of acceptance. Consequently, provisions for variation in workmanship do not directly enter into design provisions, but there does exist an implied reliance that the completed splice conforms to a minimum level of acceptance.
Development of a Design Provision for Fatigue
Allowable Design Fatigue Stress Range. It is interesting to compare in Fig. 13 the lower limits of test groups from the present investigation with current AASHTO (5) fatigue categories for design fatigue stresses of various structural steel weldments. Also shown on the figure is the design fatigue limit from AASHTO Section 8.16.8.3 for straight, deformed reinforcing bars. The illustrated limit was determined from AASHTO Eq. 8-60, with an assumed bar geometry ratio r/h of 0.3 and assumed minimum stress of 3.0 ksi. It should be noted that the ordinate of the figure is stress range on a linear scale, as traditionally used for fatigue of reinforcing bars, whereas the AASHTO fatigue categories for weldments are usually shown using the logarithm of stress range for the ordinate, and therefore the slopes of the lines vary in the finite-life region.
31

Stress Range (ksi) 40~~~~~~~~~~~~~~~~~~~~~~~~~~~~--,
Category A
30 Category B
20 Category C
Category E
10 AASHTO Provisions:
Table 10.3. lA
- Equation 8-60
Eq. 8-60
• No. 5 Bar
• No. 8 Bar
. c• •C
,G
•A* E ·A,
D .F ·H
B
OL-~~~-'-~~'----'~...1--'--'--'--"'--'-~~~~'--~~~-'-~~'--'~~
0.1 1
N, Number of Cycles (millions)
Fig. 13 - Comparison of lower 95-percent tolerance limits with AASHTO fatigue categories
(see Table 5 for definition of data point codes)
10
Stress Range (ksi) 40,.-~~~~~~~~~~~~~~~~~~~~~~~~~~~--.,
30
20
10
0 0.1
.No. 5 Bar
Eq. 8-60 . No. 8 Bar
. c• 18 ksi •C
,G • J
12 ksi ·A*,E ·A
.D Design Provisions: .F
'H
-Proposed Categories 4 ksi .B AASHTO Eq. 8-60 l,B
N, Number of Cycles (millions)
Fig. 14 - Comparison of lower 95-percent tolerance limits with proposed splice fatigue categories (see Table 5 for definition of data point codes)
32
10

TABLE S - ASSIGNMENT OF SPLICE TEST GROUPS TO PROPOSED SPLICE FATIGUE CATEGORIES
Test Group Proposed Category
Splice Type Bar Type Code3 (ksi)
No. 5 A 12 Cold-swaged steel coupling sleeve
No. 5, Epoxy A* 12
Two-piece cold-swaged steel coupling No. 5 B 4
sleeve with threaded ends No. 8 B 4
Grout-filled coupling sleeve No. 8 c 18
Epoxy-coated grout-filled coupling sleeveb No. 8, Epoxy C* 18
Steel-filled coupling sleeve No. 8 D 4
Tapered-threaded steel coupler No. 8 E 12
Straight-threaded coupler No. 8 F 4 (bar not upset at threads)
Steel coupling sleeve with wedge No. 5 G 12
Double-lap welded splice No. 8 H 4
Modified double-lap weld No. 5 I 4
Single-lap weld No. 5 J 4
Note: a) Code for cross-reference of data in Figs. 13 and 14. Asterisk (*) denotes splices fabricated with epoxy-coated bars.
b) From supplemental testing program, see Chapter 1.
Judging from the dispersion of the lower limits of the test groups, it appears reasonable to group the splices tested in this investigation into three proposed fatigue limit categories. In Fig. 14, lower limits from this investigation are compared with the proposed design fatigue limits, shown as the horizontal segments of the light, solid lines in the figure. Category assignments for splices from the present investigation are summarized in Table 5. The first category limit is established at a stress range of 18 ksi, or slightly greater than the allowable stress range for Category B for structural steel weldments. An intermediate category limit is established at 12 ksi, or slightly greater than the stress range for Category C. The lowest category limit is established at 4 ksi, or slightly less than the stress range allowed for Category E details.
The lowest limit of 4 ksi provides a lower bound to splice fatigue data from any source reviewed in this investigation. It also ties into the lowest category (except for E') of fatigue behavior for structural steel weldments, which should cover as severe a notch as will be found in structural elements. Therefore, it is believed that this limit is suitable for any splice that will carry 125 percent of the yield strength of the connected bars.
As discussed previously, it appears appropriate to permit an increase in the allowable stress range for splices in the finite-life region. Finite-life data from the present investigation, shown previously in Fig. 7c, indicate that 1 million cycles is a reasonable, approximate transition between finite-life and longlife fatigue behavior for splices. From NCHRP Project 4-7 (4), regression analysis on finite-life test data for unspliced reinforcing bars show that Log N eye is proportional to -0.0407 fp where Ncyc is number of cycles of loading and fr is the stress range in ks1. Taking the reciprocal of 0.0407 as approximately 24, a permissible incremental increase in stress range for a number of cycles less than 1 million is given by
33

the expression: 24 (6 - Log Ncyc)· The sloping segments of the light, solid lines m Fig. 14 were determined from this expression.
Categories for Splices Tested in This Investigation. Non-threaded mechanical connectors have been generally assigned to the two higher proposed categories. The relatively higher assignments may be at least partially attributed to the general observation that the transfer of forces between the reinforcing bar and some of these connectors occurs gradually over the length of the bar that is within the connector, resulting in a better fatigue performance. The grout-filled coupling sleeve, both with epoxy-coated and uncoated bars, presumably provides a reasonably gradual transfer of force, much like the bar-to-concrete force transfer in a concrete beam. This device correspondingly has a fatigue performance which justifies the proposed 18 ksi category. The transfer of forces in the cold-swaged coupling sleeve appears somewhat less gradual than that of a bar in concrete. This connector has a fatigue performance appropriate for the 12 ksi category, both with and without epoxy-coated bar. The transfer of forces in the steel coupling sleeve with wedge, when embedded in a concrete beam, also appears less gradual. Its fatigue performance is appropriate to the 12 ksi category. Transfer of force in the steel-filled coupling sleeve appears abrupt with a probable concentration of stress at the bar-tosleeve junction. The fatigue performance of this connector corresponds to the 4 ksi category.
Threaded mechanical connectors are generally assigned to the two lower proposed categories. It is commonly accepted that stress concentrations may occur at the root of threads, so a median to low fatigue performance can be anticipated for threaded devices. However, for the taper-threaded coupler, the tapering of the threads apparently reduces the peak stress at the root of any thread, and the test results indicate it may be assigned to the 12 ksi category. For the straight-threaded coupler with NC threads studied in this investigation, the bar is not upset at the threads. Consequently, the forming of threads reduces the net section of the bar at the threads, resulting in additional stress concentration. This device was placed in the 4 ksi category. The cross-section area of the two-piece cold-swaged steel coupling sleeve with threaded ends appears reduced through the threaded segment relative to the area of the unspliced bar. In turn, this again results in an increased stress concentration. The fatigue performance of this device also corresponds to the 4 ksi fatigue design category. As a point of comparison for these latter two threaded connectors, other research (23) indicates that AASHTO Category E appropriately represents the design fatigue performance of straight-threaded anchor bolts.
The details of the three lap-weld configurations tested as part of this investigation suggest a fatigue performance corresponding to Category E for structural steel, which has an allowable fatigue stress range of 4.5 ksi. Two of three weld configurations tested in the present investigation have a fatigue performance appropriate to the proposed 4 ksi category. The third configuration could be assigned to the 12 ksi category based on the test result, but because of the unexplained differences between the single-lap welded bars tested in beams and the double-lap welded bars tested in air, it is conservatively assigned to the 4 ksi category. Thus, all lap-weld joints have been assigned a 4 ksi fatigue design limit.
Adjustments to the fatigue limits to account for the effects of misalignment were discussed in Chapter 2. The adjustments generally resulted in small increases in fatigue limits. It is interesting to note that if category assignments were based on adjusted fatigue limits, no splice would be assigned to a category higher than the assignment listed for the splice in Table 5.
Categories for Other Common Splices. As discussed previously, this investigation has studied only a fraction of the many mechanical connectors and welded joints which may be available for use in a bridge structure. In a report by ACI Committee 439 (1), descriptions are provided for a number of proprietary mechanical connectors. A WS D-1.4 (3) gives design information for welded joints in reinforcing bars. The Concrete Reinforcing Steel Institute (2) also describes common weld configurations and proprietary mechanical connectors. Fatigue test data from investigations reviewed in Appendix A can assist in making fatigue category assignments for splices found in these references but not tested in the present investigation.
34

The cold-swaged sleeve with threaded ends is available in a three-piece configuration consisting of a stud with male threads on both ends and two female threaded sleeves. The sleeves are swaged to the reinforcing bar and the stud threads into the two sleeves, thereby completing the connection. A limited series of fatigue tests in concrete beams (21) included both standard cold-swaged coupling sleeves and three-piece cold-swaged sleeves with threaded ends. Fatigue performance was consistently lower for the three-piece swaged sleeve relative to the standard swaged sleeve. Therefore, the threepiece swaged sleeve is assigned to the 4 ksi fatigue limit category based on the available data.
The extruded steel coupling sleeve and the hot-forged steel coupling sleeve appear to transfer forces from bar to sleeve over a few bar lugs, much like the (unthreaded) cold-swaged steel coupling sleeve, suggesting possible assignments to the 12 ksi stress range category. However, if cooling of the hot-forged sleeve imparts a significant compressive, clamping force on the bar, an abrupt force transfer may take place, with the potential consequence of a decreased fatigue performance more closely associated with the 4 ksi category. It is pointed out that there are no supporting fatigue test data for either of these splices and, consequently, they are regarded to be splices with an unknown fatigue performance assigned to the 4 ksi category.
A coupler for thread-deformed reinforcing bar is available, and may be installed with or without jam nuts at the ends of the sleeve. If the geometry of thread deformations are similar to those of unspliced bar, then the fatigue performance of this device might be in the 12 ksi category. However, if the fit of the coupler to the thread is loose, then force transfer could be abrupt, with a fatigue performance corresponding to the 4 ksi category. In the absence of any supporting fatigue test data, this device also has an unknown fatigue performance and is therefore assigned to the 4 ksi category.
Taper-threaded couplers having two ends and a special integral collar connecting the ends are intended for use where the reinforcing bars cannot be turned when making the connection. Different versions of this device appear to be available from different manufacturers. The integral collars are straight-threaded and consequently may have the attendant stress concentrations. In the absence of fatigue test data supporting a higher fatigue limit, and again considering the fatigue performance of straight-threaded anchor bolts (23), these devices have been conservatively assigned to the 4 ksi category.
An integrally forged coupler with upset NC threads is available, where the components of the connector are manufactured directly from the reinforcing bar. Tests on a similar product manufactured in Europe ( 18) indicate that the fatigue performance of this device corresponds to the 12 ksi category. The upset of the bar at the threads presumably reduces stress concentrations.
A number of tests (9) have been run on single-V groove butt-welded splices which support assignment of these splices to the 12 ksi fatigue limit category. This assignment is compatible with the AASHTO (5) provision for fatigue of structural steel, which assigns any full penetration groove welded splice where reinforcement is not removed to Category C with an allowable fatigue stress range of 10 ksi for over 2 million cycles of load. Summary data found in the same test report (9) indicates that double-V groove welds, single-bevel welds, and an indirect butt splice made using an angle each had a reduced fatigue performance compared to the single-V groove butt weld. The reductions in performance were attributed to stress concentrations unique to each of these weld configurations. These later three configurations have been conservatively be assigned to the 4 ksi category.
Suggested Revisions to the AASHTO Specifications Pertaining to Fatigue Design of Splices
It is suggested that provisions for fatigue design of reinforcing bar splices be incorporated into Article 8.32.2, "Welded Splices and Mechanical Connections", found in Section 8 of Division 1 of the AASHTO Specification (5). It is recommended that Articles 8.32.2.1 and 8.32.2.2 be revised and that a new paragraph, Article 8.32.2.5, be added. The revised Article 8.32.2 would read as follows:
35

8.32.2 Welded Splices and Mechanical Connections
8.32.2.1 Welded splices or other mechanical connections may be used. Except as provided herein, all welding shall confirm to the latest edition of the American Welding Society publication, "Structural Welding Code - Reinforcing Steel." When the welded splice or mechanical connection does not maintain the collinear alignment of the axes of the reinforcing bars, consideration shall be given to reinforcing the surrounding concrete to prevent splitting caused by eccentric loading.
8.32.2.2 A full welded splice shall develop in tension at least 125 percent of the specified yield strength of the bar.
8.32.2.3 A full mechanical connection shall develop in tension or compression, as required, at least 125 percent of the specified yield strength of the bar.
8.32.2.4 Welded splices and mechanical connections not meeting requirements of Articles 8.32.2.2 and 8.32.2.3 may be used in accordance with Article 8.32.3.4.
8.32.2.S Welded splices and mechanical connections that are subject to repetitive loads shall meet the requirements of Article 8.32.2.2 or 8.32.2.3. In addition, the range of stress, fr, between a maximum tensile stress and a minimum stress in a reinforcing bar spliced by welding or by a mechanical connector caused by live load plus impact at service load shall not exceed:
Type of Splice
Grout-filled sleeve, with or without epoxycoated bar:
Cold-swaged coupling sleeve without threaded ends, and with or without epoxy-coated bar;
integrally-forged coupler with upset NC threads; steel sleeve with a wedge; one-piece taper-threaded coupler; and single-V-groove direct butt weld:
All other types of splices:
fr for greater than 1,000,000 cycles
18 ksi
12 ksi
4 ksi
except that, for total cycles of loading, N CfC' less than 1 million cycles, fr may be increased by the quantity 24 (6 - log Ncyc) in ksi to a total not greater than the value for fr given by Eq. 8-60 in Article 8.16.8.3. Higher values of fr, up to the value given by Eq. 8-60, may be used if justified to the satisfaction of the Engineer by fatigue test data on splices that are the same as those which will be placed in service.
36

It is also suggested that the following paragraph be added at the end of Article 8.16.8.3, "Fatigue Stress Limits":
Requirements for welded splices and mechanical connectors that are subject to repetitive loads are given in Article 8.32.2.5.
Commentary on the Suggested Specification for Fatigue Design*
The revisions to Article 8.32.2 are intended to incorporate into the AASHTO specifications the findings of NCHRP Project 10-35, "Fatigue Behavior of Welded and Mechanical Splices in Reinforcing Steel", in which an investigation of the finite- and long-life fatigue behavior of welded splices and mechanical connections in reinforcing bars was carried out.
Article 8.32.2.1. The requirements for joints with eccentricity from Section 3.2.1 of the American Welding Society (A WS) "Structural Welding Code - Reinforcing Steel" were incorporated into Article 8.32.2.1 and extended to cover mechanical connectors.
Article 8.32.2.2. The limitation of a "full welded splice" to only butt welded bars that was included in previous editions of the Specification was deleted. The purpose of this requirement is unknown, but it may have been an indirect consequence of concern about fatigue of other types of welded splices. It should be noted that Article 8.32.2.1 requires all welding of reinforcing bar splices to conform to the latest edition of the A WS Code, and that this Code limits lap welded splices to bar size No. 6 and smaller.
Article 8.32.2.4 It should be noted that Article 8.32.3.4 requires that the area of reinforcement provided is to be at least twice that required by analysis.
Article 8.32.2.5. Review of the available fatigue and static test data indicate that any splice which develops 125 percent of the yield strength of the bar, as required by Article 8.32.2.2 and 8.32.2.3, will sustain 1 million cycles of a 4 ksi constant amplitude stress range. This lower limit is a close lower bound for the splice fatigue data obtained in NCHRP Project 10-35, and it also agrees well with the limit of 4.5 ksi for Category E from the provisions for fatigue of structural steel weldments. The strength requirements of Articles 8.32.2.2 and 8.32.2.3 also will generally insure that a welded splice or mechanical connector will also meet certain minimum requirements for fabrication and installation such as sound welding and proper dimensional tolerances. Splices which do not meet these requirements for fabrication and installation may have a reduced fatigue performance. Further, splices designed to the lesser force requirements of Article 8.32.3.4 may not have the same fatigue performance as splices designed for the greater force requirement. Consequently, the minimum strength requirement indirectly provides for a minimum fatigue performance.
It was found in NCHRP Project 10-35 that there is substantial variation in the fatigue performance of different types of welds and connectors. However, all types of splices appeared to exhibit a constant amplitude fatigue limit for repetitive loading exceeding about 1 million cycles. The stress ranges for over 1 million cycles of loading given in the table in Article 8.32.2.5 are based on statistical tolerance limits to constant amplitude staircase test data, such that there is a 95 percent level of confidence that 95 percent of the data would exceed the given values for 5 million cycles of loading. These values may therefore be regarded as a fatigue limit below which fatigue damage is unlikely to occur during the design lifetime of the structure. This is the same basis as used to establish the fatigue design provisions for unspliced reinforcing bars in Article 8.16.8.3, which is based on fatigue tests reported in NCHRP Report 164, "Fatigue Strength of High-Yield Reinforcing Bars" (4).
*This section is written as a stand-alone explanation of the suggested revisions to Article 8.32.2 of the AASHTO Specification.
37

# •
A concern about the effect of epoxy coatings on the fatigue behavior of splices arises where the surfaces of the bars inside the splice are coated with epoxy, or the splice itself is coated with epoxy. Where epoxy-coated bars were tested in cold-swaged sleeves without threaded ends, fatigue strength was improved, possibly because blast-cleaning of the bar surfaces prior to coating reduced the roughness. There was only a small reduction in design fatigue strength for epoxy-coated bars tested in epoxy-coated grout-filled sleeves. Therefore it is believed that epoxy-coated bars may be used with these connectors. There are no fatigue test data for mechanical connections of epoxy-coated bars made by steel sleeves with a wedge, so this connector with epoxy-coated bars is not included in the specification at the present time. For welded splices, threaded couplings, and the steel-filled coupling sleeve, the epoxy coating is presumably removed from the surfaces of the reinforcing bars in and near the splice region before the splice is made. Consequently, the use of epoxy-coated bars is not an issue with these splices.
The stress range may be increased by the amount given by the expression 24 (6 - log Ncyc), if the expected number of cycles of loading, N c• is less than 1 million. This expression is based in part on the finite-life fatigue performance of unsi1iced reinforcing bars found in NCHRP Report 164, and in part on the observed but not well quantified finite-life fatigue performance of splices in NCHRP Project 10-35. After any increase, the total range of stress in the reinforcing bar at the splice may not exceed the value permitted by Eq. 8-60 of Article 8.16.8.3. Equation 8-60 generally permits a maximum stress range for reinforcing bars on the order of 19 to 26 ksi for common values of minimum stress and bar geometry. These stress ranges correspond to approximately 240,000 and 120,000 cycles of loading, respectively, for a splice with an allowable fatigue limit stress range of 4 ksi.
It is important to recognize that there is substantial variability in the fatigue strength of different types of splices. Thus there may very well be splices which now fall into the category of "All other types of splices" that can sustain higher stress ranges. The Engineer should consider fatigue test data on splices that support a higher value for the allowable range of stress. Considerations for performance testing of splices are discussed in the report on NCHRP Project 10-35.
Considerations for Fatigue Testing of Splices and Analysis of Data
The suggested additional Article 8.32.2.5 for the AASHTO specifications allows higher values of fr to be used if justified to the satisfaction of the Engineer by fatigue test data on splices that are the same as those which will be placed in service. It is recommended that the value of fr be based on fatigue tests carried out in the long-life region using a staircase test procedure, and that statistical tolerance limits to the data be established such that it is 95 percent probable that 95 percent of the data will fall between the limits. Consequently, at the lower tolerance limit stress range, there is a 95 percent level of confidence that it is 97.5 percent probable that a splice subjected to the lower tolerance limit stress range will survive 5 million cycles. The lower tolerance limit stress range may be taken as the value of fr for greater than 1 million cycles of loading, as implied in the suggested Article 8.32.2.5.
A reasonable minimum number of specimens for a staircase test series is about 12, excluding any initial tests required to obtain the initial reversal from a runout to a failure, or vice-versa. Tests should be carried out at a minimum .stress on the order of 2 to 6 ksi. Where scatter in the data is relatively large, continuing the staircase series beyond 12 specimens may be useful in obtaining a more accurate estimate of the standard deviation. This in turn assists in establishing a more accurate estimate of the lower 95-percent tolerance limit on the mean fatigue limit.
Statistical procedures for analysis of staircase test data (4,8) and determination of tolerance limits (14,15) are well established and described in detail in Appendix B. The staircase analysis procedure from Lipsom and Sheth (8) is as follows, with a sample calculation shown in Fig. 15. The staircase mean i is determined by using only failure data or only runout data, depending on which has the smaller total. The stress levels S, which are equally spaced with a chosen staircase stress interval d,
38
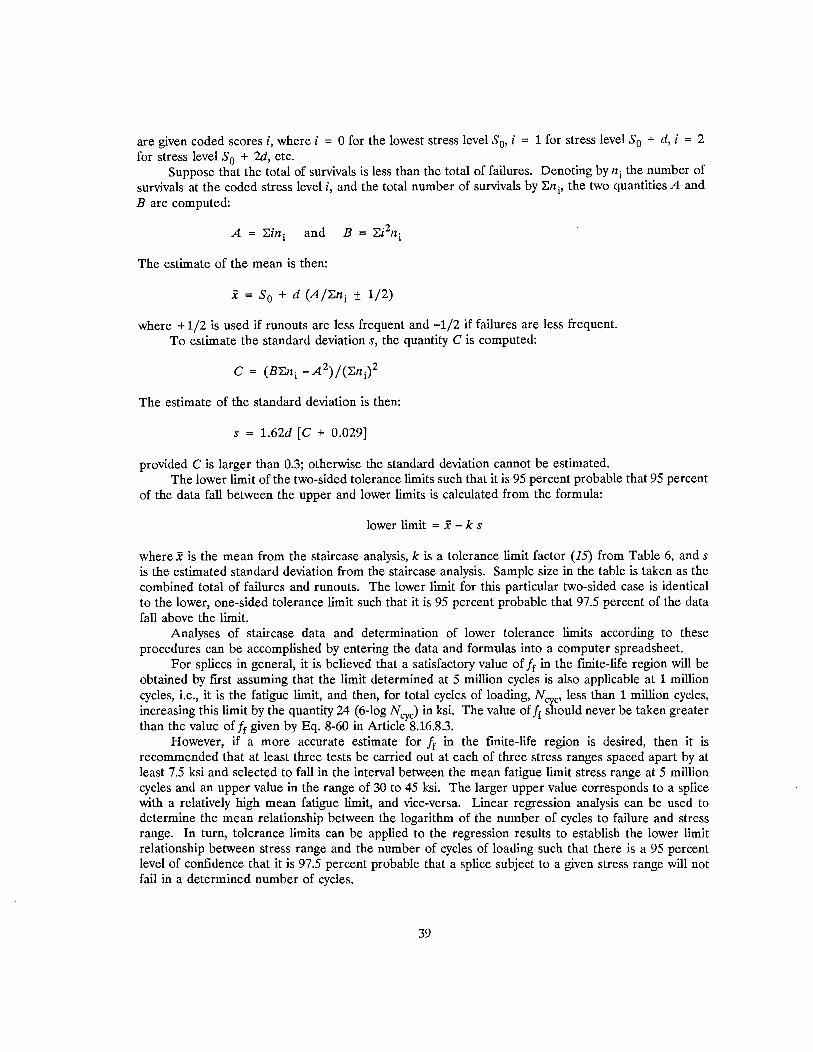
are given coded scores i, where i = 0 for the lowest stress level S 0, i = 1 for stress level S0 + d, i = 2 for stress level S0 + 2d, etc.
Suppose that the total of survivals is less than the total of failures. Denoting by ni the number of survivals at the coded stress level i, and the total number of survivals by 2:n i' the two quantities A and B are computed:
A = 2:ini and B
The estimate of the mean is then:
i = S0 + d (A/2:ni t 1/2)
where + 1/2 is used if runouts are less frequent and -1/2 if failures are less frequent. To estimate the standard deviations, the quantity C is computed:
The estimate of the standard deviation is then:
s = 1.62d [C + 0.029]
provided C is larger than 0.3; otherwise the standard deviation cannot be estimated. The lower limit of the two-sided tolerance limits such that it is 95 percent probable that 95 percent
of the data fall between the upper and lower limits is calculated from the formula:
lower limit = i - k s
where i is the mean from the staircase analysis, k is a tolerance limit factor (15) from Table 6, ands is the estimated standard deviation from the staircase analysis. Sample size in the table is taken as the combined total of failures and runouts. The lower limit for this particular two-sided case is identical to the lower, one-sided tolerance limit such that it is 95 percent probable that 97.5 percent of the data fall above the limit.
Analyses of staircase data and determination of lower tolerance limits according to these procedures can be accomplished by entering the data and formulas into a computer spreadsheet.
For splices in general, it is believed that a satisfactory value of fr in the finite-life region will be obtained by first assuming that the limit determined at 5 million cycles is also applicable at 1 million cycles, i.e., it is the fatigue limit, and then, for total cycles of loading, N eye' less than 1 million cycles, increasing this limit by the quantity 24 (6-log Ncyc) in ksi. The value of fr should never be taken greater than the value of fr given by Eq. 8-60 in Article 8.16.8.3.
However, if a more accurate estimate for fr in the finite-life region is desired, then it is recommended that at least three tests be carried out at each of three stress ranges spaced apart by at least 7.5 ksi and selected to fall in the interval between the mean fatigue limit stress range at 5 million cycles and an upper value in the range of 30 to 45 ksi. The larger upper value corresponds to a splice with a relatively high mean fatigue limit, and vice-versa. Linear regression analysis can be used to determine the mean relationship between the logarithm of the number of cycles to failure and stress range. In turn, tolerance limits can be applied to the regression results to establish the lower limit relationship between stress range and the number of cycles of loading such that there is a 95 percent level of confidence that it is 97.5 percent probable that a splice subject to a given stress range will not fail in a determined number of cycles.
39

Staircase test data for No. 5 unspliced bars:
Sequence Stress Range Number of Test Result Coded Score
Si Cycles Si - So i
1 33.0 1326000 Failure 3.0 -2 32.0 5000000 Runout 2.0 2 3 33.0 1029000 Failure 3.0 -4 32.0 2783000 Failure 2.0 -5 31.0 2846000 Failure 1.0 -6 30.0 5000000 Runout 0.0 0 7 31.0 2866000 Failure 1.0 -8 30.0 5000000 Runout 0.0 0 9 31.0 5000000 Runout 1.0 1 10 32.0 5000000 Runout 2.0 2 11 33.0 1301000 Failure 3.0 -12 32.0 2783000 Failure 2.0 -13 31.0 4750000 Failure 1.0 -14 30.0 5000000 Runout 0.0 0 15 31.0 2571000 Failure 1.0 -
Number of runouts = 6; number of failures = 9; total group size = 15
Lowest stress range = S0 = 30.0; stress interval = d = 1.0
Since runouts are fewer in number, use only runout data:
Compute mean:
L:ni = 3 + 1 + 2 = 6 A = L:ini = 0 • 3 + 1 el + 2 • 2 = 5
B = L:i2n. = 02 •3 + 12 •1 + 22 •2 = 9 I
i = S0 + d (A/L:ni + 1/2) = 30.0 + 1.0• (5/6 + 0.5) = 31.33
C = (BL:ni -A2)/(L:ni)2 = (9•6 - 52)/62 = 0.8055
Since C > 0.30, compute estimate of standard deviation:
s = 1.62d [C + 0.029] = 1.62• l.O• [0.8055 + 0.029] = 1.352
Compute Lower Limit:
Total group size = 15, :. tolerance limit factor k = 3.005 Lower limit = i - ks = 31.33 - 3.005 • l.352 = 27.27
Fig. 15 - Sample calculation for analysis of staircase data
40

TABLE 6 ·TOLERANCE LIMIT FACTORS
Sample Size Factor3 Sample Size Factor3 Sample Size Factor3
k k k
11 3.292 21 2.781 2 31.257 12 3.201 22 2.756 3 8.986 13 3.126 23 2.732 4 6.015 14 3.060 24 2.710 5 4.909 15 3.005 25 2.690
6 4.329 16 2.956 26 2.672 7 3.970 17 2.913 27 2.654 8 3.723 18 2.875 28 2.638 9 3.542 19 2.841 29 2.623 10 3.402 20 2.810 30 2.608
a) Two-sided tolerance limit factor for 95 percent probability that 95 percent of the data will fall between the limits.
Test specimens need to be fabricated from splicing materials that are the same as those expected to be used in service. Variability of data for the same type of splice used for different bar sizes may be expected. Usual fabrication practices and tolerances should be followed. Normal variations in materials and workmanship which may reduce fatigue performance should be considered. For example, during fabrication of some sleeve-type mechanical connectors, the longitudinal axes of the spliced bars may be offset from the longitudinal axis of the sleeve. The presence of the offset may introduce secondary bending stresses that can reduce the fatigue limit; consequently, the effect of variation of this offset should be considered.
Fatigue tests may be conducted on splices either in concrete beams or in air. For beam tests, determination of material properties, beam dimensions and reinforcement position is necessary in order to accurately calculate stress levels in the reinforcement. The splice should be placed in the center of a constant moment region in the middle of a test beam, and crack formers should be used at the ends and possibly the middle of the splice. Dynamic effects of the test beam must be considered.
Tests in air provide a conservative estimate of the in-beam fatigue performance of a splice. Where test specimens are carefully assembled, it appears that the effects of axial misalignment of the bars at the splice can be neglected without undue conservatism. The air test specimen should also be gripped in the test machine in a manner that minimizes secondary bending at the ends of the specimen.
41

CHAPTER FOUR
CONCLUSIONS AND RECOMMENDATIONS
This investigation of the fatigue behavior of welded splices and mechanical connectors for reinforcing bars included a review of pertinent literature, fatigue tests on 231 reinforcing bars and splices, a statistical analysis of the data and development of design provision for consideration by AASHTO. Grade 60 reinforcing bar in sizes No. 5 and No. 8, seven types of mechanical connectors and two types of welded splices were included in the fatigue tests. Fourteen test series were conducted in the long-life region of the S-N curve, which were intended to determine a fatigue limit at 5 million cycles. Four test series were conducted in the finite-life region, intended to determine fatigue performance characterized by failures occurring in the range of 100,000 to 1 million cycles.
Conclusions Regarding Fatigue Behavior of Reinforcing Bar Splices
L There is large variability in fatigue strength with type of splice. In this investigation, grout-filled coupling sleeves exhibited the highest fatigue strength, while welded splices and two-piece cold-swaged sleeves with threaded ends exhibited the lowest.
2. For any one type of splice subjected to cyclic stresses, the range of the stress cycle is the predominant factor determining the fatigue life of the splice.
3. Under constant-amplitude stress cycles, splices exhibit a fatigue limit stress range below which they will sustain a virtually unlimited number of cycles from a practical point of view. Above the fatigue limit, the fatigue life decreases from about 1 million cycles with increasing stress range.
4. In this investigation, the fatigue life of a spliced bar was always less than the fatigue life of an unspliced bar of the same size. However, this may not always be the case: if the reinforcing bar has a relatively poor fatigue performance, then the spliced bar and unspliced bar may have the same fatigue performance.
5. The location of fatigue fracture varied with type of splice. Non-threaded mechanical splices most often fractured through the reinforcing bar at the connector, threaded mechanical splices fractured through the threads at the first engaged thread, and welded splices through the reinforcing bar at a weld termination. Some mechanical splices, however, fractured through the connector itself.
6. Use of epoxy-coated bars with cold-swaged sleeves without threaded ends improved the fatigue performance.
7. Although data are limited, it is believed that any effect of bar size on fatigue behavior of any one type of splice is primarily due to variation of details and dimensions of the splice relative to bar diameter. Consequently, this effect varies with type of splice and may cause either an increase or decrease in fatigue performance with increasing bar size. However, these effects generally appear to be negligible for design purposes.
8. Although not a variable in this investigation, from the review of literature it is believed that minimum stress has a small effect on fatigue behavior and is negligible for design purposes.
9. Axial tension fatigue tests in air provide a conservative estimate of the fatigue limit of splices in concrete beams.
10. Although not tested in this investigation, data found in the review of literature indicate that the fatigue performance of conventional straight lapped bar splices is not reduced in comparison to the fatigue performance of unspliced reinforcing bars. However, where one of the bars in the splice is bent at the start of the lap, fatigue performance appears to be significantly reduced.
42

Recommendations for Future Research
As discussed at some length in the section "Discussion of Results-Effect of Method of Testing" in Chapter 2, a large difference in fatigue strength was observed between single-lap welded splices of No. 5 bars in a concrete beam (15.6 ksi design fatigue limit) and a double-lap welded splice of No. 8 bars with No. 5 side bars (3.9 ksi limit) tested in air. Whether the difference was due to secondary bending effects of the double-lap splices tested in air, partial transfer of forces through the surrounding concrete in the single-lap splices tested in a concrete beam, or other reasons was not resolved. To be conservative, a design stress range of 4 ksi for over 1 million cycles was suggested for all welded splices, except the single V-groove direct butt weld. Since the single-lap welded splice may be useful in some bridge rehabilitation projects, further investigation of this type of splice appears to be desirable. Such investigation should be carried out on splices embedded in concrete beams.
It was found that the use of epoxy-coated bars improved the fatigue strength of splices made with grout-filled coupling sleeves or cold-swaged coupling sleeves. Another type of splice that is well-suited for use with epoxy-coated bars is the steel sleeve with wedge. Because these sleeves are usually shorter in length and use a different force transfer mechanism than grout-filled or cold-swaged sleeves, it is not clear whether the fatigue performance of steel sleeve with wedges would be affected by epoxy-coated bars. Further investigation of this condition, which must be done on splices embedded in concrete beams, also appears to be desirable.
As pointed out at the beginning of Chapter 3, considering that there are multiple manufacturers for some type of splices as well as variation in types of splices produced by the same manufacturer, samples of roughly one-fourth to one-third of the available types of splices were tested in this investigation. Whereas testing additional types of connectors may be worthwhile, mechanical connectors are proprietary and are therefore subject to modification by the manufacturer. Indeed, it is believed that many of the connectors with a design stress range of 4 ksi for greater than 1 million cycles of loading may qualify for a 12 ksi design stress after redesign of connector elements. Therefore, manufacturers will probably undertake more testing to justify higher bar stress ranges for their splices.
At the same time, the only present prescriptive requirement on a welded splice or mechanical connector is that it carry 125 percent of the yield strength of the bar, which is not sufficient to assure good fatigue performance. Research that might allow additional prescriptive requirements to be placed on various types of splices may be desirable. For example, the grade and quality of steel in a connector, level of stress or stress range in the splice material, elastic and inelastic deformations across the splice, and geometry of details of all the types of splices might be specified for the purpose of obtaining good fatigue· performance as well as good static performance. Development of a general specification for reinforcing bar splices, encompassing these and other requirements, may be a worthy undertaking.
All of the testing in this investigation was carried out using a constant amplitude cyclic loading. Fatigue investigations with variable-amplitude cyclic loading have shown that a fatigue limit does not exist for structural steel when some of the stress cycles exceed the constant-amplitude fatigue limit. Further investigation of whether and under what conditions a variable amplitude cyclic loading could adversely affect the fatigue strength of reinforcing bar splices should be considered.
Some types of splices not tested in this investigation were assigned, on the basis of fatigue test data from other investigations, to a proposed fatigue design limit greater than 4 ksi. These other investigations usually studied fatigue behavior at less than 2 million cycles, whereas the proposed design categories were developed from 5 million cycle fatigue limits from this investigation. Further investigation of these other splices for long-life fatigue performance at 5 million cycles may be appropriate for those commonly used in fatigue applications.
The sizes of reinforcing bar used with splices in this investigation were No. 5 and No. 8. Most other fatigue investigations on splices also used specimens in the same range of bar size. An effect of bar size on fatigue appears to exist, although the effect seems small. While it is believed that this range
43

of bar size also covers most splices subjected to fatigue loadings, fatigue tests of larger splices should be considered.
As noted previously, a limited number of fatigue tests on conventional lapped bar splices were encountered during the review of literature. The data suggest that the fatigue strength of lapped splices made with straight bars is similar to that of unspliced bar, but that where one of the bars is bent at the lap, fatigue strength is significantly reduced. All of this test data came from outside North America, and much of the data is for less than 2 million cycles. Fatigue tests of lap splices designed according to AASHTO standard practices are desirable.
Concluding Remarks
Use of mechanical connectors is increasing in bridge rehabilitation projects. There continues to be circumstances where use of welded splices is desirable. This investigation has substantially increased the amount of information that is available on the fatigue behavior of welded and mechanical splices in reinforcing steel. Bridge engineers should have increased confidence about the use of splices in members subject to repetitive loadings.
44

REFERENCES
1. ACI Committee 439, "Mechanical Connections of Reinforcing Bars." ACI 439.3R,ACI Stntctural Journal, V. 88, No. 2 (March-April 1991) pp. 221-237.
2. Reinforcement Anchorages and Splices, 3rd edition, Concrete Reinforcing Steel Institute, Schaumburg, Illinois (1991).
3. "Structural Welding Code - Reinforcing Steel." 3rd edition, AWS Dl.4-79, American Welding Society (1979) 35 pp.
4. Helgason, T., Hanson, J.M., Somes, N.F., Corley, W.G., and Hognestad, E., "Fatigue Strength of High-Yield Reinforcing Bars." NCHRP Report 164 (1976) 90 pp.
5. AASHTO Subcommittee on Bridges and Structures, "Standard Specifications for Highway Bridges," 14th edition, 1989, as amended by "Interim Specifications - Bridges," 1990. American Association of State Highway and Transportation Officials, Washington, DC (1991) 394 pp.
6. ACI Committee 318, "Building Code Requirements for Reinforced Concrete (ACI 318-89) and Commentary - ACI 318R-89." American Concrete Institute, Detroit (1989) 353 pp.
7. Little, R.E., Manual on Statistical Planning and Analysis for Fatigue Experiments, ASTM Special Technical Publication 588, American Society of Testing and Materials (1975).
8. Lipson, C., and Sheth, N.J., Statistical Design and Analysis of Engineering E'Cperiments, McGrawHill, New York.
9. Sanders, W.W., Jr., Hoadley, P.G., and Munse, W.H., "Fatigue Behavior of Welded Joints in Reinforcing Bars for Concrete." The Welding Journal, V. 40, No. 12, Research Supplement (December 1961) pp. 529-s to 535-s.
10. Pasko, T.J., Jr, "Effect of Welding on Fatigue Life of High-Strength Reinforcing Steel Used in Continuously Reinforced Concrete Pavements." Report No. FHWA-RD-72-32, FHW A, Washington, D.C. (November 1971) 49 pp.
11. Little, R.E., "Estimating the Median Fatigue Limit for Very Small Up-and-Down Quantal Response Tests and for S-N Data with Run-outs", Probabilistic Aspects of Fatigue, ASTM STP 511, American Society for Testing and Materials (1972) pp 29-42.
12. Dixon, W.J., "The Up-and-Down Method for Small Samples", Journal of the American Statistical Association, Vol. 60, No. 312, American Statistical Association (1965) pp. 967-978.
13. Dixon, W.J., and Mood, A.M., "A Method for Obtaining and Analyzing Sensitivity Data", Journal of the American Statistical Association, Vol. 43, American Statistical Association, Washington, D .C. (1948) pp. 109-126.
14. Natrella, M.G., Experimental Statistics, NBS Handbook 91, National Bureau of Standards (1963).
45

15. Odeh, R.E., and Owen, D.B., Tables for Nonna! Tolerance Limits, Sampling Plans, and Screening, Marcel Dekker, New York (1980).
16. Paulson, C., and Hanson, J.M., "Fatigue Tests of Epoxy-Coated NMB Splice Sleeve Splices for Splice Sleeve North America." Unpublished report, WJE No. 890734, Wiss, Janney, Elstner Associates, Inc., Chicago, Illinois (December, 1991) 20 pp.
17. Walls, J.C., Sanders, W.W., and Munse, W.H., "Fatigue Behavior of Butt-Welded Reinforcing Bars in Reinforced Concrete Beams." Journal of the American Concrete Institute (February 1965) pp. 169-192.
18. "Zulassungsversuche mit dem Halfen-Bewehrungs-Schraubanschluss Typ HBS, Halfeneisen GmbH u. Co." ("Approval Tests for Threaded Reinforcing Connection Type HBS for Halfeneisen and Co."). Unpublished report, Forschungs und Materialprufungsanstalt Baden-Wurttemberg (FMP A), Stuttgart, Germany (June 6, 1987) 40 pp.
19. Soretz, S., "The Influence of Welds on the Fatigue Strength of Ribbed-TORSTEEL 50." Tor-Isteg Steel Corporation, Luxembourg (April 1982) 49 pp.
20. Tassi, G., and Magyari, B., "Fatigue of Reinforcements with Pressed Sleeve Splices." Proceedings of IABSE C'.:olloquium on Fatigue of Steel and Concrete Structures, Lausanne, IABSE Reports, Vol. 37 (1982) pp. 265-272.
21. Bennett, E.W., "Fatigue Tests of Spliced Reinforcement in Concrete Beams." Fatigue of Concrete Structures, Publication SP-75, American Concrete Institute, Detroit (1982) pp. 177-194.
22. Davies, C.M., and Austen, l.M., "The Fatigue Performance of Reinforced Concrete Beams." Contractor Report 53, Transportation and Road Research Laboratory, Crowthorne, Berkshire, England (1987) 29 pp.
23. Frank, K.H., "Fatigue Strength of Anchor Bolts", Journal of the Structural Division, Vol. 106, No. ST6, American Society of Civil Engineers, New York (June 1980) pp. 1279-1293.
24. Holzenbein, H., and Soretz, S., "Contribution to the Behavior of Lapped Splices in Reinforcement Bars". Tor-Isteg Steel Corporation, Luxemborg (May 1974) 42 pp.
25. ACI Committee 215, "Considerations for Design of Concrete Structures Subjected to Fatigue Loading", ACI 215.3R-74 (revised 1986), AC! Manual of Concrete Practice, Part 1, American Concrete Institute, Detroit (1987) 25 pp.
26. "Recommendations for Fundamentals in Design and Fabrication of Joints in Reinforcing Bars" and "Recommendations for Evaluation of Joints in Reinforcing Bars." Japan Society of Civil Engineers (December 1981) pp. 187-208.
27. "Specification for Deformed and Plain Billet-Steel Bars for Concrete Reinforcement", Designation: A 615-87a. Annual Book of ASTM Standards, Vol. 01.04. American Society of Testing and Materials (1988).
28. Cox, C. Philip, A Handbook of Introductory Statistical Methods, John Wiley and Sons, New York (1987). 272 pp.
46

29.
30.
31.
32.
33.
34.
35.
36.
37.
38.
39.
40.
41.
42.
Hanson, J.M., "Design for Fatigue", Handbook of Stntctural Concrete, Chap. 16. McGraw-Hill (1983) pp. 16-1 to 16-35.
Gamble, W.L., "Fatigue Tests of Dayton Bar Splice Threaded Couplers." For Dayton Barsplice, Inc., Dayton, Ohio, (November 1980) unpublished.
"Report of Fatigue Te~t on NMB Splice Sleeve." Murta Laboratory, Department of Civil Engineering, Tokyo Metropolitan University (undated) unpublished.
"Fatigue Strength of Reinforced Concrete Beam with Mortar Filled Splices." Japan Society of Civil Engineers (undated) unpublished.
Barone, M.R., Cannon, J.P., and Munse, W.H., "Fatigue Behavior of Welded Reinforcement in Reinforced Concrete Beams." Civil Engineering Studies, Structural Research Series No. 407, Illinois Cooperative Highway Research Program Series No. 149, Univ. of Illinois, Urbana (May 1974) 161 pp.
"Present Status of Gas Pressure Welding Technology for Reinforcing Bars in Japan." Japan Pressure Welding Society (1983) 13 pp.
Yong, P.M.F., "The Performance of CCL Splices for Grade 380 Bars Under Cyclic Loading." Report 5-85/11, Central Laboratories, Ministry of Works and Development, Lower Hutt, New Zealand, (April 1985) 77 pp.
Yong, P.M.F., "The Performance of NMB Splices for Grade 380 Bars Under Cyclic Loading." Report 5-85/9, Central Laboratories, Ministry of Works and Development, Lower Hutt, New Zealand (April 1985) 66 pp.
Yong, P.M.F., "The Performance of Cadweld Splices for Grade 380 Bars Under Cyclic Loading." Report 5-85/10, Central Laboratories, Ministry of Works and Development, Lower Hutt, New Zealand (April 1985) 80 pp.
"Code of Practice for the Design of Concrete Structures." NZS3103, Standards Association of New Zealand, Wellington, New Zealand (1982).
Jacks, D.H., "Study of a Rebar Splice Test Procedure." Report 5-85/18, Central Laboratories, Ministry of Public Works and Development, Lower Hutt, New Zealand (July 1985) 110 pp.
Sagen, V.E., Gergely, P., and White, R.N., "The Behavior and Design of Noncontact Lap Splices Subjected to Repeated Inelastic Tensile Loading." Report 88-6, Department of Structural Engineering, School of Civil and Environmental Engineering, Cornell University (August, 1988) 150 pp.
French, C.W., Hafner, M., Jayashankar, V., "Connections between Precast Elements -- Failure within Connection Region." Joumal of Stntctural Engineering, Vol. 115, No. 12, American Society of Civil Engineers (December 1989) pp. 3171-3192.
"Standard Test Methods and Definitions for Mechanical Testing of Steel Products", Designation: A 370-86a. Annual Book of ASTM Standards, Vols. 01-01-01.05. American Society of Testing and Materials (1989).
47


APPENDIX A
REVIEW OF LITERATURE
It is implicit that the fatigue behavior of reinforcing bars is relevant to any study of the fatigue behavior of the splices which connect the bars. Many hundreds of fatigue tests have been carried out on reinforcing bar specimens and are reported in the literature. The effects of such parameters as stress range, minimum stress, size of bar, grade of steel and deformation geometry have been determined through test programs and statistical studies and can be considered well known.
In comparison to unspliced reinforcing bars, published information directly related to the fatigue behavior of mechanical and welded splices is very limited. Fewer than 40 individual tests of mechanical splices and about 100 tests of welded splices are reported in published literature. A limited number of fatigue tests of conventional lapped bar splices were also found in the published literature. Unpublished reports were obtained, however, that present data on about 140 mechanical splices tests, of which about 80 are tests of one particular splice type.
A detailed description of various proprietary, mechanical splices is given by ACI Committee 439 (1). Design criteria for welded splices is given in AWS Dl.4 (3). Reinforcing bar splices, including lapped bar splices, mechanical splices, and welded joints, have also been catalogued by the Concrete Reinforcing Steel Institute (CRSI) (2).
Fatigue of Unspliced Reinforcing Bars
A comprehensive report by Helgason, et. al. ( 4) in NCHRP Report 164 contains an extensive review of literature published before the early 1970s and also presents the results of a major test program studying fatigue of reinforcing bars. ACI Committee 215 also published a state-of-the-art report in 197 4 (25) that contains an in-depth review of literature on fatigue of reinforcing bars. Another more recent review was presented by Hanson (29).
The test program reported in NCHRP Report 164 is most relevant in terms of serving as a benchmark for assessing the performance of splices. This factorial experiment evaluated several parameters, including stress range, minimum stress, bar diameter, type of specimen, grade of bar, and bar geometry (i.e. the geometry of the rolled-on transverse lugs and longitudinal ribs). Bars made by five major U.S. manufacturers were included. The tests confirmed that stress range and bar geometry are the primary factors determining fatigue life (i.e., number of cycles to failure).
As reported inNCHRP Report 164, and in other investigations, there is a finite-life region in which fatigue life increases with decreasing stress range, up to one to two million cycles. In this region, the relationship between the logarithm of fatigue life and stress range appears to be linear. Beyond one to two million cycles, there is a limiting stress range below which a reinforcing bar is apparently able to sustain a virtually unlimited number of constant stress cycles. In this long-life region, the magnitude of this fatigue limit depends upon the lug geometry of the reinforcing bar and the minimum stress level of the stress cycle.
Stress concentrations occur at the juncture of the transverse lugs (and the manufacturer's bar mark) with the barrel of the bar. A primary measure of this concentration is the ratio of the radius at the base of the deformation to its height. The severity of the concentration decreases with an increasing ratio; thus, the fatigue limit increases with increasing ratio.
In the tests reported in NCHRP Report 164, minimum stress had a small effect on fatigue behavior. In the finite-life region, increasing minimum stress decreased fatigue life. In the long-life region, increasing the minimum stress reduced the fatigue limit. Bar diameter and grade of bar were also found to influence the finite-life fatigue behavior, but a long-life effect for these parameters was not
A-1

established. Increasing bar size resulted in a decrease of fatigue life, because of the effect of the strain gradient in a beam.
Representative Equations. Data from NCHRP Report 164 was evaluated statistically by regression analyses (4) to arrive at formulas representing the finite-life and long-life mean fatigue behavior of unspliced reinforcing bars. Simplifying the results of the regression for mean fatigue life in the finite-life region by neglecting the effects of yielding and representing the bar diameter squared terms by the bar area, the following equation was developed:
in which:
log N = 6.4548 - 0.0407 fr - 0.0138 /min
logN = fr /min
+ 0.0071/u - 0.0566A 5 + 0.3233 D(r/h)
logarithm of number of cycles to failure stress range, in ksi
(A-1)
minimum stress of the stress cycle (tensile stress positive, compressive stress negative), in ksi tensile strength, in ksi bar area, in square inches bar diameter, in inches ratio of base radius to height of rolled-on deformation
A formula for the mean fatigue limit stress range as a function of r/h was also developed, but is not repeated here since the investigators felt that the formula "would place undue emphasis on the effect of bar geometry because the effects of other potential influencing factors such as minimum stress level and yield strength could not be considered [due to limited test data]".
Formulas representing the lower tolerance limit (at a 95 percent probability that 95 percent of the data will fall between the upper and lower limits) for both the fatigue limit in the long-life region and the design fatigue life in the finite-life region were also established. For the fatigue limit in the long-life region:
fr = 20.8 - 0.339 /min + 7.94 (r/h) (A-2)
in which the terms are the same as for Eq. A-1. For stress ranges above the fatigue limit (that is, in the finite-life region):
log N = 6.1044 - 0.0407 fr - 0.0138 f min + 0.0071/u - 0.0566A5 + 0.3233 D(r;1t) (A-3)
in which the terms are the same as for Eq. A-1. Comparisons showed that Eqs. A-2 and A-3 also were reasonable lower limits for previously
reported test data. Thus, simplified forms of Eqs. A-2 and A-3 were recommended for design purposes. It is important to keep in mind, however, that there is a wide variety of bars on the market, and that any particular manufacturer's reinforcing bar may have a fatigue performance differing somewhat from that indicated by Eqs A-1, A-2 and A-3.
A-2

Fatigue of Spliced Reinforcing Bars
In total, approximately 180 tests have been reported on specimens of five different types of splices: cold-swaged steel coupling sleeves (20,21,22,30), grout-filled coupling sleeves (16,31,32), integrally-forged couplers with standard rolled threads on upset bars (18), straight-threaded couplers (22), and taperthreaded couplers (22). Included are both axial tension specimens tested in air (18,20,21,30) and flexural tension specimens embedded in beams (21,22,32). The data, however, are dominated by tests of integrally-forged couplers (18) which were tested as axial tension specimens in air.
Reports of fatigue tests of welded splices in reinforcing steel (9,17,19,33,34) are also limited. However, these studies tend to be more comprehensive than most studies of mechanical splices in terms of both numbers of specimens tested and parameters varied in the experiments.
Only 25 fatigue tests of conventional lapped splices were found in the published literature (21,22,24). However, the review of literature did not explicitly search for such tests.
The names given in this report for proprietary mechanical splices are the same generic names as used by ACI Committee 439 (1). Names given to welded splices are generally taken from A WS Dl.4 (3) or CRSI (2).
Basis of Comparison. Equations A-1, A-2, and A-3 are used as a basis of comparison and evaluation of the available splice fatigue data. These three equations are illustrated in Fig. A-1 for the specific case of Grade 60, No. 8 bars with a minimum stress of 6 ksi and an r/h ratio equal to 0.3. Equation A-1, drawn as a dashed line, represents the mean fatigue life. Equations A-2 and A-3, the fatigue limit and design fatigue life, respectively, are together represented by the heavy solid line and are identified as the "Design Limits".
Most test reports give the stress levels and some measured or nominal steel properties. Thus, all parameters for the three equations are typically known except for the ratio r/h. In the following discussions, the graphs of Eqs. A-1, A-2 and A-3 are adjusted according to the measured or nominal values of the known parameters. A value of 0.3 was used for the ratio r/h, as recommended in NCHRP Report 164 (4).
For axial tension specimens tested in air, the effect of gripping the specimen is notable. Gripping may cause a stress concentration or induce a secondary bending stress due to misalignment, causing a premature failure. In the following review, data representing fractures which occurred in the grip are excluded except where otherwise indicated.
Cold-Swaged Steel Coupling Sleeves. A large body of fatigue data pertaining to cold-swaged steel coupling sleeves appears to have been developed by Tassi and Magyari (20). Their report indicates that several configurations of axial tension specimens were tested in air. However, data are given only for six specimens of one specific configuration. The data, shown in Fig. A-2, are for cold-swaged sleeves connecting 22 mm, B 60.40 bars (7 /8 in. diam. bar, with specified tensile strength of 87 ksi and yield strength of 58 ksi). Two failures occurring in the bar at the test machine clamping head are not included. Three of the four points in the figure were reported as "failure in the bar". It is not clear whether this phrase means a fracture in the free length of the bar, or a fracture in the bar at the entrance to the sleeve. The fourth failure, occurring at the highest stress range, was reported as "failure in the sleeve". Again, it is not clear whether this refers to fracture of the sleeve or instead refers to a fracture in the bar at the entrance to the sleeve. When compared with the curves which represent the fatigue behavior of unspliced bars, also shown on Fig. A-2, the data tend to fall close to the design life and below the fatigue limit for unspliced bars. It should be kept in mind that the specimens were fabricated using European bars, whereas the reference lines are based on test data from bars made in the United States.
Bennett (21) has reported fatigue tests of cold-swaged steel coupling sleeves embedded in rectangular beam specimens. Ten beams were tested, each containing two spliced 25 mm (1 in. diam.)
A-3

bars presumably of European origin with a characteristic (yield) strength of 425 N /mm2 (61.6 ksi). Four beams contained cold-swaged steel coupling sleeves, four beams contained three-piece cold-swaged steel coupling sleeves with threaded ends, one beam contained lap splices with cranked bars and one beam contained lap splices with straight bars. The reported stress levels " ... were calculated by the elastic theory ... "
Data for the eight beams with swaged splices are shown in Fig. A-3 along with the reference fatigue curves. Fractures occurred in the reinforcing bars at the entry to the sleeve, except for one three-piece threaded swaged coupling sleeve which fractured in the threaded link between the two swaged-on fittings at about 750,000 cycles. Tests on three specimens were terminated at about four million cycles without failure (i.e., runouts). The data for the standard (unthreaded) swaged coupling sleeve tend to fall along the mean fatigue life line, whereas data for the three-piece threaded coupling sleeves tend to fall below the reference fatigue limit.
It was noted for one beam that the loading during the initial cycle was greater than the loading for the repeated cycles. This suggests that, for the other specimens, crack patterns, and thus stresses in the bars, may not have been stable during cyclic loading. Greater beam deflections and crack widths were noted for the beams with the threaded coupling sleeves, indicating that stress ranges may not have been accurately estimated for these splices.
A series of fatigue tests (22) were carried out on concrete beams containing unspliced bars, conventional lapped bar splices, and three types of mechanical connectors, including cold-swaged sleeves. Data for the swaged splices are compared in Fig. A-4 with data for unspliced bars from the same investigation. (Data for the other types of splices will be discussed later.) Reference fatigue curves for the unspliced bar are not shown because bar properties were not given in the report. Fatigue strength of 20 mm splices approaches that of the unspliced bar, whereas the fatigue strength of larger diameter bars is less than unspliced bars.
In an unpublished report, Gamble (30) tested in axial tension four specimens fabricated from Grade 60, No. 11 bars with two-piece cold-swaged steel coupling sleeves with threaded ends. The bars were obtained from two different sources. For the two specimens fabricated using bars from the first manufacturer, testing of one specimen was halted at 118,000 cycles without failure, while the other specimen failed in the test machine clamping head. The two specimens fabricated using bars from the second manufacturer failed in the bar at entry to the swaged sleeve. The data, excluding the failure which occurred in the clamping head, are shown in Fig. A-5.
Grout-Filled Coupling Sleeves. An unpublished report (31) presents data from axial tension fatigue tests conducted in Japan on eight bars spliced with grout~filled coupling sleeves. Specimens were fabricated using SD35 D25 bars having a specified yield of 35 kg/mm2 (49.8 ksi) and a diameter of 25 mm (1 in.). Static tests indicated a tensile strength of 60 kg/mm2 (85 ksi) for companion unspliced bars. Six test specimens fractured in the reinforcing bar inside the sleeve, one specimen fractured in the test machine grip, and one specimen did not fail after about 2 million cycles. The test data, plotted in Fig. A-6, tend to fall along the expected mean life curve for unspliced bars as estimated from Eq. A-1.
Test of two rectangular beams, one with unspliced bars and one with bars spliced by grout-filled coupling sleeves, were reported by the Japan Society of Civil Engineers (32). The specimens contained SD35 D19 bars having a specified yield of 35 kg/mm2 (49.8 ksi) and a diameter of 19 mm (3/4 in.). No tabular data for stress range or fatigue life are given, although it appears that the specimens were tested to fatigue failure.
Axial tension tests have also been conducted on 13 epoxy-coated, No. 8, Grade 60 reinforcing bars spliced with epoxy-coated, grout-filled coupling sleeves (16). The tensile strength of the bars was 110 ksi. The bars were from the same lot of steel used in the tests reported herein in Appendix B and the test procedures were also similar to those reported in Appendix B. Five fatigue test specimens fractured transversely through the middle of the coupling sleeve, one specimen fractured through the bar at the end of the sleeve, and seven specimens did not fail in fatigue after 5 million cycles or more.
A-4

The test data, shown in Fig. A-7, tend to fall on or above the expected mean life for unspliced bars as estimated from Eq. A-1.
Threaded Couplers. Approximately 85 specimens of an integrally-forged coupler with upset threads were tested in fatigue (18). Specimens were fabricated from BSt SOOS (yield strength of 560 N/mm2 or 81.2 ksi; tensile strength of 610 N/mm2 or 88.5 ksi) hot rolled reinforcing bar in diameters of 12, 16, 20 and 25 mm (1/2, 5/8, 3/4 and 1 in.), with most data pertaining to splices joining bars of 12 and 25 mm diameter. Data for the 12 and 25 mm specimens are shown in Figs. A-8 and A-9, respectively, along with fatigue design stress range limits of 11.6 and 14.5 ksi, respectively, for the two bar sizes. The fatigue limits shown on the figures apparently were probabilistically derived from the test data based on a 2 million cycle fatigue limit.
A series of fatigue tests (22) were carried out on concrete beams containing unspliced bars, conventional lapped bar splices, and three types of mechanical connectors, including two types of threaded couplers. Data for straight-threaded couplers are shown in Fig. A-10 and data for taperthreaded couplers are shown in Fig. A-11. Also shown on the figures are data for unspliced bars from the same investigation. Reference fatigue curves for the unspliced bar are not shown because bar properties were not given in the report. For straight-threaded splices, the fatigue strength of splices for 20 mm bars approaches that of the unspliced bar, whereas the fatigue strength of larger splices is less than that of the unspliced bar. With taper-threaded splices, however, the fatigue strength of 20 mm splices consistently exceed that of the unspliced bar. This unusual observation was attributed in the report to actual stresses being lower than calculated stresses for that series of specimens.
Welded .Joints. Tests have been conducted at the University of Illinois (9,17,33) on four welded splice configurations fabricated from intermediate grade No. 7 bars with a tensile strength of 80 ksi. The four configurations were: 60 deg. single-V butt weld; 60 deg. double-V butt weld; 45 deg. single-V butt weld; and an indirect butt splice made by fillet welding the bars to an angle. Specimens were tested both in axial tension in air and in flexural tension in beams.
Results from axial tension tests in air on all four splice configurations are reported by Sanders, Hoadley and Munse (9). The splice region for several of the direct butt splices using 60 deg. single-V welds was encased in a small rectangular concrete block, some with a pre-formed crack at the weld location and some without. The mean fatigue lives reported for the various weld types and also for the unspliced bar subject to uniform stress cycles from 2 to 28 ksi are shown in Fig. A-12. It was stated that the seemingly beneficial effect of concrete encasement could be attributed to two factors:
· • In the specimens without crack formers," ... none of the specimens developed a crack within 3 in. of the weld, thus allowing the concrete to pick up some of the load from the deformed bar and transmit it across the critical weld section. Also, a lowering of the actual mean stress in the bar may have been caused by shrinkage forces in the concrete block".
• The cement mortar in the concrete may fill up the irregularities at the weld, giving a more uniform transition from the parent metal to the weld metal.
Test data were given for the cases of the unspliced bars and the unencased direct butt splice using 60 deg. V-groove welds. The data may be divided into three groups based on test stress levels: minimum stress near zero to some maximum tension stress ("zero-to-tension", stress ratio fmin/fmax = 0.0, nominal/min = 2 ksi), full reversal of stress where the magnitudes of the tension and compression stresses are equal ("tension-compression", stress ratio fmin/fmax = -1.0, average f min = -17 ksi), and a stress cycle completely in tension with the minimum stress at half the magnitude of the maximum stress ("1/2 tension-to-tension", stress ratio f mini! max = 0.5, average f min = 20 ksi). Spliced specimens were tested at all three stress ratios; unspliced bars were tested only at stress ratios of 0.0 and 0.5.
A-5

Data for both unspliced bars and direct butt splices using 60 deg. V-groove welds are presented in Figs. A-13, A-14, and A-15 for minimum stress levels of -17 ksi (i.e. compressive stress of 17 ksi), 2 ksi, and 20 ksi, respectively. No fractures in the grip region were reported for the spliced specimens, whereas for the unspliced bars most of the fractures occurred in the grip region. Nevertheless, these grip failures are shown in the figures for comparison since bars from the same lot of steel were used in both the spliced and unspliced specimens.
The data for unspliced bars at a minimum stress of 2 ksi are fairly well dispersed around the mean fatigue life line. However, the data for unspliced bars with a minimum stress of -17 ksi fall distinctly below the mean life line. It should be noted that data obtained at a minimum stress of -17 ksi is well outside the range of data obtained in the tests reported in NCHRP Report 164.
For spliced bars tested at a minimum stress of either -17 ksi or 2 ksi, the data consistently fall below the mean fatigue life line based on Eq. A-1, and occasionally fall below the design limits based on Eqs. A-2 and A-3. The limited spliced bar data for a minimum stress level of 20 ksi, however, are closer to the mean fatigue life line. From the data, it appears that minimum stress has the same relative effect on bars spliced by butt welding as it has on unspliced bars.
Walls, Sanders and Munse (17) have reported the results of fatigue tests of direct butt splices using 60 deg., single-V groove welds embedded in rectangular concrete beams. Twenty-three beams were tested. Parameters that were varied included applied load levels, use of crack formers, and number of longitudinal bars. The bars and splices were identical to those previously tested in air by Sanders, Hoadley, and Munse (9), with the specimens in both programs fabricated using the same lot of reinforcing bars. This allows a direct comparison of results from the tests studying the two types of specimens.
Of particular interest are the results of ten beams reinforced with a single bar with preformed cracks and subjected to the greatest load ranges. Both calculated stresses and stress from strain gages on the welded joint were reported. Significant differences were observed between measured and calculated stresses. Fatigue data are shown in Fig. A-16 for nine of the ten beams. One beam was excluded because the reinforcing bar was intentionally placed upside down, giving the weld in that joint a different strain gradient than the other specimens. Stress ranges are based on calculated stresses, which indicated a minimum stress of 2 ksi. Data tend to fall around the mean fatigue life line for unspliced bars, with no data falling below the design limits for unspliced bars.
The beam test data (17) are directly compared in Fig. A-17 with the data of similarly spliced bars tested in air (9) at a minimum stress of 2 ksi, seen previously in Fig. A-14. The beam test data tend to fall above the air test data in both the finite-life and long-life regions.
In a state-of-the-art report (34) on gas pressure welding (GPW) of reinforcing bars, the Japan Pressure Welding Society (JPWS) cites the results of a series of fatigue tests on deformed bars SD35 D38 (specified yield of 35 kgf/mm2 or 49.8 ksi and nominal diameter of 38 mm or 1-1/2 in.) joined by an automatic gas pressure-welding process. Details of the test program were not given, although it appears that the specimens were tested in axial tension in air. A comparison is made in Fig. A-18 of fatigue data for joint sizes of 1.3 D, 1.4 D, and 1.6 D Goint size is the diameter of the bulge formed by the GPW process, where D is the nominal diameter of the bar being joined) with data for the unspliced bar. Standard specifications for fabrication of GPW joints call for a minimum size of 1.4 D, and a conservative joint size of 1.6 D is very often used in practice, according to the report (34). It can be observed that the fatigue performance improves and approaches that of the unspliced bars as the joint size decreases. ·
Sortez (19) has summarized the results of several series of fatigue tests on beams containing bars with welded joints. The bars, made by a European manufacturer, were deformed and cold-twisted. Several different weld types and configurations were studied, including:
A-6

• Gas pressure-welded joints, with three different treatments of the bulge formed at the joint: untreated bulge, bulge and adjacent ribs ground off to the circular cross-section of the bar, and forming the joint in a manner that resulted in a well-rounded bulge.
• Double-V arc-welded butt joint. • Electric butt welded joint with two different treatments of the bulge formed at the joint:
untreated bulge, and bulge and adjacent ribs ground smooth.
Fatigue limits at 2 million cycles for two different minimum stress levels are presented in Fig. A-19 for the unspliced bar and the different weld configurations.
The data indicate that, at the higher minimum stress level, the GPW spliced bars with a bulge at the joint and the ground-smooth GPW spliced bars have approximately the same fatigue limit as the unspliced bars. At the lower minimum stress level, however, the fatigue limit of the GPW splices is distinctly less than that of the unspliced bar. No explanation for this phenomenon was evident. Removal of the bulge by grinding improves the fatigue limit. At the lower minimum stress level, fractures in the ground-smooth GPW splices occurred in both the weld metal and the bar. It was speculated that debonding and subsequent fretting where the bar was ground smooth may be influencing factors.
For the single-V arc-welded butt splice and both types of electric butt weld splices, the fatigue limit is considerably reduced. For the electric butt weld splices, grinding the weld smooth does not appear to have any beneficial effect.
Conventional Lapped Bar Splices. A series of fatigue tests on mechanical splices embedded in concrete beams (21) included two beam specimens containing conventional lapped bar splices. In one beam, the bars were cranked and lapped (i.e.: offsets were bent in the bars at the splice lap), while the other contained straight lapped bars. The intended stress range for the bars in both beams was 130 N/mm2 (18.9 ksi). The beam with the splice having cranked bars failed by fracture of the bars at the bends in 103,000 cycles, whereas the beam having straight bars did not fail after 4,022,000 cycles.
A series of fatigue tests (22) were carried out on concrete beams containing unspliced bars, conventional lapped bar splices, and three types of mechanical connectors. Data for conventional lap splices with both straight and cranked bars are compared in Fig. A-20 with data for unspliced bars. Data for the mechanical connectors were presented previously in this appendix. Lapped splices with straight bars typically fractured through one of the bars at the end of the lap and had a better fatigue performance than unspliced bars. The cranked-and-lapped splices fractured at the offset bend and had a fatigue performance significantly less than unspliced bars.
Fatigue tests (24) were run on ten concrete slab specimens, five of which contained parallel lapped bars-, and five contained unspliced bars. All specimens were initially tested at a stress range of 27 kg/mm2 (19.0 ksi). For specimens that did not fail in 2 million cycles, the stress range was increased to 30 kg/mm2 (21.1 ksi) and cyclic loading continued until fatigue failure. All specimens were tested with two equal concentrated loads approximately at the outer quarter points of a simply supported span. The lap splices were located at the middle of the span in the constant moment region. Specimens containing the lapped bars typically endured a greater number of cycles before failing than the specimens containing the unspliced bars. The unspliced specimens failed "in the central part of the slabs between the two loads, mainly at the loading line." The spliced specimens "mainly failed at the end of the lapped splices." While the authors concluded that "the fatigue strength of the lapped splice ... is greater than that of the reinforced bars ... ", it may be noted that the length of single reinforcing element in the constant moment region was greater for the unspliced bars.
A-7

Discussion of the Effect of Variables
From NCHRP Report 164 (4), it is known that the significant variables affecting fatigue behavior of reinforcing bars are stress range and deformation geometry. Minimum stress had a lesser effect. Grade of steel and bar size had a minor effect that was not significant from a design point of view. For fatigue behavior of splices, the type of splice will be an important variable only when it overrides the variables effecting the behavior of the unspliced reinforcing bars. An additional variable of concern in an experimental program is the method of loading, for example, axial tension specimens tested in air as opposed to flexural tension specimens tested in concrete beams.
Measurements of bar lug geometry (the ratio rjh) have not been reported in previous tests on spliced bars. It is possible that the effects of this unmeasured parameter may mask the effects of measured test variables relating to splices or spliced bars when an attempt is made to compare data from different sources.
Type of Splice. For those tests where the location of the fracture was reported, nearly every fatigue failure of a mechanically spliced specimen occurred in the bar at or near the end of the splice, not as a fracture of the splice itself. Therefore, the fatigue behavior of the spliced bar is dependent to a large degree upon the type of splice. For example, the fracture in the bar at the splice may be influenced by the process of forming the splice (i.e.: heat from welding, forging, or molten filler metal) or the method of transferring force from the splice to the bar (i.e.: threads, mechanical gripping of transverse lugs, or grout bond).
Stress Range. Most investigators have included stress range as a controlled variable in their test programs (9,17,18,19,20,21,22,30,33). The data indicate that an increase in stress range reduces the fatigue life in the finite-life region. Also, some of the data lend support to the assertion that there is a fatigue limit for spliced bars where failure is related to the splice.
The mean fatigue life at a given stress range for spliced bars appears somewhat reduced from that of unspliced bars. This may be observed in Figs. A-2, A-5, A-13, A-14, A-16, and A-18 where most of the splice failure points fall below the dashed line representing the mean fatigue life of unspliced bars as estimated from Eq. A-1. In addition, many spliced specimens failed at less than the design life for unspliced bars, estimated from Eqs. A-2 and A-3, as seen in Figs. A-2, A-3, A-5, A-13, A-14, and A-16.
Minimum Stress. Minimum stress was a controlled V<l!iable in the tests on welded joints conducted by Sanders, Hoadley and Munse (9). Data for the same splice type fabricated from the same lot of reinforcing bars and tested at three distinct minimum stress levels are shown in Figs. A-13 through A-15. A decrease in both fatigue life and fatigue limit occurs with increasing minimum stress. When comparing the test data with Eqs. A-1, A-2 and A-3, which represent the fatigue behavior of unspliced bars, the relative effect of minimum stress on fatigue life appears to be about the same for both welded spliced bars and unspliced bars.
Method of Loading. The test conditions for splice specimens tested in flexural tension while embedded in concrete beams are considered to be most representative of in-service conditions. Conversely, for specimens tested in axial tension in air, the absence of confining concrete is not representative of in-service conditions.
With specimens tested in air, the primary question concerns the effect of secondary bending stresses due to any misalignment of the joined bars at the splice. Secondary stresses due to any misalignment are restrained by the encasing concrete in beam specimens, whereas no restraint is provided for a specimen tested in air. For specimens in air, the maximum stress at the fracture location may not be accurately known. However, for flexural tension specimens tested in beams, the stress must be obtained by theoretical calculations or by strain measurements. There is also the effect of stress
A-8

gradient across the depth of the bar. Further, the number of potential initiation sites in beams may be reduced depending upon the crack pattern. Comparison of data from beam tests and axial tension tests for the same type of specimen may provide insight regarding the effect of method of loading.
Method of loading can be considered a controlled variable when the flexural tension beam test data of Walls, Sanders and Munse (17) is correlated with the axial tension air test data of Sanders, Hoadley and Munse (9). The type of splice, a direct butt splice using 60 deg. single-V weld, is the same for both test series, and it is reported that the spliced bars for both test series were fabricated from the same lot of steel (17). Data at the same minimum stress level from both experiments were compared earlier in Fig. A-17. Beam data and air data in both the finite-life and long-life regions are intermingled, with the fatigue life of the spliced bars in air appearing to be slightly reduced.
An effort was made to compare swaged splices tested in axial tension (20) with swaged splices tested in beams (21,22), illustrated previously in Figs. A-2, A-3 and A-4. In this case the beam test data is represented quite well by the mean fatigue life estimated by Eq. A-1, whereas the axial tension test data exhibit fatigue lives somewhat less than the mean life of Eq. A-1. However, it must be kept in mind that the reinforcing bars for these experiments came from different sources and were probably manufactured in different countries. Thus, the major variable of bar geometry and lesser variables relating to manufacture of the bar have not been controlled in the comparison.
Based upon these comparisons, it appears that testing in air is the more severe test condition.
Major Design Specifications
No U.S. design specification or code directly addresses fatigue considerations in the design of reinforcing bar splices. However, one foreign design specification for reinforcing bar splices has significant fatigue provisions.
American Concrete Institute. Section 12.14.3 of the ACI Building Code (6) applies to welded splices and mechanical connections. The provisions require that splices develop a tensile strength of 125 percent of the specified yield strength of the bar. The provisions further require that welded splices conform to AWS Dl.4 (3). The Commentary (6) to the ACI Code explains why a strength criteria of 125 percent of bar yield was used for splices rather than full tensile strength of the bar: "[The] 25 percent increase above the specified yield strength was selected as both an adequate minimum for safety and a practicable maximum for economy." There are no provisions in the Code directly concerned with fatigue of welded or mechariically spliced reinforcing bars. -
· ACI Committee 215 (25) has provided fatigue design criteria for concrete structures. Except for a brief mention of the tests of butt welded splices and a discussion of the adverse effects of tack welding, the effect of mechanical or welded splices on the fatigue strength of reinforcing bars is not covered. For nonprestressed reinforced concrete members, Committee 215 recommends that the stress range in straight deformed reinforcing bars not exceed the value computed from:
= 23.4 - 0.33 f min (A-4)
in which: fr stress range, in ksi; fr need not be taken less than 20 ksi f min algebraic minimum stress, tension positive, compression negative, in ksi
For bent bars or bars to which auxiliary reinforcement has been tack welded, the stress range computed from the above equation should be reduced by 50 percent. Equation A-4 is was derived from Eq. A-2 and thus has the same experimental basis ( 4) as discussed earlier in this appendix.
A-9

AASHTO Subcommittee on Bridges and Structures. The provisions which govern mechanical and welded splices in the AASHTO "Standard Specifications for Highway Bridges" ( 5), namely Section 8.32.2, are essentially identical to those of the ACI 318 Code; that is, AASHTO also does not address fatigue considerations for reinforcing bar splices.
For unspliced bars, however, there are explicit fatigue considerations. The following limit for permissible stress range in reinforcing bars is given in Section 8.16.8.3:
in which:
fr = 21 - 0.33 /min + 8 (r/lt) (A-5)
fr stress range, in ksi /min minimum stress of the stress cycle (tensile stress positive, compressive stress
negative), in ksi r/lt ratio of base radius to height of rolled-on deformation; where r/lt is not known,
a value of 0.3 can be used
This is nearly identical to Eq. A-2 and has the same experimental basis (4) as discussed earlier in this appendix.
AWS Structural Welding Committee. AWS Dl.4 "Structural Welding Code -- Reinforcing Steel" (3) provides general guidance for design of welded joints in reinforcing steel. Although the main body of the A WS Code does not mention fatigue, there is a footnote in Table 2.2 which pertains to "permissible stress on effective throat" under the "working stress method" that states as follows:
Under fatigue, load reversal, impact, or seismic loading, the repetitive service load shall not exceed 20 ksi in the bar at the point of weld. For fatigue conditions, the designer must establish the stress range consistent with the weld joint detail selected and number of repetitions expected below 18 ksi, if necessary.
Japan Society of Civil Engineers. Recommendations (26) for reinforcing bar splice design, fabrication, and evaluation have been promulgated by the Japan Society of Civil Engineers. The design and fabrication requirements give general qualitative criteria applicable to splices of all types, whether the splice is a conventional lapped bar splice, a mechanical connector, or a welded joint. Quantitative design requirements are given only for lapped bar splices, for which the length of the lap is stipulated. For other splices, the following fatigue performance requirement is included:
Strength performance in high cycle repetition: Does or does not qualify with a fatigue strength at 2 millon cycles of 10 kg/mm2 (14.2 ksi) or greater; also, residual deformation [measured at a stress of 2 percent of yield after stressing to 95 percent of yield] shall not exceed 0.2 mm (0.008 in.).
Other general performance requirements include static strength, strength performance in high stress repetition, and reliability related to fabrication procedures. Special performance requirements include: evaluation at extremely low temperatures, high cycle repetition more severe than 10 kg/mm2 (14.2 ksi), and others. Only requirements applicable to the particular end use of the splice need be evaluated.
An appendix gives test procedures which may be used to establish generally acceptable fatigue characteristics for any particular method of splicing. The major requirements stipulate the following:
A-10

• Specimens shall be tested in axial tension at a constant mm1mum stress of 3 kg/mm2
( 4.3 ksi), a varying maximum stress, and a loading rate of 3 Hz to 10 Hz. • Upper limit for the number of cycles shall be 2 million cycles. • Same bar deformation pattern and manufacturer shall be used for all specimens. • Separate test series shall be conducted using specimens fabricated from one bar size in each
of the groups of 16 to 25 mm (5/8 to 1 in.), 29 to 38 mm (1-1/8 to 1-1/2 in.), and 41 to 51 mm (1-5/8 to 2 in.) diameter bars.
• Typically, eight specimens shall be tested in each test series, with two tests in the long-life region of the S-N curve.
Other Literature of Interest
Reports dealing with low-cycle, high stress range behavior of mechanical splices are of some interest.
A series of tests conducted in New Zealand using high stress, low cycie loads studied three different types of mechanical splices: cold-swaged steel coupling sleeves (35), grout-filled coupling sleeves (36), and steel-filled coupling sleeves (37). The cold-swaged coupling sleeve and grout-filled coupling sleeve met strength and stiffness criteria of the New Zealand Code (38). However, the steelfilled coupling sleeve specimens failed to meet splice stiffness criteria due to apparent slip of the bars in the splice, and two splices did not meet the ultimate load requirement of 160 percent of yield strength.
In these tests; it was suspected that a lack of straightness or a misalignment of the bars in the spliced specimens may have adversely affected test results. Consequently, a review (39) of the New Zealand practices regarding splice acceptance tests was carried out. The review demonstrated theoretically that the influence of misaligned bars would be small. Experimental tests found no significant difference between straight and misaligned bars. Changes to the New Zealand Code acceptance criteria for stiffness of splices were recommended.
The behavior of noncontact lap splices was studied ( 40) under high-stress, low cycle loading. Approximately 50 specimens of varying splice bar spacing, lap length, bar size, and transverse steel area and spacing were tested. Transverse reinforcement was found to be critical to insure proper inelastic cyclic performance; and a noncontact lap splice may be conservatively designed as a contact lap splice, providing certain limitations on splice bar spacing are met.
Beam-column joints with mechanical connectors joining precast concrete elements were studied (41) under high-stress, low cycle loading. The primary reinforcing bars in the joint core were subject to ten cycles of reversed loading, with both tension and compression stresses exceeding bar yield strength. Two types of connectors were utilized in separate test specimens: a coupler for reinforcing bars where the threads are hot-rolled on the bar; and a tapered-threaded steel coupler where tapered threads are cut on an end of the reinforcing bar. Significant slippage was observed between the hotrolled threaded bar and associated coupler, whereas little relative slip was observed between the tapered-threaded bar and coupler. A slightly lower energy dissipation capacity for the specimen with the thread-deformed coupler was attributed to the slippage. No other significant difference in performance was noted for the specimen having slippage in the coupler.
A-11

Stress Range (ksi) 60 ~~~~~~~~~~~~~~~~~~~~~~~~~~~~~~~.
50
40
30
20
10
- - Mean Fatigue Life
-- Design Limits
for No. B bars, f u =90 ksi with f min =6 ksi, (r /h)=0.3
Fatigue Limit (Eq. A-2)
0 ~~~~~~~~~~~~~~~~--'~~~~~~~~~~~~~~~
0.01 0.1 l 10
N, Number of Cycles (millions)
Fig. A-1 - Reference fatigue lines for Grade 60, No. 8 unspliced North American reinforcing bars
Stress Range (ksi) 60 ~~~~~~~~~~~~~~~~~~~~~~~~~~~~~~~-
50
40
30
20
- - Mean Fatigue Life
10 -- Design Limits for No. 7 bars, t u=B? ksi
with !min =7 ksi, (r/h)=0.3
+
+
0 ~~~~~~~~~~~~~~~~--'--'~~'-'-~~~~~~~~-'--''-'-~
0.01 0.1 1 10 N, Number of Cycles (millions)
Fig. A-2 - Cold-swaged steel coupling sleeves tested in air at 7 ksi minimum stress
A-12

50
40
30
20
10
Stress Range (ksi)
- - Mean Fatigue Life
-- Design Limits for No. 8 bars, tu =90 ksi
with fmin=lO ksi, (r/h)=0.3
x
+
x
standard sleeve
three-piece sleeve
+
x
+• run out
~ runouts
0 '--~~-'-~-'--'--'--'--'-1.-L"-~~-'-~-'--'--'--'--'-l.-L"-~~--'-~--'--'------'-'---'-.L.W 0.01 0.1 1 10
N, Number of Cycles (millions)
Fig. A-3 - Cold-swaged steel coupling sleeves tested in beams at 10 ksi minimum stress
Stress Range (ksi) Stress Range (MPa)
400
50
<> 300
40 0
x 30 200
20
* 20 mm unspliced bar JOO
x 40 mm unspliced bar 10
0 20 mm splice
<> 32 mm splice
0 ~~~-'-~~--'--'--'-'--'--'-'-~~--'~-'-~'--"--'-'-...... -'-~~--'-~-'---'--"--'--'-'-'-' 0.01 0.1 1
N, Number of Cycles (millions)
Fig. A-4 · Cold-swaged steel coupling sleeves tested in beams
A-13

Stress Range (ksi) 60 ~~~~~~~~~~~~~~~~~~~~~~~~~~~~~~~~--,
50
40
30
20
-' - Mean Fatigue Life
1 O -- Design Limits for No. 11 bars, tu =90 ksi
with f min=18 ksi, (r/h)=0.3
0 ~~~~~~~'-'~~~~~~~~~~~~~~~~~~~~~~~~~
0.01 0.1 1 10 N, Number of Cycles (millions)
Fig. A-5 - Cold-swaged steel coupling sleeves tested in air at 18 ksi minimum stress
Stress Range (ksi) 60 ~~~~~~~~~~~~~~~~~~~~~~~~~~~~~~~~~
50
40
30
20
- - Mean Fatigue Life
10 -- Design Llmits for 1 in. diam. bar, fu=85 ksi
with f min =3 ksi, (r/h)=0.3
0 ~~~~~~~'-'~~~~~~~~~'-'~~~-'--'-~~~-'-~~~~'-'-'-~
0.01 0.1 1 10 N, Number of Cycles (millions)
Fig. A-6 - Grout-filled coupling sleeves tested in air (Japanese tests)
A-14

Stress Range (ksi) 60 .--~~~~~~~~~~~~~~~~~~~~~~~~~~~~~~,
50
40
30
20
- - Mean Fatigue Li!e
1 O -- Design Limits !or No. 8 bars, fu =110 ksi
with f min =3 ksi, (r/h)=0.3
0 .2 ::3 0 +
0 ~~~~~~-+--+-~~~~~-+-~~~~_,_~~~~~+-~~~~~~
0.01 0.1 1 10
N, Number of Cycles (millions)
Fig. A-7 - Grout-filled coupling sleeves tested in air (North American tests)
Stress Range (ksi) so.-~~~~~~~~~~~~~~~~~~~~~~~~~~~~~~
40 oo co oaxxo
30
20
10
OOCIDO(llJ 0 5
0 O<llD 0 -9
0 o-
Cyclic Stress Limit
0 ,__~~+----<~-t--t-t-+--t--t+-~~-+-~+--+--+-+-+--H-+-~~-+-~-+--+--+--+-+-++-'
0.01 0.1 1 10
N. Number of Cycles (millions)
Fig. A-8 • Integrally-forged couplers with upset threads, 12 mm (1/2 in.) diameter, tested in air
A-15

Stress Range (ksi) 50 r---------------------------------,
40 0 = 0 000 0
30
20
10
0 4 =-10 o-
O+----+---+-+-+-+-+-+-+-+---+--+---+--+-+-+-H-+----+--+--+--+-+-<H-<-'
0.01 0.1 1 10
N, Number of Cycles (millions}
Fig. A-9 - Integrally-forged couplers with upset threads, 25 mm (1 in.) diameter, tested in air
Stress Range (ksi) Stress Range (MPa) 60r------------------------------~
400
50
300
40
<)
30 200
0 0
<) 0 20
* 20 mm unspliced bar 00
x 40 mm unspliced bar 10
0 20 mm splice
<> 32 mm splice
0 '----'---'--L...J'-'--"--l..W'-----'--L--1--1-1.....Ll..Ll.---'---L-'--'--L.LJ...LJ 0
0.01 0.1 1 10
N, Number of Cycles (millions)
Fig. A-10 - Straight-threaded sleeves tested in beams
A-16

Stress Range (MPa)
50
40
30
20
* x
10 0
0
0
20 mm unspliced bar
40 mm unspliced bar
20 mm splice
32 mm splice
0
0
300
200
100
o'--~~-'-----''---'--'-"-'-'-'W.....~~-'-~......__,__._~~~~~~~~~~~~~o
0.01 ~1 1
N, Number of Cycles (millions)
Fig. A-11 . Taper-threaded couplers tested in beams
Type of Specimen:
Angle splice I 0.181
45 deg. single-V I 0.323
60 deg. double-V .
I 0~392
60 deg. single-V I 0.61
60 deg. single-V, cracked encasement
Unwelded bar
60 deg. single-V, uncracked encasement
0.01
I 0.949
I 1.07
0.1
j 2.159
N, Number of Cycles (millions)
10
10
Fig. A-12 - Comparison of mean fatigue life for various weld joint types for a stress cycle of 2 to 28 ksi
A-17

50
40
30
20
Stress Range (ksi)
0 0
- - Mean Fatigue Life
10 -- Design Limits for No. 7 bars, fu =80 ksi
w;th fmin =-17 ksi, (r/h)=0.3
0
0
unspliced bar
welded splice
0 Q+
0 '--~~-'-~~-'----'-~-'-'-'-"---~~-'-~-'----'-~-'--'-~"---~~~~~~~~~~
0.01 0.1 1 10
N, Number of Cycles (millions)
Fig. A-13 - Direct butt 60 degree single-V groove welds tested in air at -17 ksi (compression) minimum stress
Stress Range (ksi)
50
40
30
20
- - Mean Fatigue Life
10 -- Design Limits for No. 7 bars, fu =80 ksi
w;th f min =2 ksi, (r /h)=0.3
0 '--~~-'-~~-'--'-~-'--"'-'-"---~~-'-~-'----'-~-'--'-'--'-"---~~-'-~-'----'----'---'--'--'--'-'
0.01 0.1 1 10 N, Number of Cycles (millions)
Fig. A-14 - Direct butt 60 degree single-V groove weld splices tested in air at 2 ksi minimum stress
A-18

Stress Range (ksi) 60 ~~~~~~~~~~~~~~~~~~~~~~~~~~~~~~~
50
40
30
20
- - Mean Fatigue Life
10 -- Design Limits for No. 7 bars, f u =80 ksi
with I min =20 ksi. (r/h)=0.3
0 ~~~-'--~~-'-~~~~~~___.~~~~~-'-~~~~~~~~~~~~
0.01 0.1 1 10
N, Number of Cycles (millions)
Fig. A-15 ·Direct butt 60 degree single-V groove weld splices tested in air at 20 ksi minimum stress
Stress Range (ksi) 60 ,..--~~~~~~~~~~~~~~~~~~~~~~~~~~~~~~-
50
40
30
20
- - Mean Fatigue Life
10 -- Design Limits for No. 7 bars, fu =80 ksi
with lmin =2 ksi. (r/h)=0.3
+
x full preformed crack
partial crack
x :><+
0 '--~~~~'---'-~~~~~~~~~-"-"~--'--"-'-'~~~~~'---'--'--'-"-'-W
0.01 0.1 1 10 N, Number of Cycles (millions)
Fig. A-16 ·Direct butt 60 degree single-V groove weld splices tested in beams at an average minimum stress of 4 ksi
A-19

Stress Range (ksi)
50
40
30
20
- - Mean Fatigue Life
10 -- Design Limits for No. 7 bars, f u =80 ksi
with fmin =2 ksi, (r/h)=0.3
0
<> axial, V-butt splice
beam, V-butt splice
<> <>+ <>
0 '--~~-'-~-'--'---'--'--'-'-'-'--~---'-~-'---'--'---'--'-LL-'--~~-'-~-'--'--'---'--'-~ 0.01 0.1 1 10
N, Number of Cycles (millions)
Fig. A-17 - Comparison of data for direct butt 60 degree single-V groove weld splices tested with varying specimen type
Stress Range (ksi)
50
40
30
20
- - Mean Fatigue Life
10 -- Design Limits for No. 12 bars, tu =85 ksi
with fmin =3 ksi, (r/h)=0.3
0
+
x
*
unspliced bar
bulge size 1.3 D
bulge size 1.4 D
bulge size 1.6 D
*
ol'.::==:=r:::===:c:::r:::co::i::c::=:__--1_-1.__-1.__.L-J._j_j_J..L __ _!_--L--L__J_.LL.L.JJ
0.01 0.1 1 10 N, Number of Cycles (millions)
Fig. A-18 · Comparison of data for gas pressure welded splices with varying weld bulge size
A-20

26 mm bar unspllced bar
gas pressure welded (GPW)
GPW, ground smooth
GPW. rounded bulge
single-V arc welded butt
8 mm bar
unspliced bar
electric butt welded splice
electric butt welded splice, ground smooth
0
D !min = ZB ksl I !min = 4 ksl -8- Average
-
...
10 20 30 40 50 60
Fatigue Limit Stress Range (ksi)
Fig. A-19 - Range of estimated fatigue limit at 2 million cycles for various welded joints in a cold-twisted, deformed bar
Stress Range (ksi) Stress Range (MPa) 60
400
50
300
40
<> 30 <> 00
20
100
* 20 mm unspliced bar 10
0 20 mm lapped bars
<> 20 mm cranked lap
0 '--~~-'--~'---'--'-"--'~LI--~~-'--~-'----'--'---"-.L..L.J.J.~~--'~-.l.~'--'---'-'--'-LI 0 0.01 0.1 1 10
N, Number of Cycles (millions)
Fig. A-20 - Conventional lapped bar splices tested in beams
A-21


APPENDIX B
EXPERIMENTAL INVESTIGATION
The fatigue behavior of reinforcing bars spliced with mechanical connectors or welded joints was studied in the experimental investigation described in this appendix. A limited number of tests were run in a pilot program for the purpose of refining techniques for gripping and testing specimens in axial tension in air. The main test program studied the long-life fatigue behavior (greater than 1 million cycles to failure) for seven proprietary mechanical connection devices and two welded joint configurations, distributed between No. 5 and No 8 bar sizes. Mechanical connectors and welded joints which form butt connections were tested as axial tension specimens in air, whereas those which form eccentric or lapped connections were tested as flexural tension specimens embedded in concrete beams. Also studied in the main test program was the finite-life fatigue behavior (less than 1 million cycles to failure) of one threaded coupler and one welded splice. Finite-life and long-life fatigue tests on No. 5 and No. 8 unspliced bar, from the same lot of steel used in fabricating the mechanical connections and welded joints, were also included in the experimental investigation.
Pilot Tests
The intent of the pilot tests was to develop a suitable technique for conducting the fatigue tests of mechanical connections and welded joints in axial tension in air. Various techniques have been used in previous fatigue test programs to grip the reinforcing bars. Clamping-type mechanical jaws have been used (30), where it is recognized that fractures will occur in the grip. When a fatigue failure occurs in the grip, the specimen is re-gripped using a shorter gage length and fatigue loading then resumed. Another successful approach (9,10) involved casting a conical-shaped wedge of babbitt metal onto the end of the bar, which is then gripped by the test machine. Other possible methods that were considered included swaged-on grips and machining the ends of the bars at the grip to remove the bar deformations.
Pilot Specimen Fabrication and Method of Gripping. Only the babbitt metal technique seemed suitable for long-life tests; however, fabrication appeared difficult because the babbitt metal had to be handled in a molten state. Further, the ability to re-use the babbitt metal was uncertain. However, by substituting a high-strength, non-shrink grout for the babbitt metal, the grip would be readily re-usable and relatively easy to fabricate. Therefore, pilot tests of spliced and unspliced bars were conducted to investigate the merits of using a grout-filled grip.
A small lot of Grade 60, No. 8 reinforcing bar was acquired for fabrication of the pilot specimens. Three splice producers agreed to assemble two or three splice specimens. Three 4 ft. lengths of bar were provided to two producers; the third producer supplied their own bar as a measure of expediency, since the specimens were fabricated overseas. In this manner, three cold-swaged steel coupling sleeve splices, three steel-filled coupling sleeve splices, and two grout-filled coupling sleeve splices were obtained.
The bars acquired for the pilot tests had transverse lugs in a closely spaced, parallel diagonal pattern which intersected with the longitudinal ribs at about 20 degrees. In some locations, the intersection of the lugs with the barrel of the bar appeared relatively sharp. The bar used in fabrication of the grout-filled coupling sleeves had a "bamboo" lug pattern. The geometry of the deformations on this bar appeared to be less sharp than that of the bar with the diagonal lugs. No attempt was made to measure geometry for either bar.
B-1

Details of the socket grip are shown in Fig. B-1. An axial tension test specimen with grips attached is schematically illustrated in Fig. B-2. The procedure of attaching the grips to a specimen is straightforward. The grips and bar specimen are held in concentric axial alignment by a jig fabricated from steel angles. The jig assembly is placed in a vertical orientation, and a quick setting, high strength chemical grout is placed in the annular space between the bar and one socket. After 30 minutes the grout gains sufficient strength to permit the jig assembly to be inverted and grout to be placed in the other socket. The splice and jig assembly is left undisturbed for an additional 30 minutes while the grout in the second socket is allowed to set.
Test Setup and Procedure. A schematic illustration of the test setup is shown in Fig. B-3. The position of the crossheads can be adjusted to accommodate specimens of varying lengths. The hydraulic ram is operated by a programmable closed-loop servo-control system. The servo-control system can record the number of cycles of applied load and can detect the cycle in which fracture occurs. The external threads on the grips permit rapid attachment of a specimen to the test machine fixtures.
The load levels adopted for the pilot tests produced a minimum stress of 6 ksi tension and a maximum stress of 36 ksi tension, resulting in a 30 ksi stress range. The minimum stress level was chosen to be the same as the predominant minimum stress used in the tests reported in NCHRP Report 164 (4). The stress range of30 ksi was selected as a convenient stress range somewhat above the design fatigue limit for reinforcing bars. Nominal area for No. 8 bar was used in calculating test machine loads. All pilot specimens were tested at a load rate of 15 to 20 Hz.
Test Results • First Pilot Test Group. The pilot tests were divided into two groups. In the first group, eight splices and two unspliced bars were tested to gain experience with the test method. In the second group, five additional unspliced bars were tested in an effort to refine the gripping technique.
The initial test specimen was an unspliced bar with approximately 13 in. of free length between grips. The bar failed after the application of 697,000 cycles of load applied at a rate of 20 Hz. Fracture occurred in the bar at the base of the first transverse lug adjacent to and just outside of the edge of the grout wedge of the grip. Examination of the specimen revealed no sign of physical contact or fretting between the bar and the grip device. The number of cycles to failure was nearly equal to a mean fatigue life of 695,000 cycles for Grade 60, No. 8 bars as estimated by Eq. A-1.
Based on the favorable performance of the initial test, tests of mechanical connectors and additional tests of unspliced bars were undertaken with the grout filled grip. The gage length was increased to 19 in. to accommodate the longest mechanical conne_ctor. Data for all specimens from the first group are compared in Fig. B-4 with th-e fatigue behavior predicted by Eqs. A-1, A-2, and A-3, as discussed in Appendix A, and as discussed in the following paragraphs.
A second unspliced bar was tested with a gage length of 19 in. The specimen failed in the free length of the bar at 730,000 cycles. Examination revealed that the fracture originated from the base of a transverse lug. It was observed that the bar contained a rolling seam near the fracture origin, but it is believed that this seam had no influence on fatigue life since it was oriented in a longitudinal direction. It can be seen in Fig. B-4 that the fatigue lives of the two unspliced bar specimens tended to be longer than the mechanically connected specimens fabricated from the same sample steel lot.
The cold-swaged steel coupling sleeve specimens failed in the bar at or near the coupling sleeve. Two specimens failed after approximately 600,000 cycles, with fractures initiating at the first transverse lug within and fully engaged by the sleeve. However, the third specimen failed in the free length of the bar, about 3/4 in. away from the sleeve, after about 400,000 cycles. It was observed that this specimen was bent, with the axes of the bars not aligned across the splice. The specimen vibrated noticeably during testing. Secondary bending stresses are believed to have caused the apparent decrease in fatigue life.
The steel-filled coupling sleeve specimens failed in the bar at the partially engaged transverse lug just inside the coupling sleeve. Average fatigue life for the three specimens was about 160,000 cycles.
B-2

Multiple fracture initiation sites were observed at the base of a transverse lug. All steel-filled sleeve specimens were bent at the splice; that is, the longitudinal axes of the bars on either side of the coupling sleeve were not aligned. These specimens failed at a number of cycles significantly less than the corresponding unspliced bar design fatigue life of 310,000 cycles for a 30 ksi stress range, as computed from Eq. A-2.
The grout-filled coupling sleeve splices, as noted earlier, were not fabricated using bars from the lot of steel acquired for the pilot tests. Consequently, direct comparison with other pilot test data may not be appropriate. One specimen failed in the bar near a grip, with the fracture originating at the base of the first transverse lug just outside of the grip. The other specimen failed in the bar at the first transverse lug within the coupling sleeve. Average fatigue life was about 850,000 cycles. The greater fatigue life for the grout-filled sleeve specimens is in agreement with the qualitative observation noted earlier that the lug geometry for the bar used to fabricate these splices appeared to be less sharp than the lug geometry of the sample steel lot used to fabricate the other specimens. As discussed in Appendix A, longer fatigue life can be expected for bars with smoother lug geometry.
Test Results - Second Pilot Test Group. A second group of pilot specimens were run as a study of specimen treatment techniques to minimize the occurrence of fatigue fractures in the grip region.
Lugs were removed from three different unspliced bar specimens by machining a portion of the bar where the bar enters a grip. An undisturbed length of bar remained for embedding in grout inside the grip. The length of bar with lugs removed varied from 1.0 to 2.5 in., leaving from 6.5 to 5.0 in. of undisturbed bar embedded in grout in a grip. All specimens slipped in the grips in less than 350,000 cycles. Several attempts were made at re-gripping specimens. Testing was abandoned for two specimens. The third specimen, having the shortest machined length (1.0 in.), fractured in the free length between grips after a total of 618,000 cycles. The fatigue fracture originated at the base of a transverse lug.
An unspliced bar was treated by peening with shot blast rather than by machining. Ideally, peening sets up a residual compression field, which in turn would reduce the likelihood of fatigue cracks initiating in the peened region. A 6.5 in. length of undisturbed bar was embedded in the grip. This specimen showed no slippage in the grips, but a fracture of the bar occurred at 881,000 cycles within the grip, about 4.5 inches from the beginning of embedment in grout. The fracture originated at the base of a transverse lug. A series of "beach drift marks" on the fracture surface indicate that changes in stress intensity occurred during the cyclic loading. A second shot-peened specimen, treated in the same manner as the previous, slipped in_ a grip after 83,000 cycle.s. The specimen was re-gripped and testing was resumed. After 706,000 cumulative cycles, a fatigue fracture occurred in the free length of the bar near a grip, about 1/8 in. away from the peened area. The fracture originated at the base of a transverse lug.
Because of the numerous problems with slip, the influence of grout mix consistency on slippage was studied. It was found that grip performance was superior when a stiff, dry grout mix was tamped into the grip.
All fatigue failures of unspliced bars from both test groups are compared with Eqs. A-1, A-2, and A-3 in Fig. B-5. Bars peened with shot blast have the greatest fatigue lives of all unspliced bars tested in the pilot program. The pilot test data also compare favorably with previously published ( 4) reinforcing bar fatigue data and design recommendations. Therefore, the procedure of gripping a specimen through grout-filled sockets and treating the ends of the specimen by shot-peening were considered appropriate for use in the main test program.
B-3

Selection of Bar and Splices for Main Test Program
Selection of Reinforcing Bar. The main objective of the overall test program was to study the fatigue behavior of reinforcing bar splices. Hence, it was desirable to preclude the introduction of the reinforcing bar itself as a test variable. The effect of the reinforcing bar on test results was minimized by 1) fabricating all specimens from the same lot of reinforcing steel, and 2) by striving to select a bar with superior fatigue characteristics.
Letters of request for samples of No. 5, No 8, and No. 11 Grade 60 reinforcing bar were sent to several reinforcing bar producers and suppliers located in the midwestern and eastern United States. Samples from four bar producers were received. Because No. 8 bars were central to this investigation, longitudinal sections were cut from the sample bars of this size to permit a visual assessment of the radius of curvature at the base of the transverse lugs where the lugs meet the barrel of the bar.
Although no direct measurement of bar geometry was attempted, selection of the desirable bar was readily accomplished by visual examination. Two of the four samples exhibited a relatively sharp geometry at the base of the transverse lugs and were therefore excluded from further consideration. The rolled-on manufacturers' bar marks were then examined for the remaining two samples. Fatigue fractures initiating at the base of the bar mark have been noted in tests of unspliced bars, and it is believed that bar mark geometry has the same influence on fatigue performance as transverse lug geometry ( 4). Of the two marks which were closely examined, one mark exhibited distinctly smooth features, having a relatively gentle transition from the barrel of the bar to the mark for all components of the mark. Bars from this manufacturer were therefore chosen for splice specimen fabrication. Both No. 5 and No. 8 bars had transverse lugs in a parallel diagonal pattern, intersecting the longitudinal rib at about 30 deg. and spaced apart by about one-half the bar diameter.
A reinforcing bar fabricator was located who could supply both uncoated and epoxy-coated reinforcing bar from the selected producer. Both the coated and uncoated bars of sizes No. 5 and No. 8 were received from the same lot of steel for the respective bar sizes. The Grade 60 bars were received in 20-ft lengths and cut to lengths of either 48 in. or 96 in. for use in fabricating splices tested in air or splices tested in concrete beams, respectively. The bar groups are identified in Table B-1. For each group of bars of a given size and type, bars were sequentially numbered within the group. A specific bar was thus uniquely identified by a combination of the bar group designation and within-group serial number.
Selection of Splice Types. Initially, in keeping with trausportation department emphasis on rehabilitation of existing bridges, consideratiOn was limited to connectors and welds suitable for joining new· reinforcing bar to an existing bar partially embedded in a structure. Bridge engineers in ten states were contacted by telephone in an effort to identify specific welded splices and mechanical connectors used for rehabilitation projects. The survey indicted that the most significant use of mechanical connectors and welded splices was for bridge deck steel. The bridge engineers frequently mentioned that a bridge deck is often replaced by using staged construction techniques; therefore, almost any type of connector or weld used in new construction would also be suitable for use in this application. It was also noted that mechanical connectors and welded splices were used in bridge widening projects for joining bridge deck steel and in the extension of bridge substructure elements such as pile caps and tie beams. Proprietary mechanical connectors were mentioned more often than welded splices. Respondents also mentioned that the use of mechanical connectors with epoxy-coated steel was becoming more common.
Upon review of survey information and discussion with the NCHRP Advisory Panel for this project, a decision was made to include as many splice types as practical in the test program, with the majority being mechanical connectors in lieu of welded splices. Tests would emphasize long-life fatigue performance. Because mechanical connectors and welded splices were used most often in bridge decks, the experimental study would be limited to bar sizes commonly found in bridge decks. Thus, bar sizes
B-4

No. 5 and No. 8 were selected. The Advisory Panel requested that one splice type utilizing epoxy-coated bars be included in the study.
In an attempt to provide a direct comparison of air tests and beam tests, a modified double lap welded splice was developed. The modified splice consisted of No. 8 main bars and No. 5 splice bars. Because the combined area of two No. 5 bars is less than the area of a single No. 8 bar, it was anticipated that fatigue fracture would initiate in the No. 5 splice bars at the weld terminations. It was also anticipated that these fractures would be similar to fractures of single lap welded splices tested in beams and that the behavior of the two splices might be correlated. Pilot fatigue tests in air of two modified lap welded splices were successful in demonstrating that fractures did initiate in the No. 5 splice bars. Therefore, this weld configuration was included in the test program.
The final splice types selected for the investigation are given in Table B-2. The generic names found in the table are taken from ACI (1), CRSI (2), and AWS (3). An abbreviated name, listed in the table, was developed for subsequent use within this report. The splice types are illustrated in Figs. B-6a through B-6i inclusive; figure numbers are cross-referenced in the table. Also listed in Table B-2 are the sizes of splices fabricated for a given splice type and the particular bar used to fabricating a group of specimens. Typically, from 25 to 30 specimens of each connector or weld type were fabricated, although for certain types fewer specimens were fabricated due to limited availability of component materials.
Arrangement of the Test Program
The main test program was arranged into primary groups based on type of splice, and sub-groups of long-life fatigue tests, finite-life fatigue tests and static tests. The arrangement of groups is summarized in Table B-3. The program emphasized long-life fatigue tests to determine the 5 million cycle fatigue limit of the noted connectors and weld types. Long-life tests of both No. 5 and No. 8 unspliced bars were also included in the test program. Finite-life fatigue tests were limited to one mechanical connector, one welded splice and the two sizes of unspliced bar.
Static tests were included to determine the strength properties of the mechanical connectors, welded splices and unspliced bars. Supplemental tests on connectors, welds and unspliced bars were also included as described later in this section.
Finite-life fatigue tests of unspliced bars were first carried out, followed by long-life fatigue tests of unspliced bars. Fatigue_ tests of co1mectors and welds then_ followed in an arbitrary, convenient order. This allowed results from a group tested earlier in the test order to be used in establishing the initial long-life stress range of groups tested later in the order.
The unspliced bar and most mechanical connectors and welded joints were tested in axial tension in air. However, the wedge-sleeve coupling and the single-lap weld were tested in concrete beams. The inherent eccentricity of the spliced bars for these two types of splices precluded direct testing in axial tension in air.
Long-Life Fatigue Tests. The intent of the long-life fatigue tests was to determine the 5 million cycle fatigue limit of the selected mechanical connectors, welded joints and unspliced bars. Staircase tests (7,8) were used, with up to sixteen specimens planned for each long-life fatigue test group. In a staircase test, the test stress range for a given test specimen is dependent upon the result of the test on the preceding specimen. If a given specimen does not fail within the designated number of cycles, the following specimen is tested at a higher stress range. Conversely, if the specimen fails before reaching the designated number of cycles, the following specimen is tested at a lower stress range.
Selection of an initial stress range near the actual mean fatigue limit is critical for achieving an optimal test sequence. If the initial stress range is too low, a large number of tests will end as runouts prior to the first test ending with a failure. Conversely, if the initial stress range is too high, a large
B-5

number of failures will occur prior to the first runout. Selection of the test stress range for the initial specimen is typically based on available fatigue data from similar specimens.
A 5 million cycle fatigue limit and an increment of 1 ksi between successive test stress ranges were chosen for this test program. Historically, these values were used in tests of unspliced reinforcing bar (4) which formed the basis of the AASHTO (5) fatigue design provisions for straight reinforcing bar. A minimum stress of 3 ksi was consistently used for all specimens. Finite-life and long-life tests of unspliced bars were conducted prior to fatigue tests of any connector or weld in order to facilitate selection of initial stress ranges for fatigue tests of specimens having mechanical connections and welded splices. The stress level for the initial staircase test of unspliced bar specimens was determined from finite-life test results. Test machine loads for all long-life fatigue tests were established on the basis of bar areas determined from weight of a measured length of bar.
Staircase test sequence having data suitable for analysis was considered to begin with the first sequence of a runout followed by a failure, or a failure followed by a runout. It was planned that from one to four specimens would be expended before the first occurrence of a failure-runout or runoutfailure sequence. Staircase testing then was planned to continue for ten additional specimens, giving a total of twelve data points suitable for staircase analysis. The number of specimens tested in a particular long-life test group, including any tests necessary to zero in on the initiating staircase test sequence, is given in Table B-3.
As noted previously, finite-life tests of unspliced bars were carried out before the long-life tests. The finite-life data were used to establish the initial stress range for the long-life tests. Coincidentally, the planned stress range for some of the finite-life tests lay in the transition between the finite- and long-life regions of the fatigue curve for the bar used in the test program. When the staircase test sequence dictated that a long-life test be run at or above the stress range corresponding to one of the expended transition region finite-life tests, the transition region test result was utilized for a long-life test at the appropriate stress range. Any transition region specimen was analyzed either as a finite-life specimen or a long-life specimen, never as both. For a few test groups of connector and weld specimens, one or two results from the long-life fatigue tests prior to the initiating test sequence (which usually are excluded from any staircase data analysis) were added in a logical manner to the end of the analyzed staircase test data sequence. This practice contributed to efficiency of the test program by reducing the numbers of specimens tested and by including in the analysis test data which would otherwise have been discarded.
Finite-Life Fatigue Tests. In order to define finite-life fatigue behavior, replicate fatigue tests were included for the two sizes of unspliced bar, -a threaded mechanical connector, and a welded splice, as indicated in Table B-3.
Finite-life tests of unspliced bars were initially planned for stress ranges of 32.5 ksi and 40.0 ksi. Tests conducted at 40.0 ksi had fatigue lives between 250,000 cycles and 750,000 cycles for both sizes of bar, falling in what is traditionally held as the finite-life portion of the fatigue curve. However, bars of both sizes tested at 32.5 ksi typically had fatigue lives greater than 1 million cycles, indicating that this stress range approached the long-life region of the fatigue curve. Unplanned tests were therefore scheduled at a stress range of 47.5 ksi to provide a second stress range distinctly in the finite-life region of the fatigue curve. A minimum stress of 3 ksi was used for all finite-life tests.
A group of No. 8 double-lap welded splices and a group of No. 8 threaded couplers were planned for testing in the finite-life region of the fatigue curve. Choice of the particular threaded coupler was to be based on relative long-life performance of threaded coupling devices, with the intent of selecting a coupler having average or above average long-life performance. After review of the long-life data for the various threaded couplers in size No. 8, the taper-threaded coupler was selected on the basis of the noted criteria.
The test machine load levels for the unspliced, No. 8 bar finite-life tests were based on nominal bar area. Subsequently, reported stress levels were re-calculated to correspond to bar area based on
B-6

measured weight. For consistency, No. 8 splices tested as finite-life specimens were treated in a similar manner. All load levels for No. 5 finite-life tests were determined from bar area based on measured weight and thus did not require any adjustment.
Static Strength Tests. Specimens from each test group were selected for tensile tests. Yield strength, tensile strength, and elongation were recorded for unspliced bars; tensile strength and mode of failure were recorded for splices. At least two specimens from each group were assigned to static tests, as noted in Table B-3. An exception was the modified double lap welded splice. Only one splice of this type was tested statically because a limited number of these splices were fabricated.
Randomization of Tests. Randomization was used to the greatest extent possible. This included assignment of cut lengths of reinforcing bar to particular test groups and the order of testing within a group of splices.
Reinforcing bar stock was received in lengths of 20 ft. Bars were removed from stock without regard to any particular order and cut to lengths noted in Table B-1. Serial numbers were sequentially assigned to pieces within a bar group as they were cut.
The numbered bars within each bar group were then assigned to' a particular splice group using tables of random numbers generated by a computer program. Splices for each group were then assembled without regard to any particular order. Additional tables of random numbers were generated and used to assign a particular specimen to a sub-group of static tests, finite-life fatigue tests, or long-life fatigue tests. The same random number tables determined the order of testing within a sub-group.
Randomization of fatigue tests across splice groups was not considered because it was necessary to use the fatigue test results from one group to guide selection of test stress ranges for other groups. Groups were tested according to a convenient order as noted at the beginning of this section.
Description of Specimen Fabrication and Tests
Assembly of Welded Splices. Welded splices were designed, detailed, and fabricated in accordance with A WS Dl.4 (3). Weld lengths were 1.5 in. for the No. 8 double-lap welds, and 2.0 in. for both the No. 5 single-lap weld and the modified double-lap weld. Welding supplies were obtained from local sources. Electrodes were low hydrogen, E7016. The electrodes were oven dried and then kept in a heated container until immediately prior to use. Preheat temperatures were determined from the chemical analysis of the reinforcing bars, using the carbon equivalent calculated according to A WS 1.4 (3). Bars were held in position by clamps, and an attempt was made to consistently orient the longitudinal ribs as shown previously in Figs. B-6h and B-6i. For the modified double lap splices, however, orientation of the ribs of the splice bars was not controlled.
Assembly of Mechanical Connectors. Materials and assembly instructions for the various proprietary mechanical connectors, including any special tools required for assembly, were obtained directly from the connector manufacturer. All connections were assembled or fabricated in a horizontal orientation.
As much assembly as possible was performed in the investigating laboratory by employees of the investigating agency. Outside services were necessary in two instances involving threaded couplers: bars were threaded for taper-threaded couplers by a local reinforcing steel fabricator; and bars were threaded for the straight-threaded coupler by the device manufacturer. In both instances, the appropriate numbered bars were used from the control stock.
All proprietary device producers were invited to provide appropriate training for agency personnel on-site in the investigating agency's laboratory. Training was provided by the producers of the coldswaged steel coupling sleeve (both standard and two-piece threaded), grout-filled steel coupling sleeve,
B-7

and steel-filled coupling sleeve. The producers of the remaining devices declined the opportunity to provide training, indicating that written instructions or simple verbal directions were sufficient for correct assembly of the devices. Dimensional tolerances were in accordance with manufacturer's recommendations.
Every attempt was made to fabricate splices so that the spliced bars were in concentric alignment across the splices; that is, any misalignment of the bars in the assembled specimen was minimized. No attempt was made, however, to straighten any splice which was noticeably misaligned. Misalignment at the splice was measured as described later in this section. For two splice types, the steel-filled coupling sleeve and the grout-filled coupling sleeve, jigs provided by the device producer were used to maintain alignment of the coupling device and bars during specimen assembly.
An attempt was made to maintain alignment of the longitudinal ribs of the reinforcing bars on either side of the splice. However, for threaded couplers, no control was possible. In addition, for many other devices, alignment was lost due to movement occurring during the splicing process.
Procedure for Static Strength Tests. Static tests of splices and unspliced bars were performed in a 120,000 lb Satec universal test machine. Test procedures conformed to "Standard Test Methods and Definitions for Mechanical Testing of Steel Products", ASTM A370 ( 42). The ends of the test specimens were gripped directly by the jaws of the test machine.
Prior to testing, gage marks were made on the bar at 2 in. intervals along the entire length of the bar. A frame assembly having a gage length of 8 in. and utilizing a pair of L VDT deflection measuring devices was attached to unspliced bar specimens. Load-deformation plots of unspliced bars were generated on an X-Y analog plotter using the averaged electrical output of the L VDT pair and an electrical load output signal from the test machine. When elongation reached about two percent, the load was temporarily held constant, the L VDT frame was removed, and load then increased until the bar fractured. Elongation after fracture was measured by fitting the ends of the fractured bars together and determining the distance between the gage marks originally separated by an 8 in. interval.
Specimens having mechanical connectors or welded joints were tested in an identical manner, with the following exceptions. The L VDT frame was typically removed at one percent elongation, rather than at two percent, in an effort to prevent damage to the equipment in the event of premature failure of a splice. Elongation at fracture was not determined for any splice specimen. The gage length of the LVDT frame was increased from 8 in. to 18 in. for grout-filled coupling sleeves. The LVDT frame was not used for the wedge-sleeve coupling and the single-lap welded splice because, for these two splice types, rotation at the splice in the plane of the spliced bars (caused by the offset between the axes of the spliced bars at the connector or wetd) would distort the elbngation readings.
Fabrication of Axial Tension Test Specimens. The main test program utilized the same groutfilled grip and specimen fabrication procedures as described previously in this appendix for the pilot tests. Details of the grip socket were given in Fig. B-1 and a schematic illustration of a typical axial tension test specimen was given in Fig. B-2. Gage length between the grips was 19 in., except 24 in. was used for the grout-filled coupling sleeve because of the relatively long length of the sleeve.
For specimens in the main test program, the ends of the bars were treated by peening for the entire length of the bar end which was embedded in grout within the socket. This modification simplified the peening procedure as compared to the treatment of pilot test specimens and did not adversely affect the performance of the grip.
Measurement of Misalignment. Fabrication of an ideally straight test specimen without any misalignment of the bars at the splice location was not possible. Therefore, misalignment for each mechanical connector or welded splice specimen was measured and recorded.
Two components of misalignment were observed, as defined in Fig. B-7. Dimension "a" is the offset of the reinforcing bar at the splice with respect to the axial centerline of an ideally straight
B-8

specimen. Dimension "b" is the offset of the bar at the splice with respect to the longitudinal axis of the splice. Dimension "e" is the total misalignment, "a" + "b". The axes of the grips were considered to be in line because they were held in jigs.
After the grip sockets were attached to an air test specimen, and prior to any testing, a measurement was made of component "a". The measurement procedure is schematically illustrated in Fig. B-8. An assumption was made that the bar surface profile would be parallel to the bar longitudinal axis. Elevation of the bar was measured at three points along the top of the barrel between each grip and the splice, as shown in Fig. B-8. The longitudinal position where each elevation measurement was made was also measured with respect to a reference.
Equations for lines representing bar surface elevation with respect to longitudinal position were computed by linear regression using the least squares method. Elevations of the bar surface at each grip and at each end of the splice were determined from the equations. Component "a" was taken as the difference between the computed bar elevation at each end of the splice and a theoretical straight reference line between the two grip sockets.
The specimen was rotated approximately 90 degrees and measurements and calculations were repeated for the new orientation. Offsets from the two orientations were combined by vector addition at each face of the splice. The average of the two resultants at either end of the splice was taken as the recorded value of component "a".
Component "b", offset of the bar at the splice with respect to the longitudinal axis of the splice, was significant for two types of splices: the grout-filled coupling sleeve and the steel-filled coupling sleeve. Direct measurements between the bar and the coupling sleeves were made. For the remaining types of mechanical connectors and welded splices tested in air, component "b" was assumed zero because the design of the connector or welded splice inherently centered the bars with the longitudinal axis of the connector or welded splice.
Fabrication of Beam Specimens. Each test beam contained a No. 5, spliced reinforcing bar in a 7 ft long rectangular concrete beam having a width of 6 in., an overall height of 8 in., and a nominal effective depth for the reinforcing bar of 6 in. Details of a test beam are illustrated in Fig. B-9.
The overall length of reinforcing bar with an assembled connector or welded splice intended for testing in a beam was approximately 80 in. Stirrups and intermittent stringer bars were tied to the main reinforcing bar using soft iron wire. Wire chairs were used to support the reinforcing assembly in the forms. Sheet metal crack formers were placed at both ends of a connector or weld. The test beams were cast in plywood forms coated with form oil. Position of the reinforcing steel was checked prior to placing of concrete.
· Beams were cast, either singly or in groups of two, in the predetermined random order of testing. Concrete was mixed using Type I portland cement, Eau Claire sand, and Eau Claire normal weight aggregate having a maximum size of 3/4 in. Design compressive strength of the concrete was 5000 psi in 14 days. Slump of the concrete was from 3 to 6 in., and air content was from 3.5 to 6.5 percent. Concrete was mixed in batches of about 1 cubic ft in a tilt mixer having a maximum capacity of 1.5 cu. ft, with five batches required for a set of two beams. Three 4 in. by 8 in. cylinders for strength testing were taken from the batch placed in the middle of each beam. A spud vibrator was used to consolidate concrete in the test beams and test cylinders.
The top surface of each beam or cylinder was screeded and finished with a float after casting. Beams remained in the forms and covered with damp burlap and plastic for a period of three to six days. The forms were then stripped from the beams and the beams stored in the laboratory at ambient temperature and humidity.
B-9

Residual Deformation Tests. Residual deformation tests were conducted on three to six specimens of all mechanical connectors except the wedge-sleeve coupling. The wedge-sleeve splice was excluded because of in-plane rotation due to the offset between the axes of the bars being connected. The tests were performed after the grouted grip sockets were attached to the specimen, but prior to any fatigue test. Test setup and instrumentation was identical to that used for the static strength tests, except loads were applied through the grout-filled grip sockets and the output of the pair of LVDT's straddling the splice was read by a digital voltmeter.
Loads were applied in three stages: an initial load corresponding to a stress in the bar of 3 ksi; a peak load corresponding to a stress of 30 ksi; and a final load corresponding again to a stress of 3 ksi. The LVDT's were read at each stage. Residual deformation was computed by taking the difference between the final reading at 3 ksi and the initial reading at 3 ksi. Test machine loads were based on nominal bar areas.
Axial Tension Fatigue Test Setup and Procedures. Test setup and procedures for the axial tension fatigue tests were the same as those used in the pilot tests described previously in this appendix. The assembled axial tension fatigue test specimens were shipped to Materials Research Laboratories in Glenwood, Illinois, for fatigue testing. Specimens were attached to a fatigue test machine by threading the grip sockets into fixtures on a test machine. Loads were applied and controlled by an MTS closedloop, hydraulic servo-control system. Rate of loading was from 18 to 29 Hz for the long-life tests and 5 to 15 Hz for the finite-life tests. A schematic illustration of the test setup was shown previously in Fig. B-3.
Axial tension fatigue tests were carried out on groups of finite-life or long-life specimens, with groupings as previously noted in Table B-3. Three test machines were available, permitting simultaneous and independent testing of up to three groups. Test machine loads and randomization among and within groups were as discussed previously.
The mechanical connector or welded joint and short lengths of adjoining bar were removed from specimens which fractured in fatigue. Fracture surfaces were coated with a preservative to prevent rusting. The grip sockets were also removed from the specimen and the remainder of the specimen was discarded. Specimens which did not fail in fatigue were statically tested in axial tension to failure as part of the process of removing the grip sockets from the test specimen.
Beam Test Setup and Instrumentation. Specimens were tested as simply supported beams with two equal loads nominally placed at third-points of the span. T_his arrangement provided a constant moment region in the middle one-third of the beam span.
· Details of the beam test setup are illustrated in Fig. B-10. Two MTS hydraulic, servo-control fatigue test machines were used. Both machines had the same schematic setup, with one machine having a ram of 50,000 lb maximum capacity and the other a ram of approximately 3000 lb capacity. Based on anticipated fatigue limits, beams containing steel coupling sleeves with wedges were assigned to the test frame having the higher capacity and beams with single lap welded splices were assigned to the test frame having the lower capacity. Actual fatigue strength of the single lap welded splice was greater than anticipated, necessitating an increase in the length of the shear span to achieve a greater bending force in the constant moment region. Load points, support points, beam spans, and shear spans were as summarized in Table B-4, with the various dimensions keyed to Fig. B-10.
The main reinforcing bar of each beam tested statically was instrumented with 1/8 in. strain gages. Two gages were located on opposite sides of the bar near each end of the splice, for a total of four gages in each beam. The strain gages were monitored by strain indicators during static loading, and occasionally by strip chart recorders during dynamic loading.
With single-lap welded splices, the strain gages were located approximately one bar diameter from the ends of the weld, thereby placing the strain gages in close proximity to the crack formers. For the wedge-sleeve coupling, the gages were located about one bar diameter from the end of the bar lap. In
B-10

turn, the bar laps extended two or three bar diameters from the end of the coupling sleeve. Since the crack formers were located at the ends of the coupling sleeve, the strain gages were located three to four bar diameters, or about 2 in., from the crack former.
Initially, beam specimens were not instrumented with strain gages because it was suspected that the reinforcing bars might fracture at gage locations. This is because some grinding of lugs was necessary to install the strain gages, thereby potentially reducing the area of the bar at the gage. After about half the beams of each splice type were tested in fatigue, two beam specimens of each splice type were instrumented with strain gages and tested in fatigue. Fractures in the instrumented beams occurred at the same locations as the beams without strain gages. Therefore, the remaining beams were instrumented with strain gages.
Deflection of a beam was monitored by an L VDT located at midspan. During static loads, the LVDT was monitored by a digital voltmeter and a strip chart recorder. During fatigue loading, only the strip chart recorder was used.
Static and fatigue test loads were applied and controlled by the MTS hydraulic servo-control system. During static loading, the output of the MTS test machine load cell was read with a digital voltmeter as the load indicator.
Procedure for Beams Tested Statically. The planned loading regimen for static test beams was as shown in Fig. B-11. The loading generally consisted of sequential patterns of static load cycles followed by repeated load cycles. The basic pattern consisted of several static load cycles, typically five in number, between a minimum load and a maximum load, followed by 10,000 to 80,000 cycles of repeated loading having the same minimum and maximum loads, and ending with a single static cycle, again with the same loads. The first pattern typically had a peak total load of approximately 3,000 lbs, with the peak load typically increased by 1,000 lbs between subsequent patterns. The minimum load typically was in the range of 100 to 500 lbs.
Strains and deflections were read at the minimum, mean, and peak loads during the first and last static load cycle at the beginning of a pattern, and during the single static load cycle at the end of a pattern. With some specimens, readings were taken more often for particular static cycles. Cracks in the beam were marked at the peak of the first static cycle of each load pattern. However, during the initial static load cycle of the first load pattern, strains, deflection, and cracks were usually monitored at 500 or 1000 lb load increments.
For repeated loading segments of the load regimen, the MTS servo-control load levels were set such that the beam deflectio~ during repeated loading matched th~ beam deflection observed on the last static load cycle immediately prior to the commencement of repeated loading. It was believed that this method would inherently account for the effects of dynamic loading. Output of strain gages on instrumented beams monitored under repeated loads were typically within 10 percent of strains measured during static load cycles of the same load magnitude.
Stress in the reinforcing bar was calculated from test machine loads using usual linear-elastic, cracked section, reinforced concrete theories. Calculations employed a concrete modulus of elasticity determined from cylinder tests performed the day that repeated loading was initiated, an assumed reinforcing bar modulus of 29 million psi, a nominal beam width of 6 in., and an effective depth of reinforcing bar of 5.9 in. No adjustments of stress levels were made for any time-dependent effects such as creep and shrinkage.
Agreement between calculated· and measured stresses was inconsistent for the first static test of a beam containing the wedge-sleeve coupling. Static tests were carried out on two additional beams containing this splice type during the course of the laboratory investigation. For both additional tests, the repeated loads were dropped from the load regimen. One of the tests was conducted in a temporary load frame, utilizing a ram actuated by a hand pump and a load cell read by a strain indicator. The second specimen was one of the regular planned long-life fatigue test specimens, which was statically
B-11

tested in the regular test frame having the higher load capacity, and was subsequently fatigue tested in the same test frame. Results of these tests are discussed later in this appendix.
At the conclusion of the first static test of a beam containing a single lap welded splice, calculated and measured stresses generally agreed within 10 percent. Therefore, no additional static tests were conducted on beams containing this type of splice.
Procedure for Beams Tested in Fatigue. Repeated loading for a beam tested in fatigue was intended to start from 14 days to 30 days after the test beam was cast. Four beams were tested at ages greater than 40 days but less than 60 days. Because of test equipment breakdowns, one beam containing a steel sleeve with wedge splice had aged over 90 days before testing could commence. This specimen was therefore discarded.
Fatigue tests began with an initial static load cycle having a maximum load of 5,000 to 6,000 lbs, applied in increments of 1000 lbs. Midspan deflection and strain gages (for beams so instrumented) were monitored at each load increment. Cracks in the beams were marked at the peak load. The purpose of the initial static load cycle was to develop cracks in the beam.
The initial static cracking load cycle was followed by a single static load cycle having the intended minimum and maximum test loads. The intended minimum load for all beams corresponded to a minimum stress of 3 ksi in the reinforcing bar, and the maximum load corresponded to the maximum stress intended according to the staircase test procedure. Midspan deflection was monitored on a strip chart recorder during this cycle. Repeated loading was then initiated, with servo-control loads set so that the beam deflection during repeated loading matched the beam deflection observed during the static cycle having the intended test load levels. Periodically, repeated loading was halted, the intended loads again applied statically with midspan deflection monitored on the strip chart, and repeated loading resumed to match the new static deflection.
For beams tested in the test frame having the smaller capacity, the initial static cycle was applied using a small ram actuated by a hand pump, with loads monitored by a load cell and strain indicator. Subsequent static cycles of planned load levels and all repeated loads were applied through the servocontrolled ram.
Any beam which did not fail in fatigue after 5 million cycles was rerun at a higher stress range until a fatigue failure did occur. It was necessary to use a single point load arrangement for rerun tests of beams installed in the test frame having the smaller load capacity. Data were not collected for the rerun tests because stress levels could not be calculated with sufficient accuracy for the single point load arrangement. __ _ _ _
Initial stresses for fatigue beam specimens were calculated using the same procedures and assumptions as beams tested statically. After a beam failed in fatigue, the beam was examined at the fracture location and dimensions were measured and recorded for width of the beam and effective depth. Effective depth was taken as the average of the distances from the compression face of the beam to the top and bottom of the bar at the fracture location. Test stress levels were recalculated based on the measured dimensions. Beam crack patterns were recorded by photography, and fatigue cracks in the reinforcing bar at the fracture location were noted. The splice was extracted from the beam, and the remainder of the beam was discarded.
Test Results
Properties of Bars. One ft long samples of bar were cut from No. 5 and No. 8 unspliced bar specimens intended for static testing in air. The length and weights of the samples were measured. Unit weight was determined by dividing measured weight by measured length. Bar area was calculated by dividing the measured weight by an assumed unit weight for steel of 3.40 lb/in2 /ft.
B-12

Typical force-strain curves from the static test specimens are shown in Fig. B-12, and bar area and strength properties are summarized in Table B-5. Values of yield strength were determined corresponding to the plateau observed on the curve and at 0.35 and 0.50 percent strain. ASTM A 615 (27) provides that, where the steel does not have a well-defined yield point, yield strength shall be determined at 0.50 percent strain. ACI 318-89 (6), Section 3.5.3.2, determines a yield strength at 0.35 percent strain for reinforcing bars with a specified yield strength greater than 60 ksi.
The No. 8 bar specimens exhibited two distinct force-strain behavior curves. However, the supplier reported that all bar received came from the same heat of steel. The difference may be attributable to variation in working of the bar as a result of handling during rolling and fabrication.
Samples of bar were analyzed for chemical composition by an independent metallurgical laboratory. Results are summarized in Table B-6. ASTM A 615 restricts only the content of phosphorus; the tabulated values for phosphorus are within the ASTM requirements.
Properties of Splices. Misalignment of splices was measured using the procedures described previously. Tension tests were used to determine static strength and residual deformation of splices.
As defined previously in Fig. B-7, a specimen intended for testing in air may have two components to total misalignment: component "a", the offset of the bar at the splice with respect to an ideal axial centerline between grips; and component "b", the offset of the bar at the splice with respect to the longitudinal axis of the splice. These components may occur at either end of a connector. Averages of measurements from both ends of a specimen are summarized in Table B-7. Component "a" was measured for all splices tested in air, and tends to be smaller for threaded coupling devices where threads are directly cut into the bar. Component "a" also is generally smaller for No. 8 specimens.
Direct physical measurements of component "b" were made for the grout-filled coupling sleeve and the steel-filled coupling sleeve. During assembly of these two types of mechanical connectors, jigs were used to hold the bars and connector in a steady position. Nevertheless, component "b" did vary somewhat for both sleeve types. Also, for both types, the cumulative effect of the two components was additive: that is, component "a" was directed such that it would increase the effect of component "b". Component "b" did not exist for the remaining types of specimens.
Static strength tests are summarized in Table B-8. ACI 318-89 ( 6) and AASHTO (5) require that a full mechanical or welded splice develop in tension at least 125 percent of specified yield strength of the bar. Using a specified yield strength of 60 ksi, the nominal minimum static strength is 75 ksi. One test of the threaded-swaged sleeve, one test of the straight-threaded coupler and one test of the wedgesleeve coupling did not meet this static strength requirement.. !t is noted that, for these three tests, failure occurred in or at the splice and not in the free length of reinforcing bar. It is also noted that, for the wedge-sleeve coupling and the single-lap weld, where there is an offset between the bars being joined, testing in air may not represent behavior in beams because of in-plane rotation of the splice that occurs with testing in air. ·
Mode of failure is also noted in Table B-8. There are no requirements in either ACI 318-89 (6) or AASHTO (5) pertaining to mode of failure; that is, there are no requirements stipulating whether fracture should occur in the connector or weld itself or in bars being joined. In general, specimens having lower tensile strengths typically failed in or at the connector or weld.
Measurements of residual deformation are summarized in Table B-9. The magnitude of residual deformation was generally the same for all mechanical connectors tested in air, except for the two-piece cold-swaged c.oupling sleeve with threaded ends. No definitive explanation for the larger residual deformations of this splice type was readily apparent. There are no requirements in either ACI 318-89 (6) or AASHTO (5) pertaining to residual deformations.
B-13

Properties of Test Beams. Compressive strength and modulus of elasticity tests on the 4 x 8 in. cylinders were typically carried out on the day that a beam was first subject to any load. Data are summarized in Table B-10. Compressive strength was taken as the average of tests on three cylinders. Modulus tests were generally carried out on a fourth cylinder, although in some instances the modulus test was performed on the third compressive strength test cylinder. The modulus test cylinder was cycled four times between loads corresponding to stresses of 500 psi and 3000 psi. Strain readings were taken on all cycles, with modulus computed for the third and fourth cycles. The two modulus values generally agreed within the level of accuracy of the calculations, based on the least resolution of the test equipment indicator. The modulus from the fourth cycle readings was recorded as the modulus for a test beam.
After fatigue failure, the width of the compression face and the effective depth of reinforcing was measured at the beam fracture cross section for each test beam. Data are summarized in Table B-11.
Tension cracks were marked on the test beams while the maximum intended test load of the first static load cycle was applied to a beam. The average space between cracks in the constant moment region was determined for each test beam. Data are summarized in Table B-11. The space between the two cracks at the crack formers was excluded from the average. No measurements were made of crack widths.
Response of Test Beams to Load. Test beam deflections were monitored throughout the static and dynamic testing. Where a beam was instrumented with strain gages, the gages were monitored during static load cycles and occasionally during dynamic loads.
The minimum deflection of a test beam, considered to be the deflection occurring when the intended minimum test load was applied, was observed to increase with time. The additional deflection was attributed to time dependent deformations of the beam concrete.
The range of deflection due to an increase in load from the intended minimum load to the intended maximum load was recorded on a strip chart during static load cycles. Dynamic loads were set so that the range of dynamic deflection matched the range of deflection observed during the static load cycle. The deflection range was generally stable after the first 100,000 cycles of dynamic loading. With some beams, however, the deflection range as observed on the strip chart recorder increased on the order of 5 to 10 percent during the last several hundred thousand cycles prior to a fatigue failure.
Beams instrumented with strain gages on the reinforcing bar near the splice were tested statically and in fatigue. The purpose of the instrumented tests was to verify procedures used to calculate stress range in the bars. Procedur_es for calcul_ating stress ranges were _described previously in this appendix.
To assess the readings of strain gages -on reinforcing bars, a length of No. 5 reinforcing bar was instrumented with a pair of strain gages of the same type as and installed in the same manner as the gages used in test beams. Static axial tension tests in air were run on the bar. Stresses determined from the measured strains and an assumed elastic modulus of 29 million psi were approximately 9 percent greater than stresses based on test machine load readings and measured bar area. Consequently, stresses determined from strain gage measurements from bars embedded in beams were based on an effective reinforcing bar modulus determined from the tests of the instrumented bar in air.
Strain readings were taken at several load stages during static testing of the first beam containing a single-lap welded splice. As described previously, two pairs of strain gages were used on the bar in each beam, one pair located at each end of the splice. For each pair of gages, strain readings from the individual gages were averaged to provide a single average strain measurement at each gage pair location. A comparison of stresses determined from measured strains and stresses determined by calculations is shown in Fig. B-13. Measured and calculated stresses generally agree within 10 percent. Observations of other test beams containing single-lap welded splices and instrumented with strain gages indicated similar agreement. Therefore, reported test stress ranges for beams containing welded splices are based on calculated stress ranges.
B-14

Static tests were also conducted on beams containing wedge-sleeve couplings. Calculated stresses and stresses based on strain gage readings were compared. Calculated and measured stresses agreed within 10 percent for increasing loads during the first load cycle, but agreement was not consistent during subsequent load cycles, with gages indicating stresses about 25 percent lower than calculated values. Additional static tests of other instrumented beams containing wedged-sleeve couplings indicated similar results, as did strain readings from fatigue test beams instrumented with strain gages.
The disparity between measured and calculated stresses for the beams with wedge-sleeve couplings may be attributed in part to the location of the strain gages relative to the crack former. Strain gages were typically located several inches from the crack formers in beams containing the sleeve with wedge couplers, whereas the gages were immediately adjacent to the crack formers in beams containing single lap welded splices. This would tend to cause measured strains to be lower than actual strains. Therefore, the reported test stress ranges for beams containing wedge-sleeve couplings are also based on calculated stress levels.
Two beam specimens were statically loaded to ultimate capacity. An instrumented beam containing a wedge-sleeve coupling failed in concrete compression at applied moment of 103 in-kips, corresponding to a calculated stress in the reinforcing steel of approximately 63 ksi. A second beam containing a wedge-sleeve coupling also failed in the same manner at an applied moment of 116 in-kips, corresponding to a calculated stress in the steel of 70 ksi. A beam containing a single-lap weld was intended for static loading to ultimate, but the beam failed in fatigue during the cyclic loading segment of a load pattern which produced stresses in the bar greater than what was later found to be the fatigue limit for single-lap welded splices.
Fatigue Strength of Test Specimens. The number of cycles of loading required to cause failure of a specimen was recorded. However, not all tests resulted in a fatigue failure. For runout specimens (that is, specimens which did not fail in fatigue), recorded data were the number of cycles at intentional termination of a test. Any intentional termination of a runout test occurred after at least 5 million cycles.
The test machines operated unattended during certain periods, namely overnight and on weekends. Hence, the number of cycles at runout was greater than 5 million cycles for many specimens. In a few instances, specimens failed in fatigue at a number of cycles greater than 5 million. For the purpose of the staircase data analysis presented in Appendix C, any specimen tested to a number of cycles greater than 5 million cycles, regardless of actual test result, was treated as a runout occurring at exactly 5 million cycles. _ _
Plots of stress range versus the logarithm of number of cycles (S-N plots) for No. 5 and No. 8 unspliced bars are shown in Figs. B-14a and B-14b, respectively. Data are listed in Table B-12. A test ending in a fatigue failure is indicated by an asterisk, whereas a test ending in a runout is indicated by an open symbol. The dashed line on each plot represents the mean finite-life fatigue strength (sloped line segment) and the mean long-life fatigue limit (horizontal line segment) for the illustrated test group, determined using procedures described in Appendix C.
Except for one specimen, all fractures of unspliced bar specimens occurred in the free length of the bar, 1/2 in. or more beyond the face of a grip. The fracture of one specimen occurred within the grouted region of the grip. This specimen has not been included among the reported data.
Fatigue data for unspliced bars can be compared with curves representing finite-life mean fatigue performance and the long-life design fatigue limit of unspliced bars from NCHRP Report 164 (4), as represented by regression formulas presented earlier as Equations A-1 and A-2 of Appendix A. Curves for these equations are shown as heavy, solid lines in Figs. B-14a and B-14b. Measured values were used for the parameters !min• fu, A 5 and D in the equations, and a value of 0.3 was assumed for r/11. The mean fatigue performance for the finite-life test data is comparable to the mean fatigue performance represented by Eq. A-1. The long-life test data fall consistently above the design fatigue limit of Eq. A-2.
B-15

Plots of stress range versus the logarithm of number of cycles are shown in Figs. B-15a through B-15i for mechanical connectors, and in Figs. B-15k through B-151 for welded splices. Data are listed in Tables B-13a through B-13d, inclusive. Symbols and the dashed lines on the figures have the same meaning as for the plots of unspliced bars. Additionally, the solid, thin lines shown on the figures represent the mean fatigue performance of the appropriate size of unspliced bar. These lines were shown previously as the dashed lines on Figs. B-14a and B-14b.
For long-life fatigue tests on splices, no fatigue data were available to assist in establishing an accurate initial stress range for the staircase tests. Very often, because the initial test stress range was far from the actual fatigue limit stress range, four to six specimens were tested before the first runoutfailure or failure-runout sequence was achieved. For several splice groups, one or two finite-life tests (i.e.: fatigue lives less than 1 million cycles) were carried out prior to any long-life test in order to better estimate an initial stress range for the long-life tests. These data are also shown on the S-N plots.
Two No. 5, cold-swaged steel coupling sleeve specimens slipped in a grip during fatigue testing. The problem was traced to improper mixing of the grout used in the grip. The specimens were discarded and were not included among the reported data.
All tests of mechanical connectors or welded splices embedde9 in a concrete beam ended with a fatigue fracture of the reinforcing bar adjacent to the connector or weld, or with a runout. No beam failed by fatigue of concrete. One beam containing a wedge-sleeve coupling fractured in the bar at the location of a strain gage. This beam was not included among the reported data.
The test machine for the larger beam test setup behaved erratically during two tests of beams containing No. 5 wedge-sleeve couplings. In both instances, the test machine was shut down for repair at the conclusion of the test on these particular specimens. Data for these two specimens were inconsistent with other data for the same type of splice, and therefore were not included among the reported data.
Fathme Fracture of Test Specimens. The fatigue fractures of unspliced bars, mechanical connectors and welded splices were examined visually with the unaided eye. Fatigue fractures for both No. 5 and No. 8 unspliced bars were similar and, with one exception, always initiated at the base of a transverse lug. The fracture of one No. 5 bar initiated at a bar mark.
Three categories of fractures, called A, B, and C, were identified for unspliced bars and are illustrated in Fig. B-16. Type A fracture has a single initiation site a the base of a transverse lug; Type B has a single initiation site at the junction of the transverse lug and longitudinal rib; and Type C has multiple initiation sites along the base qf the transverse lug._ Fracture Type C always occurred in specimens tested in the finite-life region of the S-N curve; i.e.: at stress ranges greater than about 32.5.ksi. The fractures are similar to those observed in other tests of unspliced reinforcing bar (4).
The fractures of mechanical connectors and welded splices were categorized based on the location of the fracture relative to the connector or weld, and the apparent location of the initiation site on the fracture surface. Observations are summarized in Tables B-14a, B-14b and B-14c, for non-threaded mechanical connectors, threaded mechanical connectors, and welded splices, respectively. The tables include approximate percentage distribution of the fracture categories within a test group. Photographs of representative fractures are shown in Figs. B-17a through B-17j and are cross-referenced to the appropriate test group in the tables.
Every type of mechanical connector and one type of welded splice exhibited more than one fracture type. For the threaded-swaged coupler-sleeve, the taper-threaded coupler, and the double-lap welded splice, specimens tested in the finite-life region of the S-N curve tended to have fractures belonging almost exclusively to one category. Similarly, fractures of cold-swaged sleeve and taperthreaded coupler specimens having either relatively large or relatively small eccentricities also tended to belong to one particular category. These instances are noted by comments in Tables B-14a, B-14b and B-14c.
B-16

TABLE B-1 · BAR GROUPS
Bar Bar Cut Bar Range of Bar Group Coating Length Serial Numbers
(in.) within Group
No. 5 None 48 1 - 150
No. 5, epoxy-coated Epoxy 48 1 .. 25
No. 5, long None 96 1 .. 50
No. 8 None 48 1 .. 250
TABLE B-2 ·SPLICE TYPES
Splice Type Abbreviated Figure Bar Test Group Generic Name Name Number Group(s) I.D.
Mechanical Connectors
Cold-swaged steel coupling sleeve Cold-swaged sleeve B-6a No. 5 5B-CSC1
No. 5, epoxy 5E-CSC1
Two-piece cold-swaged steel Threaded-swaged sleeve B-6b
No. 5 5B-CSC2 coupling sleeve with threaded ends No. 8 8B-CSC2
Grout-filled coupling sleeve Grout-filled sleeve B-6c No. 8 8B-GFCS
Steel-filled coupling sleeve --
Steel-filled sleeve -
B-6d No. 8 8B-SFCS
Taper-threaded steel coupler Taper-threaded coupler B-6e No. 8 8B-TPTH
Straight-threaded coupler with NC Straight-threaded coupler B-6f No. 8 8B-STIH threads (bar not upset at threads)
Steel coupling sleeve with wedge Wedge-sleeve coupling B-6g No. 5, long 5L-WEDG
Welded Joints
Double-lap splice (Indirect butt Double-lap weld B-6h No. 8 8B-DLAP
splice using two bars) Modified double-lap welda B-6h No. 5 8B-MLAPa
Single-lap splice (Direct lap splice Single-lap weld B-6i No. 5, long SL-SLAP with bars in contact)
(a) This is a modified double lap configuration using No. 8 main bars and No. 5 side bars. Because fatigue fractures initiated in the No. 5 side bars, splice size was considered No. 5. However, bar serial numbers from the No. 8 bar group were used randomly.
B-17

TABLE B-3 - ARRANGEMENT OF TEST PROGRAM
Splice Type No. 5 Bars
Test Numbers of Group Snecimens Tested
I.D. Long Finite Static
Unspliced bar 5B-UNSP'1
Mechanical Connectors
Cold-swaged sleeve 5B-CSC1 5E-CSC1b
Threaded-swaged sleeve 5B-CSC2
Grout-filled sleeve ---
Steel-filled sleeve ---Taper-threaded coupler ---Straight-threaded coupler ---Wedge-sleeve coupling 5L-WEDG
Weld!:d ,Joints
Double-lap weld 8B-MLAP
Single-lap weld SL-SLAP
(a) Acronym UNSP designates unspliced bars. (b) Fabricated using epoxy-coated bar.
Life Life
15 8 2
14 0 2 12 0 2
16 0 2
12 0 2
14 0 1
15 0 2
B-18
No. 8 Bars
Test Numbers of Group Snecimens Tested
I.D. Long Finite Static Life Life
8B-UNSPa 16 10 3
---
8B-CSC2 12 0 2
8B-GFCS 16 0 2
8B-SFCS 15 0 2
8B-TPTH 15 7 2
8B-STTH 16 0 2
---
8B-DLAP 12 6 2
---

TABLE B-4 • NOMINAL TEST BEAM DIMENSIONS
Splice Tested Width, b Nominal Effec- Shear Support Beam in Beam Group tive Depth, d Span, a Position, g Length, L
(in.) (in.) (in.) (in.) (in.)
Wedge-sleeve coupling 6 6 24 6 84
Single-lap welda 6 6 24 6 84
Single-lap welda 6 6 28 2 84
(a) Beams containing single-lap weld splices were divided into two groups based on the length of the shear span for the beam as installed in the test setup.
Bar Size
No. 5
No. 8
TABLE B-5 • PHYSICAL PROPERTIES OF REINFORCING BARS
Bar Area Number of Observed Tensile Elongation Size Samples Yield Point Strength in 8 in.
(in2) (ksi) (ksi) (percent)
No. 5 0.305 2 60.2 101.3 16
No. 8 0.756 3 69.la 111.7 15
(a) In one of three specimens tested, no distinct yield point was observed. Value is average of two samples with a distinct yield point. Stress at 0.35 and 0.50 percent strain of the other sample was 71.7 and 76.7 ksi, respectively.
TABLE B-6 ·CHEMISTRY OF REINFORCING BARS
Element (Percent)
c Mn p s Si Ni Cr Mo Cu --
0.48 0.74 0.024 0.036 0.18 0.10 0.08 <0.03 0.32
0.39 0.90 0.050 0.047 0.20 0.26 0.20 0.03 0.56
B-19
v <0.01
<0.01

TABLE B-7 ·AVERAGE MISALIGNMENT OF SPECIMENS TESTED IN AIR
Splice Type Bar Type No. of Component "a" Component "b" Specimens Total Mis-
Measured Mean Std. Dev. Mean Std. Dev. alignment (in.) (in.) (in.) (in.) (in.)
No. 5 16 .11 .05 -- -- .11 Cold-swaged sleeve
No. 5, Epoxy 12 .11 .05 .11 -- --No. 5 16 .15 .04 -- -- .15
Threaded-swaged sleeve No. 8 12 .05 .02 .05 -- --
Grout-filled sleeve No. 8 16 .06 .02 .11 .04 .17
Steel-filled sleeve No.8 16 .09 .02 .07 .01 .16
Taper-threaded coupler No. 8 22 .02 .01 -- -- .02
Straight-threaded coupler No. 8 15 .04 .02 -- -- .04
Double-lap weld No. 8 18 .05 .02 -- -- .05 --Mol:iified double-lap weld No. 5 14 .03 .01 -- -- .03
B-20

TABLE B-8 - STATIC STRENGTH OF SPLICES IN AIR
Splice Type Bar Type Tensile Mode of Failure Strength3
(ksi)
No. 5 97.1 Bar fracture in free length 97.4 Bar fracture in free length
Cold-swaged sleeve 99.4 Bar fracture in free length
No. 5, Epoxy 99.7 Bar slipped from sleeve
No. 5 97.1 Bar fracture in free length 98.1 Bar fracture in free length
Threaded-swaged sleeve 69.7 Slow slip of bar from male threaded sleeve
No. 8 86.6 Sudden slip of bar from male threaded sleeve
Grout-filled sleeve No. 8 105.2 Slow slip of bar from sleeve 107.1 Bar fracture in free length
Steel-filled sleeve No. 8 105.4 Fracture of bar at test machine grip 108.2 Fracture of bar at test machine grip
Taper-threaded coupler No. 8 100.9 Fracture of bar at about third engaged thread 101.4 Fracture of bar at first engaged thread
Straight-threaded coupler No. 8 69.2b Fracture of coupling sleeve 82.9b Fracture of coupling sleeve
Wedge-sleeve coupling No. 5 63.5c Fracture of bar inside sleeve at wedge 89.0c Fracture of bar at sleeve
Modified double-lap weld No. 5 99.0 Fracture of No. 5 bar
Double-lap weld No. 8 94.6 Shear fracture through weld metal 95.7 Shear fracture through weld metal
Single-lap weld No. 5 82.6c Fracture of bar at weld 84.2c Fracture of bar at weld
(a) Based on nominal area of bars. (b) To achieve strength requirements in certain applications, the manufacturer of this dowel bar substitution device
requires substitution of both bar and sleeve of the next larger size. ( c) In-plane rotation of specimen at joint occurred because of offset of bars at the joint for these two types of splices.
Consequently, in-air strengths and failure modes may not be representative of in-beam behavior.
B-21

TABLE B-9 - RESIDUAL DEFORMATION OF CONNECTORS IN AIR
Splice Type Bar Type Number of Mean Residual Standard Specimens Deformation Deviation
(in.) (in.)
No. 5 6 .002 <.001 Cold-swaged sleeve
No. 5, Epoxy 5 .002 .001
No. 5 3 .014 .002 Threaded-swaged sleeve
No. 8 4 .018 .002
Grout-filled sleeve No. 8 3 .003 .001
Steel-filled sleeve No. 8 6 .003 .001
Taper-threaded coupler No. 8 3 .003 .001
Straight-threaded coupler No. 8 4 .004 .001
TABLE B-10 - TEST BEAM CONCRETE PROPERTIES
Splice Tested No. of Compressive Strength (psi) Modulus of Elasticity (10° psi) in Beam Group Beams Mean Std. Dev. Mean Std. Dev.
Wedge-sleeve coupling 13 5220 570 4.64 0.21
Single-lap weld 16 4900 330 4.55 0.35 - -
TABLE B-11 - MEASURED TEST BEAM PROPERTIES
Splice Tested No. of Beam Width, b Effective Depth, d Crack Spacing in Beam Group Beams (in.) (in.) (in.)
Mean Std. Dev. Mean Std. Dev. Mean Std. Dev.
Wedge-sleeve coupling 13 6.04 .04 5.99 0.10 7.3 1.4
Single-lap weld 16 6.03 .04 5.91 0.10 6.6 1.1
B-22

SpecimenI.D.
StressRangr(ksÐ
Numberof Cycles
Result FractureTyp€
Comments
5B{05-UNSP5B448.UNSP5B-135-UNSP58499.UNSP5810I.-UNSP5BlO4.UNSP5B-14GUNSP5B489.UNSP58{79-UNSP5B42O.UNSP5813}UNSP5B-138-UNSP5B-081-UNSP58474-UNSP5B{46UNSP5B-12}UNSP5&12I-UNSP5B{5GUNSP5B-1l7-UNSP5Þ002-uNsPsB-137-UNSP5B.OgCUNSP5B-OOI-UNSP
33.00
32.0033.00
32.ffi31.00
30.0031.00
30.0031.00
32.00
33.00
32.0031.00
30.00
31.00
325035.00
40.00,10.00
,10.00
475047504750
I326000
5013000
1029000
n49cnn2U&æ50000002866000
5760000535.5000
50000001301000
27830004751000
5046000
?s72t001705000
887000
3400ü)437000
441000
2440[02320û196000
tal¡urerunoutfailu¡efailurefailurerunoutfailurerunoutrunoutrunoutfailurefailurefailurerunoutfailurefailurefailu¡efailurefailurcfailurefailurefailurcfailurc
clb
B/cBA
clBB
c/B
cBB
BAccD
B/Cc
clBc
Actual range 325 ksi
Rerun 332,@0 at 40.0 ksi
Rerun 378,000 at 40.0 ksi
Actual range 325 ksi
Initiated at bar mârk
8B-OTGUNSP8B42GUNSP8B406UNSP8B-152-UNSP88455-UNSP8B.184.UNSP88434-UNSP8B{05-UNSP88435.UNSP8B-186-UNSP8B-145.UNSP88-142-UNSP88-07}UNSP8B-247-UNSP8B{ÓI-UNSP8&171-UNSP884æ.UNSP88425-UNSP8B48GUNSP8B472.UNSP8B181.UNSP8819+UNSP8815&UNSP88498.UNSP88129-UNSP8È046UNSP
28.0027.ffi28.00
29.0030.0031.0030.0029.ffi30.0031.00
30.0031.00
32.û31.00
30.00
29.ú33.9033.90
33.9036.80
41.8041.80
41.80
49.û49.û49.ñ
24900005100000
5125000
52100005050000
182900011800005000000
5103000L744cfn51740005000000
3ó000003105000
t207mÆ5197000
1738000240/oú912000920000
æ9000655000
339000248000
1490002ßm
failurerunoutrunoutrunoutrunoutfailurefailurerunostrunoutfailurerunoutrunoutfailurefailurefailurerunoutfailurefailurcfailurefailurcfailu¡efailurcfailurefailurefailurefailure
BcB
BBA
ABAcBcBccc
AA
A
Rerun 389,000 at 41..8 ksiRerun 502,000 at 41.8 ksi
Actual range 30.0 ksi
Actual range 31.4 ksi
TABLE 8.12 . FATIGUE DATA FOR UNSPLICED BARS
B-23

SpecimenI.D.
StressRange(ksÐ
Numberof Cycles
Result FractureTVpe
Avg. TotalMisalignmenl
(inJ
Comments
58098-C5C158-062-CSC1.58147-CSC15&132-CSC158484-CSCl58427-CSC158469-CSCl58105-CSC15B49}CSC15847!CSC158{1GCSC158142-CSC15B{91-CSC158122-CSC1
18.00
19.0018.00
17.0018.00
17.0018.0017.00
16.00
17.0016.00
15.001ó.00
20.00
10000000
36300020800æ50000004678000
81,10000
lTnW30330007700000
18370004917mO50500001881000
933000
runoutfailurefailurerunoutfailurcrunoutfailurefailurcrunoutfailurefailurcrunoutfailurefailure
BA
A
AA
AA
AA
u.t5a0.2t90.100
0.0500.082
0.160.1000.084
0.056
0.1310.0740.1240.182
0.149
5E401-CSC15E42GCSC15Efi&C,sC15E{O4-CSC15E{22-CSC158012-CSC15E{05-CSC15E{19-CSC15Þ015-CSC15FÆ14-CSC15E-018-CSC15E{21-CSCl
17.00
18.0019.00
18.0019.00
20.0019.00
20.0021.00
20.0021.0022.ú
5000000
10300000æ70000500000070m00046280æ5000000
10600000
9.10000
5000m07900000
105L000
runoutrunoutfailurerunoutrunoutfailurerunoutrunoutfailu¡erunoutrunoutfailure
A
A
B
A
0.159
0.1070.141
0.1320.890.1060.099
0.0810-2A8
0.064
0.M20.157
8&1.53GFCS88485-CFCS8B-009-cFCS88487-GFCS8B-r.8GGFCS88-136cFCS88162-GFCS88447-GFCS88167-GFCS88141-GFCS8B-101GFCS881ls-GFCS8814&cFCSSBT3GGFCS88174-cFCS88{38-GFCS
25.00
26.N25.00
u.0023.ffiu.0023.00
u.ú23.æ4.ffi23.00
u.æ27.n28.0029.ffi$.00
7600000
13900001838000
2375000
5900000
20140009159000
2Í3620ú81.00000
1563000
510ün05000000483000
434000
389000
4061.000
funoutfailurefailurefailureiunoutfailurefunoutfailurerunoutfailurerunoutrunoutfailurcfailurefailurefailure
AAA
A
B
AlB
cAAB
0.106
0.031
0.1420.ffi10.071.
0.070
0.100
0.118
0.081
0.045
0.0ó1.
0.1620.106
0.0570.1ffi0.03ó
Rerun 5,000,000 at 26.0 ksi
TABLE 8.13a . FATIGUE DATA FOR SPLICED BARS
B-24

TABLE B-13b - FATIGUE DATA FOR SPLICED BARS (CONTINUED)
Specimen Stress Number Result Fracture Avg. Total Comments I.D. Range of Cycles Type Misalignment
(ksi) (in.)
8B-117-SFCS 14.00 7600000 runout 0.116 8B-230-SFCS 15.00 3064000 failure A 0.128 8B-217-SFCS 14.00 3080000 failure A 0.106 8B-016-SFCS 13.00 9800000 runout 0.107 8B-160-SFCS 14.00 3525000 failure A 0.063 8B-157-SFCS 13.00 9828000 runout 0.089 8B-179-SFCS 14.00 7800000 runout 0.103 8B-032-SFCS 15.00 1588000 failure B 0.087 Coupling fracture 8B-188-SFCS 14.00 2600000 failure A 0.099 8B-168-SFCS 13.00 4789000 failure B 0.107 Coupling fracture 8B-067-SFCS 12.00 5020000 run out 0.128 8B-003-SFCS 13.00 1686000 failure A 0.117 8B-053-SFCS 12.00 5000000 run out 0.115 8B-104-SFCS 13.00 2293000 failure A 0.076 8B-232-SFCS 12.00 5000000 run out 0.055 8B-135-SFCS 10.00 5400000 run out 0.118
5L-047-WEDG 24.10 5000000 runout A - Rerun to break beam 5L-011-WEDG 25.20 3588000 failure A -5L-019-WEDG 24.50 5000000 runout - Rerun to break beam 5L-050-WEDG 23.50 1617000 failure B - At strain gage 5L-001-WEDG 22.50 2702000 failure B - At bar mark 5L-027-WEDG 22.40 3332000 failure B - At base of lug 5L-029-WEDG 22.20 5000000 run out A - Rerun to break beam 5L-021-WEDG 22.10 4261000 failure B - At base of lug 5L-042-WEDG 19.80 5000000 runout A - Rerun to break beam 5L-002-WEDG 31.30 317000 failure A -5B-078-CSC2 7.00 3892000 failure A 0.138 5B-070-CSC2 6.00 5090000 runout 0.252 5B-107-CSC2 7.00 2300400 failure A 0.111 5B-004-CSC2 6.00 5000000 runout 0.162 5B-003-CSC2 7.00 5600000 runout - Misalg. data not recorded 5B-019-CSC2 8.00 1902000 failure A 0.143 5B-022-CSC2 7.00 4222000 failure A 0;182 5B-076-CSC2 6.00 1715000 failure A 0.220 5B-040-CSC2 5.00 5300000 runout 0.085 5B-145-CSC2 6.00 4695000 failure A 0.135 5B-054-CSC2 5.00 5750000 runout 0.193 5B-060-CSC2 6.00 5900000 runout 0.172 5B-024-CSC2 9.00 988000 failure A 0.222 5B-065-CSC2 10.00 4628000 failure A 0.159 5B-055-CSC2 20.00 327000 failure B 0.154 5B-050-CSC2 40.00 19500 failure B 0.150 Not plotted
B-25

SpecimenI.D.
StressRange(ksÐ
Numberof Cycles
Result FractureTyp€
Avg. TotalMisalignmenl
(in.)
Comments
8B201CSC288492-CSC288-181CSC28&204-CSC2881ó5-CSC28B,12,1-CSC2
8B{3}CSC288207-CSC288-12GCSC288119-CSC288429-CSC28È201-CSC2
E.00
7.00
8.00
9.00
10.00
9.00
8.00
9.00
8.009.00
10.00
11.00
1944000
ó200000
5070000
89000001æ1000994000
5000000
31800009300000
50000005600000
1295000
ta!¡urerunoutñ¡noutfailurtfailurefailurerunoutfailurerunoutrunoutrunoutfailure
A
AAA
B
B
0.083
0.029
0.057
0.059
0.107
0.080
0.050
0.059
0.03fÌ
0.053
0.050
Analize âs runout
Misalg. data not recorded
8ÞO5g.TPTH8848I-TPTH8B{30-TrrH8&23&TPTH88457-TrrH8B22I.TPTH8B-08&TrrH8844u--TPTH88A44:TFrIl88462-TrrH882I&TPTH88225-TrrH8822}TPTH88-212-TFTH8B497.TFTH8B466TPTH8B{8&TruH88427-TFTTH88182-TrrH88-061-TrrH8B-175-TFrH8B-198-TPîH
19.00
20.00
19.00
18.0019.00
20.0019.00
20.00
21.40
22.W23.ú22.æ15.00
18.0019.00
41.80
41.8041.8041.8049.ñ49.û49.û
5000000
22t900027250æ5finþo503æ0026900005300000
50000005200m052000001106000
50000005300000
54&r0005800000
1.61400
?2tm23050014{1000
104000100100
109600
runoutfailurefailurerunoutrunoutfailurerunoutrunoutrunoutfunoutfailurerunoutrunoutrunoutrunoutfailurefailurefailurcfailurefailurefailurefailuiè
AA
A
A
B
ABABBAB
0.019
0.036
0.023o.o290.0380.0180.M20.0400.034
0.0150.043
0.0n0.023
0.0070.0770.010
0.025
0.0190.030
0.0480,0100.007
Rerun 173,000 at 41.8 ksi
8B2lGTCNC8B24GTCNC8&114-TCNC88421-TCNC88-052-TCNC88449-TCNC88-017-TCNC8B{gr-'.TCNC881o1-TCNC88164-TCNC88{1&TCNC88128-TCNCSBI4GTCNC88007-TCNC88127-TCNC8B-21g-TCNC
11.00
12.0011.0012.00
13.00
14.0013.00
L2.n13.00
14.0015.00
14.00
10.00
15.00
20.0041.80
5900000z4s2cnn50m00050500005200000
æ10002825W64000005000000
630000016s4000
47340po
5037000
5040001338000
37ffi
runoutfailurcrunoutfunoutrunoutfailurefailurclt¡noutrunoutrunoutfailurefailurerunoutfailurefailurefailurc
AA
Bc
A
B
0.025
0.0670.0n0.0430.034
0.0660.058
0.0ó3
0.052
0.060
0.035
0.057
0.066
0.0ó2
0.022
Fracture not recorded
Misalg, data not ¡ecorded
Fracture not recorded
TABLE B-13c - FATIGUE DATA FOR SPLICED BARS (CONTINUED)
B-26

TABLE B-13d - FATIGUE DATA FOR SPLICED BARS (CONCLUDED)
Specimen Stress Number Result Fracture Avg. Total Comments I.D. Range of Cycles Type Misalignment
(ksi) (in.)
88-178-DLAP 10.00 2415000 failure A 0.049 88-054-DLAP 9.00 9200000 failure A 0.050 Analize as runout 88-237-DLAP 10.00 2581000 failure A 0.064 88-125-DLAP 9.00 5000000 run out 0.053 88-209-DLAP 10.00 6872000 failure A 0.108 Analize as runout 88-019-DLAP 11.00 2625000 failure A 0.071 88-155-DLAP 10.00 5000000 run out 0.021 88-134-DLAP 11.00 2277000 failure A 0.064 88-043-DLAP 10.00 9792000 runout 0.084 88-158-DLAP 11.00 5000000 runout 0.060 88-200-DLAP 12.00 2037000 failure A 0.086 88-224-DLAP 11.00 4615000 failure A 0.028 88-172-DLAP 33.90 122200 failure A O.Q78 88-060-DLAP 33.90 129000 failure 8/A 0.012 88-048-DLAP 33.90 122500 failure A O.Q18 88-249-DLAP 41.80 49000 failure A O.Q75 88-156-DLAP 41.80 49100 failure A 0.077 88-031-DLAP 41.80 52400 failure 8 0.060
88-041-MLAP 8.00 4939000 failure A 0.036 88-099-MLAP 7.00 5000000 runout 0.081 88-109-MLAP 8.00 1944000 failure A,A 0.056 88-042-MLAP 7.00 4740000 failure A,A 0.012 88-089-MLAP 6.00 5300000 runout 0.030 88-091-MLAP 7.00 3956000 failure A 0.045 88-088-MLAP 6.00 6400000 runout 0.048 88-036-MLAP 7.00 5100000 runout 0.037 88-177-MLAP 8.00 4345000 failure A,A 0.047 88-051-MLAP 7.00 5395000 failure A 0.050 Analize as runout 88-093-MLAP 8.00 4792000 failure A 0.036 88-190-MLAP 9.00 3386000 failure A,A 0.026 88-131-MLAP 11.00 1874000 failure A 0.040 88-010-MLAP 15.00 400500 failure A 0.022
5L-039-SLAP 14.10 5000000 tun out A -- Rerun to break beam 5L-030-SLAP 14.50 5000000 run out A - Rerun to break beam 5L-017-SLAP 15.70 5000000 run out A - Rerun to break beam 5L-005-SLAP 17.80 5000000 runout A - Rerun to break beam 5L-014-SLAP 19.50 5000000 runout A - Rerun to break beam 5L-024-SLAP 20.60 1734100 failure A -5L-031-SLAP 20.20 5000000 runout A - Rerun to break beam 5L-010-SLAP 21.20 5000000 runout A - Rerun to break beam 5L-025-SLAP 22.20 5000000 run out A - Rerun to break beam 5L-020-SLAP 24.30 411700 failure 8 -5L-003-SLAP 24.50 358100 failure A -5L-035-SLAP 20.60 3926000 failure 8 -5L-023-SLAP 19.90 5000000 runout A - Rerun to break beam 5L-016-SLAP 19.70 160300 failure A -5L-046-SLAP 20.60 1775000 failure A -
B-27

Splice Type
Cold-swaged sleeve
Grout-filled sleeve
Steel-filled sleeve
Wedge-sleeve coupling
TABLE B-14a ·LOCATION OF FATIGUE FRACTURES FOR NON-THREADED MECHANICAL CONNECTORS
Bar Fracture Distribu· Description of Fracture Site Type Designa· ti on
ti on (percent)
No. 5 A 90 Through bar flush with end of sleeve, initiating at base of transverse lug.
B 10 Through bar a short distance away from end of sleeve, initiating at base of transverse lug.
No. 5, A 75 Same as A, immediately above. Epoxy
B 25 Same as B, immediately above.
No. 8 A 60 Transversely through middle of sleeve, crack initiating at base of bar stop fillet.
B 30 Transversely through middle of sleeve, crack initiating at plugged casting port. In one instance, occurred with a Type A crack.
c 10 In bar at end of sleeve, crack initiating at base of transverse lug.
No. 8 A 75 In bar at first transverse lug engaged within filler metal, initiating at base of lug (often at junction of lug with longitudinal
~ rib),· occasionally having additional crack initiation sites along base of lug.
B 25 Transversely through middle of coupling sleeve, with multiple crack initiation sites in filler metal and/ or around circumference of sleeve.
No. 5 A 80 Through bar near end of sleeve, most often at base of first transverse lug engaged within the sleeve, and initiating at junction of transverse lug with longitudinal rib.
B 20 Through bar at end of sleeve, initiating at deformation immediately outside of sleeve.
B-28
Figure
B-17a
B-17a
----
B-17b
B-17b
B-17b
B-17c
B-17c
B-17d
--

Splice Type
Threaded-swaged coupler
Taper-threaded coupler
Straight-threaded coupler
TABLE B-14b • LOCATION OF FATIGUE FRACTURES FOR THREADED MECHANICAL CONNECTORS
Bar Fracture Distribu- Description of Fracture Site Type Designa- ti on
ti on (percent)
No. 5 A 80 In male threaded half of coupling sleeve at first fully engaged male thread, initiating in exterior root of thread.
B 20 Similar to A, with additional crack initiation sites on adjacent engaged threads. Type B fractures usually occurred in finite-life test specimens.
No. 8 A 65 Same as A, immediately above.
B 35 Same as B, immediately above.
No. 8 A 60 In bar near end of coupler at first fully engaged thread, initiating at exterior root of thread cut into longitudinal rib or transverse lug.
B 40 Similar to A, with additional crack . initiation sites on adjacent engaged threads. All Type B fractures occurred in finite-life test specimens.
No. 8 A 65 In bar near end of coupler at first thread fully engaged with coupler, initiating at
- exterior root of thread.
B 25 Transversely through middle of coupler sleeve, initiating at base of thread cut in coupler sleeve. Specimens with Type B fractures had smaller measured eccentricity.
c 10 Similar to A, with additional crack initiation sites on adjacent engaged threads.
B-29
Figure
B-17e
B-17e
B-17e
B-17e
B-17f
B-17f
B-17g
B-17g
--

TABLE B-14c ·LOCATION OF FATIGUE FRACTURES FOR WELDED SPLICES
Splice Type Bar Fracture Distribu- Description of Fracture Site Figure Type Designa- ti on
ti on (percent)
Double-lap No. 8 A 85 Through main bar, initiating at both B-17h weld terminations of welds at ends of side bars.
B 15 Through side bar, initiating at B-17h terminations of welds at end of main bar. Always occurred in finite-life test specimens, and were usually accompanied by visible cracks for fracture type A, above.
Modified No. 5 A 100 Through No. 5 side bars, initiating at B-17i double-lap terminations of welds at ends of main
weld bars.
Single-lap weld No. 5 A 100 Through bar, initiating at termination of B-17j weld.
B-30

~
I 2-1/4• dia.
t ...
...... .......... .... ' ......
.... ~ '....-
' '
'....-....
~
" N ... , ..._.
"' 3" - 12 UN threads " ,,, .... /
"' ,, ....: ,, I I I I l I \ I \ I I I I I I I I I t! I I ..... I I
I t--
\ I I I I I \ I I I \ I I I I I I I \ I I I I I I I \ I I I I I I I N I I ' ..... I I
l 1-1/16• l 1 1
3" dia.
Fig. B-1 - Details of socket grip
B-31

Grip socket Grout
Splice
Fig. B-2 - Schematic diagram of typical air test specimen

I I I
Upper crosshead
Load cell
'-------+--+----- Gr outed grip n
L-------1-+---- Test specimen
L---------1......+---- G routed grip
I I I I I I I I I I
. I I I I ... _J
Clevis
Piston
Lower crosshead
Hydraulic ram
Base fixture
Fig. B-3 - Test setup for axial tension tests in air
B-33

Stess Range (ksi) 60~~~~~~~~~~~~~~~~~~~~~~~~~~~~~--,
50
40
30
20
- - Mean Fatigue Life
10 -- Design Limits for No. B bars, f u =90 ksi
with f min =6 ksi, (r/h)=0.3
+ Cold-Swaged Sleeve
X Mortar-filled Sleeve
* Steel-filled Sleeve
0 Unspliced Bar
ol.'::::====:r:::==::r====i::::.i__J__j_J__L_~~_j_~..J__L_J__L_J__J--L.J
0.1 10 N, Number of Cycles (millions)
Fig. B-4 - Test data from first pilot test series
Stess Range (ksi) 60~~~~~~~~~~~~~~~~~~~~~~~~~~~~~-,
0 Unaltered bar
50 x Machined bar
() Peened bar
40
30
20
- - Mean Fatigue Life
10 -- Design Limits for No. B bars, fu =90 ksi
with f min =6 ksi, (r/h)=0.3
0 '--~~~--L~~--'-~-'--..--J'---'----'--'---''-'-~~~~-'--~~-'---~'----'---'---'--'-L..J 0.1 10
N, Number of Cycles (millions)
Fig. B-5 - Test data for unspliced specimens from both groups of pilot tests
B-34

Swaged-on coupling sleeve
Fig. B-6a - Cold-swaged steel coupling sleeve
Swaged-on male threaded coupler
Swaged-on female threaded coupler
Fig. B-6b • Two-piece cold-swaged steel coupling sleeve with threaded ends
B-35

Grout port
Internal deformations
Steel coupling sleeve
Grout vent port
Bar stop
Fig. B-6c • Grout-filled coupling sleeve
Filler metal
Fill port
CJ>Upling sleeve
Internal deformations
Fig. B-6d • Steel-filled coupling sleeve
B-36

Tapered threads
Threaded coupler
Fig. B-6e - Taper-threaded steel coupler
- NC threads
Threaded coupler
Fig. B-6f - Straight-threaded coupler with NC thread (bar not upset at threads)
B-37

Steel sleeve
Wedge
Fig. B-6g • Steel coupling sleeve with wedge
Main bar -- Weld
Fig. B-6h - Double-lap weld splice
B-38

Weld
Fig. B-6i - Single-lap weld splice
B-39

Longitudinal axis of splice
Axes of spliced bars
Misalignment = e = a + b
Fig. B-7 • Components of misalignment for axial tension specimens
B-40

X?
Fig. B-8 - Measurement of offset of bar at splice with respect to an ideal centerline
Reference Surface

115 Longitudinal bar
2'-0"
Crack formers 113 Stirrups at 3" o.c.
center (typ)~'~~~-2_'-_0_"~~~~~ UJJJ}· w
7'-0"
A) ELEVATION B) SECTION
. Fig; B-9 - Details of concrete lest beam

Plate, 3"x6"xl/2" ----1h
1 "0 x 6" rod ---+~
Plate, 3"x6"xl/2", on plaster
1
I
12"
~'---'------1Plates, 4"x6"x3/4", grooved to match rod
)-· ~ 6" 0, 2"
I a = 24'' or 2~··
r
2411
84"
12"
1 ~----+I _____ Bearing plate for ram
,___ __ Spreader beam, 6"x6"xl/2" tube
Rod welded to plate
Plates, 4"x6"x5/8"
Support pedestal __ ___,
g = 6" or 2"
a = 24'' Of 28.,
Fig. H-10 - Details of beam test setup

Static loadin
5000
-~ ...... ~ 3000
Repealed Loa din Static loadin
Repeated Load in
Fig. B-11 - Load pattern for concrete test beams tested statically
Static loadi

j No. 8 (one specimen) ----..
60
- No. 8 (two specimens)
50 I I I I
40 I ,-.. I "' I .e-~
"'O <l:S
I 0 I ' -
30 I I I I
No. 5 (three specimens)
20 I
OL_~~~L__L,__~~~--:-.l,,-~~~~-+c-~~~---:::;" 0 0.35 0.5 1.0 1.5 2.0
Stram ( '/<)
Fig. B-12 - Load-deformation curves for unspliced reinforcing bar
B-45

Total Applied Load (kips) 4~~~~~~~~~~~~~~~~~~~~~~~~~~~~~~~,.-~
3
2
0
Calculated
Experimental. Final Static Cycle ----------
Experimental, Initial Static Cycle
10 20
Average Bar Stress (ksi)
30
Fig. B-13 - Comparison of calculated and measured stresses for static test beam containing single lap welded splice
B-46

20
10
0.1 1 N, Number of Cycles (millions)
* Failure
0 Runout
NCHRP 4-7
M:ean
10
Fig. B-14a - Fatigue test data for unspliced No. 5 bar
Stress Range (ksi) 50,--~,..-~,.....,.,-~~~~~~~~~~~~~~~~~~~-,
40
* * 30 ---~---;.--'!-~--t-----
20
* ratlure
10 t> Runoul
NCHRP 4-7
Mean
0.1 1 10 N, Number of Cycles (millions)
Fig. B-14b - Fatigue test data for unspliced No. 8 bar
B-47

40
30
20 ..
10
* Failure
0 Runout
Mean
-------'\-! ___ ..,.. ____ ~----<¥-·
O'--~~--'-~~~-'--'-~-'-~-'--~~~~~'--~--'---'-~~~
0.1 1 10 N, Number of Cycles (millions)
Fig. B-15a - Fatigue test data for No. 5, cold-swaged sleeves
40
30
20
10
0.1
* FailuC"e
0 Runout
Mean
.... 0 -----------..-------g---a--·
1 N, Number of Cycles (millions)
10
Fig. B-15b - Fatigue test data for No. 5, cold-swaged sleeves with epofy-coated bar
Stress Range (k~i) so~~~~~~~~~~~~~~~~~~--~~~~~~
40
30
20
10
0.1
* Failure
0 Ru.nout
Mean
,. .. .. ·------.,.---'lf. ____ .Jtet.>lil38-----
1 N, Number of Cycle• (million•)
10
Fig. B-15c ·Fatigue test data for No. 5, threaded-swaged sleeves
B-48

40
30
20
10
0.1
* Failure
0 Runout
Mean
.. .. 0 ----,.-----*-----a-~---"""t,
1 10 N, Number of Cycles (millions)
Fig. B-lSd - Fatigue test data for No. 8, threaded-swaged sleeves
40
30
20
10
0.1 1 N, Number of Cycles (millions)
* Failure
0 Runout
Mean
10
Fig. B-lSe • Fatigue test data for No. 8, grout-filled sleeves
40
30
20
10
* Failure
0 Runout
Meen
--"'..---r.l.i __ "B ____ illi_.
0
o'---~~--'-~--'~-'----'---'---'--L-'--'--~~---J~~'----'---'---'---'-..L.J~
0.1 10 N, Number of Cycles (millions)
Fig. B-lSf ·Fatigue test data for No. 8, steel-filled sleeves
B-49

Stress Range (ksi) so~~~~~~~~~~~~~~~~~~~~~~~~~
40
30
20
0
10
o~~~-'-~~~-'----'-~-'-~-'--~~~~~~~-'--'-~~~
0.1 1 10 N, Number ol Cycles (millions)
Fig. B-15g · Fatigue test data for No. 8, taper-threaded couplers
Stress Range (ksi) so~~~~~~~~~~~~~~~~~~~~~~~~~
40
30
20
10
0.1
"'
1
"'
* Failure
0 Runout
Mean
---------*:----- -----· "' t.o "' 00
N, Number of Cycles (millions) 10
Fig. B-15h · Fatigue test data for No. 8, straight-threaded couplers
Stress Range (ksi) 60r-~~,,,-~~~~~~~~~~~~~~~~~~~-..,
••
30
20
10
0.1
* Failure
0 Runout
Mean
-----~----~~-""*-*[email protected]
1 N, Number ol Cycles (millions)
10
Fig. B-15i · Fatigue test data for No. 5, wedge-sleeve couplings
B-50

Stress Range (ksi) so~~~~~~~~~~~~~~~~~~~~~~~~~~
* Failure
0 Runout 40 Mean
30
20
10
0.01 0.1 1 10
N, Number of Cycles (millions)
Fig. B-15j ·Fatigue test data for No. 8, double-lap welds
40
30
20
10 "'
* Failure
0 Runout
Mean
,. ________ 1\._ _______ ,.lf~-0---·
O'--~~--'~~-'----'~'--.___,-'-...L.J~~~--'~~'---'---''--'--'-'--"-'
0.1 1 10 N, Number of Cycle$ (millions)
Fig. B-15k ·Fatigue test data for No. 5, modified doublelap welds
40
30
20
10
0.1
*,.
* Failure
0 Runout.
Mean
------,.-------,,-i-------
8
1 N, Number of Cycles (millions)
10
Fig. B-151 ·Fatigue test data for No. 5, single-lap welds
B-51

Fig. B-16 - Fatigue fractures of No. 8, unspliced bar (fractures of No. 5 unspliced bar are similar)

Fig. B-17a - Fatigue fractures of No. 5, cold-swaged coupling sleeves (fractures of No. 5, cold-swaged sleeves with epoxy-
coated bar are similar)
Fig. B-17b - Fatigue fracture of No. 8, grout-filled coupling sleeve
B-53

A Fig. B-17c - Fatigue fractures of No. 8, steel-filled coupling sleeves
Fig. B-17d - Fatigue fracture of No. 5, wedge-sleeve coupling
B-54

Fig. B-17e - Fatigue fractures of No. 8, threaded-swaged sleeves (fractures of No. 5, threaded-swaged sleeves are similar)
A B Fig. B-17f - Fatigue fracture of No. 8, taper-threaded couplers
B-55

Fig. B-17g - Fatigue fractures of No. 8, straight-threaded couplers
Fig. B-17h - Fatigue fractures of No. 8, double-lap welded splices
B-56

Fig. B-17i - Fatigue fracture of No. 5, modified double-lap welded splice
Fig. B-17j - Fatigue fracture of No. 5, single-lap welded splice
B-57


APPENDIX C
ANALYSIS OF TEST RESULTS
The data obtained from this investigation were analyzed to determine estimates of mean fatigue strength and standard deviation. Published and unpublished splice fatigue test data summarized in Appendix A were considered for possible inclusion in the data analyses. No published test data were found suitable for analysis to determine a 5 million cycle fatigue limit. However, long-life fatigue test data from one unpublished report (16) were analyzed using the procedures described in this appendix.
As described in Appendix B, the long-life data were obtained from staircase or "up-and-down" tests, and the finite-life data were obtained from replicate tests. The intent of the long-life test series was to determine the 5 million cycle fatigue limit for each test group, whereas the finite-life tests determined fatigue strength in the finite-life region of the S-N curve, i.e., where fatigue lives are usually less than about 1 or 2 million cycles.
Two-sided tolerance limits, such that it is 95 percent probable that 95 percent of the data fall between the limits, were determined from the estimates of mean and standard deviation. Lower tolerance limits can be used for development of recommended fatigue design procedures.
Staircase Analysis of Long Life Test Data
Two procedures were utilized in the analysis of long-life or staircase test data. The first staircase analysis procedure, that of Lipsom and Sheth (8), uses a weighted-average technique for the calculation of the mean, and a quasi-empirical technique to estimate the standard deviation. The second procedure, developed in NCHRP Report 164 (4) where it was applied to data from fatigue tests of unspliced reinforcing bars, uses a maximum probability approach to simultaneously estimate both the mean and standard deviation.
Staircase Analysis Procedure of Lips om and Sheth. The procedure of Lipsom and Sheth ( 8) directly computes a value for the mean fatigue strength, and can provide an estimate of the standard deviation under certain conditions. The following description of the procedure is taken from Lipsom and Sheth (8):
It is assumed that the underlying distribution of the staircase data is normal. The sample averagei is determined by using only failure data or only runout data, depending on which has the smaller total. The stress levels S, which are equally spaced with a chosen stress interval d, are given coded scores i, where i = 0 for the lowest stress level S0, i = 1 for stress level S0 + d, i = 2 for stress level s0 + 2d, etc.
Suppose that the total of failures is less than the total of survivals. Denoting by ni the number of failures at the coded stress level i, and the total number of failures by I:ni, two quantities A and B are computed:
and B = I:i2n. I
The estimate of the mean is then:
i = S0 + d (A/I:ni ± 1/2) (C-1)
C-1

where + 1/2 is used if runouts are less frequent and -1/2 if failures are less frequent. As to the estimate of the standard deviations, the quantity C is computed:
The estimate of the standard deviation is then:
s = l.62d [C + 0.029] (C-2)
provided C is larger than 0.3; otherwise the standard deviation cannot be estimated.
Analyses according to this procedure were accomplished by entering the data and formulas into a computer spreadsheet.
Staircase Analysis Procedure in NCHRP Report 164. The analytical procedure in NCHRP Rep01t 164 (4) determines values for mean and standard deviation on the basis of maximizing the probability of occurrence for a given outcome of a staircase test sequence.
An iterative procedure is employed to determine the maximum probability. An initial probability of outcome is calculated based on assumed values for mean and standard deviation. The assumed value for the mean is then incremented or decremented, as appropriate, so that an increase occurs in the calculated probability. Next, the assumed value for standard deviation is also incremented or decremented, as appropriate, so that another increase occurs in the calculated probability. The adjustments to the values of mean and standard deviation continue until the calculated probability is maximized.
The probability of occurrence for an entire staircase test series was determined as follows, as described in NCHRP Report 164 (4). The response distribution for each staircase series was assumed to be the cumulative normal distribution. The probability of occurrence of each test within a group was computed from the estimates of mean and standard deviation made for that group. This was done by first determining the difference between the observed stress range for each test and the estimated mean stress range. The difference was normalized in terms of a multiple of the estimated standard deviation. If a test ended with fracture of the test bar, the probability of occurrence for the test result was taken as the tabulated value p of the cumulative normal distribution. On the other hand, if the test ended with a runout, then the probability of occurrenct< was (1 - p). The probability of occurrence for an entire staircase test series was computed as the product of the probabilities for the individual tests.
A computer program utilizing the procedure was previously written ( 4) in Fortran language. The program was adapted for use on a personal computer, and subsequently used to analyze the data reported herein. The adapted program, in lieu of the iterative adjustment of mean and standard deviation, developed a continuous probability surface for a range of mean and standard deviation values, and then located the maximum value of probability on the surface. The mean and standard deviation corresponding to the maximum probability were taken as the mean and standard deviation of the staircase test group.
Limitations of Staircase Analysis Procedures. The basis of classical staircase analysis (11,12,13), from which the above procedures were developed, indicates that for small samples there is a limited range of values for the stress interval within which reliable estimates of the standard deviation can be obtained. Little (11), speaking of very small up-and-down tests, states that while median normal response estimates may be reliably computed with small data sets, "Reliable estimation of the standard deviations of the underlying normal response distribution is quite a different matter however. The upand-down strategy is quite inefficient in this regard. Consequently its s estimates should be used only in the absence of more reliable prior information."
C-2

Little (11) conducted a parametric study of hypothetical small-sample up-and-down test data in which that the interval between tests, d, was taken as 2/3 s, s, and 3/2 s, where s was the standard deviation of the underlying normal response distribution. The study included both maximum likelihood analysis and minimum chi square analysis. The study indicated that there is some effect on the estimate of mean response when d is varied between 2/3 s and 3/2 s. When varying the type of analysis, differences between estimates based on maximum likelihood analysis and chi square analysis were considered negligible. The least difference was observed for test results having equal numbers of failures and runouts. The results of Little's parametric study suggests that when dis in the range 2/3 s :::; d:::; 3/2 s, the estimate of the mean is reliable. It is presumed that, within this interval, the estimate of sis also consistent. Consequently, stated in terms of s, the estimates of mean and standard deviation are reliable when 2/3 d:::; s:::; 3/2 d.
Tolerance Limits on Test Data. Historically (4), reinforcing steel fatigue design limits are derived from test data by taking the lower limit of the two-sided tolerance limits such that it is 95 percent probable that 95 percent of the data fall between the limits. The lower limit for this particular two-sided case is identical to the lower, one-sided tolerance limit such that it is 95 percent probable that 97.5 percent of the data fall above the limit. The limits are calculated from the formula:
lower limit = x -k s (C-3)
where x is the mean, k is a tolerance limit factor, and s is the estimated standard deviation. Tolerance limit factors, k, can be found in tables published in a statistical handbook (15). The
magnitude of the tolerance limit factor k is a function of the level of confidence, the desired proportion of population within the limits, and the sample size. Two-sided tolerance limits factors for the case that it is 95 percent probable that 95 percent of the will data fall between the limits are given in Table. C-1.
Results of Analyses on Lom: Life Data. All groups of long-life fatigue test data were analyzed by the procedures of both Lipsom and Sheth (8) and NCHRP Report 164 ( 4), as described previously. As mentioned in Appendix B, a staircase test sequence was considered to commence with the first occurrence of two consecutive specimens having differing results; that is, a staircase test sequence commenced with the first two consecutive tests which resulted in a runout followed by a failure, or a failure followed by a runout. The two data points and subsequent data were then entered into the analyses of staircase test data. The staircase data obtained in this investigation are illustrated in Figs. C-la and C-lb for unspliced bar, and Figs. C-2a through C-2m for splices. Also shown on the figures are mean fatigue limit and lower tolerance limit stress ranges, determined as described in the following paragraphs.
Results of initial analyses are summarized in Table C-2 for each group of long-life fatigue tests. Between the two techniques, estimates of the mean differ by no more than 1.0 ksi for all groups except the taper-threaded couplers. The differences in estimates of the mean are considered minor.
Estimates of standard deviation, however, differ significantly for several data sets. The results of Little's parametric study, as discussed above, can be applied to data from Table C-2. For specimens tested in air where the stress interval was 1.0 ksi, the resulting range of reliable estimates is 0.66 to 1.5 ksi. It can be observed that for groups having estimates of standard deviation within this range, the estimates differ by less than 0.1 ksi, but that for groups having estimates outside this range, the estimates differ by 0.3 ksi or more.
Data for groups having estimates of standard deviation outside the range of reliable estimates were adjusted using the following procedures. A "new'' stress interval was selected, specifically 2.0 ksi for splices tested in air. Either even or odd values of stress range were chosen (i.e.: ... , 20, 22, 24, ... ; or: ... , 21, 23, 25, ... ). It was assumed that, for failure data, if the tested stress range did not coincide exactly with one of the "new'' stress ranges, the next higher stress range was used. Conversely, for runout data,
C-3

if the test stress range did not coincide with one of the chosen stress ranges, the next lower stress range was used. For example, where even values of stress range were chosen: a failure at 22 ksi remained at 22 ksi, but a failure at 21 ksi became a failure at 22 ksi; and a runout at 20 ksi remained at 20 ksi, but a runout at 21 ksi became a runout at 20 ksi.
When the adjusted data resulted in two consecutive, identical results (i.e.: two consecutive failures at 22 ksi, or two consecutive runouts at 20 ksi), an attempt was made to re-utilize the data point at the end of the adjusted staircase sequence. If a data point did not logically fit into the staircase sequence, it was discarded.
Results of analyses on adjusted data are summarized in Table C-3. Estimates of the mean remain essentially the same as those shown previously in Table C-2 for unadjusted data, whereas estimates of standard deviation are typically smaller. For the taper-threaded coupler, the two analytical techniques provide similar results using adjusted data, whereas results differed with unadjusted data. For all groups of data in general, the estimates of standard deviation for the two analytical techniques using adjusted data differ by no more than about 0.2 ksi, and are generally within the range of reliable estimates, which becomes 1.33 to 3.0 ksi for the adjusted stress interval of 2.0 ksi.
For connectors and splices embedded in beams, the stress range could not be precisely calculated until after a beam test was complete and the actual effective depth of the reinforcing bar could be measured. Therefore, the applied stress range for the test beams was not always the intended nominal value. As a consequence, stress intervals between successive specimens varied. While the staircase analysis procedure of NCHRP Report 164 accommodates a varying stress interval, the procedures of Lipsom and Sheth assume a constant stress interval. Therefore, for the analyses according to Lipsom and Sheth given in Table C-2, the data for splices embedded in beams were adjusted using the procedure described above with a chosen stress interval of 1.5 ksi. The data summarized in Table C-2 indicates differences of 1.0 ksi or less between the estimates of the mean for the two analytical techniques, but estimates of standard deviation differ significantly. It is noted that the estimates provided by the Lipsom and Sheth technique fall within the range of reliable estimates for a stress interval of 1.5 ksi, but that the estimates provided by the techniques of Report 164 appear unreasonably large. The large values can be attributed in part to the variability in stress intervals and in part to the limited number of data points within a beam test series. It is likely that if a longer series of staircase data were provided, the estimates of standard deviation for the two analytical techniques would differ by a lesser degree (11,13).
Lower tolerance limits on stress range, computed using the procedure described earlier, are also given in Tables C-2 and C-3. Comparing 19wer limits determined from results of the two analytical procedures on unadjusted data summarized in Table C-2, the values differ by a small amount where the estimated standard deviation is within the range of reliable estimates, but differences increase to 1.0 ksi or more where the estimated standard deviation falls outside the range of reliable estimates: For the adjusted data of Table C-3, the lower limits generally differ by less than 1.0 ksi when comparing results of the two analytical techniques. Lower tolerance limits based on adjusted data are generally higher than lower limits based on unadjusted data.
The final staircase data analyses are summarized in Table C-4. Included are the analyses results summarized previously in Table C-2, except results from Table C-3 are used for test groups where data were adjusted. The table is limited to the results of the analyses according to the procedure of Lipsom and Sheth since the NCHRP Report 164 procedure yields generally similar values. The results summarized in Table C-4 were illustrated previously on the staircase data plots of Figs. C-la and C-lb for unspliced bars, and Figs. C-2a to C-2m for splices.
It is noted that some of the staircase data appear biased, where the test results seem to be dependent on the order of testing. This is most pronounced in Figs. C-2a and C-2b, for example. A review of the test records revealed that the test schedule for these two groups overlapped. Tests on a portion of the specimens from each group were carried out on the same test machine during the same calendar month, with specimens being alternated between the two groups. Also, as stated previously
C-4
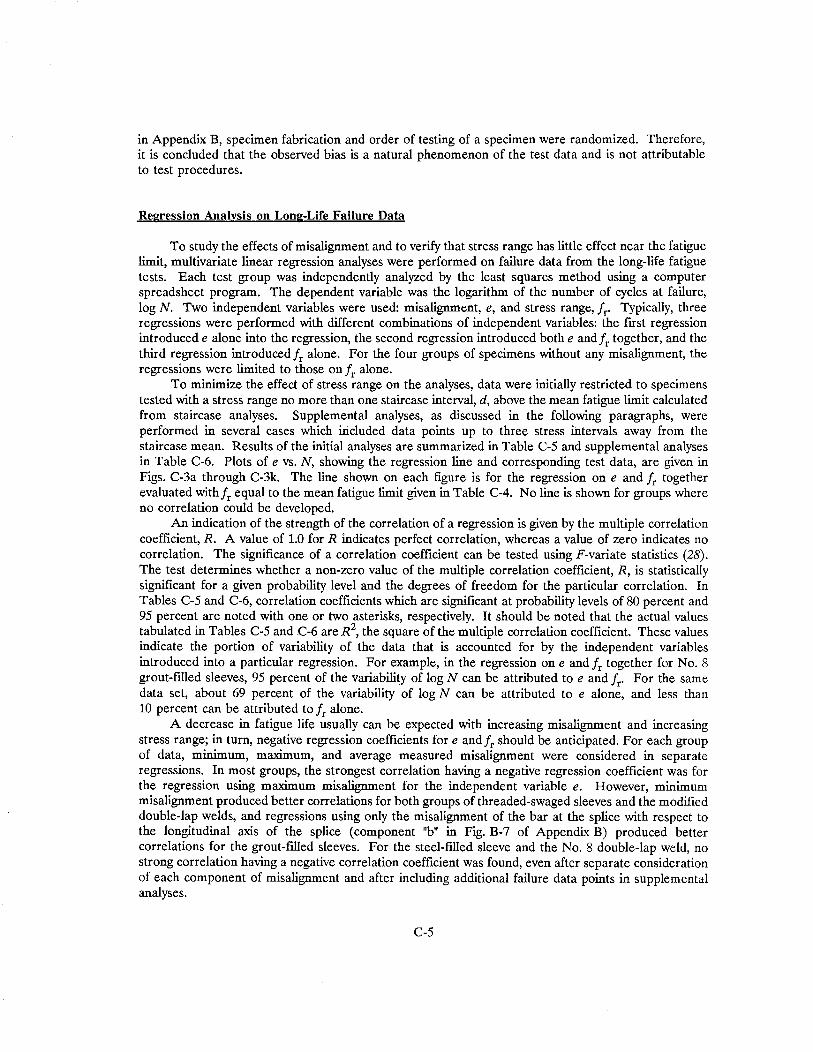
in Appendix B, specimen fabrication and order of testing of a specimen were randomized. Therefore, it is concluded that the observed bias is a natural phenomenon of the test data and is not attributable to test procedures.
Regression Analysis on Long-Life Failure Data
To study the effects of misalignment and to verify that stress range has little effect near the fatigue limit, multivariate linear regression analyses were performed on failure data from the long-life fatigue tests. Each test group was independently analyzed by the least squares method using a computer spreadsheet program. The dependent variable was the logarithm of the number of cycles at failure, log N. Two independent variables were used: misalignment, e, and stress range, fr- Typically, three regressions were performed with different combinations of independent variables: the first regression introduced e alone into the regression, the second regression introduced both e andfr together, and the third regression introduced fr alone. For the four groups of specimens without any misalignment, the regressions were limited to those on fr alone.
To minimize the effect of stress range on the analyses, data were initially restricted to specimens tested with a stress range no more than one staircase interval, d, above the mean fatigue limit calculated from staircase analyses. Supplemental analyses, as discussed in the following paragraphs, were performed in several cases which included data points up to three stress intervals away from the staircase mean. Results of the initial analyses are summarized in Table C-5 and supplemental analyses in Table C-6. Plots of e vs. N, showing the regression line and corresponding test data, are given in Figs. C-3a through C-3k. The line shown on each figure is for the regression on e and fr together evaluated withfr equal to the mean fatigue limit given in Table C-4. No line is shown for groups where no correlation could be developed.
An indication of the strength of the correlation of a regression is given by the multiple correlation coefficient, R. A value of 1.0 for R indicates perfect correlation, whereas a value of zero indicates no correlation. The significance of a correlation coefficient can be tested using F-variate statistics (28). The test determines whether a non-zero value of the multiple correlation coefficient, R, is statistically significant for a given probability level and the degrees of freedom for the particular correlation. In Tables C-5 and C-6, correlation coefficients which are significant at probability levels of 80 percent and 95 percent are noted with one or two asterisks, respectively. It should be noted that the actual values tabulated in Tables C-5 and C-6 are R2, the !;quare of the multiple correlation coefficient. These values indicate the portion of variability of the data that is accounted for by the independent variables introduced into a particular regression. For example, in the regression on e and fr together for No. 8 grout-filled sleeves, 95 percent of the variability of log N can be attributed to e and fr. For the same data set, about 69 percent of the variability of log N can be attributed to e alone, and less than 10 percent can be attributed to fr alone.
A decrease in fatigue life usually can be expected with increasing misalignment and increasing stress range; in turn, negative regression coefficients fore andfr should be anticipated. For each group of data, minimum, maximum, and average measured misalignment were considered in separate regressions. In most groups, the strongest correlation having a negative regression coefficient was for the regression using maximum misalignment for the independent variable e. However, minimum misalignment produced better correlations for both groups of threaded-swaged sleeves and the modified double-lap welds, and regressions using only the misalignment of the bar at the splice with respect to the longitudinal axis of the splice (component "b" in Fig. B-7 of Appendix B) produced better correlations for the grout-filled sleeves. For the steel-filled sleeve and the No. 8 double-lap weld, no strong correlation having a negative correlation coefficient was found, even after separate consideration of each component of misalignment and after including additional failure data points in supplemental analyses.
C-5

The initial regression coefficients fore with the straight-threaded coupler appear greater than those of other groups. For this particular group of data, however, the range in e was relatively small. Therefore, additional data from this group were included in supplemental regression analyses. The coefficients from the supplemental analyses appear more reasonable.
The number of data points in two groups, the cold-swaged sleeves with No. 5, epoxy coated bar and the taper-threaded couplers, were too few to permit regression on both e and fr together. Therefore, additional specimens were included so that these regressions could be performed.
Little improvement in the strength of the correlation after introduction of fr as a second independent variable was noted for three groups: No. 5 threaded-swaged sleeves, No. 8 threaded-swaged sleeves, and the modified double-lap welds. Therefore, supplemental regressions with additional data points were carried out for these groups.
For the initial regression analysis on single-lap welds tested in beams, all data points had the same values for fr· Consequently, a regression could not be performed on the data. Additional specimens were included in supplemental analyses so that the variation in fr was sufficient to permit a regression analysis.
In every instance of a group tested in air, the regression one and fr together has the greatest value of R2 when compared to the other two regressions. Typically, the next strongest regression is than on e alone. A notable increase in the value of R2 with the addition of fr as a second independent variable qualitatively indicates that fr is an effective variable in the regression.
Correlations for regressions on fr alone typically were poor, which is the condition expected for data in the vicinity of a fatigue limit. An exception occurs with the double-lap welded splices, where the correlation of the regression on fr alone is greater than that of the regression on e alone; however, for this particular group, no correlation with a negative regression coefficient for e could be developed.
As noted previously, there were four groups considered to not have any misalignment, with the consequence that regressions could be performed only on the independent variable fr These four groups were: No. 5 unspliced bars tested in air; No. 8 unspliced bars tested in air; wedge-sleeve couplings tested in beams; and single-lap welds tested in beams. With both groups of unspliced bars tested in air, correlation coefficients were near zero for regressions on fr alone. However, for the two groups of specimens tested in beams, the steel coupling sleeve with wedge and the single-lap welded splice, statistically significant non-zero correlations on fr were noted.
Estimates of the stress range causing failure at 5,000,000 cycles and zero misalignment were obtained from the regression analyses one and fr together. A value of 6.699 was assumed for log N (i.e., N equal to 5,000,000) and zero for: e; ~he corresponding value of fr was then calculated from the respective regression coefficients. For the wedge-sleeve coupling and the single-lap weld, however, the regressions on fr alone were used where a value of 6.699 was assumed for log N . Values for fr were not computed for steel-filled sleeves or double-lap welds because no acceptable regressions were obtained for these two groups. ·
The resulting values of fr from the regression analyses and corresponding lower tolerance limits are summarized in Table C-7. Values from the staircase analyses are included in the table for comparison purposes. To account for full variation in long-life test data including that caused by runouts, the lower limits on means from regression analyses are based on the same standard deviation estimates and tolerance limit factors as used for lower limits on means from staircase analyses. For most data groups having misalignment as a variable, the mean fatigue limit determined from the regression analysis is typically 1.0 to 3.0 ksi greater than that determined from the staircase analysis. For the taper-threaded coupler, however, a decrease of 2.5 ksi was observed. A slight reduction in the mean fatigue limit was also observed for the two groups tested in beams: the wedge-sleeve coupling and the single-lap weld. In general, the mean fatigue limits from regression analyses on long-life failure data are somewhat higher and more closely grouped together than the results of staircase analyses which do not take misalignment into account.
C-6

Comparison of Mean Fatigue Limits
It is obvious by inspection that the mean fatigue limit for each group of splices is not equal to the mean fatigue limit for the appropriate group of unspliced bars. However, statistical comparisons of the mean fatigue limits between certain groups of splices would be of interest.
Comparisons were carried out by using procedures (28) for at-test of the difference between two independent means. The null hypothesis in each comparison was that the means are equal, and the alternate hypothesis was that the means are not equal. In a comparison, the null hypothesis cannot be rejected if the absolute value of the observed test statistic is less than the critical test statistic; otherwise, the alternate hypothesis is accepted. The observed test statistic was computed as the difference in means divided by a weighted average variance, and the critical test statistic was taken from a table of !-variate probabilities at a confidence level of 95 percent. For each group, separate comparisons were made using mean fatigue limits from the staircase analysis and from regression on long-life failure data. Again, to account for full variation in long-life test data including that caused by runouts, critical test statistics and variance estimates from comparisons on staircase means were also used for the comparisons on regression means.
Comparisons were carried out as follows: cold-swaged sleeves with uncoated bar versus coldswaged sleeves with epoxy-coated bar; grout-filled sleeves with uncoated bar versus epoxy-coated groutfilled sleeves with epoxy-coated bar; and modified double-lap welds tested in air versus single-lap welds tested in beams. The comparisons are summarized in Table C-8. Comparisons indicate in all cases that the means are not equal.
Analysis of Finite-Life Test Data
Multivariate regression analyses were carried out on the four groups of finite-life test data: unspliced No. 5 bars; unspliced No. 8 bars; No. 8 taper-threaded couplers; and No. 8 double-lap welds. All specimens were tested in air. Misalignment of spliced bars in the latter two groups was measured.
Each test group was independently analyzed by the least squares method using a computer spreadsheet program. The dependent variable was the logarithm of the number of cycles at failure, log N. For the two groups of specimens with misalignment, regressions were performed with different combinations of independent variables: the first regression introduced fr alone into the regression, and the second regression introduced both fl' an~ e together. For the_ two groups of specimens without any misalignment, the regressions included the independent variable fr alone. Data were limited to failures occurring at less than 1 million cycles. The results of the regression analyses are summarized in Table C-9.
The significance of the correlation coefficients for the regressions was assessed, again using F-variate statistics (28). The correlation for the regression on fr alone was strong for all data groups. For the taper-threaded coupler and the double-lap welds, introduction of e as an additional independent variable did not significantly improve correlation, nor did the regression coefficients change significantly. In the finite-life region, stress range is the dominant variable affecting fatigue behavior. Misalignment, as measured by the procedures of this experimental investigation, has a relatively minor effect.
It is commonly accepted that the slope of the S-N curve for structural steel in the finite-life region is about -0.033. For finite-life fatigue behavior of unspliced reinforcing bars from NCHRP Report 164 ( 4), slopes of S-N curves for individual finite-life test groups varied from -0.0137 to -0.0567, with values most often in the range from -0.032 to -0.048. The slope of the overall multivariate regression line on pooled data from Report 164 was -0.0407. For the finite-life test groups from the present experimental investigation, slopes varied from -0.03186 to -0.04997, listed previously in Table C-9 as coefficients of the independent variable fr. These slopes are consistent with NCHRP R,eport 164 results.
C-7

Because type of splice is not a quantified variable, it is not possible to obtain a pooled analysis of the finite-life data from the present investigation. Therefore, for comparison purposes, best fit lines in the form log N = a + b fr were developed for each finite-life test group, where -0.0407 was assumed for the slope, b, of each line. The best fit lines are given in Table C-10. The constant of the best fit line was determined by minimizing the sum of the squares of the residuals between actual and predicted log N values for each data set.
Both finite-life and long-life data are shown in Figs. C-4a and C-4b for unspliced bar, and in Figs. C-5a and C-5b for splices. The sloping lines shown in the figures represent the best fit lines from Table C-10, whereas the horizontal lines represent the fatigue limits from Table C-4. Lower tolerance limits are also shown on the figures.
The mean and lower limit stress ranges at which failure would occur in 500,000 cycles, as estimated from the best fit lines in Table C-10 and standard errors of estimate of the mean from Table C-9, are given in Table C-11 for each finite-life test group. The data indicate that the finite-life fatigue performance of a splice is significantly reduced compared to that of unspliced reinforcing bar. The longlife data in Table C-7 also indicate similar reductions in mean fatigue limits for the same splice types when compared to that of the unspliced bar. However, it is not possible to statistically establish any relationship between finite-life and long-life fatigue performance due to limited data.
C-8

TABLE C-1 - TOLERANCE LIMIT FACTORS
Sample Factora Sample Factora Sample Factora Size k Size k Size k
11 3.292 21 2.781 2 31.257 12 3.201 22 2.756 3 8.986 13 3.126 23 2.732 4 6.015 14 3.060 24 2.710 5 4.909 15 3.005 25 2.690
6 4.329 16 2.956 26 2.672 7 3.970 17 2.913 27 2.654 8 3.723 18 2.875 28 2.638 9 3.542 19 2.841 29 2.623 10 3.402 20 2.810 30 2.608
a) Two-sided tolerance limit factor such that, at a 95 percent confidence level, 95 pecent of _the data will fall be_tween the limits.
C-9

TABLE C-2 - SUMMARY OF STAIRCASE ANAI.YSES, AS-TESTED DATA
Test Group Analysis According to Analysis According to Lipsom and Sheth (8) NCHRP Report JM (4)
Splice Type Bar Type Mean Std. Lower Mean Std. Lower Dev. Limit Dev. Limit
(ksi) (ksi) (ksi) (ksi) (ksi) (ksi)
No.5 31.3 1.35 27.3 31.1 1.27 27.2 Unspliced bar
No. 8 29.9 2.30a 23.1 30.1 1.89a 24.5
No.5 17.1 1.73a 11.7 16.4 2.15a 9.7 Cold-swaged sleeve
No. 5, Epoxy 20.0 2.07a 13.4 20.4 l.59a 15.3
No. 5 6.3 0.81 3.7 6.3 0.81 3.7 Threaded-swaged sleeve
No.8 8.9 1.73a 3.4 9.2 1.59a 4.1
Grout-filled sleeve No. 8 24.0 0.99 20.8 24.0 0.99 20.8
Epoxy-coated grout-No. 8, Epoxy 25.5 1.99a 19.1 25.8 1.63a 20.5 filled sleeve
Steel-filled sleeve No. 8 13.4 1.17 9.8 13.3 1.10 10.0
Tapered-threaded coupler No. 8 20.0 3.6~ 8.1 22.0 4.89a 6.3
Straight-threaded coupler No. 8 13.1 1.73a 7.6 13.2 1.43 8.7
Wedge-sleeve coupling No.5 22.9b 1.74b 16.4 21.9 7.42a --c
Double-lap weld No. 8 10.3. 0.81 -7.7 10.3 0.81 7.7
Modified double-lap weld No. 5 7.2 __ d
3.9 7.0 __ d
3.7
Single-lap weld No. 5 21.2b 1.62b 15.6 20.7 3.28a 9.9
(a) Indicated value falls outside of the range of reliable estimates. (b) Based on adjusted data using an assumed stress interval of 1.5 ksi. (c) Calculated value was not reasonable. ( d) Both analytical procedures were unable to provide an estimate of standard deviation for this particular set of data.
Value of 1.0 was assumed for calculation of lower limits.
C-10

TABLE C-3 - SUMMARY OF STAIRCASE ANALYSES, ADJUSTED DATA
Test Group Analysis According to Analysis According to Lipsom and Sheth (8) NCHRP Report JM (4)
Splice Type Bar Type Mean Std. Lower Mean Std. Lower Dev. Limit Dev. Limit
(ksi) (ksi) (ksi) (ksi) (ksi) (ksi)
Unspliced bar No. 8 29.9 1.81 24.4 29.9 1.70 24.8
No. 5 17.0 1.39 12.6 16.5 1.58 11.5 Cold-swaged sleeve
No. 5, Epoxy 20.0 1.71 14.2 20.2 1.49 15.1
Threaded-swaged sleeve No. 8 9.0 1.39 4.4 9.1 1.26 5.0
Epoxy-coated grout-No. 8, Epoxy 25.4 1.91 19.1 25.5 1.74 19.8
filled sleeve
Tapered-threaded coupler No. 8 20.0 1.71 14.2 20.6 1.93 14.1
Straight-threaded coupler No. 8 13.0 1.39 8.6 13.1 1.25 9.1
TABLE C-4 - FINAL SUMMARY OF STAIRCASE ANALYSES
Test Group Mean Standard Tolerance Lower Deviation Factor Limit
Splice Type Bar Type Group Size .i s k .i" ks (ksi) (ksi) (ksi)
No. 5 15 31.3 1.35 3.005 27.3 U nspliced bar
No.8 15 29.9 1.81 3.005 24.4
Cold-swaged sleeve No.5 12 17.0 1.39 3.201 12.6
No. 5, Epoxy 10 20.0 1.71 3.402 14.2 - -
Threaded-swaged sleeve No. 5 12 6.3 0.81 3.201 3.7
No. 8 11 9.0 1.39 3.292 4.4
Grout-filled sleeve No. 8 12 24.0 0.99 3.201 20.8
Epoxy-coated grout-No. 8, Epoxy 11 25.4 1.91 3.292 19.1 filled sleeve
Steel-filled sleeve No. 8 15 13.4 1.17 3.005 9.8 Tapered-threaded coupler No. 8 10 20.0 1.71 3.402 14.2
Straight-threaded coupler No. 8 12 13.0 1.39 3.201 8.6 Wedge-sleeve coupling No. 5 8 22.9 1.74 3.723 16.4
Double-lap weld No. 8 12 10.3 0.81 3.201 7.7 Modified double-lap weld No. 5 11 7.2 l.Oa 3.292 3.9 Single-lap weld No. 5 10 21.2 1.62 3.402 15.6 (a) Assumed value.
C-11

TABLE C-5 ·MULTIPLE LINEAR REGRESSION ANALYSES ON LONG-LIFE FAILURE DATA
Test Group Regression Mui- D.F. Coefficients ti pie
Splice Type Bar Group R2
Type Size Const. e fr
No. 5 6 8.2914 - -0.05780 0.0933 1-4 Unspliced bar
No. 8 6 6.4968 - -0.00793 0.0031 1-4
6.8008 -3.5439 - 0.4683* 1-5 No. 5 7 8.7009 -4.5428 -0.10457 0.6630* 2-4
Cold-swaged 6.9044 - -0.02828 0.0170 1-5 sleeve No. 5, 7.0987 -4.6120 - 0.9634 1-1
Epoxy 3 10.350 - -0.20081 0.3337 1-1
6.7760 -2.0434 - 0.2507 1-3 No. 5 5 7.2872 -2.5724 -0.06658 0.2718 2-2
Threaded-swaged 5.9933 - 0.07661 0.0503 1-3
sleeve 6.8893 -8.8976 - 0.2985 1-3 No. 8 5 7.4834 -9.2313 -0.06395 0.3142 2-2
6.5584 - -0.01780 0.0012 1-3
Grout-filled 6.7024 -2.0956 - 0.6875* 1-3
sleeve No. 8 5 9.6522 -2.4120 -0.11949 0.9504** 2-2
7.9704 - -0.06824 0.0908 1-3
Epoxy-coated 7.1235 -11.0624 - 0.1824 1-2
grout-filled No. 8,
4 13.4913 -22.383 -0.22473 0.6749 2-1
sleeve Epoxy 8.9863 - -0.10061 0.1370 1-2
5.9765 7.3314 - 0.5413* 1-4 Steel-filled sleeve No. 8 6 8.8284 13.7916 -0.24236 0.8377* 2-3
5.6287 - 0.06106 0.0455 1-4
Taper-threaded 6.5367 -5.2069 - 0.8966 1-1
coupler No. 8 3 7.3548 - -0.04839 0.2990 1-1
Straight-threaded 9.1056 -44.389 - 0.5023 1-2 No. 8 4 12.4908 -58.192 -0.18863 0.7580 2-1
coupler 7.1707 - -0.06167 0.0325 1-2
Wedge-sleeve No. 5 4 12.974 - -0.28843 0.9592** 1-2
coupling 6.4671 2.3075 - 0.0382 1-5
Double-lap weld No. 8 7 8.4907 2.1677 -0.19609 0.4012 2-4 8.6056 - -0.19723 0.3677* 1-5
Modified double- 6.8288 -8.8025 - 0.5961 ** 1-5
lap weld No. 5 7 6.9149 -8.6166 -0.01197 0.5976* 2-4
7.3201 - -0.09310 0.1099 1-5
Single-lap weld No. 5 3 - - - - -.. . .
Denotes correlation coefficient havtng level of s1gmf1cance greater than 80 percent . Denotes correlation coefficient having level of significance greater than 95 percent .
C-12
Standard Error of Estimate of Coefficient
Mean e fr 0.10397 - 0.09004
0.18672 - 0.07143
0.15607 1.68886 -0.13892 1.64058 0.06879 0.21221 - 0.09628
0.09405 0.89890 -0.40127 - 0.28374
0.18706 2.03985 -0.22584 3.29744 0.27604 0.21059 - 0.19224
0.34478 7.87509 -0.41753 9.66349 0.29916 0.41140 - 0.29090
0.06536 0.81574 --0.03190 0.40985 0.03672 0.11148 - 0.12464
0.28821 16.5641 -0.25698 17.3977 0.18254 0.29609 - 0.17855
0.11873 3.37448 --0.08155 3.60406 0.10354 0.17127 - 0.13984
0.02324 1.76829 -0.06050 - 0.07409
0.28289 31.2410 -0.27898 33.6074 0.18352 0.39444 - 0.23786
0.04424 - 0.04204
0.26424 5.17843 -0.23309 4.56892 0.12591 0.21427 - 0.11572
0.10450 3.24052 -0.11661 3.91331 0.09638 0.15512 - 0.11848
- - -

TABLE C-6 - SUPPLEMENTAL REGRESSION ANALYSES ON LONG-LIFE FAILURE DATA
Test Group Regression Mui- D.F. Coefficients tip le
Splice Type Bar Group R2
Type Size Const. e fr
Cold-swaged No. 5, 6.9791 -4.4193 - 0.6781 * 1-2 4 9.0623 -3.4764 -0.10911 0.8353 2-1
sleeve Epoxy 9.8497 - -0.17517 0.4845 1-2
6.6760 -1.6108 - 0.1247 1-4 No. 5 6 7.9520 -3.1845 -0.15618 0.3890 2-3
Threaded-swaged 6.8588 - -0.05802 0.0529 1-4
sleeve 6.6640 -5.9892 - 0.1346 1-4 No. 8 6 8.3091 -8.8528 -0.16021 0.3413 2-3
7.2468 - -0.09603 0.0853 1-4
Epoxy-coated 7.4947 -17.9268 - 0.4654* 1-4
grout-filled No. 8,
6 10.9036 -13.5339 -0.14320 0.7623* 2-3
sleeve Epoxy 10.9888 - -0.18117 0.5198* 1-4
Taper-threaded 6.7332 -13.9964 - 0.7639* 1-2 No. 8 4 8.0594 -4.9974 -0.07786 0.9826* 2-1
coupler 8.4330 - -0.10340 0.9428** 1-2
Straight-threaded 6.6644 -7.5978 - 0.0645 1-4 No. 8 6 10.7461 -18.6456 -0.24860 0.5672* 2-3
coupler 8.4222 - .:0.15901 0.2615 1-4
Modified double- 6.7979 -8.2006 - 0.5065** 1-6
lap weld No. 5 8 7.2177 -7.7160 -0.05565 0.5813* 2-5
7.1944 - -0.7612 0.1433 1-6
Single-lap weld No. 5 5 10.562 - -0.20401 0.8970** 1-3
. . Denotes correlat10n coefficient having level of s1gmficance greater than 80 percent . Denotes correlation coefficient having level of significance greater than 95 percent.
C-13
Standard Error of Estimate of Coefficient
Mean e fr 0.22574 2.15296 --0.22838 2.38249 0.11172 0.28567 - 0.12775
0.19863 2.13360 -0.19164 2.47915 0.13712 0.20662 - 0.12275
0.35316 7.59304 -0.35578 8.19901 0.16513 0.36038 - 0.15722
0.24013 9.60661 -0.18490 7.73750 0.07399 0.22758 - 0.08706
0.10978 5.50257 -0.04208 3.29726 0.02193 0.05403 - 0.01801
0.39310 14.4620 -0.30873 12.8076 0.13318 0.34927 - 0.13361
0.10791 3.30459 -0.10888 3.37361 0.05888 0.14218 - 0.07600
0.16627 -- 0.03992

TABLE C-7 - SUMMARY OF ANALYSES ON LONG-LIFE DATA: STAIRCASE ANALYSIS AND REGRESSION ON FAILURE DATA
Test Group
Splice Type Bar Type
No. 5 U nspliced bar
No. 8
Cold-swaged sleeve No. 5
No. 5, Epoxy
Threaded-swaged sleeve No. 5
No. 8
Grout-Filled sleeve No. 8
Epoxy-coated grout- No. 8, Epoxy filled sleeve
Steel-filled sleeve No. 8
Tapered-threaded coupler No. 8
Straight-threaded coupler No. 8
Wedge-sleeve coupling No. 5
Double-lap weld No. 8
Modified double-lap weld No. 5
Single-lap weld No. 5 (a) From supplemental regression analysis. (b) From regression on f, alone.
Staircase Analysis
Mean Lower Limit
(ksi) (ksi)
31.3 27.3
29.9 24.4
17.0 12.6
20.0 14.2
6.3 3.7
9.0 4.4
24.0 20.8
25.4 19.1
13.4 9.8
20.0 14.2
13.0 8.6
22.9 16.4
10.3 7.7
7.2 3.9
21.2 15.6
Regression on Failure Data
Mean Lower Limit
(ksi) (ksi)
- -- -
19.1 14.7 21.7a 15.9
8.0 5.4
10.1 5.5
24.7 21.5
29.4a 23.1
- -17.5a 11.7 16.3a 11.9 21.8b 15.3
- -9.3 6.0
18,ga,b 13.3
TABLE C-8 - STATISTICAL COMPARISON OF MEAN FATIGUE LIMITS
Test Groups Compared Critical Observed Statistic, I tobs I Splice Type Bar Type Group
Statistic, Staircase Regression on
Size tcrit Analysis Failure Data
Cold-swaged sleeve No. 5 12 2.086 4.543 3.937 Cold-swaged sleeve No. 5, epoxy 10
Grout-filled sleeve No.8 12 Epoxy-coated grout- 2.080 2.236 7.505
filled sleeve No. 8, epoxy 11
Modified double-lap weld No. 5 11 2.093 24.088 16.517 Single-lap weld No. 5 10
C-14

TABLE C-9 - MULTIPLE LINEAR REGRESSION ANALYSES ON FINITE-LIFE DATA
Test Group Regression Mui- D.F. Standard Error of Coefficients tiple Estimate of Coefficient
Splice Type Bar Group R2
Type Size Const. fr e Mean fr e
No. 5 7 7.3645 -0.04283 -- 0.9098** 1-5 0.07388 0.00603 --Unspliced bar
No. 8 7 7.5812 -0.04624 0.7520** 1-5 0.14982 0.01188 -- --Taper-threaded 6.5995 -0.03186 -- 0.7680** 1-5 0.07999 0.00783 --coupler
No. 8 7 6.5842 -0.03121 -0.70214 0.7701* 2-4 0.08903 0.00934 3.65383
6.7895 -0.04997 -- 0.9961** 1-4 0.01508 0.00156 --Double-lap weld No.8 6 6.7640 -0.04894 -0.29531 0.9971** 2-3 0.01493 0.00183 0.28411
.. Denotes correlation coefficient having level of significance greater than 80 percent. Denotes correlation coefficient having level of significance greater than 95 percent.
TABLE C-10 - BEST FIT S-N LINES WITH SLOPE -0.0407
Test Group Coefficients
Splice Type Bar Group Type Size Const. fr
U nspliced bar No. 5 7 7.2740 -0.0407
No. 8 7 7.3352 -0.0407
Taper-threaded coupler No. 8 7 6.9985 -0.0407
Double-lap weld No. 8 6 6.4383 -0.0407
TABLE C-11 - ESTIMATES OF STRESS RANGE AT 500,000 CYCLES FROM BEST FIT LINES WITH SLOPE OF -0.0407
Test Group Stress Range (ksi)
Splice Type Bar Type Mean Lower Limit
Unspliced bar No. 5 38.7 31.5
No. 8 40.2 25.6
Taper-threaded coupler No. 8 31.9 24.1
Double-lap weld No. 8 18.2 16.6
C-15

Stress Range (ksi) 40r--~~~'--~~~-,-~~~~~~~~~~~~~~~~-,
* Failure
0 Runout
Mean
Lower Limit
0 * * ---------------- ,------.. -------5--- __________ * ______ '
10
Test Replicate Number
Fig. C-la - Staircase data for unspliced No. 5 bars
0
" 0 0
0
10
Test. Replicate Number
* Fe.Uure
0 Runout
Mean
Lower [foril
15
Fig. _C-lb - Stair~ase data for unspliced l'J"o. 8 bars
C-16
15
(
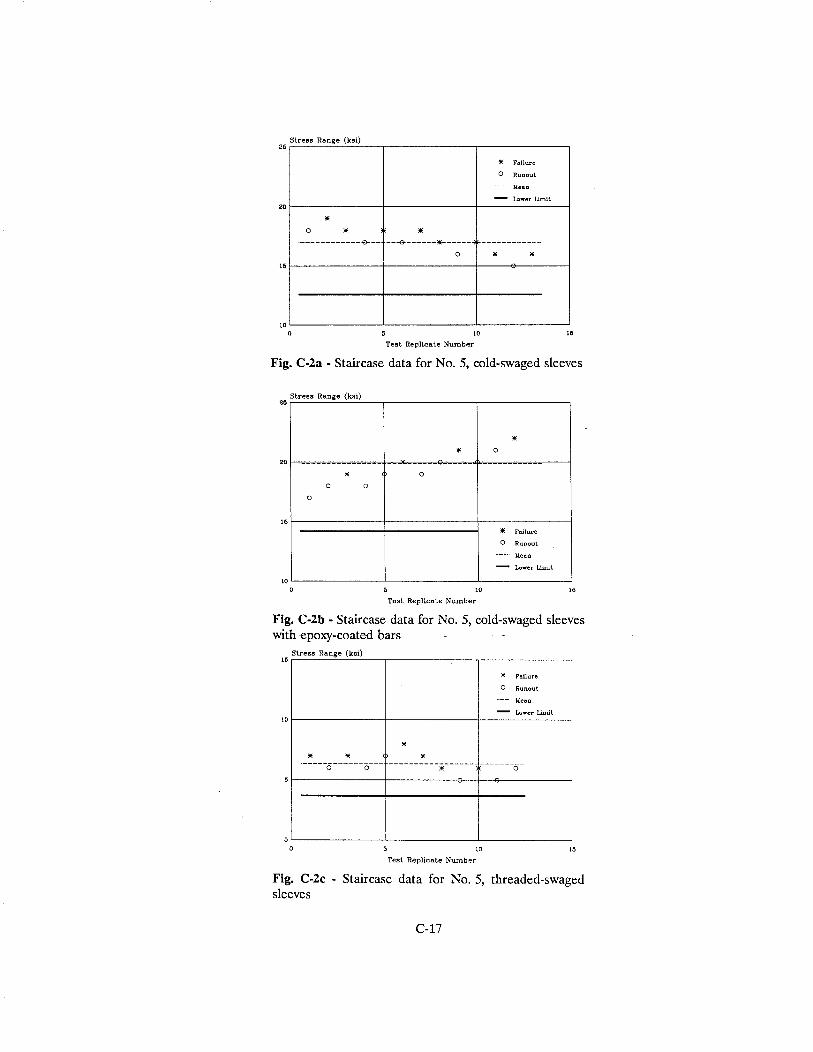
Stress Range (ksi) 25~~~~~~~~~~~~~~~~~~~~~~~~~~
* Failure
0 Ruaout
Mean
Lower Limit
0
·------------£1---- ---e-------.______ ------------
10
Te3t Replicate Number
15
Fig. C-2a - Staircase data for No. 5, cold-swaged sleeves
Stress Range (ksi) 20~~~~~~~~~~~~~~~~~~~~~~~~~~
0
,. 0
,. 0
0 0
10
Test Replicate Number
,.
* Failure
0 Runout
Mean
Lower Ll.mit
15
Fig. C-2b • Staircase data for No. 5, cold-swaged sleeves with ~poxy-coated bars
Stress Range (ksi) 10~~~~~~~~~~~~~~~~~~~~~~~~~~
10
Test Replicate Number
* Failure
0 Runout
Mean
Lower Limit
16
Fig. C-2c - Staircase data for No. 5, threaded-swaged sleeves
C-17

Slress Range (ksi) 15,-~~~~~~~.-~~~~~~~..-~~~~--~~,
" -------------€>--- __ .,. ______ * ______ ~--------" 0
0
0 0
10
Test Replicate Nwnber
* Failure
0 Ruoout
Mean
tower Limit.
15
Fig. C-2d - Staircase data for No. 8, threaded-swaged sleeves
Stress Range (ksi) 30,-~~~~~~~,.--~~~~~~~.,-~~~~~~~
"'
* Failure
0 Runoul
Mean
- Lawer Limit
. ____________ .,... ____ ..,,. ______ ,._ _____ " ------e-· 0 0
10
Test Replicate Number
0
15
Fig. C-2e - Stair~ase data for No. 8, grou~-filled sleeves
Stress Range (ksi) ao,.-~~~~~~~.,-~~~~~~~-,-~~~~~~~-,
"' 0 0
i "' • "' 0
10
Test Replicate Number
0
* Failure
0 Runout
Mean
- Lower Li.mil
15
Fig. C-2f - Staircase data for No. 8, epoxy-coated groutfilled sleeves with epoxy-coated bar
C-18

Stress Range (ksi) 20~~~~~~~~--.-~~~~~~~~.,-~~~~~~~~
* Failure
0 RunouL
Mean
Lo1fer Limil
-------------0--- ---0-------------- ______ * ______ * __ _
10
Test Replicate Number
0 0
15
Fig. C-2g • Staircase data for No. 8, steel-filled sleeves
Stress Range (ksi) 20~~~~~~~~--.-~~~~~~~~.,-~~~~~~~--,
0
0 "' 0
0
"' 0
* Failure
0 Runout
Mean
Lcnrer Limil
10~~~~~~~~~~~~~~~~~~~~~~~~~~
0 10
Test Replicate Number
15
Fig. C-2h • Staircase data for No. 8, taper-threaded couplers
Stress Range (ksi) 20,-~~~~~~~--.-~~~~~~~--.-.,---.---.---.---.-~~~--,
"' p
* Failure
0 Runoul
Mean
Lower Limil
"' ·---------------- ~------+------G--- --------·
,. 0
0 0
0
10
Test Replicate Number
15
Fig. C-2i • Staircase data for No. 8, straight-threaded couplers
C-19

0 0
·---------------"' "' 0 "'
10
Test Replicate Number
* Failure
0 Runo\lt
llean
10
Fig. C-2j - Staircase data for No. 5, wedge-sleeve couplings
Stress Range (ksi) 20~~~~~~~~~~~~~~~~~~~~~~~~~~
"' "' D
* Failure
0 Runout.
Mee..n
Lower Umil
"' 1or--·---,.-------------,.-------------$------------~-r------------~-r-----+~-·---------------·~~~~~
0 0
10
Test Replicate Number
15
Fig. C-2k - Stair<:ase data for No. 8, doubJe-lap welds
* * * )IE
* Failure
0 Runout
Mean
Lower Limil
·-----~------11(""-- --,,.------0------,~--~-----
o
10
Test Replicate Number
15
Fig. C-21 - Staircase data for No. 5, modified double-lap welds
C-20

"' "'
-------------e-- -----------------"' "'
10
Test Replicate Number
* Failure
0 Runout
Mean
Lower Umll
Fig. C-2m - Staircase data for No. 5, single-lap welds
C-21

Eccentricity (in.) ,...------------------------~ 0.25
,. ,. ,.
0.1 I N, Number of Cycles (millions)
* Failure
Mean
,. ,.
0.2
0.15
0.1
0.05
10
Fig. C-3a • Plot of e vs. N for No. 5, cold-swaged sleeves
Eccentricity (in.) ,...------------..-------------, 0.25
* Failure
Mean
0.2
0.15
0.1
0.05
0.1 1 10 N, Number of Cycles (millions)
Fig. C-3b • Plot of e vs. N for No. 5, cold-swaged sleeves with epoxy-coated bars
Eccentricity (in.) ,...-----------------------~ 0.25
,. ,.
0.1
N, Number of Cycles (millions)
* Failure
,. ,.
Mean
0.2
0.15
0.1
0.05
10
Fig. C-3c • Plot of e vs. N for No. 5, threaded-swaged sleeves
C-22

Eccentricity (in.) -----------------------~0.25
* Failure
--- Mean
0.2
0.15
0.1
0.05
" 0.1 1 10
N, Number of Cycles (millions)
Fig. C-3d - Plot of e vs. N for No. 8, threaded-swaged sleeves
Eccentricity (in.) --------------.,.,--~---------; 0.25
0.1
"
\ *\1~,
\ \ \ \ \
" \ \ \
1 N, Number of Cycles (millions)
\ \
* Failure
\ \ \ \ \ \
lie an
\ \ \ \ \ \
\
0.2
0.15
0.1
0.05
JO
Fig. C-3e - Plot '?f e vs. N for No. 8, grm~t-filled sleeves
Eccentricity (in.) ----------------------~ 0.25
* Failure
Mean 0.2
0.15
0.1
0.06
0.1 1 JO N, Number o! Cycles (millions)
Fig. C-3f- Plot of e vs. N for No. 8, epoxy-coated groutfilled sleeves with epoxy-coated bars
C-23

r-------------------E_c_ce_n_tr_i_ci_ty_(i_n,.) O.Zfl
* Failure
0.2
0.15
0.1
,. ,. 0.05
0.1 l 10
N, Number of Cycles (millions)
Fig. C-3g • Plot of e vs. N for No. 8, steel-filled sleeves
Eccentricity (in.) .-------------------------, 0.26
* Fll..ilure
Mean 0.2
0.15
0.1
0.05
0.1 l 10 N, Number of Cycles (millions)
Fig. C-3h - Plot of e vs. N for No. 8, taper-threaded couplers
Eccentricity (in.) .--------------------------'_;,~ 0.26
* Failure
Mean 0.2
0.15
0.1
0.05
0.1 l 10 N, Number of Cycles (millions)
Fig. C-3i - Plot of e vs. N for No. 8, straight-threaded couplers
C-24

Eccentricity (in.) -----------------------'-~ 0.25
"
" "" "
* Frulure
0.2
0.15
0.1
" 0.05
~--~-~-~~~~~---~-~-~~~~~o
0.1 1 10
N, Number of Cycles (millions)
Fig. C-3j • Plot of e vs. N for No. 8, double-lap welds
Eccentricity (in.) ,....-----------------------~0.25
* Fo?Ulure
Mean
0.2
0.15
0.1
0.1 1 10 N, Number of Cycles (millions)
Fig. C-3k ·Plot of e vs. N for No. 5, modified double-lap weld&
C-25

Stress Range (ksi) 50 ~~~~~~~~~~..--~~~~~~~~~~~~~~~~~~~-----,
}** '
40
30
20
10
' ' ' ' * ':'!!;, ' ' ' ' * ',,~_!!._'!' ___ ~---~----
* Failure
0 Runout
Mean
Lower Llmit
0 ~~~~~~~~~~~~~~~~~~~~~~~~~~~~~~~~
0.01 0.1 1
N, Number of Cycles (millions)
Fig. C-4a - S-N plot of finite life data for unspliced No. 5 bars
40
30
20
10
Stress Range (ksi)
* Failure
0 Runout
Mean
Lower Llmit
10
0 ~~~~~~~~~~~~~~~~~~~~~~~~~~~~~~~~
0.01 0.1 1 10 N, Number of Cycles (millions)
Fig. C-4b - S-N plot of finite life data for unspliced No. 8 bars
C-26

Stress Range (ksi) 50 ~~~~~~---~~~..,,.,,,.-~~~~~~~~~~~~~~~~~~---,
40
30
20
10
' ' ' ' ' ' **'~ ' ' ' ' ' ' ' ' ' ' ' ' ' ' ' '
* Failure
0 Runout
Mean
Lower Limit
''*' ''~--""*-~----~----
0 '--~~-'--~'---'----'-~-'-'--'-~~--'-~-'-~~--'-~~~~~'--~~-L--L-~~
0.01 0.1 1 10
N, Number of Cycles (millions)
Fig. C-5a • S-N plot of finite life data for No. 8, taper-threaded couplers
Stress Range (ksi) 50 ~~~-..,~~~~~~~~~~~~~~~~~~~~~~~~~~~~
* Failure
0 Runout 40
30
20
10
0 ~~~~~-'---'----'-~-'-~~~~~--'-~~~-'-~'--~~-'-~'----'---'--'-'-'-'-' 0.01 0.1 I 10
N, Number of Cycles (millions)
Fig. C-5b • S-N plot of finite life data for No. 8, double-lap welds
C-27