Embed Size (px)
Citation preview

Fatigue and Cachexia in the Oncologic Population: Clinical Significance
Barbara A. Murphy, MD Director, Pain and Symptom
Management Program

Why are fatigue and cachexia clinically meaningful to patients? • Not confined to patients who have terminal disease
– May be associated with chemotherapy and radiation • Seldom occur in isolation
– Usually a component of a symptom complex • Associated with adverse outcomes
– Decreased survival – Decreased in physical functioning
• Impact social roles and social identity – Decreased treatment tolerance
• Impact on drug dosing • May persist long term in survivors
– Scientific question: effect on long overall survival? – Patient question: Why aren’t I getting better and will I be normal?

Inflammatory Disease States: • Universal underlying biologic responses to disease • Mediators:
– Host biologic mechanisms meant to deal with stress and aid in repair
– Chronic or exuberant host response results in damage • Stereotypical Manifestations of Acute/Chronic Disease:
– Fatigue and weakness – Anorexia – Cachexia and deconditioning – Anemia – Neurocognitive changes – Mood disorders

Host Response (Genetic Factors)
Treatment
Inflammatory mediators
Neuroendocrine Network
Tumor
Host Biological
State
Symptom Burden
Survival Functionality

Wasting Syndromes in Cancer:
• Secondary to cancer – Previously untreated patients with advanced
disease – Treatment refractory patients – advanced disease
• Associated with acute and late effects of therapy – Radiation based therapy – Chemotherapy

Change in Body Composition: Variable Baseline 1-month post P-value Weight 87.0±15.32 77±10.63 0.000 BMI 28.7±3.61 25.3±2.47 0.000 % Fat 32.7±6.67 34.0±5.75 0.802 Fat mass kg 28.0±5.34 24.5±4.48 0.003 Lean mass kg 52.3±11.3 46.6±96.534 0.005 REE (kcal/d) 1666.7±238.33 1645.9±210.0 0.736 REE/FFM (kcal/kg) 30.6±3.22 34.9±6.60 0.019 Energy Intake 2454±938 2108±780 0.200 EI/REE (%) 1.45±0.55 1.22±0.42 0.165 Cal to Nitrogen Ratio 158.0±24.22 154.3±30.4 .630 RQ (VCO2/VO2) 0.74±0.11 0.77±0.12 0.457
Silver, Head and Neck 2007

Results: Muscle Wasting and Decrease in Physical Function
• 66-80% body mass loss was lean body mass – Average LBM loss: 6.8 kg (p<0.0001) – Decrease in LBM associated with
• Decrease in ADL (r = -.58, p=0.02) • Increase time for performance testing (r = -.71, p=0.004)
• Increase in pro-inflammatory cytokines (IL-6 and IL-1B) – @ with decrease in ADL (p=0.02) and IADL (p=0.04)
• Decrease in anti-inflammatory cytokines (IL-10) – @ with decrease in physical activity (p=0.015)
• Oxidative stress – Serum F2 isoprostane levels increased p=.007 – @ with loss of fat and fat-free mass p=.04

Marked Changes in Body Composition Following Neoadjuvant Chemotherapy for
Esophagogastric Cancer
Awad et al, (2012) 31: 74-77

Acute Inflammation to Scar:
Fleckenstein K. Semin Radiat Oncol. 2007;17: 89-98

Late Metabolic Effects:
Acute Tissue Damage Due to Cancer or Therapy
Tissue Repair Return to Normal Metabolic State
Ongoing Tissue Damage And/Or
Failure to Return to Normal Metabolic State
Question: Can tissue damage results in a self perpetuating process that results in worsening metabolic late effects over time?
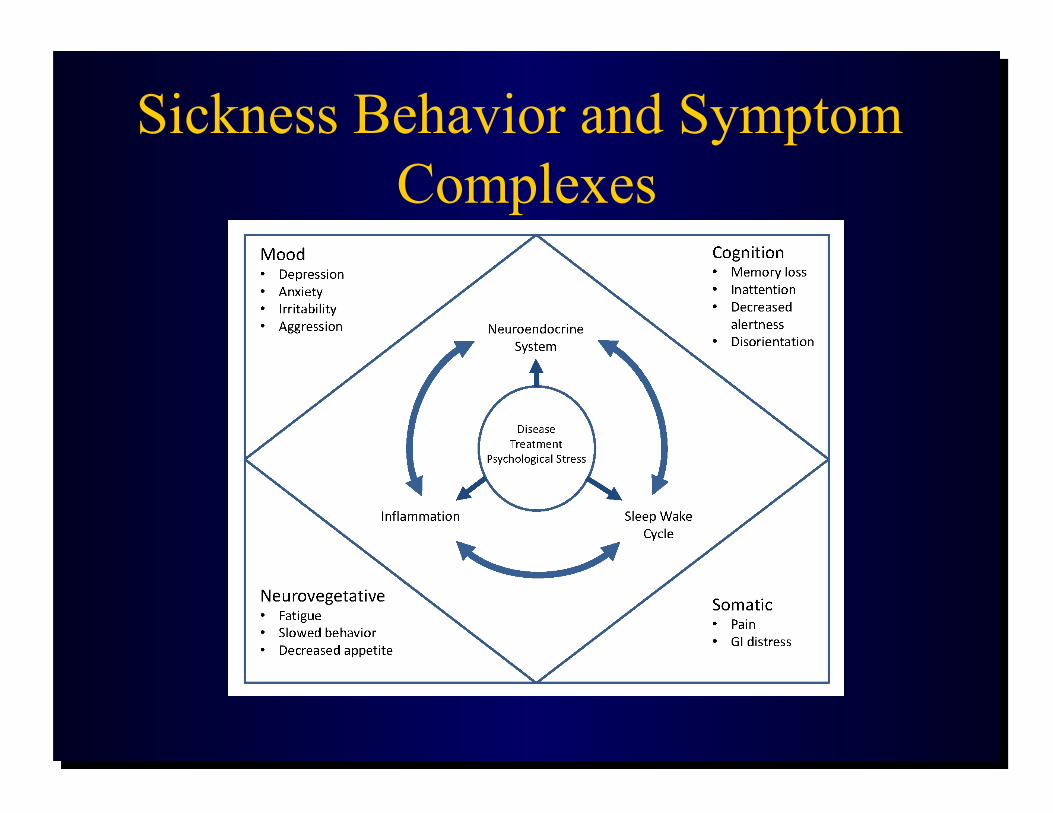
Sickness Behavior and Symptom Complexes


General Symptom Survey I have unexplained fatigue Fatigue limits my day to day activity I have problems falling asleep I have problems staying asleep I have episodes of unexplained sweating There are times when I am cold and others around me are not There are times when I am hot and others around me are not I have trouble with my memory or processing my thoughts I have joint pain or muscle aches other than in my neck and shoulders I feel sad or depressed I feel anxious

Adverse Outcomes:
• Survival • Dose alterations • Toxicity • Physical Function • Psychological Distress • Mood Disorders • Body Image • Social Function • Quality of Life
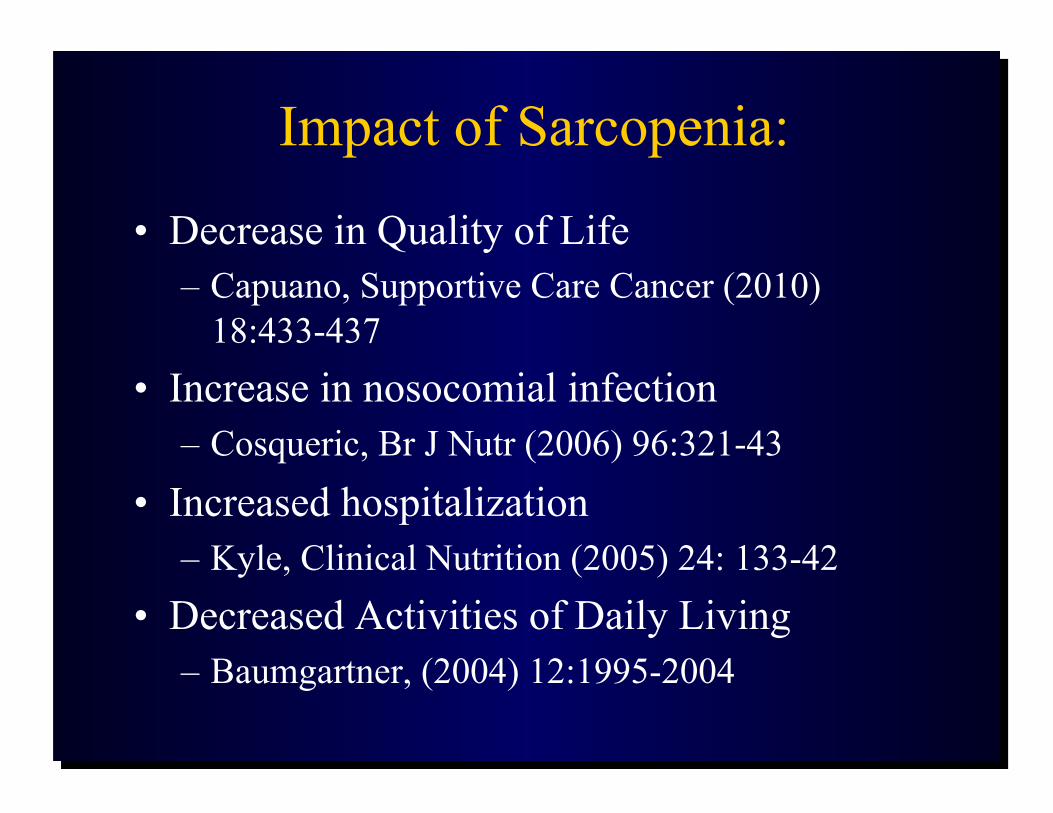
Impact of Sarcopenia:
• Decrease in Quality of Life – Capuano, Supportive Care Cancer (2010)
18:433-437 • Increase in nosocomial infection
– Cosqueric, Br J Nutr (2006) 96:321-43
• Increased hospitalization – Kyle, Clinical Nutrition (2005) 24: 133-42
• Decreased Activities of Daily Living – Baumgartner, (2004) 12:1995-2004

Predicting Survival as an Outcome: • Survival correlates with weight loss and decreased performance
status – Clearly defining this parameters is a challenge
• Liver produces acute-phase proteins in response to tissue damage or tumor – Up regulated by interleukin-6 and TNF-ɑ – C-Reactive Protein (CRP)
• Decline in albumin is noted concurrent with increase in CRP • Glasgow Prognostic Score:
– 0: no metabolic abnormalities – 1: CRP < 10mg/l OR albumin <35 g/l – 2: CRP < 10mg/l AND albumin <35 g/l
• GPS prognostic for outcome in numerous cancers
McMillan, Proc Nutrition Society 2008

GPS: Impact on Survival in Metastatic Breast Cancer Patients
GPS Scores: 0 – top line 1 – dotted line in center 2 – solid line on bottom
Murri AM, British Journal of Medicine (2006) 94: 227-230

GPS Score: Predicts Survival in Pre-Op Esophageal Cancer
Kobayashi et al, Surgery (2008) 144: 729-35

Prado et al: Sarcopenic Obesity Associated with Decrease Survival
Patients: • N=2115 • Lung or GI • 250 met criteria for
obesity Methods: • CT scan analysis with
slicomatic Results: • 38/250 met criteria for
sarcopenia • Sarcopenia associated
with decrease functional status (p=.009)
Prado, Lancet Oncology (2008) 9:629-635

Cancer Cachexia: Atrophy of Lean Muscle Mass
Normal Cachexia

Computed Tomography Images: Two Cancer Patients
Tsai S Nutr Clin Pract 2012;27:593-598
Sarcopenic patient with low lean body mass: BMI 23.5 kg/m2
Patient with normal lean body mass: BMI 24.5 kg/m2

A) Absolute force-frequency relationship
B) Maximal tetanic force
C) Specific force–frequency relationship
D) Maximum specific force
E) Time to peak twitch tension
F) One half twitch relaxation time
G) Anti-laminin antibody
H) Cross sectional area of muscle fiber type
I) Percentage of each EDL muscle fiber type in control and C-26 mice.
Roberts et al, Biochemical and Biolgoical Research Communications (2013), 435:488-492

Body Composition and Physiological Function: Patients With and Without Sarcopenia
Sarcopenia (n = 83) Without Sarcopenia (n = 81) p value
Variables Mean SD Mean SD Lean body mass (kg) 43.4 7.7 47.4 10.5 0.007
Fat mass (kg) 12.6 5.5 16.3 8.6 0.001
Skeletal muscle (kg) 20.8 4.7 23.4 5.7 0.002
Skeletal muscle index, (kg/m2) 7.4 1.1 8.5 1.5 <0.001
Right hand grip 26.7 8.0 30.4 10.3 0.012
Left hand grip 25.0 7.5 28.3 9.9 0.017
Right knee ext 29.2 8.8 32.7 12.6 0.04
Left knee ext 27.7 10.3 31.9 13.1 0.024 6MWT 483.4 94.9 494.4 85.9 0.437 Fatigue 78.8 45.5 64.3 37.3 0.026

Sarcopenia and Drug Dosing:
• BSA commonly used for dosing chemotherapy agents
• For any given BSA, lean tissue mass may vary considerably
• Lower lean tissue mass may result in decreased tissue for drug distribution thus lower capacity for drug metabolism and/or clearance

Fluorouracil Dose as Moderated by Fat Free Mass
Prado et al, Lancet Oncology (2008) 9: 629-635

Figure 1
Prado C, Current Opinion in Clinical Nutrition & Metabolic Care. 14(3):250-254, May 2011. DOI: 10.1097/MCO.0b013e3283455d45
Four studies relating treatment toxicity and depletion of skeletal muscle/lean body mass
Agents: • Fluoropyrimidines • Anthracyclines • Tyrosine kinase inhibitors
Treatment Related Toxicity and Lean Muscle Mass

Influence of GPS on Pre-dose Plasma Concentration of Oxycodone
Oxycodone/noroxycodone
GPS
0 1 2
Oxycodone C12 (ng/mL per mg/kg) 60.9 (41.0–70.0) 128 (77–209)* 158 (108–287)**
Noroxycodone C12 (ng/mL per mg/kg) 74.4 (57.5–117.0) 56.7 (31.5–96.8) 82.7 (41.0–184.6)
Noroxycodone C12/Oxycodone C12
1.33 (1.08–2.29) 0.63 (0.38–0.85)** 0.26 (0.26–0.89)*
*P<0.05 and **P<0.01

Body Image
Disfigurement Dysfunction
Patient Characteristics
Social Factors
Environmental Factors
Social Outcomes
Psychological Outcomes
Diagnosis Treatment Post-treatment
Quality of Life
Reintegration

Weight Loss and Body Image in Advanced Cancer
No Substantial Weight Loos
N=33
Substantitial Weight Loss
N=48
P-value
BIS Score 9.3 12.6 0.021
Age 49 57 0.018
HADS-A 7 7 0.916
HADs-D 4 8 0.004
Rhondali, Journal of Pain and Symptom Management, 2012

Why are fatigue and cachexia clinically meaningful to patients?
• Not confined to patients who have terminal disease
• Usually a component of a symptom complex • Associated with adverse outcomes • May affect survivors


Systemic Effects of Chemoradiation: Fatigue
• Definition: excessive tiredness involving the entire body which is disproportionate to exertion and does not resolve with rest
• Most common complaint of patients undergoing cancer therapy
• Reported in 40 to 100% of patients undergoing radiation therapy

Hickock: Frequency, Severity and Clinical Course of Fatigue
• 372 patients undergoing radiation therapy • Methods: Symptom Inventory at baseline and weekly for 4
weeks after • Results:
– 58% of patients had some degree of fatigue at baseline – At week 4, this increased to 78% – Of the patients without fatigue at baseline, 70% developed fatigue – Fatigue was high at baseline in head and neck cancer patients
(64%) – At week 4, 93% of head and neck cancer patients reported fatigue

Schubert Review: Fatigue and Inflammatory Markers
• Methods: – 18 studies (1037 participants)
• Results: – Fatigue correlated with overall inflammatory
markers (p<0.0001), IL-6 (p=0.004), Il-1ra(p=0.005) and neopterin (p=0.001)
– Fatigue did not correlate with TNF or IL-1b
Brain, Behavior and Immunity, 2007, 413-427

Starvation vs Cancer Cachexia
Starvation • Decrease in calories • Decrease in REE to spare
calories • Increased hepatic
production of ketones from fatty acids
• Increased peripheral use of fatty acids
• Sparing of muscle
Pro-inflammatory Cachexia • Decrease in calories • Increased REE
– Futile cycling
• Increased lipolyisis • Increase muscle breakdown with
loss of lean muscle mass

Neurocognitive Functioning in Adults with Upper Aerodigestive System Cancers
• PI: Stewart M. Bond, PhD, RN, AOCN (Funding: Hartford Foundation) • Goal:
To determine the extent of neurocognitive impairment in adults with newly diagnosed cancers of the upper aerodigestive system prior to, during, and at the completion of outpatient cancer treatment
• Specific Aims: 1) To estimate the prevalence of baseline neurocognitive impairment prior to initiation of
outpatient treatment 2) To estimate the incidence of neurocognitive impairment during outpatient cancer
treatment 3) To describe how neurocognitive functioning changes over time during treatment 4) To identify predictors of neurocognitive functioning (including biological correlates)

Concept of Energy Balance Weight Maintenance
REE
PAEE
Energy out
EI = Energy Intake PAEE = Physical Activity Energy Expenditure REE = Resting Energy Expenditure
EI
Energy in

Starvation vs Cancer Cachexia
Starvation: • Decrease in calories • Decrease in REE to spare
calories • Increased hepatic
production of ketones from fatty acids
• Increased peripheral use of fatty acids
• Sparing of muscle
Cancer Cachexia: • Decrease in calories • Increased REE
– Futile cycling
• Increased lipolyisis • Increase muscle
breakdown with loss of lean muscle mass

Inflammatory Mediators:
Pre-treatment Post-Treatment P-value
CRP 5.04 10.32 .09
IL-6 5.7 14.1 .08

Change in Physical Performance and Function
Variable Baseline 1month post treatment
P-value
Total Physical Activity Score
5.33±4.58 1.64±1.75 0.003
Physical Performance Test
14.6±1.59 12.50±4.16 0.140
ADL Score 0.00±0.00 2.36±3.34 0.020
IADL Score 3.21±2.12 6.07±2.76 0.003

Inflammation and Oxidative Stress
• Increase in pro-inflammatory cytokines (IL-6 and IL-1B) @ with decrease in ADL (p=0.02) and IADL (p=0.04)
• Oxidative stress – Serum F2 isoprostane levels increased p=.007 – @ with loss of fat and fat-free mass p=.04


![[Cancer-associated cachexia] clean for authors](https://img.dokumen.tips/doc/110x75/61d1ee79118df22edc52f710/cancer-associated-cachexia-clean-for-authors.jpg)