Embed Size (px)
Citation preview
FAST and Asset-Level Data Reporting
Lessons Learned and Insights
Ron Stewart • Idaho National Laboratory
INL/CON-18-44473 Rev. 0
We’ll cover…
• FY 2017 fleet data call overview and status
• Asset-level data reporting: what we’ve learned
• Fleet insights: new ways we can look at the fleet
• Looking forward…
• Discussion / Q&A
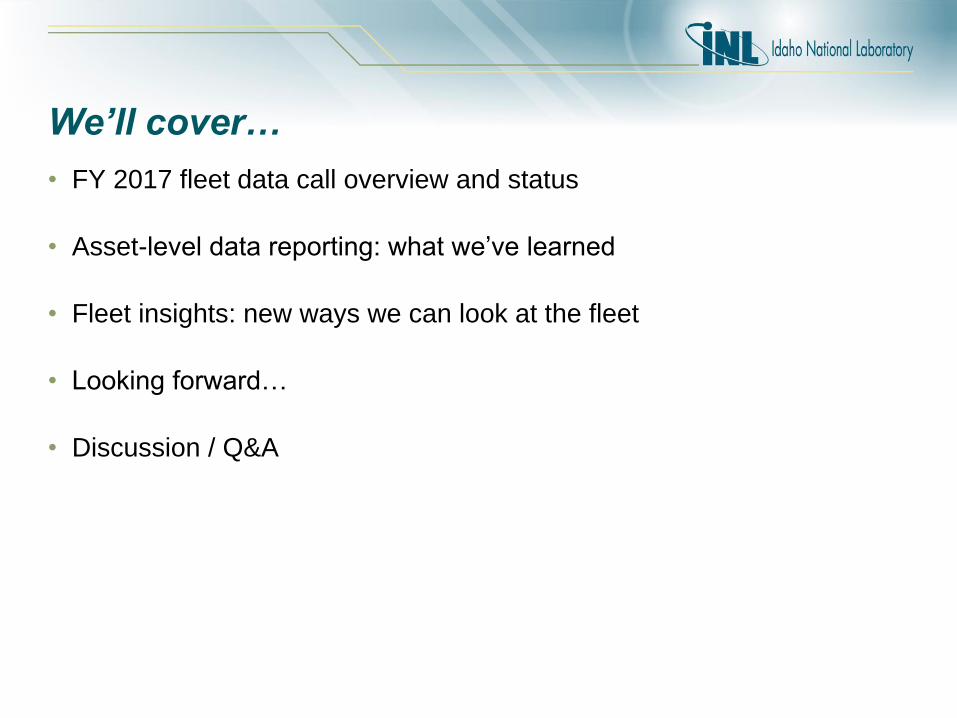
FY 2018 Fleet Data Call Overview
• 39 of 49 reporting Federal agencies submitting per-vehicle data
• Remaining 10 agencies submitted aggregated fleet data – 1 large agency fleet
– 2 medium agency fleets
– 7 small agency fleets
• 90% of Federal fleet covered in new data shape – Approximately 650,000 vehicles and their data
• Dataset not yet final – Several agencies still working on initial submission
– DOE feedback to agencies may result in updates

ALD: Lessons Learned - Validation
• Flagging business rules will all be evaluated – Thresholds / ranges evaluated to make sure they are actually flagging outliers
• Flagging too much?
• Not flagging things they should?
– Tune how / when rules are applied:
• Some rules apply only to vehicles in fleet entire year?
• Some rules may need to be more specific: ranges based on vehicle type rather than class?
– Elevate flagging rules to block clearly invalid data?
• A few areas where we will look to revise blocking rules
• We (all) need additional ways of exploring flagged data in FAST
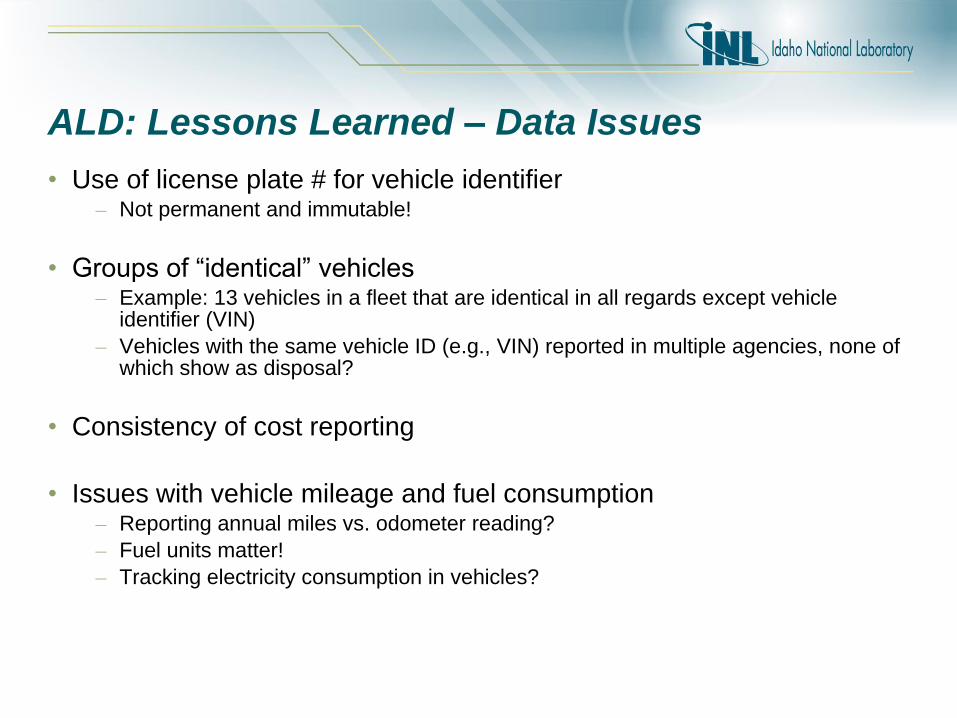
ALD: Lessons Learned – Data Issues
• Use of license plate # for vehicle identifier – Not permanent and immutable!
• Groups of “identical” vehicles – Example: 13 vehicles in a fleet that are identical in all regards except vehicle
identifier (VIN)
– Vehicles with the same vehicle ID (e.g., VIN) reported in multiple agencies, none of which show as disposal?
• Consistency of cost reporting
• Issues with vehicle mileage and fuel consumption – Reporting annual miles vs. odometer reading?
– Fuel units matter!
– Tracking electricity consumption in vehicles?
ALD: Insights
• Caveat: partial and preliminary dataset
• Looking at “the fuel coding issue”
• Very diverse fleet (we knew that) – … now we can quantify “how diverse?”
• Some examples of new ways of looking at the fleet
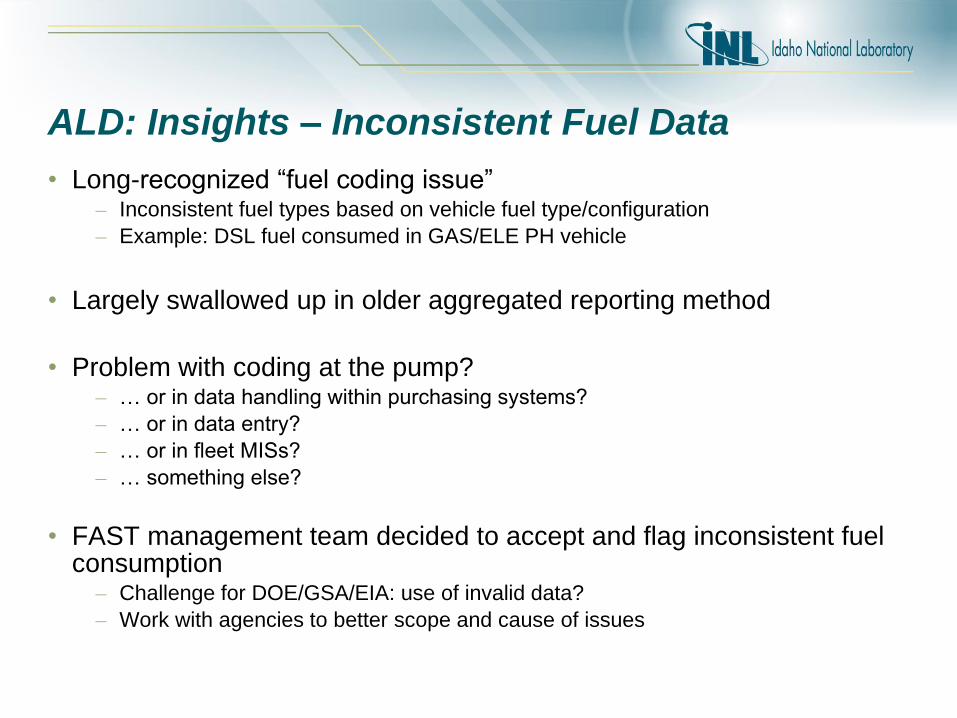
ALD: Insights – Inconsistent Fuel Data
• Long-recognized “fuel coding issue” – Inconsistent fuel types based on vehicle fuel type/configuration
– Example: DSL fuel consumed in GAS/ELE PH vehicle
• Largely swallowed up in older aggregated reporting method
• Problem with coding at the pump? – … or in data handling within purchasing systems?
– … or in data entry?
– … or in fleet MISs?
– … something else?
• FAST management team decided to accept and flag inconsistent fuel consumption – Challenge for DOE/GSA/EIA: use of invalid data?
– Work with agencies to better scope and cause of issues
ALD: Insights – Inconsistent Fuel Data
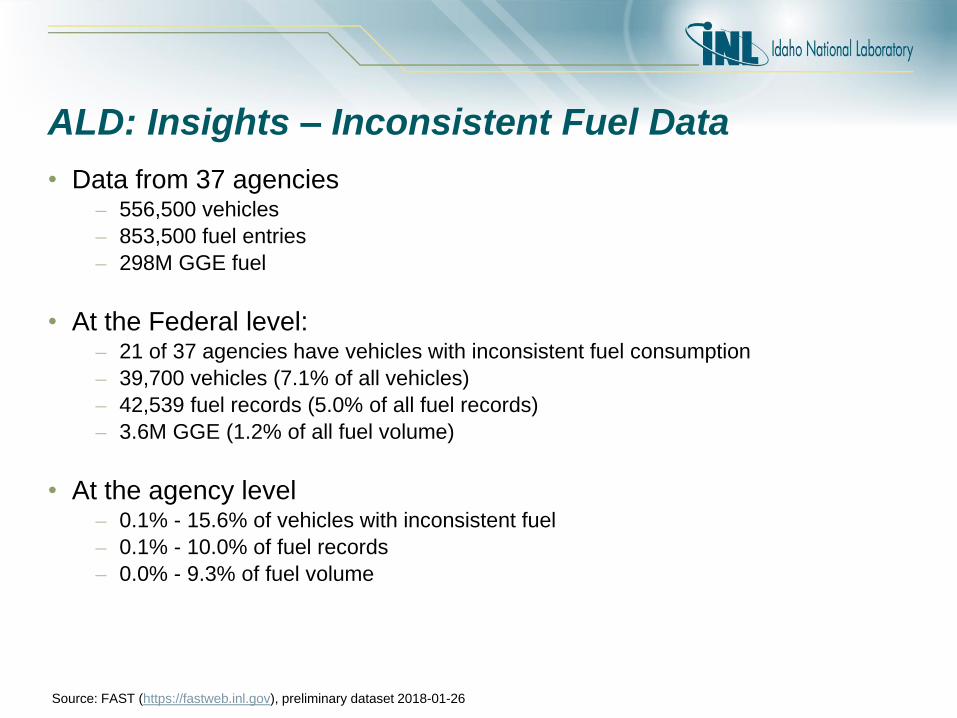
• Data from 37 agencies – 556,500 vehicles
– 853,500 fuel entries
– 298M GGE fuel
• At the Federal level: – 21 of 37 agencies have vehicles with inconsistent fuel consumption
– 39,700 vehicles (7.1% of all vehicles)
– 42,539 fuel records (5.0% of all fuel records)
– 3.6M GGE (1.2% of all fuel volume)
• At the agency level – 0.1% - 15.6% of vehicles with inconsistent fuel
– 0.1% - 10.0% of fuel records
– 0.0% - 9.3% of fuel volume
Source: FAST (https://fastweb.inl.gov), preliminary dataset 2018-01-26
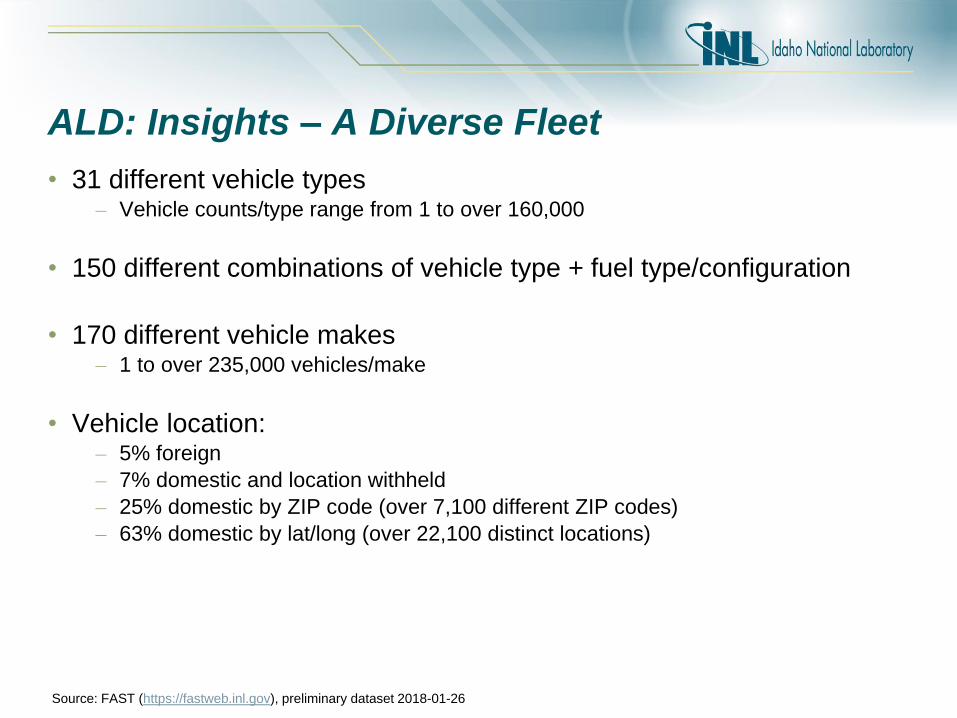
ALD: Insights – A Diverse Fleet
• 31 different vehicle types – Vehicle counts/type range from 1 to over 160,000
• 150 different combinations of vehicle type + fuel type/configuration
• 170 different vehicle makes – 1 to over 235,000 vehicles/make
• Vehicle location: – 5% foreign
– 7% domestic and location withheld
– 25% domestic by ZIP code (over 7,100 different ZIP codes)
– 63% domestic by lat/long (over 22,100 distinct locations)
Source: FAST (https://fastweb.inl.gov), preliminary dataset 2018-01-26
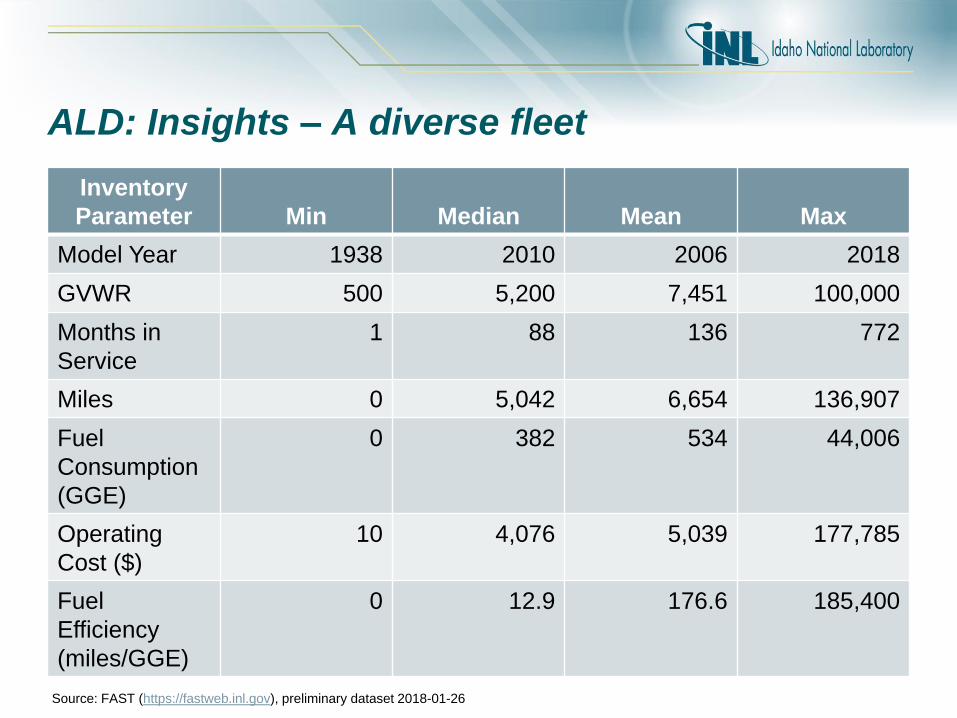
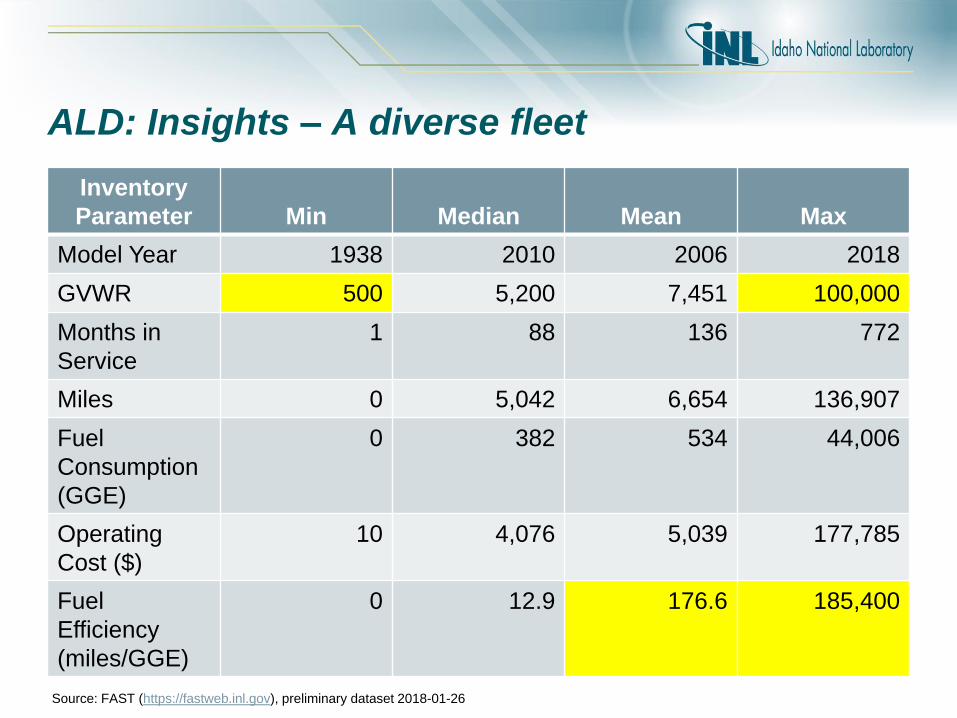
ALD: Insights – A diverse fleet
Inventory
Parameter Min Median Mean Max
Model Year 1938 2010 2006 2018
GVWR 500 5,200 7,451 100,000
Months in
Service
1 88 136 772
Miles 0 5,042 6,654 136,907
Fuel
Consumption
(GGE)
0 382 534 44,006
Operating
Cost ($)
10 4,076 5,039 177,785
Fuel
Efficiency
(miles/GGE)
0 12.9 176.6 185,400
Source: FAST (https://fastweb.inl.gov), preliminary dataset 2018-01-26
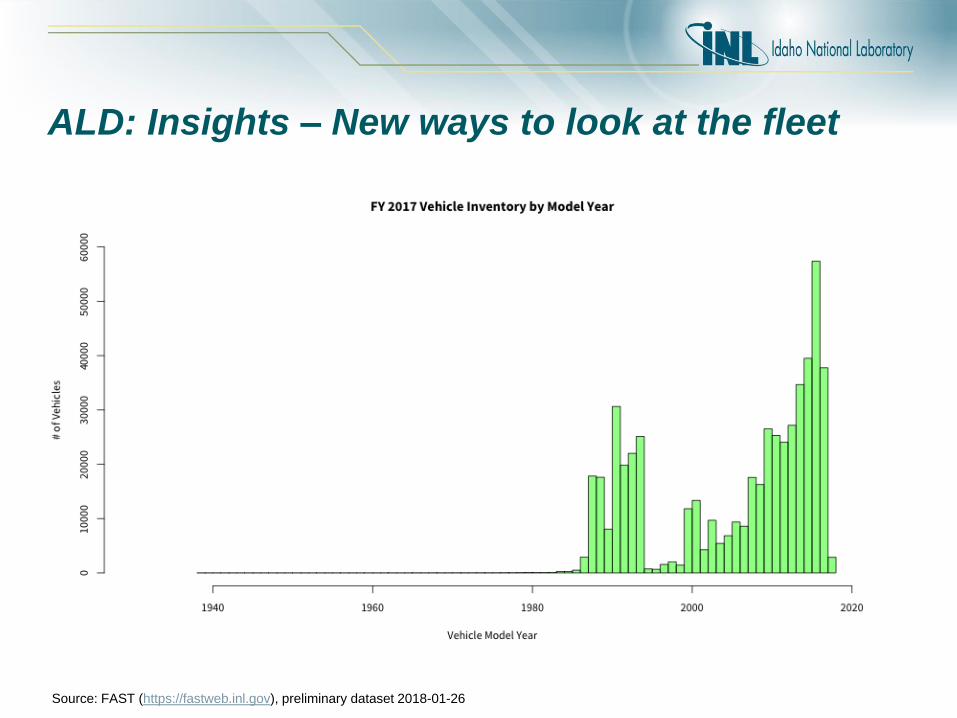
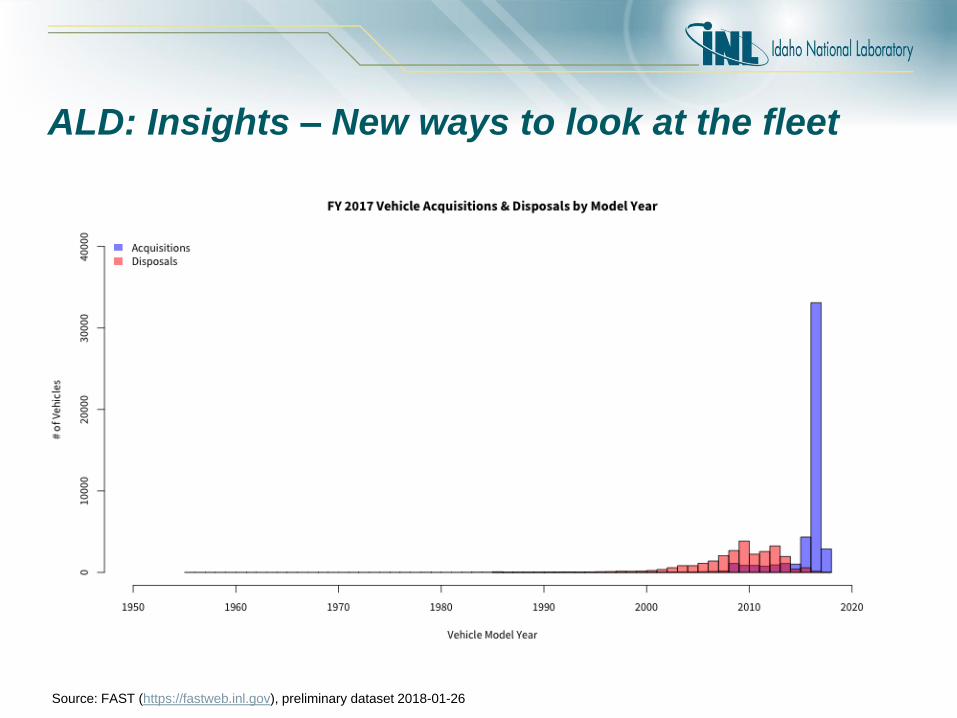
ALD: Insights – New ways to look at the fleet
Source: FAST (https://fastweb.inl.gov), preliminary dataset 2018-01-26
ALD: Insights – New ways to look at the fleet
Source: FAST (https://fastweb.inl.gov), preliminary dataset 2018-01-26
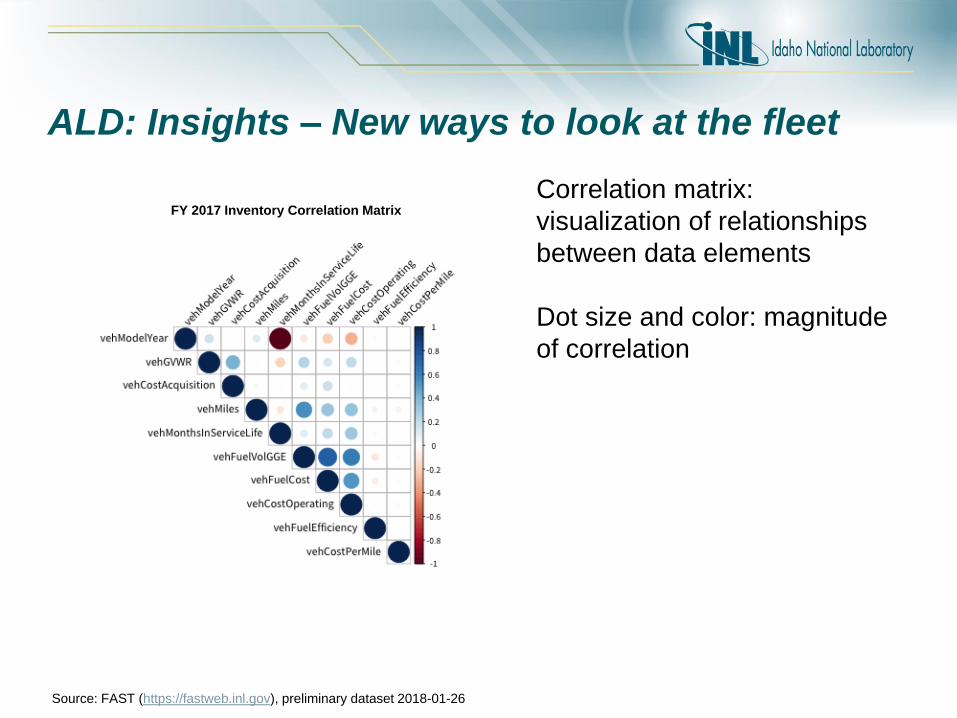
ALD: Insights – New ways to look at the fleet
Correlation matrix:
visualization of relationships
between data elements
Dot size and color: magnitude
of correlation
FY 2017 Inventory Correlation Matrix
Source: FAST (https://fastweb.inl.gov), preliminary dataset 2018-01-26
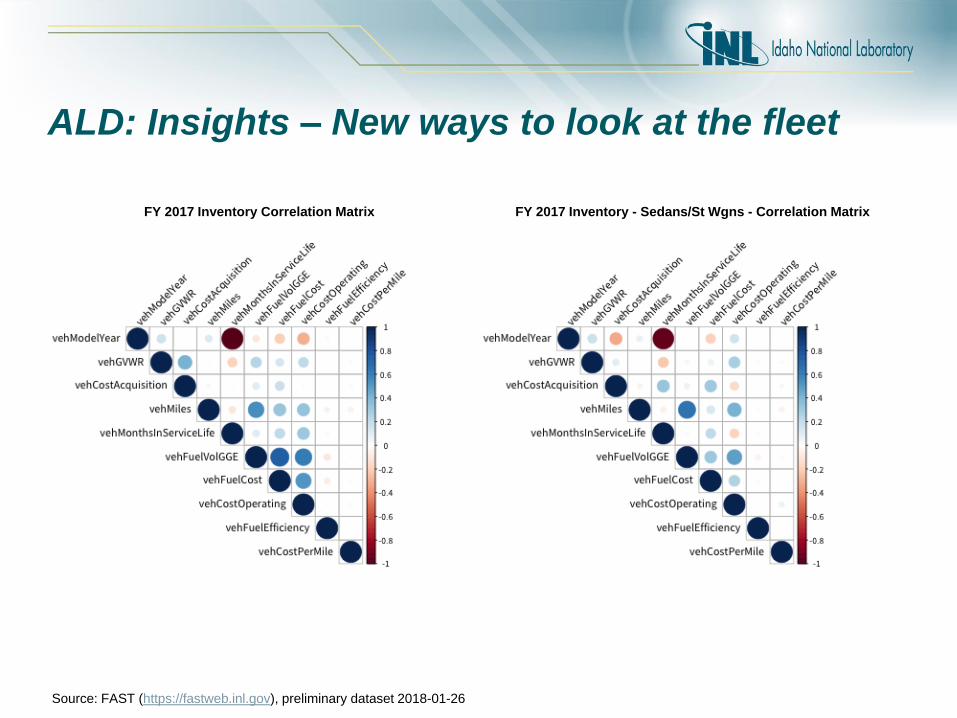
ALD: Insights – New ways to look at the fleet
FY 2017 Inventory Correlation Matrix FY 2017 Inventory - Sedans/St Wgns - Correlation Matrix
Source: FAST (https://fastweb.inl.gov), preliminary dataset 2018-01-26
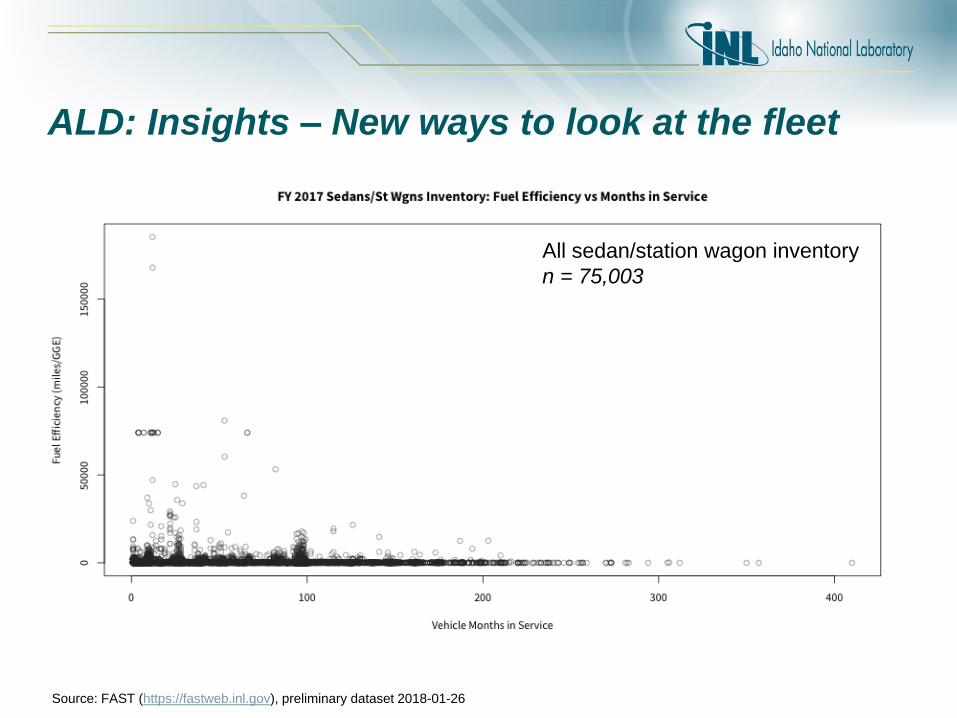
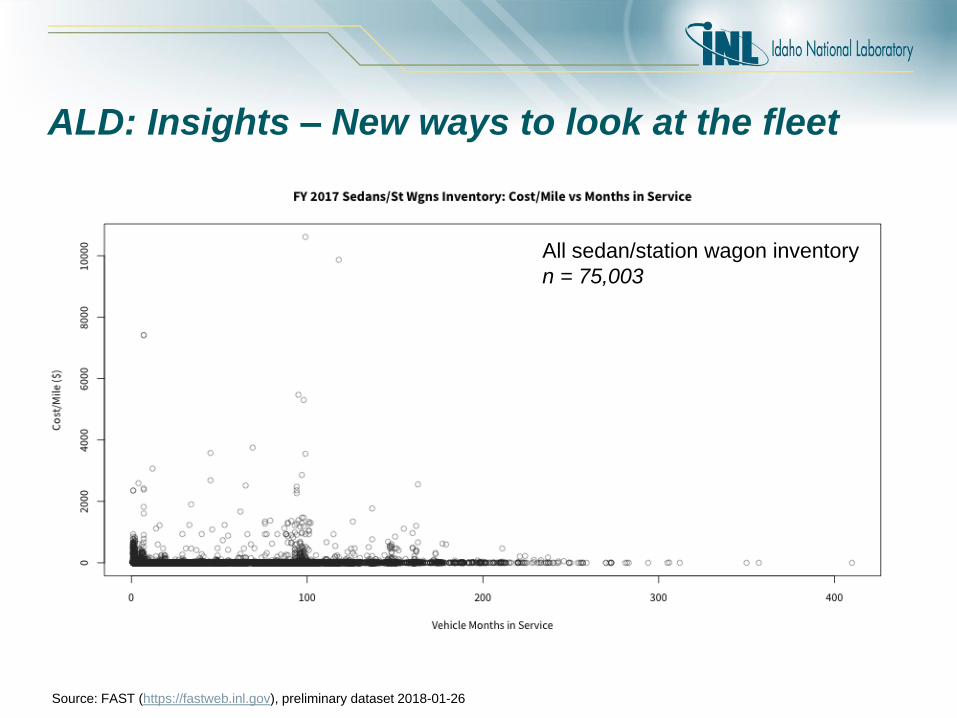
ALD: Insights – New ways to look at the fleet
All sedan/station wagon inventory
n = 75,003
Source: FAST (https://fastweb.inl.gov), preliminary dataset 2018-01-26
ALD: Insights – New ways to look at the fleet
All sedan/station wagon inventory less:
- EV’s (ELE DE, GAS/ELE PH, etc.)
- Vehicles with miles < 500
n = 68,743
Source: FAST (https://fastweb.inl.gov), preliminary dataset 2018-01-26
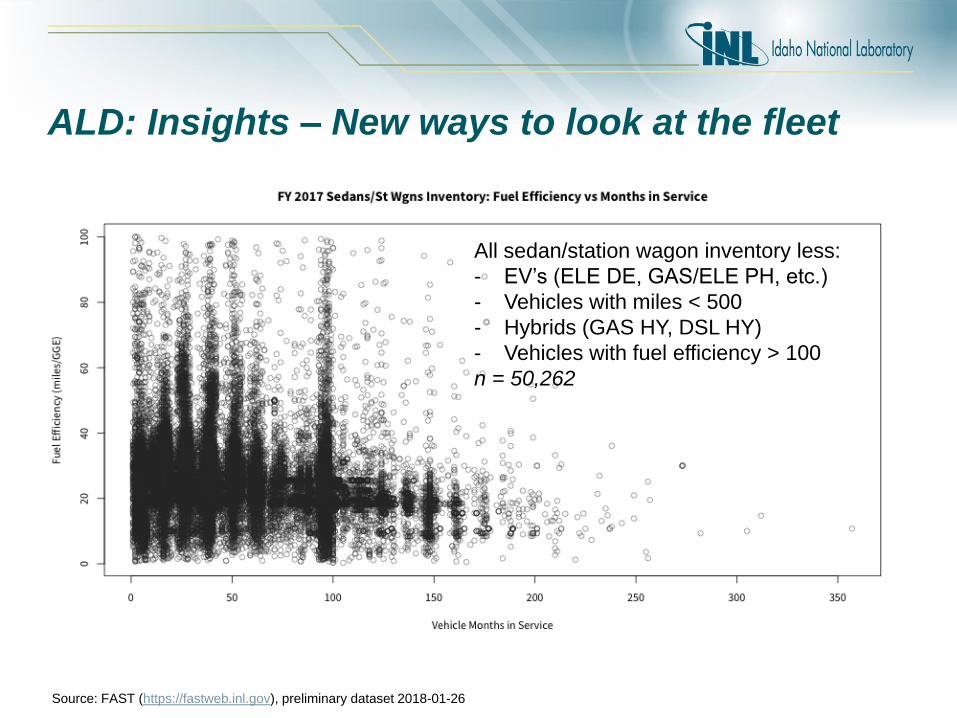
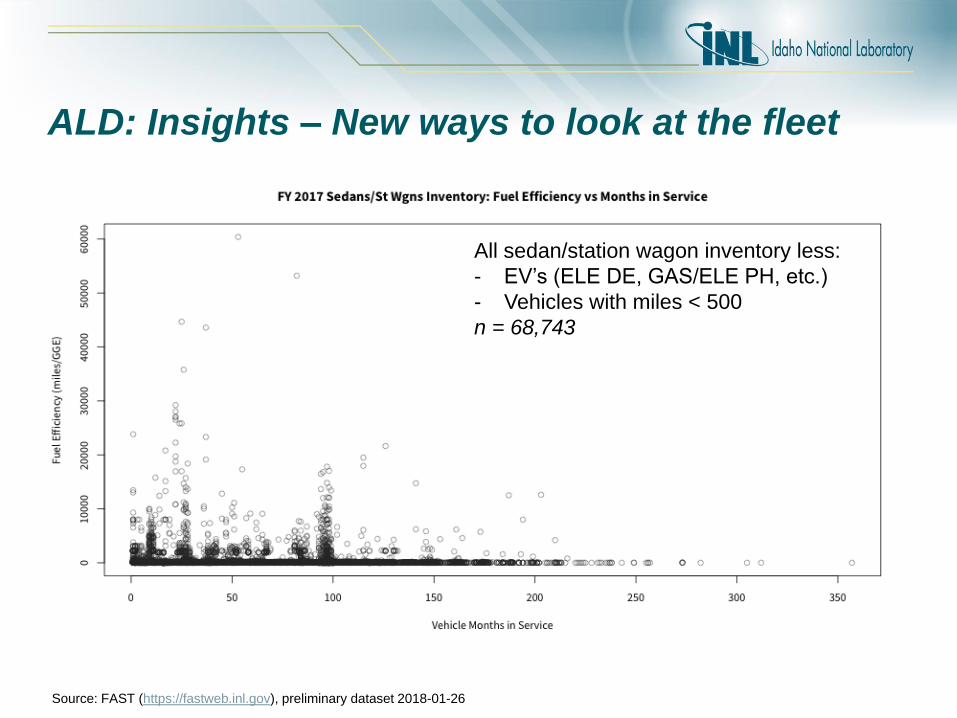
ALD: Insights – New ways to look at the fleet
All sedan/station wagon inventory less:
- EV’s (ELE DE, GAS/ELE PH, etc.)
- Vehicles with miles < 500
- Hybrids (GAS HY, DSL HY)
- Vehicles with fuel efficiency > 100
n = 50,262
Source: FAST (https://fastweb.inl.gov), preliminary dataset 2018-01-26
ALD: Insights – New ways to look at the fleet
All sedan/station wagon inventory
n = 75,003
Source: FAST (https://fastweb.inl.gov), preliminary dataset 2018-01-26
Looking forward…
• Planned on the FAST side: – Review and tuning of business rules
– Additional ways to look at the data and flags
• Recommendations for the agency side: – Make sure data corrections go into fleet MIS(s)
– Review what was flagged… and why
– Review data-related processes that contribute(d) to missing, invalid, or questionable data
• Find ways to address those as far upstream and early as possible?
• Look for ways to highlight questionable data within fleet MIS(s) and review processes?
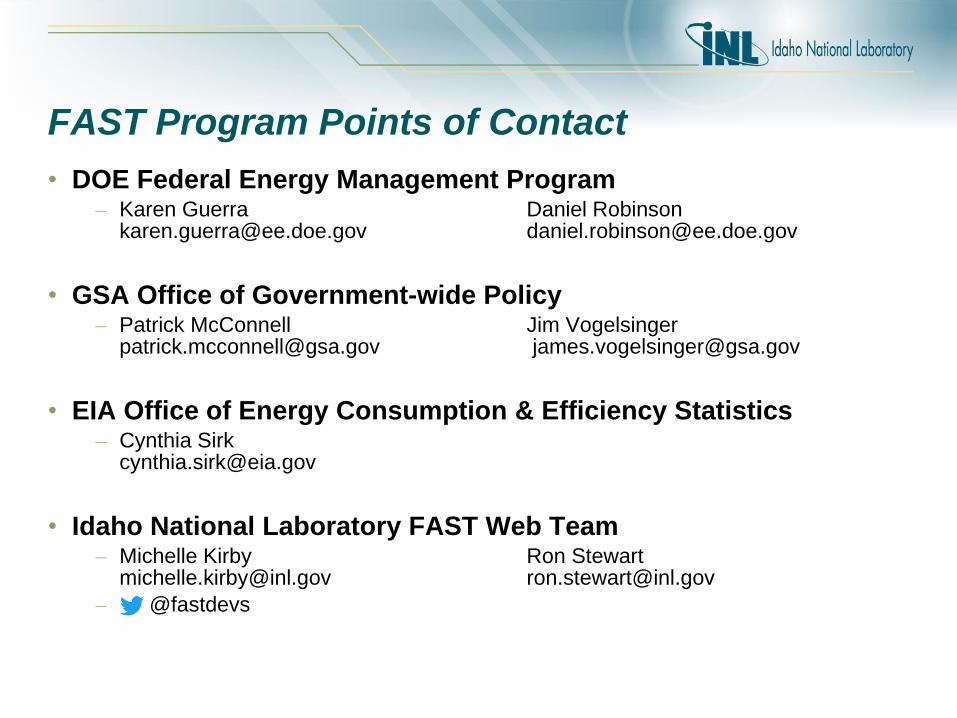
FAST Program Points of Contact
• DOE Federal Energy Management Program – Karen Guerra Daniel Robinson
[email protected] [email protected]
• GSA Office of Government-wide Policy – Patrick McConnell Jim Vogelsinger
[email protected] [email protected]
• EIA Office of Energy Consumption & Efficiency Statistics – Cynthia Sirk
• Idaho National Laboratory FAST Web Team – Michelle Kirby Ron Stewart
[email protected] [email protected]
– @fastdevs