Embed Size (px)
Citation preview
FARSTAD SHIPPING ASA
QUARTERLY REPORT4-2015
QUARTERLY REPORT 4 - 2015 - farstad shipping asa
593MARKET VALUE
940OPERATING INCOME
-982 OPERATING PROFIT (EBIT)
2
QUARTERLY REPORT 4 - 2015 - farstad shipping asa
1NEWBUILD
59VESSELS
1 VISION
3
QUARTERLY REPORT 4 - 2015 - farstad shipping asa
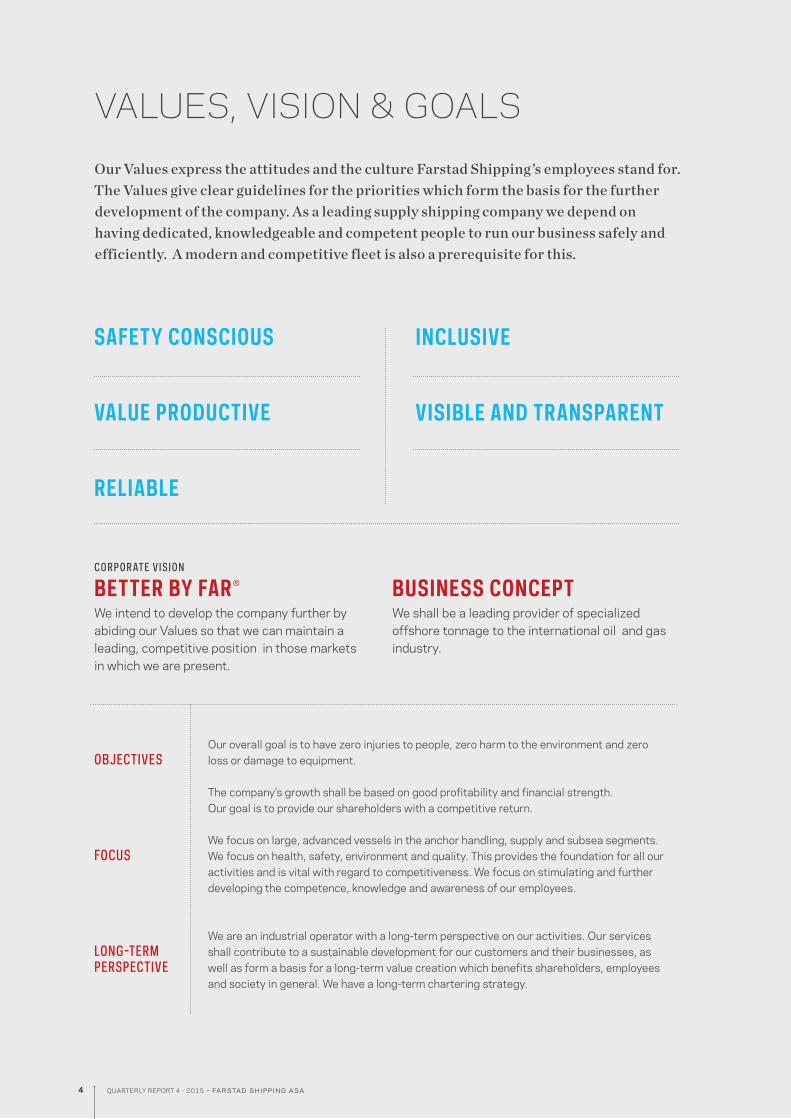
VALUES, VISION & GOALS
C O R P O R AT E V IS IO N
BETTER BY FAR®
We intend to develop the company further by abiding our Values so that we can maintain a leading, compet itive position in those markets in which we are present.
BUSINESS CONCEPTWe shall be a leading provider of specialized offshore tonnage to the international oil and gas industry.
Our Values express the attitudes and the culture Farstad Shipping ’s employees stand for. The Values give clear guidelines for the priorities which form the basis for the further development of the company. As a leading supply shipping company we depend on having dedicated, knowledgeable and competent people to run our business safely and efficiently. A modern and competitive fleet is also a prerequisite for this.
Our overall goal is to have zero injuries to people, zero harm to the environ ment and zero loss or damage to equipment.
The company’s growth shall be based on good profitability and financial strength. Our goal is to provide our shareholders with a competitive return.
We focus on large, advanced vessels in the anchor handling, supply and subsea segments. We focus on health, safety, environment and quality. This provides the foundation for all our activities and is vital with regard to competitiveness. We focus on stimulating and further developing the competence, knowledge and awareness of our employees.
We are an industrial operator with a long-term perspective on our activities. Our services shall contribute to a sustainable development for our customers and their businesses, as well as form a basis for a long-term value creation which benefits share holders, employees and society in general. We have a long-term chartering strategy.
OBJECTIVES
FOCUS
LONG-TERMPERSPECTIVE
INCLUSIVE
VISIBLE AND TRANSPARENT
SAFETY CONSCIOUS
VALUE PRODUCTIVE
RELIABLE
4
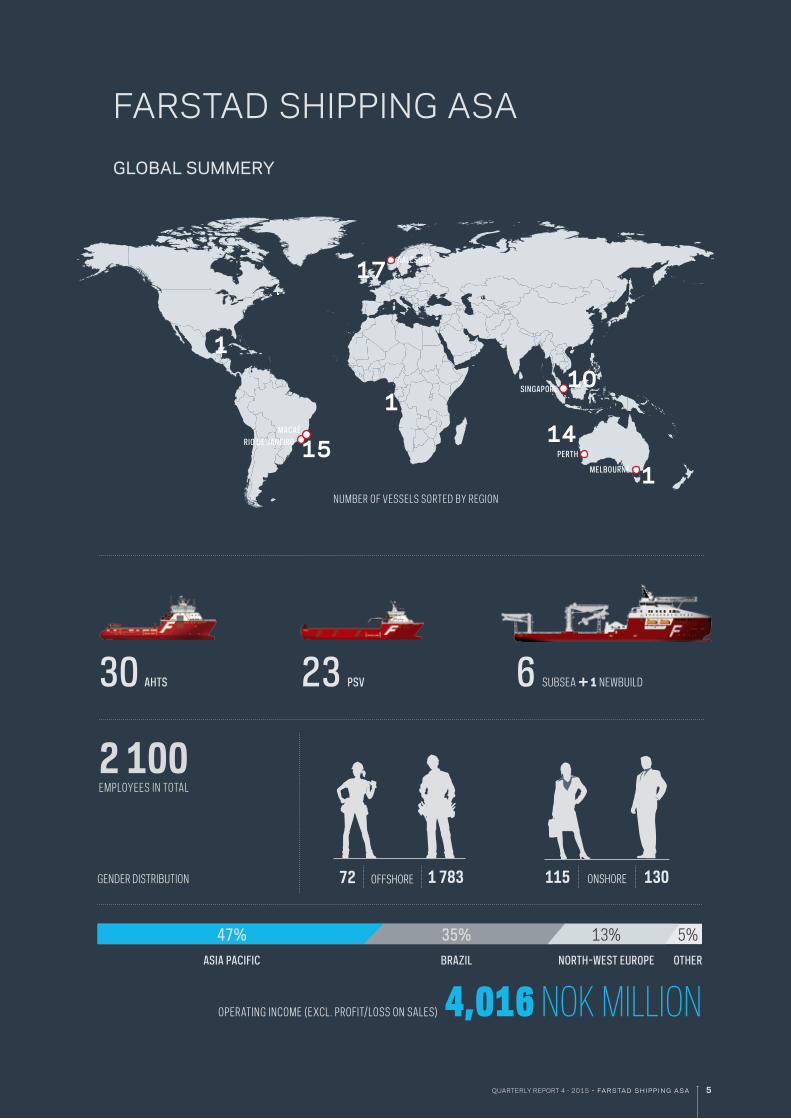
115 13072 1 783
17
1
1
1514
10
1
SINGAPORE
PERTH
MACAÉRIO DE JANEIRO
MELBOURNE
QUARTERLY REPORT 4 - 2015 - farstad shipping asa
2 100 EMPLOYEES IN TOTAL
FARSTAD SHIPPING ASA
GLOBAL SUMMERY
GENDER DISTRIBUTION
23 PSV 6 SUBSEA + 1 NEWBUILD30 AHTS
ONSHOREOFFSHORE
4,016 NOK MILLION
47% ASIA PACIFIC
35% BRAZIL
13% NORTH-WEST EUR0PE
5% OTHER
OPERATING INCOME (EXCL. PROFIT/LOSS ON SALES)
NUMBER OF VESSELS SORTED BY REGION
AALESUND
5
20112012201320142015
20112012201320142015
20112012201320142015
1 400
1 200
1 000
800
600
400
200
0
500
400
300
200
100
0
10
9
8
7
6
5
4
3
2
1
0
400
300
200
100
0
201420132012201120102009 2015
TRCF LTIF
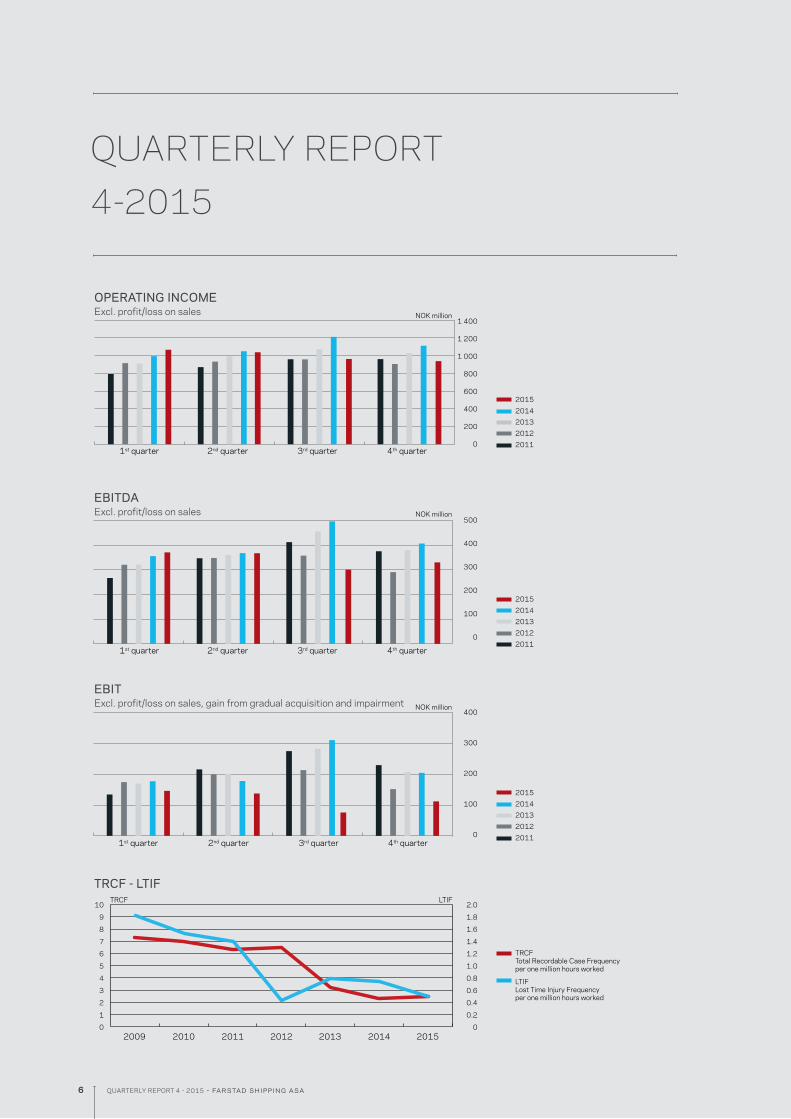
TRCF - LTIF
QUARTERLY REPORT 4 - 2015 - farstad shipping asa
OPERATING INCOMEExcl. profit/loss on sales NOK million
NOK million
3rd quarter1st quarter 2nd quarter 4th quarter
EBITExcl. profit/loss on sales, gain from gradual acquisition and impairment NOK million
3rd quarter1st quarter 2nd quarter 4th quarter
3rd quarter1st quarter 2nd quarter 4th quarter
EBITDA Excl. profit/loss on sales
TRCFTotal Recordable Case Frequency per one million hours worked
LTIFLost Time Injury Frequencyper one million hours worked
2.0
1.8
1.6
1.4
1.2
1.0
0.8
0.6
0.4
0.2
0
QUARTERLY REPORT4-2015
6
QUARTERLY REPORT 4 - 2015 - farstad shipping asa
*) Cash flow is defined as pre-tax profit + depreciation, impairments and deferred maintenance +/- change on revaluation of long-term liabilities in foreign currency.
Farstad Shipping achieved an operating income of NOK 939.9 million for the 4th quarter. The operating loss (EBIT) was NOK 982.0 million after impairments of NOK 1,094.6 million. Loss after taxes was NOK 1,310.9 million.
THIS IS FARSTAD SHIPPPINGFarstad Shipping is a leading supply shipping company within our defined segment of large and more advan-ced offshore supply vessels. The company is value driven with focus on safety, quality and efficiency in our services. The company’s fleet consists of 59 ves-sels: 30 AHTS, 23 PSV and 6 SUBSEA vessels. Far-stad Shipping has currently one SUBSEA newbuild under construction for delivery in November 2016. The company’s operations are managed from Aale-sund, Melbourne, Perth, Singapore, Macaé and Rio de Janeiro with approx. 2,100 employees engaged onshore and offshore. At the moment, 15 vessels are stationed in Brazil, 17 vessels in North-West Europe, 25 in the Asia Pacific region, one vessel in the Gulf of Mexico and one vessel in Africa.
RESULTS FOR THE 4TH QUARTER 2015Farstad Shipping achieved an operating income of NOK 939.9 million for the 4th quarter (NOK 1,111.7 million for the same period in 2014). The reduced operating income is a result of the challenging market situation. The operating costs for the period were NOK 609.5 million (NOK 704.9 million). The company has an extensive cost saving pro-gram, and the reduced operating costs are star-ting to show the effect of the implemented cost saving measures. Eleven of the Group’s vessels were fully or partly laid up during the 4th quarter. Operating profit before depreciations and impair-ments (EBITDA) was NOK 330.4 million (NOK 406.9 million). The operating loss (EBIT) was NOK 982.0 million (profit NOK 102.8 million) after depreciations of NOK 217.8 million (NOK 202.3 million) and impair-ments of NOK 1,094.6 million (NOK 101.8 million).
Net finance was negative NOK 270.6 million (nega- tive NOK 335.3 million). Currency losses of NOK 73.3 million were recognized during the quarter (gain NOK 43.9 million). Further an unrealized currency loss of NOK 31.3 million (loss NOK 223.0 million) was
recognized due to the adjustment of the company’s long-term liabilities in foreign currency. The unreali-zed currency loss is mainly due to a further weakening of NOK during the quarter. Loss after taxes was NOK 1,310.9 million (loss NOK 225.8 million). The Group’s cash flow*) for the period was NOK 91.0 million com-pared to NOK 294.6 million for the same period in 2014.
A positive change in the market value of currency and interest hedging instruments, NOK 40.1 million (negative NOK 198.8 million) was recognized against other comprehensive income and added to equity.
PRELIMINARY RESULTS AS PER 31.12.2015The operating income at 31.12.15 was NOK 4,011.1 million incl. loss from sale of a vessel of NOK 4.6 mil-lion (NOK 4,384.0 million incl. gain from sale of ves-sels of NOK 15.0 million). Operating costs were NOK 2,648.1 million (NOK 2,742.5 million). Operating profit before depreciations and impairments (EBITDA) was NOK 1,363.1 million (NOK 1,641.5 million).
Depreciations and impairments were NOK 2,176.8 million (NOK 856.1 million). Of this, impairments were NOK 1,279.6 million (NOK 101.8 million). The operating loss (EBIT) was NOK 813.8 million (profit NOK 785.3 million). Net finance was negative NOK 1,272.6 million (negative NOK 792.3 million). Unrea-lized currency loss was NOK 548.6 million (loss NOK 281.2 million). A realized currency loss of NOK 86.4 million was recognized during the year (gain of NOK 71.1 million). Loss after taxes was NOK 2,170.0 mil-lion (loss NOK 8.3 million). The Group’s cash flow*) for 2015 was NOK 639.1 million compared to NOK 1,130.3 million in 2014.
Due to the negative development in the brokers’ market values of the fleet, the prevailing market prospects as well as uncertainty related to vessels future earnings, NOK 1,094.6 million related to impairments of ves-
7
QUARTERLY REPORT 4 - 2015 - farstad shipping asa
Q U A RT E R LY R E P O RT 4 - 2 0 1 5
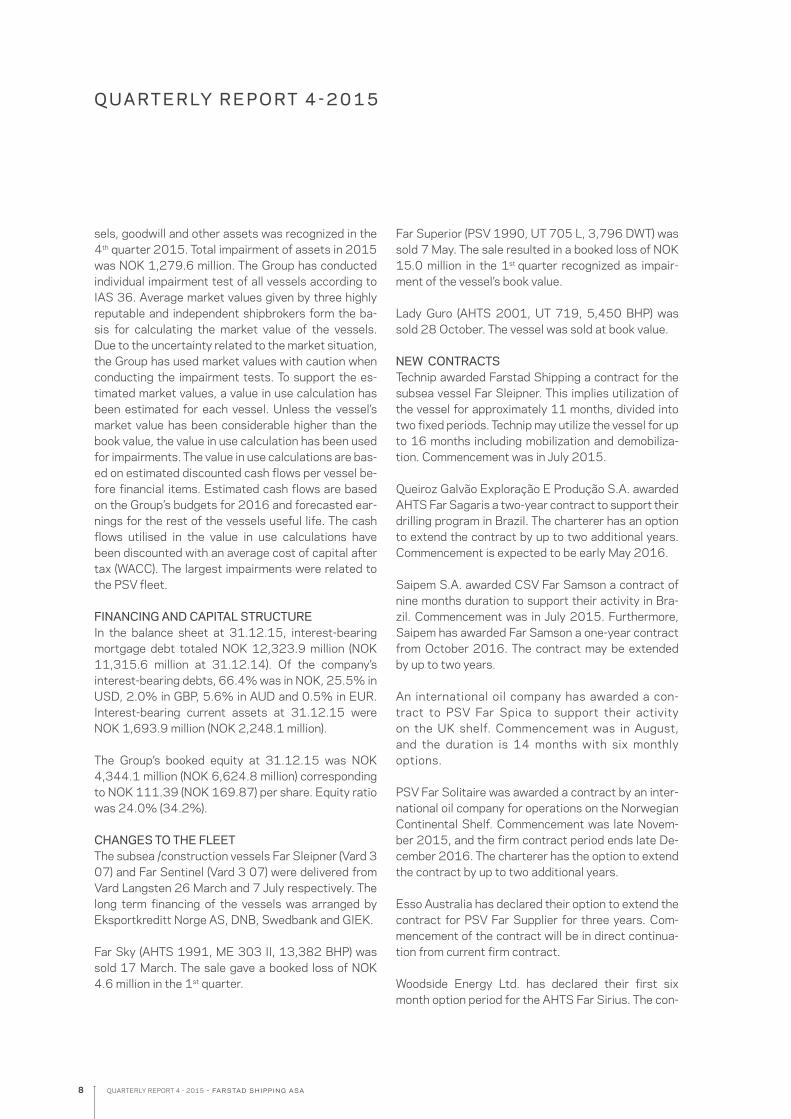
sels, goodwill and other assets was recognized in the 4th quarter 2015. Total impairment of assets in 2015 was NOK 1,279.6 million. The Group has conducted individual impairment test of all vessels according to IAS 36. Average market values given by three highly reputable and independent shipbrokers form the ba-sis for calculating the market value of the vessels. Due to the uncertainty related to the market situation, the Group has used market values with caution when conducting the impairment tests. To support the es-timated market values, a value in use calculation has been estimated for each vessel. Unless the vessel’s market value has been considerable higher than the book value, the value in use calculation has been used for impairments. The value in use calculations are bas-ed on estimated discounted cash flows per vessel be-fore financial items. Estimated cash flows are based on the Group’s budgets for 2016 and forecasted ear-nings for the rest of the vessels useful life. The cash flows utilised in the value in use calculations have been discounted with an average cost of capital after tax (WACC). The largest impairments were related to the PSV fleet.
FINANCING AND CAPITAL STRUCTUREIn the balance sheet at 31.12.15, interest-bearing mortgage debt totaled NOK 12,323.9 million (NOK 11,315.6 million at 31.12.14). Of the company’s interest-bearing debts, 66.4% was in NOK, 25.5% in USD, 2.0% in GBP, 5.6% in AUD and 0.5% in EUR. Interest-bearing current assets at 31.12.15 were NOK 1,693.9 million (NOK 2,248.1 million).
The Group’s booked equity at 31.12.15 was NOK 4,344.1 million (NOK 6,624.8 million) corresponding to NOK 111.39 (NOK 169.87) per share. Equity ratio was 24.0% (34.2%).
CHANGES TO THE FLEETThe subsea /construction vessels Far Sleipner (Vard 3 07) and Far Sentinel (Vard 3 07) were delivered from Vard Langsten 26 March and 7 July respectively. The long term financing of the vessels was arranged by Eksportkreditt Norge AS, DNB, Swedbank and GIEK.
Far Sky (AHTS 1991, ME 303 II, 13,382 BHP) was sold 17 March. The sale gave a booked loss of NOK 4.6 million in the 1st quarter.
Far Superior (PSV 1990, UT 705 L, 3,796 DWT) was sold 7 May. The sale resulted in a booked loss of NOK 15.0 million in the 1st quarter recognized as impair-ment of the vessel’s book value.
Lady Guro (AHTS 2001, UT 719, 5,450 BHP) was sold 28 October. The vessel was sold at book value.
NEW CONTRACTSTechnip awarded Farstad Shipping a contract for the subsea vessel Far Sleipner. This implies utilization of the vessel for approximately 11 months, divided into two fixed periods. Technip may utilize the vessel for up to 16 months including mobilization and demobiliza-tion. Commencement was in July 2015. Queiroz Galvão Exploração E Produção S.A. awarded AHTS Far Sagaris a two-year contract to support their drilling program in Brazil. The charterer has an option to extend the contract by up to two additional years. Commencement is expected to be early May 2016.
Saipem S.A. awarded CSV Far Samson a contract of nine months duration to support their activity in Bra-zil. Commencement was in July 2015. Furthermore, Saipem has awarded Far Samson a one-year contract from October 2016. The contract may be extended by up to two years.
An international oil company has awarded a con-tract to PSV Far Spica to support their activity on the UK shelf. Commencement was in August, and the duration is 14 months with six monthly options.
PSV Far Solitaire was awarded a contract by an inter-national oil company for operations on the Norwegian Continental Shelf. Commencement was late Novem-ber 2015, and the firm contract period ends late De-cember 2016. The charterer has the option to extend the contract by up to two additional years.
Esso Australia has declared their option to extend the contract for PSV Far Supplier for three years. Com-mencement of the contract will be in direct continua-tion from current firm contract.
Woodside Energy Ltd. has declared their first six month option period for the AHTS Far Sirius. The con-
8
QUARTERLY REPORT 4 - 2015 - farstad shipping asa
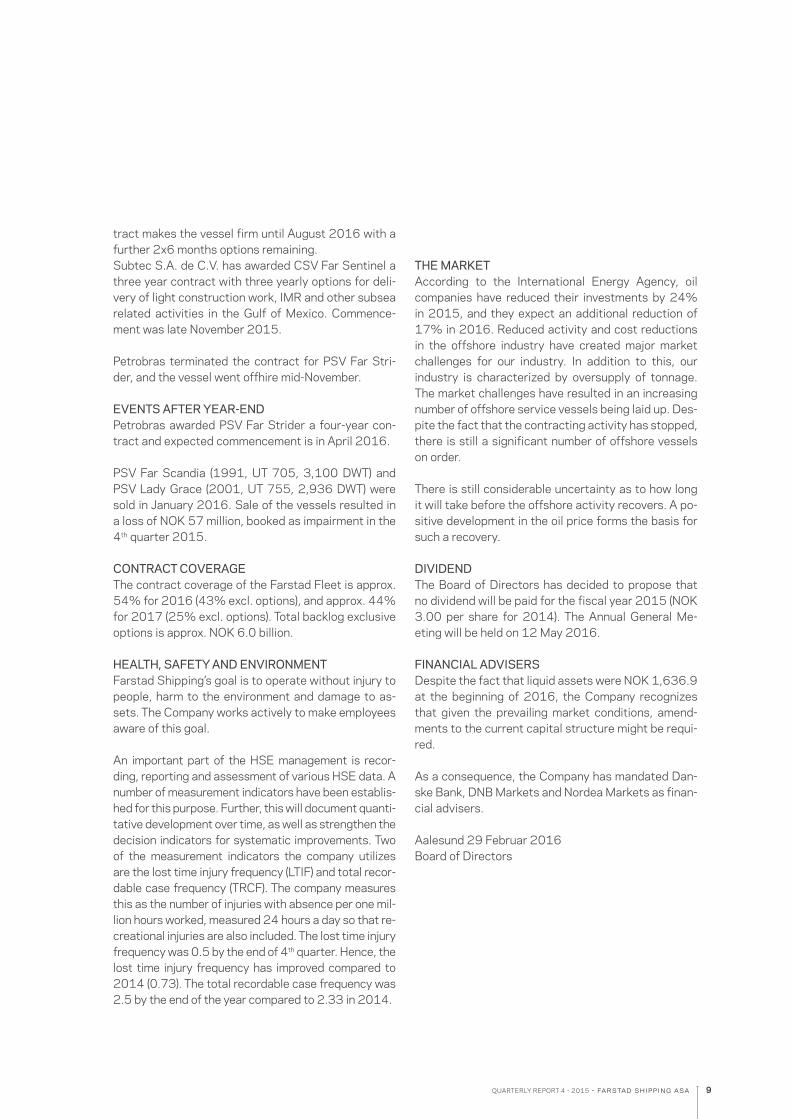
tract makes the vessel firm until August 2016 with a further 2x6 months options remaining.Subtec S.A. de C.V. has awarded CSV Far Sentinel a three year contract with three yearly options for deli-very of light construction work, IMR and other subsea related activities in the Gulf of Mexico. Commence-ment was late November 2015.
Petrobras terminated the contract for PSV Far Stri-der, and the vessel went offhire mid-November.
EVENTS AFTER YEAR-ENDPetrobras awarded PSV Far Strider a four-year con-tract and expected commencement is in April 2016.
PSV Far Scandia (1991, UT 705, 3,100 DWT) and PSV Lady Grace (2001, UT 755, 2,936 DWT) were sold in January 2016. Sale of the vessels resulted in a loss of NOK 57 million, booked as impairment in the 4th quarter 2015. CONTRACT COVERAGEThe contract coverage of the Farstad Fleet is approx. 54% for 2016 (43% excl. options), and approx. 44% for 2017 (25% excl. options). Total backlog exclusive options is approx. NOK 6.0 billion.
HEALTH, SAFETY AND ENVIRONMENT Farstad Shipping’s goal is to operate without injury to people, harm to the environment and damage to as-sets. The Company works actively to make employees aware of this goal. An important part of the HSE management is recor-ding, reporting and assessment of various HSE data. A number of measurement indicators have been establis-hed for this purpose. Further, this will document quanti-tative development over time, as well as strengthen the decision indicators for systematic improvements. Two of the measurement indicators the company utilizes are the lost time injury frequency (LTIF) and total recor-dable case frequency (TRCF). The company measures this as the number of injuries with absence per one mil-lion hours worked, measured 24 hours a day so that re-creational injuries are also included. The lost time injury frequency was 0.5 by the end of 4th quarter. Hence, the lost time injury frequency has improved compared to 2014 (0.73). The total recordable case frequency was 2.5 by the end of the year compared to 2.33 in 2014.
THE MARKETAccording to the International Energy Agency, oil companies have reduced their investments by 24% in 2015, and they expect an additional reduction of 17% in 2016. Reduced activity and cost reductions in the offshore industry have created major market challenges for our industry. In addition to this, our industry is characterized by oversupply of tonnage. The market challenges have resulted in an increasing number of offshore service vessels being laid up. Des-pite the fact that the contracting activity has stopped, there is still a significant number of offshore vessels on order.
There is still considerable uncertainty as to how long it will take before the offshore activity recovers. A po-sitive development in the oil price forms the basis for such a recovery.
DIVIDENDThe Board of Directors has decided to propose that no dividend will be paid for the fiscal year 2015 (NOK 3.00 per share for 2014). The Annual General Me-eting will be held on 12 May 2016.
FINANCIAL ADVISERS Despite the fact that liquid assets were NOK 1,636.9 at the beginning of 2016, the Company recognizes that given the prevailing market conditions, amend-ments to the current capital structure might be requi-red.
As a consequence, the Company has mandated Dan-ske Bank, DNB Markets and Nordea Markets as finan-cial advisers.
Aalesund 29 Februar 2016Board of Directors
9
QUARTERLY REPORT 4 - 2015 - farstad shipping asa
FA R S TA D S H I P P I N G A S A (NOK 1000) G R O U PP R E L I M I N A RY A C C O U N TS
PROFIT AND LOSS ACCOUNT
STATEMENT OF COMPREHENSIVE INCOME
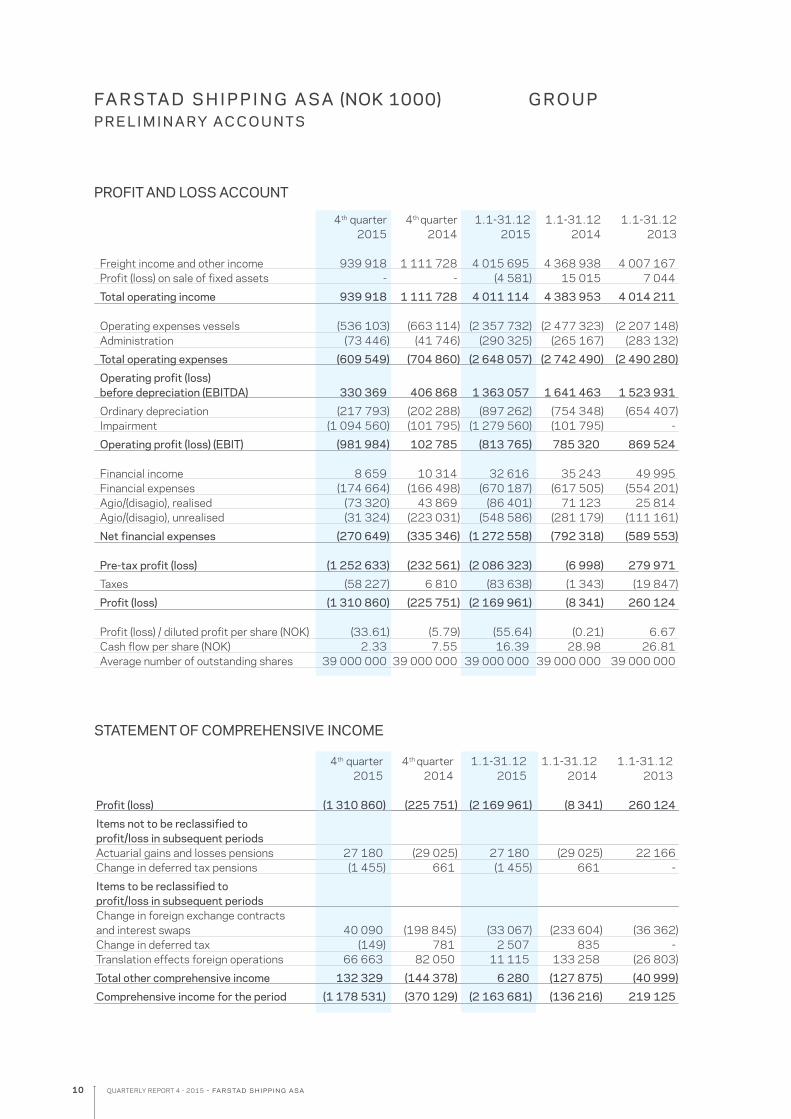
4th quarter 4th quarter 1.1-31.12 1.1-31.12 1.1-31.12 2015 2014 2015 2014 2013 Freight income and other income 939 918 1 111 728 4 015 695 4 368 938 4 007 167 Profit (loss) on sale of fixed assets - - (4 581) 15 015 7 044
Total operating income 939 918 1 111 728 4 011 114 4 383 953 4 014 211 Operating expenses vessels (536 103) (663 114) (2 357 732) (2 477 323) (2 207 148) Administration (73 446) (41 746) (290 325) (265 167) (283 132)
Total operating expenses (609 549) (704 860) (2 648 057) (2 742 490) (2 490 280)
Operating profit (loss) before depreciation (EBITDA) 330 369 406 868 1 363 057 1 641 463 1 523 931
Ordinary depreciation (217 793) (202 288) (897 262) (754 348) (654 407) Impairment (1 094 560) (101 795) (1 279 560) (101 795) -
Operating profit (loss) (EBIT) (981 984) 102 785 (813 765) 785 320 869 524 Financial income 8 659 10 314 32 616 35 243 49 995 Financial expenses (174 664) (166 498) (670 187) (617 505) (554 201) Agio/(disagio), realised (73 320) 43 869 (86 401) 71 123 25 814 Agio/(disagio), unrealised (31 324) (223 031) (548 586) (281 179) (111 161)
Net financial expenses (270 649) (335 346) (1 272 558) (792 318) (589 553) Pre-tax profit (loss) (1 252 633) (232 561) (2 086 323) (6 998) 279 971
Taxes (58 227) 6 810 (83 638) (1 343) (19 847)
Profit (loss) (1 310 860) (225 751) (2 169 961) (8 341) 260 124 Profit (loss) / diluted profit per share (NOK) (33.61) (5.79) (55.64) (0.21) 6.67 Cash flow per share (NOK) 2.33 7.55 16.39 28.98 26.81 Average number of outstanding shares 39 000 000 39 000 000 39 000 000 39 000 000 39 000 000
4th quarter 4th quarter 1.1-31.12 1.1-31.12 1.1-31.12 2015 2014 2015 2014 2013 Profit (loss) (1 310 860) (225 751) (2 169 961) (8 341) 260 124
Items not to be reclassified to profit/loss in subsequent periods Actuarial gains and losses pensions 27 180 (29 025) 27 180 (29 025) 22 166 Change in deferred tax pensions (1 455) 661 (1 455) 661 -
Items to be reclassified to profit/loss in subsequent periods Change in foreign exchange contracts and interest swaps 40 090 (198 845) (33 067) (233 604) (36 362) Change in deferred tax (149) 781 2 507 835 - Translation effects foreign operations 66 663 82 050 11 115 133 258 (26 803)
Total other comprehensive income 132 329 (144 378) 6 280 (127 875) (40 999)
Comprehensive income for the period (1 178 531) (370 129) (2 163 681) (136 216) 219 125
10
QUARTERLY REPORT 4 - 2015 - farstad shipping asa
FA R S TA D S H I P P I N G A S A (NOK 1000) G R O U PP R E L I M I N A RY A C C O U N TS
BALANCE SHEET
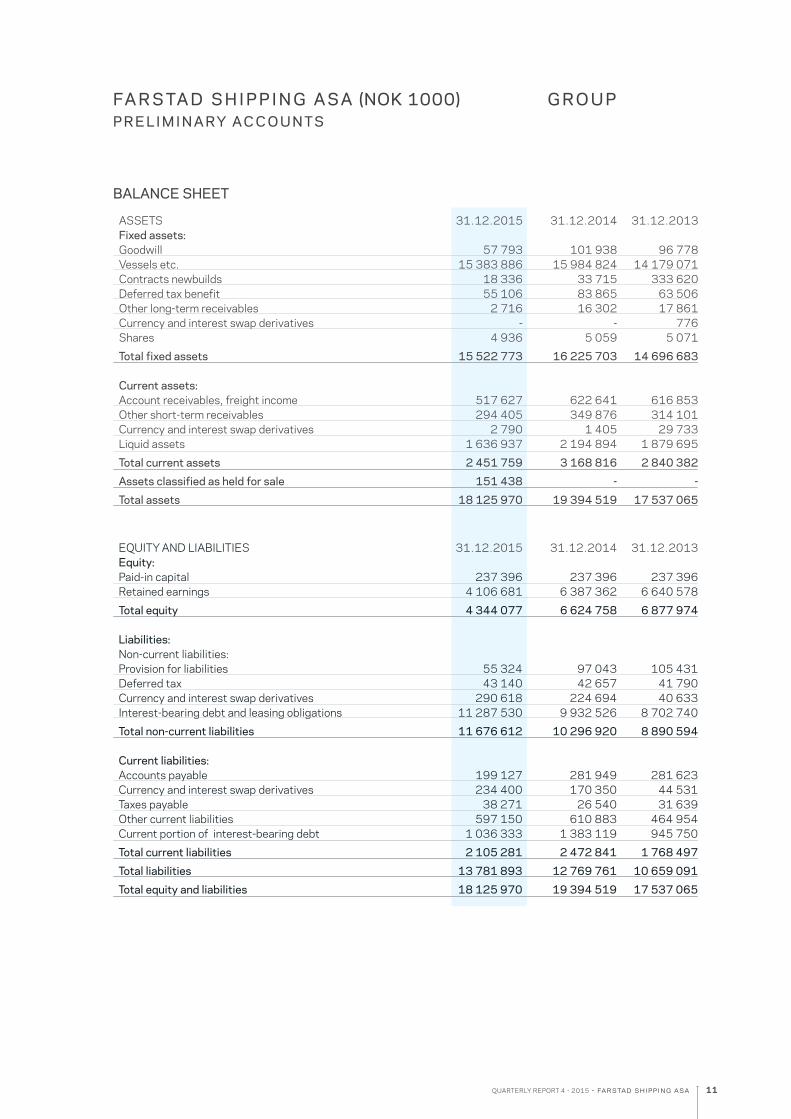
ASSETS 31.12.2015 31.12.2014 31.12.2013 Fixed assets: Goodwill 57 793 101 938 96 778 Vessels etc. 15 383 886 15 984 824 14 179 071 Contracts newbuilds 18 336 33 715 333 620 Deferred tax benefit 55 106 83 865 63 506 Other long-term receivables 2 716 16 302 17 861 Currency and interest swap derivatives - - 776 Shares 4 936 5 059 5 071
Total fixed assets 15 522 773 16 225 703 14 696 683 Current assets: Account receivables, freight income 517 627 622 641 616 853 Other short-term receivables 294 405 349 876 314 101 Currency and interest swap derivatives 2 790 1 405 29 733 Liquid assets 1 636 937 2 194 894 1 879 695
Total current assets 2 451 759 3 168 816 2 840 382
Assets classified as held for sale 151 438 - -
Total assets 18 125 970 19 394 519 17 537 065
EQUITY AND LIABILITIES 31.12.2015 31.12.2014 31.12.2013 Equity: Paid-in capital 237 396 237 396 237 396 Retained earnings 4 106 681 6 387 362 6 640 578
Total equity 4 344 077 6 624 758 6 877 974 Liabilities: Non-current liabilities: Provision for liabilities 55 324 97 043 105 431 Deferred tax 43 140 42 657 41 790 Currency and interest swap derivatives 290 618 224 694 40 633 Interest-bearing debt and leasing obligations 11 287 530 9 932 526 8 702 740
Total non-current liabilities 11 676 612 10 296 920 8 890 594 Current liabilities: Accounts payable 199 127 281 949 281 623 Currency and interest swap derivatives 234 400 170 350 44 531 Taxes payable 38 271 26 540 31 639 Other current liabilities 597 150 610 883 464 954 Current portion of interest-bearing debt 1 036 333 1 383 119 945 750
Total current liabilities 2 105 281 2 472 841 1 768 497
Total liabilities 13 781 893 12 769 761 10 659 091
Total equity and liabilities 18 125 970 19 394 519 17 537 065
11
QUARTERLY REPORT 4 - 2015 - farstad shipping asa
FA R S TA D S H I P P I N G A S A (NOK 1000) G R O U PP R E L I M I N A RY A C C O U N TS
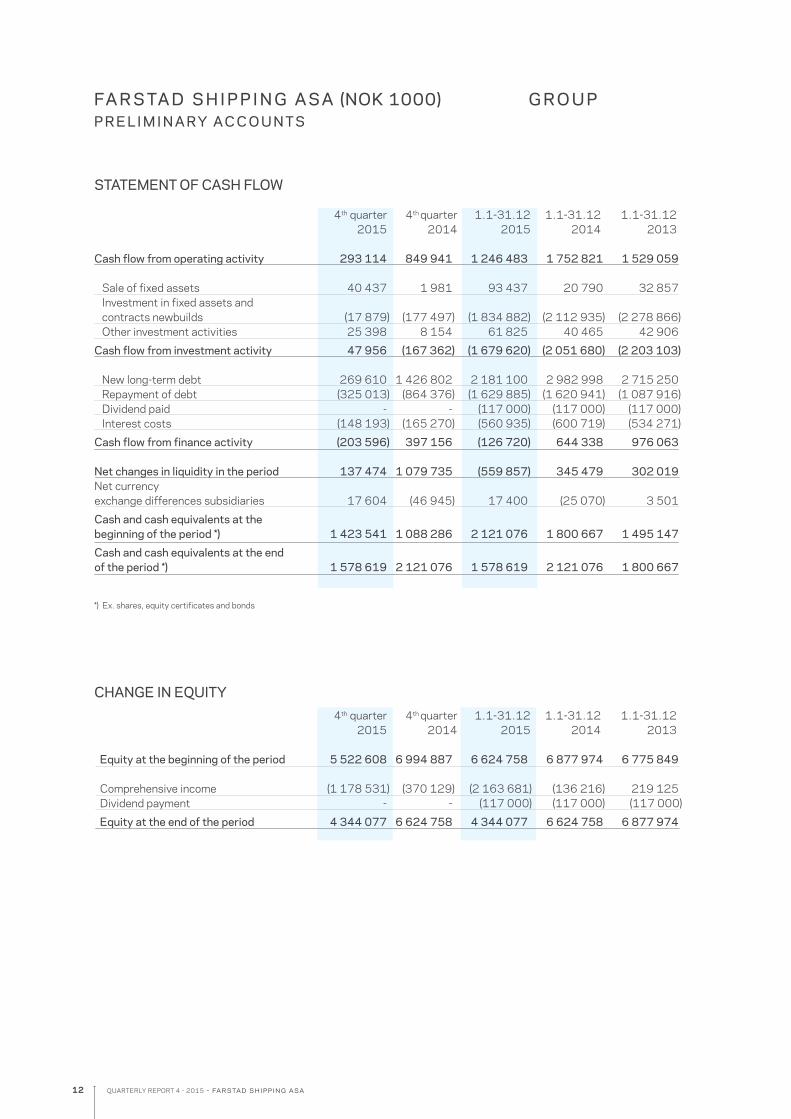
STATEMENT OF CASH FLOW 4th quarter 4th quarter 1.1-31.12 1.1-31.12 1.1-31.12 2015 2014 2015 2014 2013 Cash flow from operating activity 293 114 849 941 1 246 483 1 752 821 1 529 059 Sale of fixed assets 40 437 1 981 93 437 20 790 32 857 Investment in fixed assets and contracts newbuilds (17 879) (177 497) (1 834 882) (2 112 935) (2 278 866) Other investment activities 25 398 8 154 61 825 40 465 42 906
Cash flow from investment activity 47 956 (167 362) (1 679 620) (2 051 680) (2 203 103) New long-term debt 269 610 1 426 802 2 181 100 2 982 998 2 715 250 Repayment of debt (325 013) (864 376) (1 629 885) (1 620 941) (1 087 916) Dividend paid - - (117 000) (117 000) (117 000) Interest costs (148 193) (165 270) (560 935) (600 719) (534 271)
Cash flow from finance activity (203 596) 397 156 (126 720) 644 338 976 063 Net changes in liquidity in the period 137 474 1 079 735 (559 857) 345 479 302 019Net currency exchange differences subsidiaries 17 604 (46 945) 17 400 (25 070) 3 501
Cash and cash equivalents at the beginning of the period *) 1 423 541 1 088 286 2 121 076 1 800 667 1 495 147
Cash and cash equivalents at the endof the period *) 1 578 619 2 121 076 1 578 619 2 121 076 1 800 667
*) Ex. shares, equity certificates and bonds
CHANGE IN EQUITY 4th quarter 4th quarter 1.1-31.12 1.1-31.12 1.1-31.12 2015 2014 2015 2014 2013
Equity at the beginning of the period 5 522 608 6 994 887 6 624 758 6 877 974 6 775 849
Comprehensive income (1 178 531) (370 129) (2 163 681) (136 216) 219 125 Dividend payment - - (117 000) (117 000) (117 000)
Equity at the end of the period 4 344 077 6 624 758 4 344 077 6 624 758 6 877 974
12
QUARTERLY REPORT 4 - 2015 - farstad shipping asa
N OT E S TO T H E I N T E R I M R E P O RT (NOK 1000) G R O U PP R E L I M I N A RY A C C O U N TS
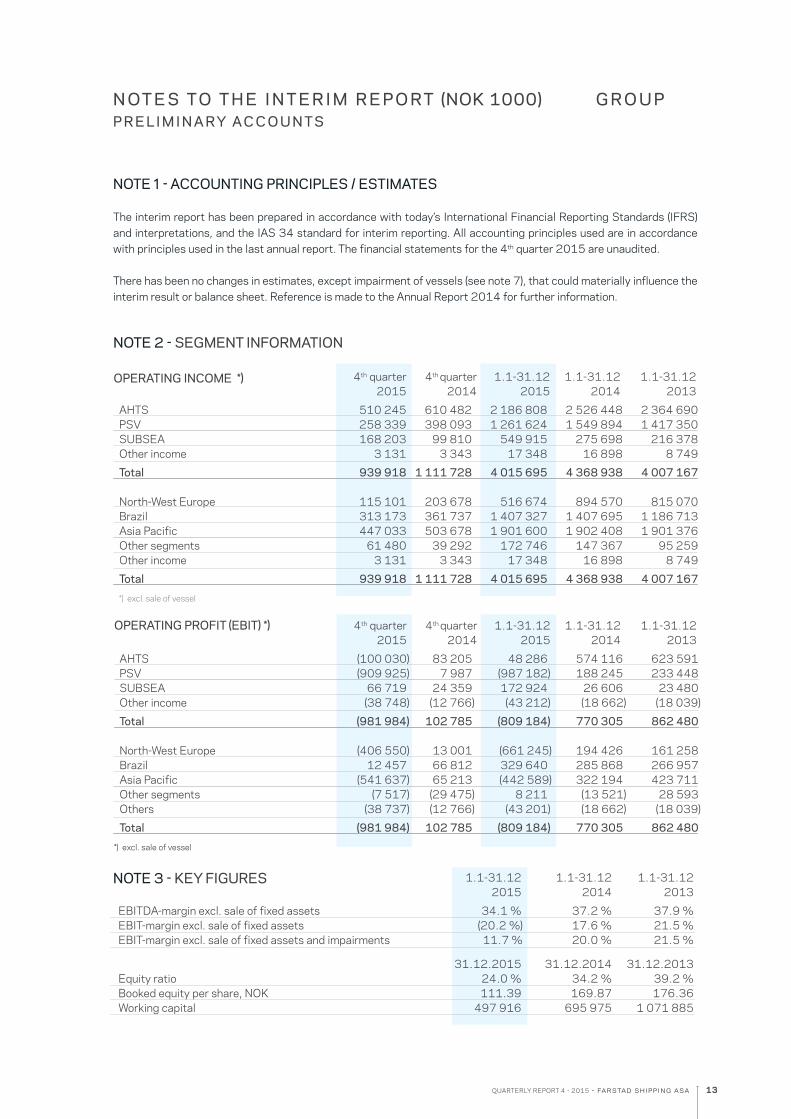
NOTE 1 - ACCOUNTING PRINCIPLES / ESTIMATES The interim report has been prepared in accordance with today’s International Financial Reporting Standards (IFRS) and interpretations, and the IAS 34 standard for interim reporting. All accounting principles used are in accordance with principles used in the last annual report. The financial statements for the 4th quarter 2015 are unaudited. There has been no changes in estimates, except impairment of vessels (see note 7), that could materially influence the interim result or balance sheet. Reference is made to the Annual Report 2014 for further information.
NOTE 3 - KEY FIGURES 1.1-31.12 1.1-31.12 1.1-31.12 2015 2014 2013
EBITDA-margin excl. sale of fixed assets 34.1 % 37.2 % 37.9 % EBIT-margin excl. sale of fixed assets (20.2 %) 17.6 % 21.5 % EBIT-margin excl. sale of fixed assets and impairments 11.7 % 20.0 % 21.5 %
31.12.2015 31.12.2014 31.12.2013 Equity ratio 24.0 % 34.2 % 39.2 % Booked equity per share, NOK 111.39 169.87 176.36 Working capital 497 916 695 975 1 071 885
NOTE 2 - SEGMENT INFORMATION
OPERATING INCOME *) 4th quarter 4th quarter 1.1-31.12 1.1-31.12 1.1-31.12 2015 2014 2015 2014 2013
AHTS 510 245 610 482 2 186 808 2 526 448 2 364 690 PSV 258 339 398 093 1 261 624 1 549 894 1 417 350 SUBSEA 168 203 99 810 549 915 275 698 216 378 Other income 3 131 3 343 17 348 16 898 8 749
Total 939 918 1 111 728 4 015 695 4 368 938 4 007 167 North-West Europe 115 101 203 678 516 674 894 570 815 070 Brazil 313 173 361 737 1 407 327 1 407 695 1 186 713 Asia Pacific 447 033 503 678 1 901 600 1 902 408 1 901 376 Other segments 61 480 39 292 172 746 147 367 95 259 Other income 3 131 3 343 17 348 16 898 8 749
Total 939 918 1 111 728 4 015 695 4 368 938 4 007 167
*) excl. sale of vessel
OPERATING PROFIT (EBIT) *) 4th quarter 4th quarter 1.1-31.12 1.1-31.12 1.1-31.12 2015 2014 2015 2014 2013
AHTS (100 030) 83 205 48 286 574 116 623 591 PSV (909 925) 7 987 (987 182) 188 245 233 448 SUBSEA 66 719 24 359 172 924 26 606 23 480 Other income (38 748) (12 766) (43 212) (18 662) (18 039)
Total (981 984) 102 785 (809 184) 770 305 862 480 North-West Europe (406 550) 13 001 (661 245) 194 426 161 258 Brazil 12 457 66 812 329 640 285 868 266 957 Asia Pacific (541 637) 65 213 (442 589) 322 194 423 711 Other segments (7 517) (29 475) 8 211 (13 521) 28 593 Others (38 737) (12 766) (43 201) (18 662) (18 039)
Total (981 984) 102 785 (809 184) 770 305 862 480
*) excl. sale of vessel
13
QUARTERLY REPORT 4 - 2015 - farstad shipping asa
N OT E S TO T H E I N T E R I M R E P O RT (NOK 1000) G R O U PP R E L I M I N A RY A C C O U N TS
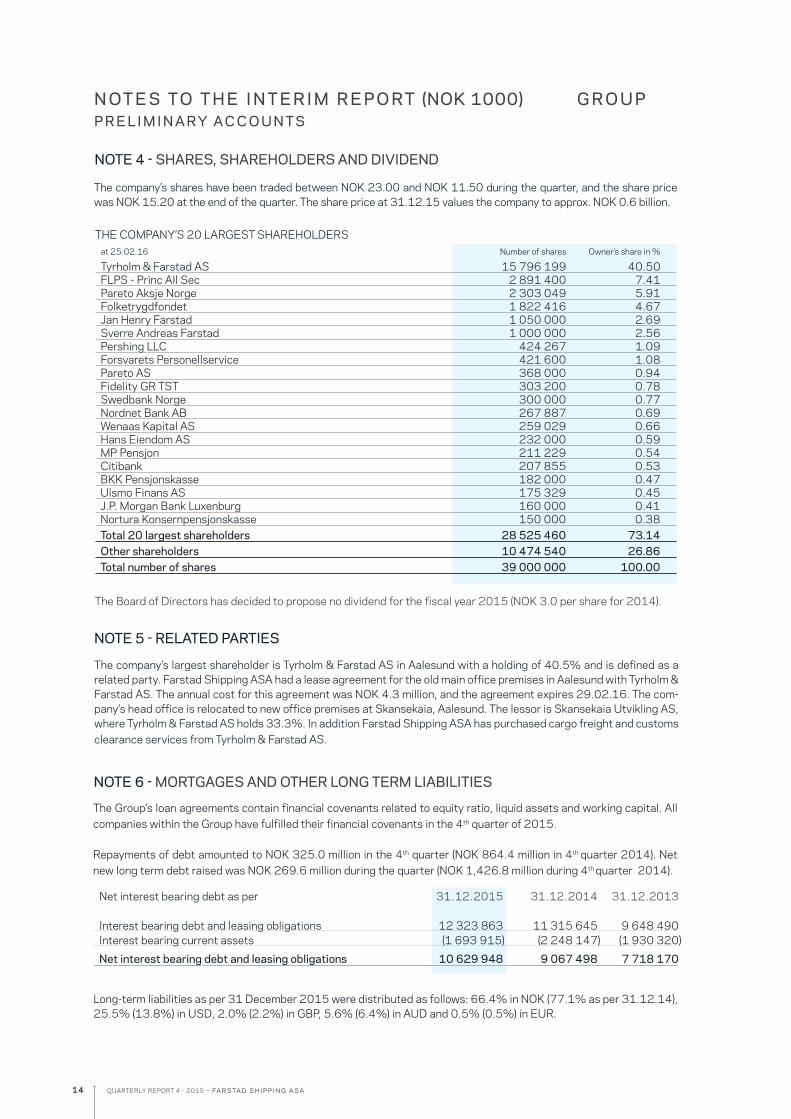
The company’s shares have been traded between NOK 23.00 and NOK 11.50 during the quarter, and the share price was NOK 15.20 at the end of the quarter. The share price at 31.12.15 values the company to approx. NOK 0.6 billion.
The Group’s loan agreements contain financial covenants related to equity ratio, liquid assets and working capital. All companies within the Group have fulfilled their financial covenants in the 4th quarter of 2015. Repayments of debt amounted to NOK 325.0 million in the 4th quarter (NOK 864.4 million in 4th quarter 2014). Net new long term debt raised was NOK 269.6 million during the quarter (NOK 1,426.8 million during 4th quarter 2014).
NOTE 4 - SHARES, SHAREHOLDERS AND DIVIDEND
NOTE 6 - MORTGAGES AND OTHER LONG TERM LIABILITIES
Long-term liabilities as per 31 December 2015 were distributed as follows: 66.4% in NOK (77.1% as per 31.12.14), 25.5% (13.8%) in USD, 2.0% (2.2%) in GBP, 5.6% (6.4%) in AUD and 0.5% (0.5%) in EUR.
Net interest bearing debt as per 31.12.2015 31.12.2014 31.12.2013 Interest bearing debt and leasing obligations 12 323 863 11 315 645 9 648 490 Interest bearing current assets (1 693 915) (2 248 147) (1 930 320)
Net interest bearing debt and leasing obligations 10 629 948 9 067 498 7 718 170
The company’s largest shareholder is Tyrholm & Farstad AS in Aalesund with a holding of 40.5% and is defined as a related party. Farstad Shipping ASA had a lease agreement for the old main office premises in Aalesund with Tyrholm & Farstad AS. The annual cost for this agreement was NOK 4.3 million, and the agreement expires 29.02.16. The com-pany’s head office is relocated to new office premises at Skansekaia, Aalesund. The lessor is Skansekaia Utvikling AS, where Tyrholm & Farstad AS holds 33.3%. In addition Farstad Shipping ASA has purchased cargo freight and customs clearance services from Tyrholm & Farstad AS.
NOTE 5 - RELATED PARTIES
THE COMPANY’S 20 LARGEST SHAREHOLDERS at 25.02.16 Number of shares Owner’s share in %
Tyrholm & Farstad AS 15 796 199 40.50 FLPS - Princ All Sec 2 891 400 7.41 Pareto Aksje Norge 2 303 049 5.91 Folketrygdfondet 1 822 416 4.67 Jan Henry Farstad 1 050 000 2.69 Sverre Andreas Farstad 1 000 000 2.56 Pershing LLC 424 267 1.09 Forsvarets Personellservice 421 600 1.08 Pareto AS 368 000 0.94 Fidelity GR TST 303 200 0.78 Swedbank Norge 300 000 0.77 Nordnet Bank AB 267 887 0.69 Wenaas Kapital AS 259 029 0.66 Hans Eiendom AS 232 000 0.59 MP Pensjon 211 229 0.54 Citibank 207 855 0.53 BKK Pensjonskasse 182 000 0.47 Ulsmo Finans AS 175 329 0.45 J.P. Morgan Bank Luxenburg 160 000 0.41 Nortura Konsernpensjonskasse 150 000 0.38 Total 20 largest shareholders 28 525 460 73.14 Other shareholders 10 474 540 26.86 Total number of shares 39 000 000 100.00
The Board of Directors has decided to propose no dividend for the fiscal year 2015 (NOK 3.0 per share for 2014).
14
QUARTERLY REPORT 4 - 2015 - farstad shipping asa
N OT E S TO T H E I N T E R I M R E P O RT (NOK 1000) G R O U PP R E L I M I N A RY A C C O U N TS
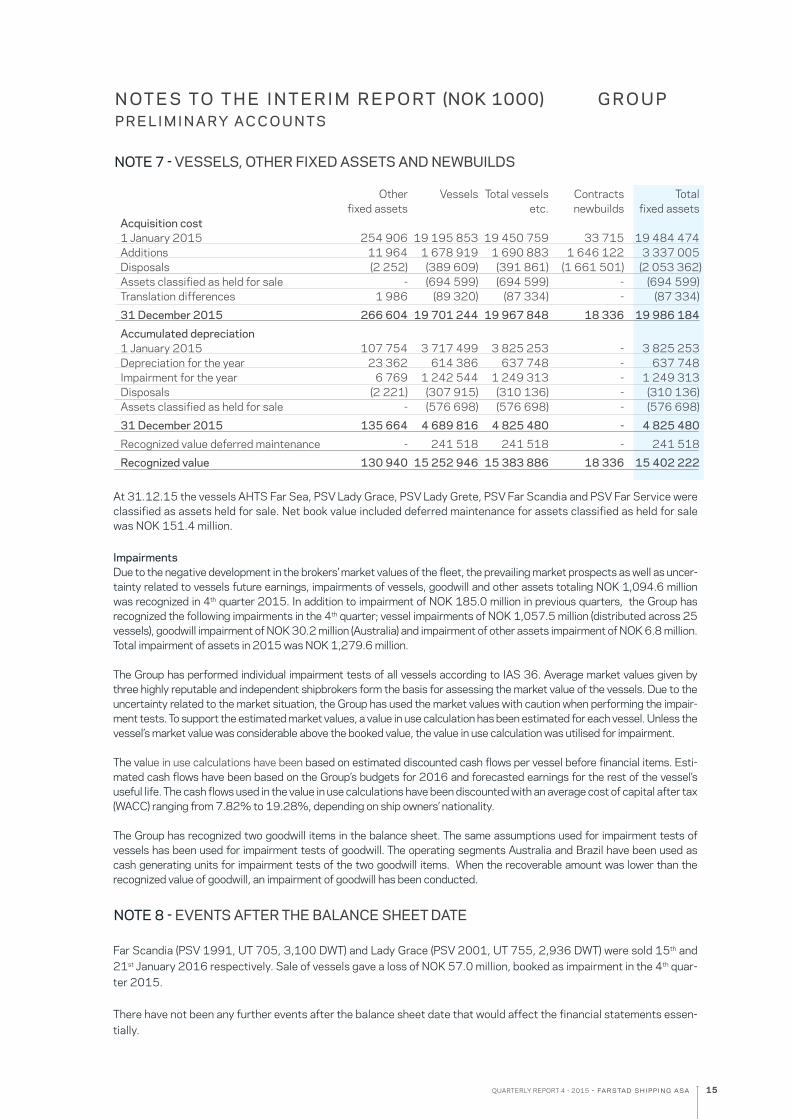
Far Scandia (PSV 1991, UT 705, 3,100 DWT) and Lady Grace (PSV 2001, UT 755, 2,936 DWT) were sold 15th and 21st January 2016 respectively. Sale of vessels gave a loss of NOK 57.0 million, booked as impairment in the 4th quar-ter 2015. There have not been any further events after the balance sheet date that would affect the financial statements essen-tially.
NOTE 8 - EVENTS AFTER THE BALANCE SHEET DATE
NOTE 7 - VESSELS, OTHER FIXED ASSETS AND NEWBUILDS
Other Vessels Total vessels Contracts Total fixed assets etc. newbuilds fixed assets Acquisition cost 1 January 2015 254 906 19 195 853 19 450 759 33 715 19 484 474 Additions 11 964 1 678 919 1 690 883 1 646 122 3 337 005 Disposals (2 252) (389 609) (391 861) (1 661 501) (2 053 362) Assets classified as held for sale - (694 599) (694 599) - (694 599) Translation differences 1 986 (89 320) (87 334) - (87 334)
31 December 2015 266 604 19 701 244 19 967 848 18 336 19 986 184
Accumulated depreciation 1 January 2015 107 754 3 717 499 3 825 253 - 3 825 253 Depreciation for the year 23 362 614 386 637 748 - 637 748 Impairment for the year 6 769 1 242 544 1 249 313 - 1 249 313 Disposals (2 221) (307 915) (310 136) - (310 136) Assets classified as held for sale - (576 698) (576 698) - (576 698)
31 December 2015 135 664 4 689 816 4 825 480 - 4 825 480
Recognized value deferred maintenance - 241 518 241 518 - 241 518
Recognized value 130 940 15 252 946 15 383 886 18 336 15 402 222
At 31.12.15 the vessels AHTS Far Sea, PSV Lady Grace, PSV Lady Grete, PSV Far Scandia and PSV Far Service were classified as assets held for sale. Net book value included deferred maintenance for assets classified as held for sale was NOK 151.4 million. ImpairmentsDue to the negative development in the brokers’ market values of the fleet, the prevailing market prospects as well as uncer-tainty related to vessels future earnings, impairments of vessels, goodwill and other assets totaling NOK 1,094.6 million was recognized in 4th quarter 2015. In addition to impairment of NOK 185.0 million in previous quarters, the Group has recognized the following impairments in the 4th quarter; vessel impairments of NOK 1,057.5 million (distributed across 25 vessels), goodwill impairment of NOK 30.2 million (Australia) and impairment of other assets impairment of NOK 6.8 million. Total impairment of assets in 2015 was NOK 1,279.6 million. The Group has performed individual impairment tests of all vessels according to IAS 36. Average market values given by three highly reputable and independent shipbrokers form the basis for assessing the market value of the vessels. Due to the uncertainty related to the market situation, the Group has used the market values with caution when performing the impair-ment tests. To support the estimated market values, a value in use calculation has been estimated for each vessel. Unless the vessel’s market value was considerable above the booked value, the value in use calculation was utilised for impairment.
The value in use calculations have been based on estimated discounted cash flows per vessel before financial items. Esti-mated cash flows have been based on the Group’s budgets for 2016 and forecasted earnings for the rest of the vessel’s useful life. The cash flows used in the value in use calculations have been discounted with an average cost of capital after tax (WACC) ranging from 7.82% to 19.28%, depending on ship owners’ nationality.
The Group has recognized two goodwill items in the balance sheet. The same assumptions used for impairment tests of vessels has been used for impairment tests of goodwill. The operating segments Australia and Brazil have been used as cash generating units for impairment tests of the two goodwill items. When the recoverable amount was lower than the recognized value of goodwill, an impairment of goodwill has been conducted.
15
Far Sirius
Far Shogun
Far Sapphire
Far Sword
Far Saltire Far Senior
Far Sigma
Far Sagaris
Far Sound
BOS Turmalina
Lady Sandra
Far Statesman
Far Scorpion
BOS Turquesa
BOS Topàzio
Far Scout
Far Sailor
Far Senator
Far Scimitar
Far Strait
Lady Astrid
Far Santana
Far Fosna
Far Saracen
Far Sabre
Far Stream
Lady Caroline
Far Sovereign
Far Grip Far Sea
QUARTERLY REPORT 4 - 2015 - farstad shipping asa
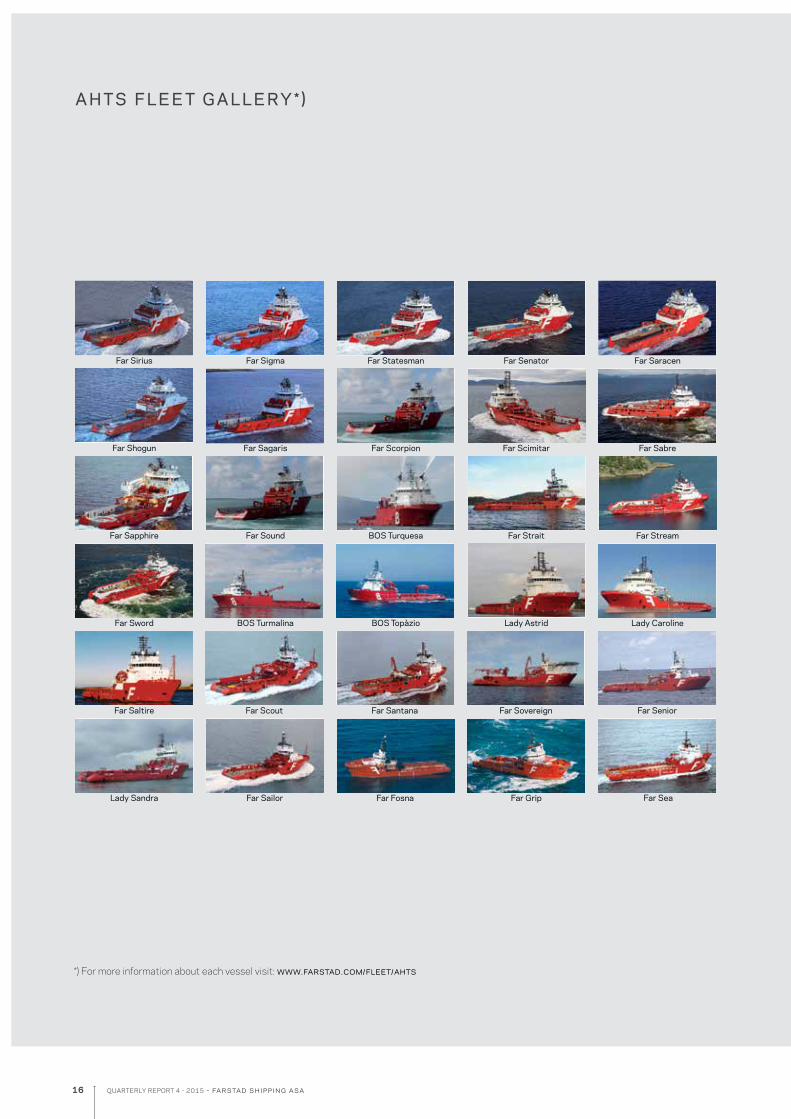
A H TS F L E E T G A L L E RY * )
*) For more information about each vessel visit: www.farstad.com/fleet/ahts
16
2016 2017 2018 2019 2020
QUARTERLY REPORT 4 - 2015 - farstad shipping asa
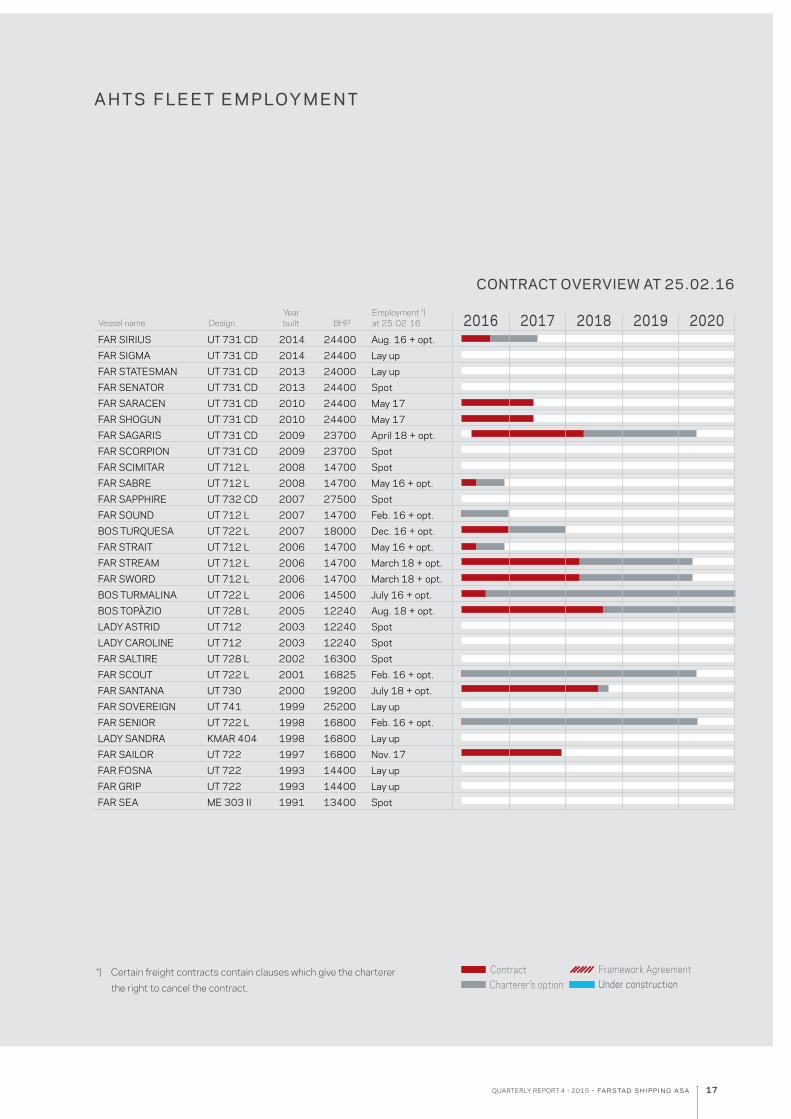
A H TS F L E E T E M P LOY M E N T
*) Certain freight contracts contain clauses which give the charterer the right to cancel the contract.
Contract Framework AgreementCharterer’s option Under construction
CONTRACT OVERVIEW AT 25.02.16
YearbuiltDesign BHP
Employment *) at 25.02.16 Vessel name
FAR SIRIUS UT 731 CD 2014 24400 Aug. 16 + opt.FAR SIGMA UT 731 CD 2014 24400 Lay upFAR STATESMAN UT 731 CD 2013 24000 Lay upFAR SENATOR UT 731 CD 2013 24400 SpotFAR SARACEN UT 731 CD 2010 24400 May 17FAR SHOGUN UT 731 CD 2010 24400 May 17FAR SAGARIS UT 731 CD 2009 23700 April 18 + opt.FAR SCORPION UT 731 CD 2009 23700 SpotFAR SCIMITAR UT 712 L 2008 14700 SpotFAR SABRE UT 712 L 2008 14700 May 16 + opt.FAR SAPPHIRE UT 732 CD 2007 27500 SpotFAR SOUND UT 712 L 2007 14700 Feb. 16 + opt.BOS TURQUESA UT 722 L 2007 18000 Dec. 16 + opt.FAR STRAIT UT 712 L 2006 14700 May 16 + opt. FAR STREAM UT 712 L 2006 14700 March 18 + opt.FAR SWORD UT 712 L 2006 14700 March 18 + opt.BOS TURMALINA UT 722 L 2006 14500 July 16 + opt.BOS TOPÀZIO UT 728 L 2005 12240 Aug. 18 + opt.LADY ASTRID UT 712 2003 12240 SpotLADY CAROLINE UT 712 2003 12240 SpotFAR SALTIRE UT 728 L 2002 16300 SpotFAR SCOUT UT 722 L 2001 16825 Feb. 16 + opt.FAR SANTANA UT 730 2000 19200 July 18 + opt.FAR SOVEREIGN UT 741 1999 25200 Lay up FAR SENIOR UT 722 L 1998 16800 Feb. 16 + opt.LADY SANDRA KMAR 404 1998 16800 Lay upFAR SAILOR UT 722 1997 16800 Nov. 17FAR FOSNA UT 722 1993 14400 Lay upFAR GRIP UT 722 1993 14400 Lay upFAR SEA ME 303 II 1991 13400 Spot
17
Far Sentinel Far Superior tbn Far Sleipner Far SwiftFar Samson
Far Saga Far Scotia
Far Sygna
Far Solitaire
Far Searcher
Far Symphony Far Star
Far Sun
Far Skimmer
Far Seeker
Far Supplier
Far Starling
Far Scotsman
Far Spirit
Lady Melinda
Far Strider
Far Sitella
Far Server
Far Swan
Lady Grete
Far Supporter
Far Spica
Far Serenade
Far Splendour
Far Service
QUARTERLY REPORT 4 - 2015 - farstad shipping asa
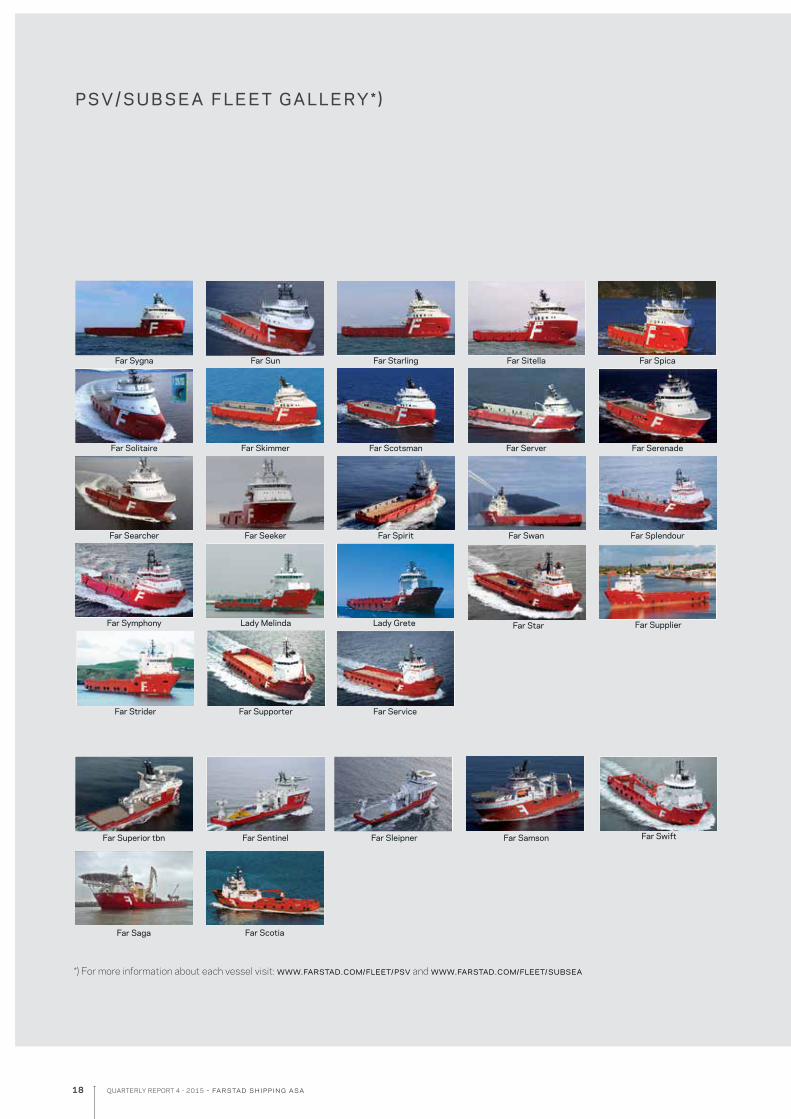
P S V / S U B S E A F L E E T G A L L E RY * )
*) For more information about each vessel visit: www.farstad.com/fleet/psv and www.farstad.com/fleet/subsea
18
2017 2018 2019 2020
20202016 2017 2018 2019
2016
QUARTERLY REPORT 4 - 2015 - farstad shipping asa
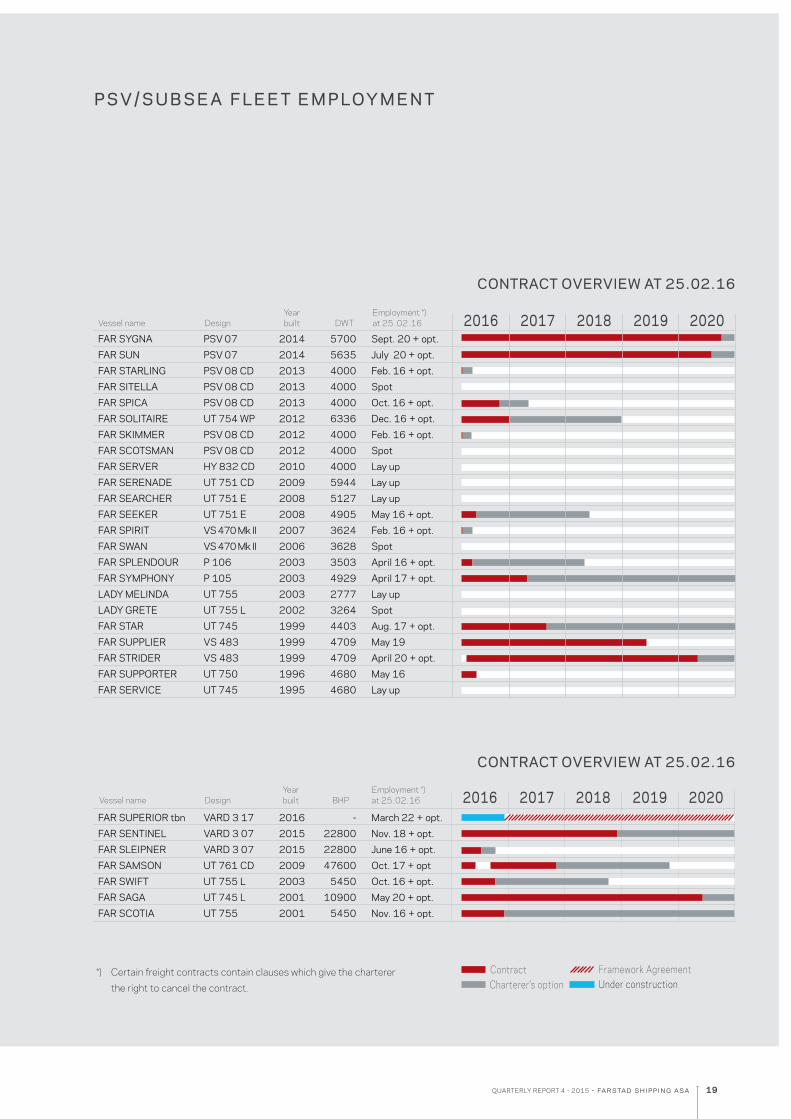
*) Certain freight contracts contain clauses which give the charterer the right to cancel the contract.
Contract
P S V / S U B S E A F L E E T E M P LOY M E N T
FAR SYGNA PSV 07 2014 5700 Sept. 20 + opt.FAR SUN PSV 07 2014 5635 July 20 + opt.FAR STARLING PSV 08 CD 2013 4000 Feb. 16 + opt.FAR SITELLA PSV 08 CD 2013 4000 SpotFAR SPICA PSV 08 CD 2013 4000 Oct. 16 + opt.FAR SOLITAIRE UT 754 WP 2012 6336 Dec. 16 + opt.FAR SKIMMER PSV 08 CD 2012 4000 Feb. 16 + opt.FAR SCOTSMAN PSV 08 CD 2012 4000 SpotFAR SERVER HY 832 CD 2010 4000 Lay upFAR SERENADE UT 751 CD 2009 5944 Lay upFAR SEARCHER UT 751 E 2008 5127 Lay upFAR SEEKER UT 751 E 2008 4905 May 16 + opt. FAR SPIRIT VS 470 Mk II 2007 3624 Feb. 16 + opt.FAR SWAN VS 470 Mk II 2006 3628 SpotFAR SPLENDOUR P 106 2003 3503 April 16 + opt. FAR SYMPHONY P 105 2003 4929 April 17 + opt. LADY MELINDA UT 755 2003 2777 Lay upLADY GRETE UT 755 L 2002 3264 SpotFAR STAR UT 745 1999 4403 Aug. 17 + opt.FAR SUPPLIER VS 483 1999 4709 May 19FAR STRIDER VS 483 1999 4709 April 20 + opt.FAR SUPPORTER UT 750 1996 4680 May 16FAR SERVICE UT 745 1995 4680 Lay up
FAR SUPERIOR tbn VARD 3 17 2016 - March 22 + opt.FAR SENTINEL VARD 3 07 2015 22800 Nov. 18 + opt.FAR SLEIPNER VARD 3 07 2015 22800 June 16 + opt.FAR SAMSON UT 761 CD 2009 47600 Oct. 17 + optFAR SWIFT UT 755 L 2003 5450 Oct. 16 + opt.FAR SAGA UT 745 L 2001 10900 May 20 + opt.FAR SCOTIA UT 755 2001 5450 Nov. 16 + opt.
CONTRACT OVERVIEW AT 25.02.16
CONTRACT OVERVIEW AT 25.02.16
Yearbuilt Design DWT
Employment *) at 25 .02.16 Vessel name
YearbuiltDesign BHPVessel name
Framework AgreementCharterer’s option Under construction
Employment *) at 25.02.16
19
www.farstad.com
FARSTAD SHIPPING ASAPO. Box 1301 Sentrum, 6001 Aalesund, NorwayTel: +47 70 11 75 00, e-mail: [email protected] FARSTAD SHIPPING (INDIAN PACIFIC) PTY. LTD.Melbourne:GPO Box 5111, Melbourne, Victoria, 3001 AustraliaTel: +61 3 9685 1500, e-mail: [email protected]
Perth:PO Box 3169 East Perth, WA, 6892 AustraliaTel: +61 (08) 9325 9333, e-mail: [email protected]
FARSTAD SHIPPING OFFSHORE SIMULATION CENTRE PTY. LTD.PO Box 1375 Bibra Lake DC, Bibra Lake WA 6965 Perth AustraliaTel: +61 (08) 9494 5600, e-mail: [email protected] FARSTAD SHIPPING PTE. LTD.78 Shenton Way, #19-02, Singapore 079120Tel: +65 6240 4500, e-mail: [email protected] FARSTAD SHIPPING LTDA.Macaé:Rua Abilio Moreira de Miranda, 606 Parque Valentina Miranda, Macaé, RJ CEP 27915-250, BrazilTel: +55 22 2105 1900, e-mail: [email protected]
Rio de Janeiro:Av. Rio Branco, 01 - Sala 1509 - Centro CEP 20.090-003, Rio de Janeiro - RJ, Brazil Tel: +55 21 2138 2000, e-mail: [email protected]