Embed Size (px)
Citation preview
Failures and successes of quantitative methods inmanagementCitation for published version (APA):Tilanus, C. B. (1983). Failures and successes of quantitative methods in management. (TH Eindhoven.THE/BDK/ORS, Vakgroep ORS : rapporten; Vol. 8306). Eindhoven: Technische Hogeschool Eindhoven.
Document status and date:Published: 01/01/1983
Document Version:Publisher’s PDF, also known as Version of Record (includes final page, issue and volume numbers)
Please check the document version of this publication:
• A submitted manuscript is the version of the article upon submission and before peer-review. There can beimportant differences between the submitted version and the official published version of record. Peopleinterested in the research are advised to contact the author for the final version of the publication, or visit theDOI to the publisher's website.• The final author version and the galley proof are versions of the publication after peer review.• The final published version features the final layout of the paper including the volume, issue and pagenumbers.Link to publication
General rightsCopyright and moral rights for the publications made accessible in the public portal are retained by the authors and/or other copyright ownersand it is a condition of accessing publications that users recognise and abide by the legal requirements associated with these rights.
• Users may download and print one copy of any publication from the public portal for the purpose of private study or research. • You may not further distribute the material or use it for any profit-making activity or commercial gain • You may freely distribute the URL identifying the publication in the public portal.
If the publication is distributed under the terms of Article 25fa of the Dutch Copyright Act, indicated by the “Taverne” license above, pleasefollow below link for the End User Agreement:www.tue.nl/taverne
Take down policyIf you believe that this document breaches copyright please contact us at:[email protected] details and we will investigate your claim.
Download date: 22. Apr. 2020
BtBLIOTHEEK
T.H.EtNDHOVEN
FAILURES AND SUCCESSES OF QUANTITATIVE
METHODS IN MANAGEMENT
by
C.B. Tilanus
Report ARW 03 THE BDK/ORS/83/06
Paper presented at:
-ORSA/TIMS Joint National Meeting,
San Diego, 25-27 October 1982;
-Operational Research Society of
India, Fifteenth Annual Convention,
Kharagpur, 9-11 December 1982;
-Netherlands Society of Statistics
and Operations Research, Annual
Conference, Eindhoven. 31 March
1983.
Preliminary and confidential
Eindhoven University of Technology
Postbox 513
5600 MB Eindhoven
Netherlands
August 1983

Failures and successes of quantitative methods in management
by C.B. Tilanus
Eindhoven University of Technology, Eindhoven, Netherlands
Abstract
About 60 cases of both failures and successes of quantitative methods
in management, collected in industry, business and government in the
Netherlands, are analyzed for features determining either their
failure or their success.
Contents
I. Introduction
2. 36 case studies of failures and succe~ses
3. Biases in the sample?
4. Reasons for failures and successes
5. Summary and conclusions
References
3
5
8
I I
12

- I _
1. Introduction
Soon after the origins of OR/ME, when the literature about the subject
began to grow, a sort of hate-love relationship arose between the
literature and the real world. Much of the ado in the literature never
penetrates into the real world - it is not useful. Much business in the
real world never penetrates into the literature - it has too little
news value (mathematicians call this trivial),or too much, for the com
petition. On the other hand, the literature and the real world need each
other, because OR/MS is an applied science. The area of interpenetration
should be handled with care,to keep OR/ME up in the air. It is represented
by the shaded area of figure 1, which I call the diabolo model of the
literature and the real world.
literature real world
Figure 1. Diabolo model of the literature and the real world of OR/MS.
A paper in 1965 by Churchman and Schainblatt [5J triggered off a
branch of literature, which concerns itself with the interpenetration of
the literature and the real world. It is called implementation research.
Many authors write about a gap [e.g., 21], which may be caused by a time
lag or, unfortunately, by repulsion [36J.

- 2 -
At least three books have been devoted to implementation research
[7, 14, 33]; the European Working Group on "Methodology of OR" is much
involved with implementation [16, 23]; Schultz and Slevin [34] started a
column on "Implementation Exchange" in Interfaces. Wysocki [41J describes
a bibliography of 276 publications in 1979, which is progressing at an
increasing speed. Milutinovich and Meli [26J review 350 publications.
Implementation research can either take the literature as its object
[4, 24, 25, 30J, or the real world. An indirect view is taken by the
review articles of implementation research, the surveys of the surveys,
so to speak [13, 26, 41].
Implementation studies dealing with the real world may be based on
a) experience,
b) questionnaires,
c) interviews,
d) case studies.
Ad a. Authors' own subjective experience is a perfectly legitimate
basis for empirical studies, provided the author is an expert and an
authority. Much of the vast Interfaces literature on implementation is
based on experience [3, 6, 9, 10, 22, 29, 31], but also scientifically more
prestigous publications accept subjective papers based on experience [5, 7,
12, 27]. Of course, some authors speculate about more exotic paradigms,
like transactional analysis [20], Zen [28]oranthroposophy [8J.
Ad b. Questionnaires are often mailed, especially by Americans, to either
members of OR/MS societies or firms, e.g. [19]. The problem with mail surveys,
though, is probable biases of the results due to low response rates, e.g.,
31%UJ, 24% [11],35% [17],33% [35],37% [39J.
Ad c. Interviews usually have much higher flresponse rates" and allow
a more in-depth analysis and testing of hypotheses, e.g. [2, IS, 37, 40].
Ad d. Case studies allow perhaps still more penetrating analysis of
implementation problems, although their statistical significance varies.
Lockett and Polding [18] analyze three case studies, Roberts [32J four,
Alter 56 and Bean and Radnor 43, both in [7].
This paper is based on 58 cases [38]. The order of presentation is as
follows. First the collection of 36 case studies,containing the 58 cases,
is described (section 2); next the question of biases in the samples of the
caSes and of the reasons for failures or successes is discussed (section 3);
then the results are presented (section 4). Section 5 consists of a summary
and conclusions.

- 3 -
2. 36 case studies of failures and successes
The original object of collecting between thirty and forty case studies
in industry, business and government was not to do implementation research
but to celebrate the 25th anniversary of the Netherlands Society of
Operations Research (NSOR). The collection of 36 case studies was publis
hed in a popular Dutch paperback edition and is translated by B.A. Knoppers
for an English edition by Wiley [38J.
363 members of NSOR (98% of the personal membership) plus 50 Flamish
speaking members of the Belgian Society for the Application of Scientific
Methods in Management (SOGESCr/BVWB) were invited by telephone to write
a contribution. This cascaded into 200 statements of interest, 70 promises
and 36 actual papers, 34 of which are Dutch and 2 Belgian.
The instructions to authors were rather rigourous. We wanted concise,
well-readable, non-technical contributions of less than 3000 words (the
most severe constraint). Each contribution should introduce the OR activi
ties at the author's firm/institution and describe two cases, one of which
should be a failure, the other a success. Each case should describe the
problem, the approach, the results, the reasons why the results were
negative in one case and positive in the other, and conclusions. It was
left to the imagination of the authors to decide if a case were a failure or a
success; we merely indicated that in case of a failure the costs of the
project outweigh the benefits and in case of a success it is the other way
round.
The reason that we obliged authors to write about a failure was that
we believe that one man's fault is another man's lesson. In the literature,
it might even be attractive to focus, unlike Interfaces, on failures rather
than successes. Some potential authors dropped out because they could not
find, or were not allowed to write about, a case that failed. A few others
could not find a successful case! Still others had been working on just
one big project in the past few years. In that case they were asked to
write about the one project, but showing both sides of the medal, the par
tial failures and the partial successes, the trials and errors, the pit
falls and snags.

- 4 -
The 36 contributed case studies together describe 58 different cases.
Naturally, it was stressed for the general reader that failures and
successes were supposed to occur in equal proportions in the book, but
not in reality!
After the event it was realized that the collection of cases could
be used to do implementation research. This amounted merely to analyzing
the reasons given for failures and successes by the authors themselves.
But before we do that, we have to discuss the question of representativity
of the sample.

- 5 -
3. Biases in the sample?
The case studies can be classified according to three dimensions, viz.
according to (a) problem areas, (b) techniques employed and (c) sectors
of the economy.
Table 1 presents the number of failures and successes by problem areas
dealt with. The only significant difference between the number of failures
and successes seems to be in routing and scheduling.
Table 2 presents the number of failures and successes by techniques
employed. Wedley and Ferrie [40] conjectured that (a) projects in which
managers participate have more success, (b) managers participate more in
linear programming projects, hence, (c) linear programming projects are
more often successful. This conjecture is not borne out by our data. The
only striking difference between failures and successes is in combinatorial
optimization, probably because of the complexity of the models (cf.
next section).
Table 3 presents the percentage distribution of the case studies by
sectors of economic activity, compared to the percentage distribution of
total labour volume 1n the Netherlands and of the membership of the
Netherlands Society of Operations Research. The distribution of case
studies over sectors corres-
Table 1. Number of failures and successes by problem areas dealt with
Problem area
market research
production, inventory planning
routing, scheduling
location, allocation planning
financial, organizational planning
social, regional planning
various
Number* ,of failures successes
4
4
9
4
6
7
2
36
5
6
4
6
6
7
2
36
*1f one project was described, it was counted on both sides.

- 6 -
Table 2. Number of failures and successes by techniques employed
Technique employed
linear, mixed-integer programming
non-linear programming
combinatorial optimization
simulation
statistics
ad hoc, various
Number* of failures successes
7
I I
8
3
6
36
9
4
3
9
2
9
36
*If one project was described, it was counted on both sides.
Table 3. Percentage distribution of Dutch labour volume, NSOP membership
and case studies, by sectors of economic activity
Sectors of economic Dutch labour NSOR Case studies activity volume * membership ** analyzed
I. Agriculture 5.8 0.5 2.8
II. Manufacturing industry 30.1 21.2 27.8
III. Business services 48.8 31.0 30.6
IV. Government 15.4 47.3 38.9
(of which Education) (5.2) (32.8) (19.4)
100 100 100
* Source: Netherlands Central Bureau of Statistics, "Labour volume by
sectors and branches of industry, year averages in person-years", 1981. ** Source: [37].
ponds fairly well with the distribution of NSOR membership, especially
if one takes into account that we have discouraged academics to contri
bute, asking them twice if their case study concerned a real life problem
and not an "academic" problem. If we compare the distribution of case studies
with the distribution of total labour volume in the Netherlands, we see that
the quartary sector, Government, and academia in particular, is over-

- 7 -
represented and the tertiary sector, Services, is underrepresented ~n the
case studies. This may be partly caused by the fact that there are many
small-scale firms in Services with too small-scale problems (cf. next
section).
Our collection of case studies is far from being a random sample from
all quantitative methods applied in management in the Netherlands. There
may be biases in the distribution over problem areas, techniques employed,
or sectors of economic activity. There may be biases in the size distribu
tion of the firms/institutions represented, although the sizes ranee from
the numbers 2 and 23 on the Fortune 1981 list of largest industrial com
panies in the world (Royal Dutch/Shell Group and Philips' Gloeilampen
fabrieken, respectively), down to the one-man consultancy firm of B.A.
Knoppers. There may be biases in the authors, approached through the NSOR
membership, because the NSOR membership is dominated by its 36% mathema
ticians and 21% econometricians [37J. There certainly are biases due to
the required 50-50 proportion of failures and successes, to the requirement
that cases should have sufficient news value for the readers, to confident
iality restrictions or, alternatively, to propaganda considerations (of
consultants, academics).
But what really matters here is not possible biases in the collection
of case studies, but possible biases in the reasons given for failures or succes
ses of cases. Then we have to realize that the question about reasons for
failures or successes was open-ended - there was no preconceived exhaustive
list of reasons - and that the answers were given by the OR/MS consultants
who did it, not by their managers or clients, even though the authors
were obliged to admit failures. Therefore, we have to expect, and take
account of, two kinds of biases in the reasons given for failures or suc-
cesses:
I) a bias away from self-evidences to the authors, e.g. "we had sufficient
know-how, computer facilities, software available";
2)a bias away from self-indictments of the authors, e.g. "we did not have
sufficient know-how, we did not 8'e11 our project properly".
Concluding, we hardly see any reason that the biases in the sample of cases
would cause biases in the sample of reasons given for failures or successes,
but we expect some biases in the latter sample due to neglect of self
evidences and the fact that the judges are involved in the judgements.

- 8 -
4. Reasons for failures and successes
I classified the reasons given for failures and for successes indepen
dently and I realize that classifying open-ended statements from case
studies is a subjective job. Fortunately, the base material is available
[38J, so the job can be replicated! I had expected that the reasons given
for failures would be the oppositesof the reasons given for successes.
This turned out to be true to a limited extent.
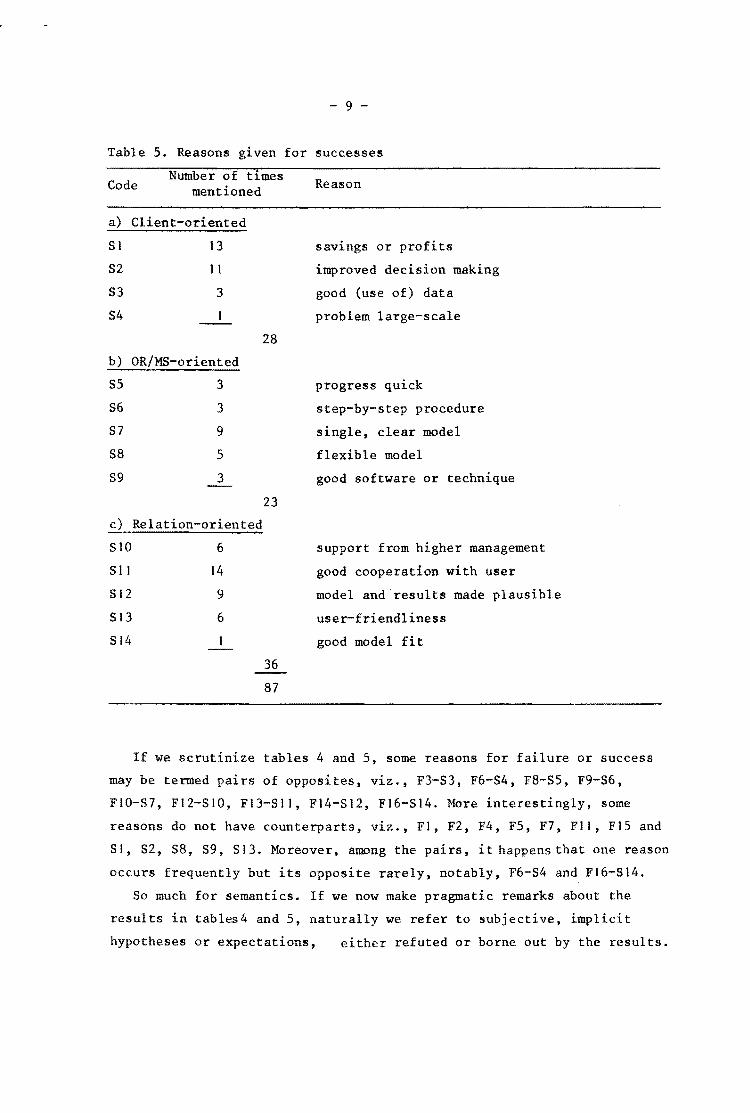
Tables 4 and 5 present the reasons given for failures and successes.
The order by which they are presented is: (a) orientation towards the
client, (b) towards the OR/MS consultant and (c) towards the relation
between the two, and, within these orientations, roughly "top-down".
Table 4. Reasons given for failures
Code Number of times mentioned
a) Client-oriented
FI 4
F2 7
F3 7
F4 5
F5
F6 6
30
b) OR/MS-oriented
F7
F8 3
F9
FlO 7
FII 5
17
c) Relation-oriented
FI2 3
FI3 7
FI4 6
FI5
FI6 15
32
79
Reason
organizational resistance
organizational changes
data deficiency
"data" uncertainty
problem too complex
problem too small-scale
project mismanagement
progress too slow
too much tackled at once
model too complex
computer-time excessive
to change
lack of higher management support
insufficient user involvement
insufficient user understanding
OR/MS-man involved too late
mismatch of model and problem
- 9 -
Table 5. Reasons given for successes
Code Number of times
mentioned Reason
a) Client-oriented
SI 13 savings or profits
S2 I I improved decision making
53 3 good (use of) data
S4 problem large-scale
28
b) OR/MS-oriented
S5 3 progress quick
S6 3 step-by-step procedure
S7 9 single, clear model
S8 5 flexible model
89 good software or technique
23
c) Relation-oriented
S10 6 support from higher management
81 I 14 good cooperation with user
S12 9 model and results made plausible
S13 6 user-friendliness
S14 good model fi t
36
87
If we scrutinize tables 4 and 5, some reasons for failure or success
may be termed pairs of opposites, viz., F3-S3, F6-S4, F8-S5, F9-S6,
FIO-S7, FI2-SI0, FI3-811, F14-S12, FI6-S14. More interestingly, some
reasons do not have counterparts, viz., FI, F2, F4, F5, F7, FII, Fl5 and
SI, S2, S8, 89, S13. Moreover, among the pairs, it happens that one reason
occurs frequently but its opposite rarely, notably, F6-S4 and FI6-514.
So much for semantics. If we now make pragmatic remarks about the
results in tables4 and 5, naturally we refer to subjective, implicit
hypotheses or expectations, either refuted or borne out by the results.

- 10 -
Everybody is free, though, to make his own observations.
- Organizational changes (F2) are a frequent reason for failure we
had not thought of. However strong the resistance to change (FI)
may be, organizational changes, like reorganizations or transfers
of clients, kill projects.
- Problem too small-scale (F6) rightly is a reason for failure of projects
- and probably is an innumerable number of times the reason to refrain
from starting a project at all.
- Project mismanagement (F7) and too much tackled at once (F9) are rare
self-indictments that are supposedly underrepresented.
- Model too complex (FlO) - hear, hear!
- Computer-time excessive (FII), not expected by me after three decades of
explosive growth of computer power.
- User involvement (F13, 811) or, what is more, user understanding (F14,
812) and ease of use (813) are still more crucial than I had thought.
- Mismatch of model and problem (FI6) was a frequent reason of failure
that I could not think of naming otherwise. It was using the wrong
standard "solution" or tailoring the wrong ad hoc model. Happy consequence:
there remains work to be done by OR/M8 workers.
- Benefits in the form of money (81) or improved decision making (82) are
rather tautological reasons for success - and forgotten self-evidences
in the opposite case.
- Simple, clear, flexible models that progress quickly but step-by-step
(85, 86, 87, 88) - hear, hear:
- Good model fit (814) - a self-evidence usually forgotten unless the re
verse is true (FI6).

- 11 -
5. Summary and conslusions
An analysis has been made of reasons given for failures and successes
in 36 case studies, describing 58 cases, collected from Dutch industry,
business and government at the occasion of the 25th anniversary of the
Netherlands Society of Operations Research [38J. All authors were supposed
to describe one failure and one success, and to sive reasons for them.
The main conclusions from the results are:
- there is still a lot of OR/MS work to be done, building models that
fit problems better;
- quick and clean work, cutting out simple and flexible modelS, leads to
success;
a soft, friendly approach,involving and informing the user,is crucial.

- 12 -
References
[I] Abendroth, W.W., and V.T. Thornhill, "TIMS Membership Survey and
CPMS Assessment Program", TIMS Business Office, Providence, RI,
1983.
[2J Anderson, J., and R. Narasimhan, "Assessing project implementation
risk: A methodological approach", Management Science 25 (1979),
512-521.
[3J Annino, J.S.,and E.C. Russell, "The seven most frequent causes of
simulation analysis failure - and how to avoid them", Interfaces
II (1981), no. 3, 59-63.
[4J Biles, W.E., and M.A. Roddy, "Industrial engineering and operations
research oriented journal literature: A statistical analysis",
AIlE Transactions 7 (1975), no. 3, 203-211.
[5J Churchman, C.W.,and A.H. Schainblatt, "The researcher and the
manager: A dialectic of implementation", Management Science II
(I 965), B69-B87.
[6J Davis, M.W., and P.E. Robinson, "The pits of OR/MS and gamesmanship
to skirt the rim", Interfaces 11 (1981), no. 2, 53-61.
[iJ Doktor, R., R.L. Schultz and D.P. Slevin (eds.), The Implementation
of Management Science, TIMS Studies in the Management Sciences vol.
13, North-Holland, Amsterdam, 1979.
[8J Gault, R., "Objectivity, subjectivity and O.R.", Paper presented
at EURO VI, Sixth European Congress on Operations Research, Vienna,
1983.
[9 J Ginzberg, M.J., "Steps towards more effective implementation of MS
and MIS'" Interfaces 8 (1978), no. 3,57-63.
[IOJ Gupta, J.N.D., "Management science implementation: Experiences of
a practicing O.R. manager", Interfaces 7 (1977), no. 3.,84-90.
[II J Heinhold, M., C. Nitsche and G. Papadopoulos, "Empirische Unter
suchung von Schwerpunkten der OR-Praxis in 525 Industriebetrieben
der B.R.D./I, Zeitschrift fur Operations Research 22 (1978), B185-
B218.
[12J Hildebrandt, S., "Implementation of the operations research/manage
ment science process", European Journal of Operational Research I
(1977), 289-294.
- 13 -
[13J Hildebrandt, S., flImplementation - the bottleneck of operations
research: The state of the art tl , European Journal of Operational
Research 6 (1980), 4-12.
[14J Huysmans, J.H.B.M., The Implementation of O~erations Research,
Wiley-Interscience. New York, 1970.
[15J Kawase, T.,and T. Nemoto, tlperceived personal characteristics of
OR/MS leaders and the growth of OR/HS activity - an empirical study",
Journal of the Operations Research Society of Japan 20 (1977),
243-258.
[16J Krarup, J., tlprofiles of the European Working Groups", to be published
in the European Journal of Operational Research, 1984.
[17J Ledbetter, W.N., flAre OR techniques being used?", Industrial
Engineering 9 (1977), no. 2, 19-21.
[18J Lockett, A.G.,and E. Polding, "OR/MS implementation - a variety
of processes lt, Interfaces 9 (1978), no. I, 45-50.
[19J Lucas, Jr., H.C., "Empirical evidence for a descriptive model of
implementation", Management Information Systems Quarterly 2 (1978),
27-42.
[20J Martin, M.J.C., "Transactional analysis: Another way of approaching
OR/MS implementation", Interfaces 7 (1977), no. 2, 91-98.
[21J McArthur, D.S., "Decision scientists, decision makers, and the gap",
Interfaces 10 (1980), no. 1, 110-113.
[22J Meredith, J. R., "The importance of impediments to implementation",
Interfaces II (1981), no. 4, 71-74.
[23] Meyer zu Selhausen, H., "The scenario of OR processes in German
business organizations: Some empirical evidence", Paper presented
at EURO VI, Sixth European Congress on Operations Research, Vienna,
1983.
[24] Michel, A.J.,and S.E. Permut, "Implementation in operational re
search: A review of the Operational Research Quarterly", Operational
Research Quarterly 27 (1976), 931-936.
[25J Michel, A.J., and S.E. Permut, "Management SC1.ence 1.n the United
States and Europe: A decade of change in the literature", OMEGA
6 (1978), 43-51.
[26J Milutinovich, J.S., and J.T. Mell, "OR model implementation: A new
look at the old problem", Paper presented at EURO VI, Sixth Euro
pean Congress on Operations Research, Vienna, 1983.

- 14 -
[27] Mitchell, G.H., and R.C. Tomlinson, "Six principles for effective
OR - their basis in practice", in K.B. Haley (ed.), Operational
Research '78, North-Holland, Amsterdam, 1979, 32-52.
[28J Mitroff, 1. 1., "Zen and the art of implementation: speculations
on a holistic theory of management", Journal of Enterprise Manage
~ I (1978), 55-61.
[29J Phillips, J.P., "MS implementation: a parable", Interfaces 9 (1979),
no. 4, 46-48.
[30] Powell, G.N., "Implementation of OR/MS in government and industry:
A behavioral science perspective", Interfaces 6 (1976), no. 4,
83-89.
[31J Roberts, E.B., "Strategies for effective implementation of complex
corporate models", Interfaces 8 (1977), no. I, 26-33.
[32J Roberts, J., "Non-technical factors in the success and failure of
operational research", in J.P. Brans (ed.), Operational Research '81,
North-Holland, Amsterdam, 1981, 105-117.
[33J Schultz, R.L., and D.P. Slevin (eds.), Implementing Operations
Re~earch/M~nagement Science, American Elsevier, New York, 1975.
[34J Schultz, R.L.,and D.P. Slevin, "Implementation exchange: Implemen
ting implementation research", Interfaces 12 (1982), no. 5, 87-90.
[35J Thomas, G., and J.-A. DaCosta, "A sample survey of corporate opera
tions research", Interfaces 9 (1979), no. 4, 102-11 I .
[36] Tilanus, C.B., "Management Science in the 1980's", Management
Science 27 (1981), 1088-1090.
[37J Tilanus, C.B., "Operations research in the Netherlands", Report
BDK/ORS/83/04, Eindhoven University of Technology, Eindhoven,
Netherlands, 1983.
[38J Tilanus, C.B., O.B. de Gans and J.K. Lenstra (eds.), Kwantitatieve
Me tho den in het Management, Aula paperback 69, Spectrum, Utrecht,
1983; English translation to be published by Wiley, 1984, under the
title: Quantitative Methods. in Management: 36 Case Studies of
Failures and Successes.
[39J Watson, H.J.,and P.Gill Marett, ·'A survey of management science
implementation problems", Interfaces 9 (1979), no. 4, ]24-]28.

- 15 -
[40J Wedley, W.C.,and A.E.J. ferrie, "Perceptual differences and effects
of managerial participation on project implementation", Journal of
the Operational Research Society 29 (1978), 199-204.
[41J Wysocki, R.K., "OR/MS implementation research: A bibliography",
Interfaces 9 (1979), no. 2, 37-41.