Embed Size (px)
Citation preview

FACTORS INFLUENCING PARTICIPATION IN HIGHER E D U C A T I O N I N A U S T R A L I A *
Colin Power
Frances Robertson Flinders University of South Australia
Introduction
Officially, the Australian government is committed to a policy of i n c r ~ participation and greater equity in higher education. The policy has been one of "steady and sustained growth directed towards areas of greatest need", in particular, to outer metropolitan areas, regions and social groups with low rates of participation. In addition, the government has expressed concern about the difficulties being experienced by young people in ob- taining places where entrance requirements have become more restrictive. Therefore, it has pressured the universities and CAEs to review admission policies and to provide better opportunities for applicants from less favoured school and home backgrounds. The government also expects the efforts of institutions to be concentrateA in courses that are relevant to its economic priorities.
In practice, the issue of how to create greater equity in higher education remains as problematic as ever. Inequality in higher education has proved to be a long-standing and universal problem. Solving it will not be easy, given the conflicts within and outside government over the purpose of higher education, the significant decline in the level of support to institutions and students in need, and the gaps between supply and demand for places. Under the circumstances, there is a real danger that whatever gains have been made in the expansion of opportunities for previously under-representeA groups will be reversed if policy decisions are made in the absence of information about patterns of participation and the forces which shape them.
This paper summarizes the results of the first of a series of four interrelated studies on factors influencing participation and progress in higher education undertaken at the request of the Commonwealth Tertiary Education Commission. The first study (Power, Robertson and Baker, 1986) provides, in somewhat fine detail, information about the social background, fmancial circumstances, attitudes and decisions of the cohort of 13o- tential applicants for places in higher education in South Australia in 1985. A subse- quent study examined factors affecting the performance of those who entered higher edu- cation in 1985 (Power, Robertson and Baker, 1987), while the last two studies have ex-
i
* Paper presented at the First Joint Conference of the Australian Association for Research in Education and the Now Zealand Association for Research in Education, Christchurch, ~ m b c r 1987.

86 Australian Educational Researcher
amined the effects of the introduction of the Administration Charge, fwstly on the social composition of external studies (Power and Robertson, 1987a) and f'maUy of full-time and part-time students in Australian higher education (Power and Robertson, 198To).
Entry Into Higher Education
For a student to enter higher education, three basic conditions must be present:
(i) Higher Education must be seen as desirable - the student must want and ap- ply for a place in a university or CAE. This is dependent on the student's home and school background, and the anticipated costs and benefits of higher education (which, in turn, reflect conditions in the job market and the societal structures and pr(~sses).
(ii) It must be academically feasible - the student must meet the entry require- merits for higher education. This depends on academic performance, on the developed abilities which have been forged by experiences within the family and school environment, and on the opportunities and barriers which stem from institutional and government policies.
(iii) It must be economically and socially feasible - the student must have suffi- cient means of financial support (from family, tertiary allowances, part-time work, etc.) and suitable living arrangements must be able to be made (e.g., care of young children). This, in turn, depends on the interaction between students' circumstances on the one hand, and social and economic policy on the other.
The view outlined above indicates that participation in education beyond the com- pulsory stage is framed by the economic, social, political and educational system. These help govern and constrain processes in the home and school which in turn shape students' aspirations, achievements and perceptions of the feasibility and desirability of entering a university or CAE. There have been many studies of factors influencing re- tention in schools (Poole, 1981; Power, 1984). One fairly clear-cut result obtained from research on social selection in education is that it starts early. At the level of higher education, there are limits on what one can do in pursuit of social equality in ed- ucation.
There have also been a number of studies of factors influencing participation in higher education. Anderson and Vervoom (1983) have recently reviewed this work. Their review points to the importance of socio-economic background in shaping educa- tional aspirations and previous educational achievement and hence the desirability and feasibility of entering higher education. From the point of view of students making de- cisions about their educational future, the criteria of desirability and feasibility include such wider considerations as the distance of the institution from home, the chances of

Australian Educational Researcher 87
obtaining a place, the work load, family obligations and career plans. In some cases, potential students may know little of the costs and potential benefits of higher education and not even seriously consider applying. In others, their level of school performance virtually precludes them from any chance of an offer. To the degree that there are, among candidates who are qualified to enter and who do seek a place, marked differences in participation associated with personal, family and school circumstances, we can begin to map the nature and extent of differences and, perhaps, inequality.
It is not just the characteristics of students and their family and school environment which determine patterns of participation. Access to higher education is goveme~ by the admission policies of institutions and the higher education policies of government. Many theories have been put forward to account for the persistence of inequalities in higher education. Whatever the mechanisms, there have been few changes in the social composition of the student body in any western country, regardless of the policies of government.
So far the effort to increase access to higher education among disadvantaged groups has concenwateA on improving both the academic and the financial feasibility of higher education for lower socio-economic groups. It may be, however, that simply increasing the number of higher education places and institutions increases participation, but has little real impact on equity. Providing means t e s ~ support for the most disadvantaged undoubtedly has had an impacL However, the evidence (see Anderson, 1986; Power et al, 1986) suggests that this policy has done little to stem the decline in relative partici- pation rates over the past decade of the middle third of the social strata, largely the An- glo-Australian trades and sales occupational groups. Making higher education more academically feasible does not mean that it is any more financially feasible or desirable for some of the groups under-represented in higher education.
Method
There are currently five higher education institutions in South Australia - two universi- ties and three colleges of advanced education. All students wishing to enter one of these institutions must apply for a place through the south Australian Tertiary Admissions Centre (SATAC). Applications are of two basic t ~ : school leavers and mature age and ~ i a l entry. Applicants are asked to list their course preferences (up to five) and attendance preferences (full-time, part-time, external or later) and to provide details of their sex, age, address, marital status, last school attended, and highest educational qualifications. To this file are added scaled scores from the assessments conducted by Senior Secondary Assessment Board of South Australia (SSABSA).
Given the nature of this project, four major groups of students were studied:
1. ENROLLING STUDENTS (E) Students who enrolled in a first year course in a South Australian university or college of advanced education in 1985. In most cases, these have been broken down into two sub-groups: non-school leavers or mature age(MA) and school leavers (SL).

88 Australian Educational Researcher
2. DEFERRING AND DROP-OUT APPLICANTS (D) Students who applied for a place in a higher education institution in 1985 and who accepted but sought a deferral of enmlment, whose offer lapsed, or whose application was withdrawn.
3. FAILED APPLICANTS (F) Students who applied for a place in one or more courses in 1985 but who were not offered a place in any course applied for (note: while some of these students matriculateA, they did not gain a suffi- ciently high score to be selected for a preferred course).
4. NON APPLICANTS (N) Students who were enrolled full-time in a year 12 course in a South Australian secondary school or TAFE college in 1984, but who did not apply for a place in a South Australian university or CAE course in 1985.
In this study, we were particularly interested in mapping the patterns of participa- tion of various social groups living in South Australia and the Northern Territory. Some details of the background of non-applicant students were on record in SSABSA files and for the other groups from S ATAC files, viz. sex, age, address, student type, marital status, school attended, SSABSA score and, for applicants, course preferences and enrolment status. In order to assess other socioeconomic characte~sfics (living ar- rangements, ethnicity, parental education, occupation, income, etc.) and student motiva- tion, external encouragement, effects of possible policy changes, sources of income, and factors influencing educational decisions, parallel forms of a Higher Education Ques- tionnaire were devised. These were called Forms N, D, F and E to correspond to the four groups sampled.
In all, 8,295 students from the pool of potential entrants into higher education in SA in 1985, were studied. Information about the background, preferences and enrol- ment, and the perceived effects of policy changes was obtained by means of question- naires and from student records.

Australian Educational Researcher 89
Table 1 Characteristics of South Australian Students Entering Higher Education in 1985 Com-
pared with the Relevant South Australian Population
Characteristic
Era'oiled Population RPR (a) Co) (a/b) % % %
Gelid* Male 48 Female ~2
Language spolen at home** English only 80 English plus other 17 Other only 3
Father's Birthplace*** Italy 4 Gmnany 2 Australia 58 UK, Ireland, NZ 17 Other Eum~ 7 Greece 4 Other including Asia 8
51 0.94 49 1.06
83 0.09 16 1.06 1 3.00
6 0.69 2 0.79
61 0.96 18 0.96 7 1.05 3 1.36 4 1.83
*Population: persons aged 15-24 years. (ABS) **Population: persons aged 15+ years in 1983. (ABS: 4503.0) ***Population: males aged 35-54 years. (ABS)
R e s u l t s
(i) Enrolling Students If we compare the background characteristics of the students who entered higher ed-
ucation in 1985 with those of the population, wc can obtain a picture of the "relative participation rates" of various social groups. These arc shown in Tables 1 and 2. As might bc expected, more than twice as many students came from families where the fa- ther has a dcgrcc and is engaged in a professional or managerial occupation, and from families where the fathcr°s income was over $34,000.

90 Australian Educational Researcher
Table 2 Socio-ec~nomic Status Characteristics of Students Entering Higher Education in 1985
Compared withe the Relevant South Australian Population
Characteristic
Enrolled Population RPR (a) Co) (a/b) % % %
Father's Occupation* Skilled trades 16 32 0.50 Oth~ 4 8 0.50 Clerical, sales 8 12 0.70 Rural 7 9 0.74 Semi-skilled, unskilled 113 13 0.75 Mal~erial 26 12 2.16 Professional 29 13 2.21
Father's Education** Diploma 6 17 0.34 Certificate 15 31 0_50 Lower soxmdary 34 21 1.10 Upper secondary 20 15 1.38 Degree or higher 23 11 2.02 Primary 12 5 2.30
Combined parental income*** up to $8,000 pa U 24 0.46 $12,001 to $18,000 pa 12 21 0.57 $8,001 to $18,000 pa 10 12 0.83 $18,001 to $26,000 pa 20 19 1.05 $26,001 to 34,000 pa 18 13 1.38 over $34,000 pa 29 11 2.69
*Population: males aged 35-54 years, 1981 Census. (ABS) **Population: males aged 35-44 years, 1982. (ABS: 4010.0) ***Population: families from 1981 Census with income adjusted byl.28 for CPI to September 1984. (ABS: 2452.0)
A surprisingly high proportion of first year students came from families where parents had only a primary education, families with a very low income and non-English speaking families (especially Greek). Over 42% of first year students had fathers who were not born in Australia. Participation rates among male school leavers coming from the "typical" Australian family have declined, while those of several previously disad- vantaged groups have risen. The social groups most under-represented include Aborigi- nals, students whose parents earned between $4,000 and $8,000 and/or whose fathers

Australian Educational Researcher 91
work in a skilled trade. As in the past, it is high SES Anglo-Australians and the up- wardly mobile groups who tend to go on to higher education.
There are significant variations among institutions in the social composition of the student body. For example, Roseworthy and SAlT have a high proportion of males, while the SACAE attracts mainly female students. The CAEs and Flinders intakes in- clude many Mature Age and Special Entry students (55%-66%), while most students (58%) entering Adelaide University are school leaves with high SSABSA scores. The social backgrounds also vary, between 22% (SACAE) and 43% (Adelaide University) of students having fathers engaged in a professional occupation. Students at Roseworthy and Flinders were more likely to indicate that they would be affected by changes in aca- demic and economic policy than students from other institutions.
There are also substantial differences in the social composition of courses. Young single males are concentrated in the more prestigious institutions and courses, particu- larly the science-basexl courses; the Mature Age students are enrolled in humanities, so- cial sciences and SACAE business/commerce courses. The most "elitist" courses are university law, medicine, architecture and visual and performing arts, while the most "egalitarian" are CAE social science, business, paramedical and teaching courses.
(ii) Potential Students
The pool of potential entrants to higher education in 1985 was def'med as including all Mature Age and Special Entry students who applied for a place, and all students completing year 12.
If one compares the students who enrolled with those who deferred, were not made an offer or did not apply, there are relatively few differences in terms of students' back- ground characteristics: the most disadvantaged groups drop out of education before year 12, the problems of the disadvantaged having more to do with what happens in the fam- ily, school and society than in the sel~ction process. Once in the pool, a students' sex, ethnicity, parental education, occupation, income and so on do not make a great deal of difference. A discriminant analysis suggests that by far the most important factors dis- tinguishing those in the pool who enter higher education from those who do not, are their educational achievements and motivation.
(iii) Number of Places and Social Composition
Two of the key questions asked by policy makers in the mid 1980s were the likely effect of increasing the number of places in institutions and courses on patterns of par- ticipation among groups currently under-represented in higher education on participation in courses which are deemed to be areas of national need (engineering, business and commerce, etc.).
Predicting who would really go if given the chance, who would change courses if the quotas were altered, and how as a result the profile of students in higher education might change is not a highly developed science. Using discriminant analysis, we found that we can discriminate among the four groups of students in the pool from which stu-

92 Australian Educational Researcher
dents who did enrol came. Thus, provided we have information about preferences, we can predict who would enter which courses if more places were available.
To examine the effects of increasing the number of places for a selected course, we: (1) ascertained the 1985 cutoff, quota (if there was one), number enrolled according
to S ATAC and number in our survey sample; (2) for all non-applicants, non-offer, deferral and currently enrolled students, we
calculated applicant's discriminant score which was a linear function of their best 5 aggregrate scaled score, self motivation and score on the effects of changes in academic policy;
(3) increzs~ or decreased enrolments in courses and institutions, selecting students for a course with enrolment increased by 30% in accordance with their stated first preference and in order of their discriminant score, or students for the course with enrolment decreased by 30% in order of their aggregrate score (essentially that used by SATAC); determined the frequency distributions, means, standard deviations and other ba- sic statistics for the condensed independent variables in order to develop profiles of the students in selected courses at present, and those who would be in the course if places were increased or decreased by 30%.
(4)
To determine the impact of a more restrictive entrance policy, we reduce~ the num- ber of places currently occupied by students in selected courses by 30%. Then we elim- inated the bottom 30% of students from those currently enrolled using best five SS- ABSA score or estimated best 5 from special entry score.
From Table 3 we can see that cutting the number of places available generally has the expected effect of raising the cut-off aggregate scaled score. The greatest impact would be on Engineering at Adelaide University with a jump in cuttoff from 375 to 413, followed by Engineering at SAIT, Nursing at SACAE (Sturt), Medicine at Ade- laide and Accountancy at SAIT. Interestingly, a cut of 30% in the number of places in Law at Adelaide (in fact, such a cut has been mooted by the legal fraternity) would not alter the existing cut-off score. We can see too that increasing the number of places by 30% might have an impact on the "academic pecking order" as indicated by the cut-off criterion. Agriculture at Roseworthy and Nursing at Sturt would rise while Economics at Adelaide would fall.

Australian Educational Researcher 93
Table 3 Impact of Changes in Entrance Policy on Courses: All Potential Students, 1985
Cmr~ +30% -30% Ol~* Variable Policy Policy Policy acx~ss
Personal Biographic Age (av. yrs) 22.6 21.8 22.5 19.5 Gender (% male) 48 46 48 45 School-leaver (%) 42 50 45 78 Married (%) 20 17 19 S Postcode SES (de~e av.) 6.6 6.5 6.7 6.2
Educational State school (%) 63 66 63 68 Catholic school (%) 16 15 15 14 Independent school (%) 21 18 22 16 Best 5 entry score (%) 352 344 385 304
Family Background Live with parent (%) 61 65 61 81 1st language non-English (%) 3) 19 19 18 Father Australian born (%) 58 59 59 58 Father's education degree (%) 23 22 34 20 Mother's education degree (%) 10 9 11 8 Father's occ semi-proOf (%) 29 27 31 23 Mother's oct semi- ixo~mf (%) 21 21 23 22 Mother employed (%) 46 47 46 52 Self income ($'000) 5.8 5.8 5.5 4.4 Parent's income ($'000) 26.7 26.8 27.3 26.8
Sample size 5111 6655 3597 970
*Students not enrolled who would choose to enrol.
What is, of course, more important so far as CTEC and government priorities are concerned is the impact of increasing or reducing places on patterns of participation of various social groups. We would hypothesize that increasing the number of places available by 30% in the case of a course with a strict quota and entrance requirements should have the effect of lowering the proportion of students in the course whose parents have degrees, are in professional occupations and on high incomes, and lowering the proportion of students from independent schools and the average best five aggregrate score. And we would hypothesize that the reverse will happen if the number of places is cut by 30%. Generally, this is exactly what does happen (as Table 3 shows). The ef- fects are not enormous (after all, 70% of the students are unaffected) but we can see that there is a direct relationship between tho number of places available and the composition of the study body in a course. The more we restrict the number of places, the more likely it is that only students with high matriculation scores will gain a place, and the
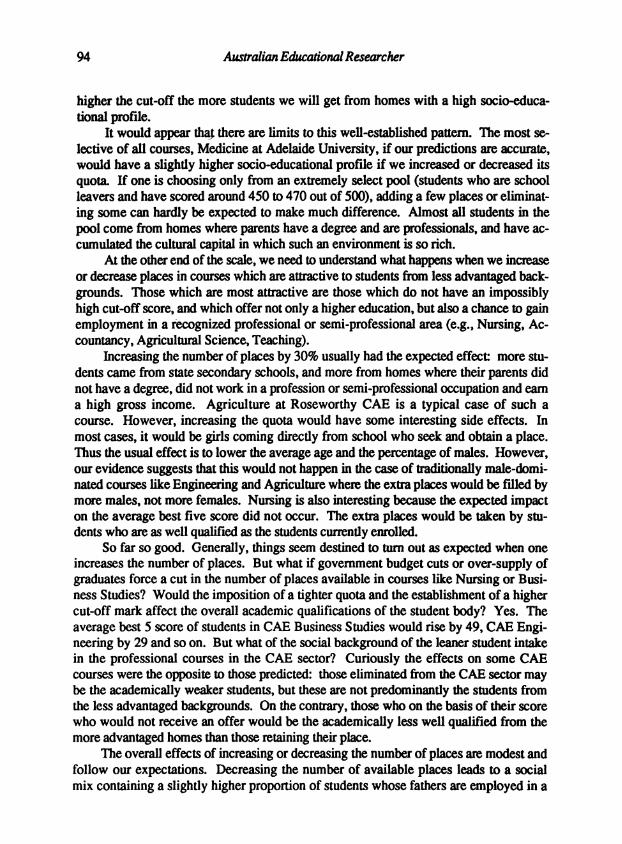
94 Australian Educational Researcher
higher the cut-off the more students we will get from homes with a high socio-e~uca- tional profile.
It would a p ~ that there are fimits to this well-established pattern. The most se- lective of all courses, Medicine at Adelaide University, ff our predictions are accurate, would have a slighdy higher socio-educational profile if we increase~ or decreased its quota. If one is choosing only from an extremely select pool (students who are school leaven and have scored around 450 to 470 out of 500), adding a few places or eliminat- ing some can hardly be expected to make much difference. Almost all students in the pool come from homes where parents have a degree and are professionals, and have ac- cumulawA the cultural capital in which such an environment is so rich.
At the other end of the scale, we need to understand what happens when we increase or decrease places in courses which are attractive to students from less advantaged back- grounds. Those which are most attractive are those which do not have an impossibly high cut-off score, and which offer not only a higher education, but also a chance to gain employment in a recognized professional or semi-professional area (e.g., Nursing, Ac- countancy, Agricultural Science, Teaching).
Increasing the number of places by 30% usually had the expected effect: more stu- dents came from state secondary schools, and more from homes where their parents did not have a degree, did not work in a profession or semi-professional occupation and earn a high gross income. Agriculture at Roseworthy CAE is a typical case of such a course. However, increasing the quota would have some interesting side effects. In most cases, it would be girls coming directly from school who seek and obtain a place. Thus the usual effect is to lower the average age and the percentage of males. However, our evidence suggests that this would not happen in the case of traditionally male-domi- nated courses like EngineeaSng and Agriculture where the extra places would be f'flled by more males, not more females. Nursing is also interesting ~ u s e the expected impact on the average best five score did not occur. The extra places would be taken by stu- dents who are as well qualified as the students currently enrolled.
So far so good. Generally, things seem destined to turn out as expected when one increases the number of places. But what if government budget cuts or over-supply of graduates force a cut in the number of places available in courses like Nursing or Busi- ness Studies? Would the imposition of a tighter quota and the establishment of a higher cut-off mark affect the overall academic qualifications of the student body7 Yes. The average best 5 score of students in CAE Business Studies would rise by 49, CAE Engi- neering by 29 and so on. But what of the social background of the leaner student intake in the professional courses in the CAE sector7 Curiously the effects on some CAE courses were the opI~site to those predicted: those eliminated from the CAE sector may be the academically weaker students, but these are not predominantly the students from the less advantaged backgrounds. On the contrary, those who on the basis of their score who would not receive an offer would be the academically less well qualified from the more advantaged homes than those retaining their place.
The overall effects of increasing or decreasing the number of places are modest and follow our expectations. Decreasing the number of available places leads to a social mix containing a slightly higher proportion of students whose fathers are employed in a

Australian Educational Researcher 95
professional or semi-professional occupation and who come from households with an above average income.
But what if the game is changed completely7 What ff we allowed anyone who ap- pears to be reasonably serious about wanting a higher education or a particular course to enter, whether or not they meet the existing requirements for entry7 Who would come from those year 12s who did not even apply for a place7 Who might we consider from those who because of their present level of achievement were not offered a place? Which of the deferring students would decide to go to a university or CAE rather than entering the workforce? Which of those currently enrolled would transfer out of their existing course and enter a preferred course7 And after all this, would the social profiles of stu- dents in a course change7
Attempting to answer such questions does represent a leap into the unknown, but we had asked students currently not enrolled a series of questions which, if their answers are reasonably truthful, provide a basis for making predictions about the social effects of an open enwance policy. We had asked non-applicants if they would like a university or college education, students who did not receive an offer if they planned to repeat year 12 and try again, students who deferred whether they did plan to enrol in 1986, and enrolled students if they would enrol in another course if there were no quotas on any course. On the basis of these responses we created a "change stares" variable which enabled us to select out from those students not currently in a given course who would be most likely to enter their first preference under an open access policy. Finally, we drew up profiles of "open emrance" cohorts for the courses which we had looked at previously. The re. sults are presenteA in the final column of each table detailing the predicted impact of ed- ucational policy changes on courses.
Comparing the profiles of open entry students with those of the students currently enrolled we can see some of the likely effects of a fairly radical open access policy. The open access students, as expected, generally would have lower best 5 scores than those who have been selected on academic merit, and they certainly represent a more socially representative mix of students. Those entering Medicine at Adelaide would have an av- erage best 5 score of 395 compared with the present average of 462. A dramatic drop to be sure, one of the same order as other university and Institute of Technology profes- sional courses. Just how brilliant one needs to be to have a reasonable chance of suc- cess in Medicine, Law and Engineering is an open question. Students scoring an aver- age of 395 could hardly be described as lacking the ability necessary for success at a university. It is well above the minimum requirement (295), well above the score needed for entry into science. They are still above the population norms with r e ~ t to parental education, occupation and income, but not as starkly as students currently en- rolled. Should the door to a medical career be shut against them? Or should some of them be allowed to enter either directly or at the end of a first year science course7
What about the other end of the scale7 What if students were allowed open access to Nursing7 We would predict that the average aggregrate score would drop from 336 to 270. More young people, including a proportion of male school leavers, would enter the course, and more from families where the parents have a lower level of education, occupation and income. We would worry, however, about the capacity of some of these

96 Australian Educational Researcher
students to undertake a science-based professional course. The one joker in the pack seems to be CAE courses which few students from the open access pool chose as their first preference. Most students who wanted to do such courses were able to obtain a place in a higher preference, while among those not in the course, we could find only a handful of likely open entry students. Even with an open access policy one may find that there are courses and institutions which, on the surface, ought to be attractive to disadvantaged groups, but for some reason or other, are not.
Conclus ion
The study described suggests that the establishment of new institutions of higher educa- tion, the generation of additional places and the establishment of Mature Age and Spe- cial Entry students have opened up opportunities for a number of disadvantaged groups in South Australia. To increase participation on the part of groups hitherto under-repre- sented in higher education, there must be a range of pathways and opportunities open. It is imIxgtant that higher education be, and be seen to be, academically feasible.
The evidence indicates that whether higher education is seen as desirable is a more complex matter, reflecting the complex interaction of conditions in the labour market and the perceived value of education Coy students, their families and the societal groups to which they belong). There is no simple relationship between the perceived value of education and decision-making about participation. Participation rates and the propor- tion of family income needed to support a student were found to vary markedly among different income groups. In the present circumstances, it would seem that many school leavers (especially males from Anglo-Australian families, and students whose combined parental income falls between $12,000 and $22,000) are uncertain about the economic, social and cultural benefits of investing in higher education. Moreover, the hidden and direct costs of such an investment are considerable, even for families on reasonably "comfortable" incomes, it is "Middle Australia", the group which just misses out on AUSTUDY, which is increasingly becoming under-represented in higher education.
Predictions were made about the effects of increasing or decreasing the number of students in various courses by 30%. In general, the effects are as expected. Increasing the number of places would lower the cut-off and the average SSABSA score of students enrolled. The percentage of students with parents in the higher education, occupation and income categories would fall marginally in most courses. In two cases (CAE Nurs- ing and CAE Agriculture) the effects of increasing the number of places were not as ex- pected - the extra places would be taken by students who were, on average, younger and with matriculation scores higher than those currently enrolled. If we allowed any stu- dent who appears to be reasonably serious about wanting to take a given course to enter, the open access students would have a much lower matriculation score and would be a more socially representative group. This seems to be most likely in courses where there is considerable pressure for entry (e.g., Medicine, Law, Engineering, Nursing).
Reducing the number of places available by 30% would have the effect of raising the entry score by a significant amount, the effects being greatest on Associate Diploma

Australian Educational Researcher 97
courses and least for Medicine. The effects of reducing the number of places would be to make courses more "elitist" in terms of parental education, occupation and income. In- deed, this is what is happening now in Australia. The gains (in terms of equity) we found had occurred in some institutions between 1972 and 1985 are now rapidly being reversed as the gap between the supply and the demand for places increases. Moreover, the direct and indirect costs of participation for many families have increased (esIx~ially for those from rural areas), while the returns on investment in a degree have decreased (see Power et al. , 1986). The reversal of the trend towards a more equitable higher edu- cation system in Australia has been exacerbated by the introduction of the Administra- tion Charge. What seems for most to be a modest imposition turns out to have forced a disproportionate number of mature age, part-time and external students with modest in- comes and dependent children out of the system (see Power and Robertson, 1987a, 1987b for details).
Inequafity in higher education has proved to be a long-standing and universal prob- lem. Reducing the inequalities will not be easy, but there does seem to be a need to in- crease the number of places in courses attractive to disadvantaged groups, to maintain the possibility of a second change for Mature Age and Special Entry students, to liberalize entry policies by using sub-quotas which take errors of measurement and bias in the selection procedure into account, and to delay the competition for restricted places (e.g., selection for the most sought-after professional courses at the end of first year or after a two year associate degree course). In addition, there is a nee~ for compassion and additional financial support for those seeking to improve their qualifications in order to escape the cycle of poverty. And there is a neeA to rationalize and improve income sup- port schemes and to remove financial barriers to participation in order to cater more ef- fectively for the groups who are still, or have become, under-represented in higher education.
Finally, in the last analysis, higher education must be seen by most, if not all groups in society, to be accessible to them and to be worthwhile if governments in turn are to shoulder their responsibility in providing for the higher educational needs of the society. To this end, a public education campaign which provides accurate and compre- hensive information about the opportunities, advantages and costs of higher education to the individual, employers and society is neeAed.
References
Anderson, D. and Vervoom, A. (1983) Access to Privilege. Canberra, ANU Press. Anderson, D. (1986) "Changes in the Social Mix of Higher Education: Some Cross
Country Comparisons". Department of Sociology, Australian National Uni- versity.
Poole, M. (1981) School Leavers in Australia. Canberra: Commonwealth Schools Commission.

98 Australian Educational Researcher
Power, C. (1984) "Factors Influencing Retentivity and Satisfaction with Secondary Schooling". Australian Journal of Education, 28 (2), 115-125.
Power, C. and Robertson, F. (1987a) "Effects of Administration Charge on Participa- tion in Higher Education by External Students". Adelaide: NILS, Hinders University, Report to CTEC.
Power, C. and Robertson, F. (1987b) "Effects of the Administration Charge on Participation by Full-time and Part-time Students". Adelaide: NILS, Hinders University, Report to CETEC.
Power, C., Robertson, F. and Baker, M. (1986) Access to Higher Education: Partici- pation, Equity and Policy. Canberra: CTEC.
Power, C. Robertson, F. and Baker, M. (1987) Success in Higher Education. Can- berra: CTEC.