Embed Size (px)
Citation preview
ECONorthwest Talent Economic Opportunities Analysis– Draft 1
3 Factors Affecting Future Economic Growth
Talent exists as part of the larger economy of the Rogue Valley and is strongly influenced by regional economic conditions. For many factors, such as labor, Talent does not differ significantly from the broader region. For other factors, such as income, it does. Thus, Talent benefits from being a part of the larger regional economy and plays a specific role in it.
This chapter describes the factors affecting economic growth in Talent, including national and regional economic trends. The analysis presents Talent’s competitive advantages for growing and attracting businesses, which forms the basis for identifying potential growth industries in Talent.
3.1 Factors that Affect Economic Development The fundamental purpose of Goal 9 is to make sure that a local government plans for economic development. The planning literature provides many definitions of economic development, both broad and narrow. Broadly,
“Economic development is the process of improving a community’s well-being through job creation, business growth, and income growth (factors that are typical and reasonable focus of economic development policy), as well as through improvements to the wider social and natural environment that strengthen the economy.”1
That definition acknowledges that a community’s well-being depends in part on narrower measures of economic well-being (e.g., jobs and income) and on other aspects of quality of life (e.g., the social and natural environment). In practice, cities and regions trying to prepare an economic development strategy typically use a narrower definition of economic development: they take it to mean business development, job growth, and job opportunity. The assumptions are that:
Business and job growth are contributors to and consistent with economic development, increased income, and increased economic welfare. From the municipal point of view investment, and resulting increases in property tax, are important outcomes of economic development.
The evaluation of tradeoffs and balancing of policies to decide whether such growth is likely to lead to overall gains in well-being (on average and across all citizens and businesses in a jurisdiction, and all aspects of
1 An Economic Development Toolbox: Strategies and Methods, Terry Moore, Stuart Meck, and James Ebenhoh, American Planning Association, Planning Advisory Service Report Number 541, October 2006.

ECONorthwest Talent Economic Opportunities Analysis– Draft 2
well-being) is something that decision makers do after an economic strategy has been presented to them for consideration.
That logic is consistent with the tenet of the Oregon land-use planning program: that all goals matter, no goal dominates, and the challenge is to find a balance of conservation and development that is acceptable to a local government and state. Goal 9 does not dominate, but it legitimizes and requires that a local government focus on the narrower view of economic development: the one that focuses on economic variables.
In that context, a major part of local economic development policy is about local support for business development and job growth; that growth comes from the creation of new firms, the expansion of existing firms, and the relocation or retention of existing firms. Thus, a key question for economic development policy is, What are the factors that influence business and job growth, and what is the relative importance of each? This document addresses that question in depth.2
What Factors Matter? Why do firms locate where they do? There is no single answer—different firms choose their locations for different reasons. Key determinates of a location decision are a firm’s factors of production. For example, a firm that spends a large portion of total costs on unskilled labor will be drawn to locations where labor is relatively inexpensive. A firm with large energy demands will give more weight to locations where energy is relatively inexpensive. In general, firms choose locations they believe will allow them to maximize net revenues: if demand for goods and services are held roughly constant, then revenue maximization is approximated by cost minimization.
The typical categories that economists use to describe a firm’s production function are:
Labor. Labor is often the most important factor of production. Other things equal, firms look at productivity—labor output per dollar. Productivity can decrease if certain types of labor are in short supply, which increases the costs by requiring either more pay to acquire the labor that is available, the recruiting of labor from other areas, or the use of the less productive labor that is available locally.
Land. Demand for land depends on the type of firm. Manufacturing firms need more space and tend to prefer suburban locations where land is
2 The information in this section is based on previous Goal 9 studies conducted by ECONorthwest and the following publication: An Economic Development Toolbox: Strategies and Methods, Terry Moore, Stuart Meck, and James Ebenhoh, American Planning Association, Planning Advisory Service Report Number 541, October 2006.

ECONorthwest Talent Economic Opportunities Analysis– Draft 3
relatively less expensive and less difficult to develop. Warehousing and distribution firms need to locate close to interstate highways.
Local infrastructure. An important role of government is to increase economic capacity by improving quality and efficiency of infrastructure and facilities, such as roads, bridges, water and sewer systems, airport and cargo facilities, energy systems, and telecommunications.
Access to markets. Though part of infrastructure, transportation merits special attention. Firms need to move their product, either goods or services, to the market, and they rely on access to different modes of transportation to do this.
Materials. Firms producing goods, and even firms producing services, need various materials to develop products that they can sell. Some firms need natural resources (i.e., raw lumber) and others may need intermediate materials (i.e., dimensioned lumber).
Entrepreneurship. This input to production may be thought of as good management, or even more broadly as a spirit of innovation, optimism, and ambition that distinguishes one firm from another even though most of their other factor inputs may be quite similar.
The supply, cost, and quality of any of these factors obviously depend on market factors: on conditions of supply and demand locally, nationally, and even globally. But they also depend on public policy. In general, public policy can affect these factors of production through:
Regulation. Regulations protect the health and safety of a community and help maintain the quality of life. Overly burdensome regulations, however, can be disincentives for businesses to locate in a community. Simplified bureaucracies and straightforward regulations can reduce the burden on businesses and help them react quickly in a competitive marketplace.
Taxes. Firms tend to seek locations where they can optimize their after-tax profits. Tax rates are not a primary location factor—they matter only after businesses have made decisions based on labor, transportation, raw materials, and capital costs. The costs of these production factors are usually similar within a region. Therefore, differences in tax levels across communities within a region are more important in the location decision than are differences in tax levels between regions.
Financial incentives. Governments can offer firms incentives to encourage growth. Most types of financial incentives have had little significant effect on firm location between regions. For manufacturing industries with significant equipment costs, however, property or investment tax credit or abatement incentives can play a significant role in location decisions. Incentives are more effective at redirecting growth

ECONorthwest Talent Economic Opportunities Analysis– Draft 4
within a region than they are at providing a competitive advantage between regions.
This discussion may make it appear that a location decision is based entirely on a straight-forward accounting of costs, with the best location being the one with the lowest level of overall costs. Studies of economic development, however, have shown that location decisions depend on a variety of other factors that indirectly affect costs of production. These indirect factors include agglomerative economies (also known as industry clusters), quality of life, and innovative capacity.
Industry clusters. Firms with similar business activities can realize operational savings when they congregate in a single location or region. Clustering can reduce costs by creating economies of scale for suppliers. For this reason, firms tend to locate in areas where there is already a presence of other firms engaged in similar or related activities.
Quality of life. A community that features many quality amenities, such as access to recreational opportunities, culture, low crime, good schools, affordable housing, and a clean environment can attract people simply because it is a nice place to be. A region’s quality of life can attract skilled workers, and if the amenities lure enough potential workers to the region, the excess labor supply pushes their wages down so that firms in the region can find skilled labor for a relatively low cost. The characteristics of local communities can affect the distribution of economic development within a region, with different communities appealing to different types of workers and business owners. Sometimes location decisions by business owners are based on an emotional or historical attachment to a place or set of amenities, without much regard for the cost of other factors of production.
Innovative capacity. Increasing evidence suggests that a culture promoting innovation, creativity, flexibility, and adaptability is essential to keeping U.S. cities economically vital and internationally competitive. Innovation is particularly important in industries that require an educated workforce. High-tech companies need to have access to new ideas typically associated with a university or research institute. Innovation affects both the overall level and type of economic development in a region. Government can be a key part of a community’s innovative culture, through the provision of services and regulation of development and business activities that are responsive to the changing needs of business.
ECONorthwest Talent Economic Opportunities Analysis– Draft 5
How Important Are These Factors? To understand how changes in public policies affect local job growth, economists have attempted to identify the importance for firms of different locational factors. They have used statistical models, surveys, and case studies to examine detailed data on the key factors that enter the business location decision.
Economic theory says that firms locate where they can reduce the costs of their factors of production (assuming demand for products and any other factors are held constant). Firms locate in regions where they have access to inputs that meet their quality standards, at a relatively low cost. Because firms are different, the relative importance of different factors of production varies both across industries and, even more importantly, across firms.
No empirical analysis can completely quantify firm location factors because numerous methodological problems make any analysis difficult. For example, some would argue simplistically that firms will prefer locating in a region with a low tax rate to reduce tax expenses. However, the real issue is the value provided by the community for the taxes collected. Because taxes fund public infrastructure that firms need, such as roads, water, and sewer systems, regions with low tax rates may end up with poor infrastructure, making it less attractive to firms. When competing jurisdictions have roughly comparable public services (type, cost, and quality) and quality of life, then tax rates (and tax breaks) can make a difference.
Further complicating any analysis is the fact that many researchers have used public expenditures as a proxy for infrastructure quality. But large expenditures on roads do not necessarily equal a quality road system. It is possible that the money has been spent ineffectively and the road system is in poor condition.
An important aspect of this discussion is that the business function at a location matters more than a firm’s industry. A single company may have offices spread across cities, with headquarters located in a cosmopolitan metropolitan area, the research and development divisions located near a concentration of universities, the back office in a suburban location, and manufacturing and distribution located in areas with cheap land and good interstate access.
The location decisions of businesses are primarily based on the availability and cost of labor, transportation, raw materials, and capital. The availability and cost of these production factors are usually similar within a region. Most economic development strategies available to local governments, however, only indirectly affect the cost of these primary location factors. Local governments can most easily affect tax rates, public services, and regulatory policies. Economists generally agree that these factors do affect economic development, but the effects on economic development are modest. Thus, most of the strategies available to

ECONorthwest Talent Economic Opportunities Analysis– Draft 6
local governments have only a modest affect on the level and type of economic development in the community.
Local governments in Oregon also play a central role in the provision of buildable land through inclusion of lands in the Urban Growth Boundary, as well as through determination of plan designations and zoning, and through provision of public services. Obviously, businesses need buildable land to locate or expand in a community. Providing buildable land alone is not sufficient to guarantee economic development in a community—market conditions must create demand for this land, and local factors of production must be favorable for business activity. In the context of expected economic growth and the perception of a constrained land supply in Jackson County, the provision of buildable land has the potential to strongly influence the level and type of economic development in Talent. The provision of buildable land is one of the most direct ways that the City of Talent can affect the level and type of economic development in the community.

ECONorthwest Talent Economic Opportunities Analysis– Draft 7
3.2 Summary of the Effect of National, State and Regional Trends on Economic Development in Talent
This section presents the implications of national, state, and regional economic trends on economic growth in Talent.
National, State, and Regional Economic Trends
Moderate growth rates and recovery from the national recession
After the end of the recession in 2009, economic growth returned to the US economy, with persistent increases in GDP, (2.1% in the third quarter of 20 (averaging about 237,000 per month over 2015), and decline in the unemployment rate (currently at about 5.1% compared to the recessionary peak o
Unemployment at the national level has gradually declined since the height of the recession. Unemployment rates in Oregon are typically higher than th
The federal government’s economic forecast predicts a moderate pace of economic growth, with gradual increases in employment and real GDP (rough 2016).
IHS Economic projects that Oregon’s economy will be the fifth-fastest growing among all states in the US, averaging annual growth of about 3.5% throu Office of Economic Analysis expects a slightly slower rate, it still expects the Oregon to exceed the national average. 4
Growth of service-oriented sectors
Increased worker productivity and the international outsourcing of routine tasks led to declines in employment in the major goods-producing industries of Labor Statistics indicate that U.S. employment growth will continue to be strongest in healthcare and social assistance, professional and business se industries. Construction employment will grow with the economy, but manufacturing employment will decline. These trends are also expected to affect economy, although manufacturing in Oregon will grow.
Importance of small businesses in Oregon’s economy
Small business, with 100 or fewer employees, account for 41% of private-sector employment in Oregon. Workers of small businesses typically have had average.
Availability of trained and skilled labor
Businesses in Oregon are generally able to fill jobs, either from available workers living within the State or by attracting skilled workers from outside of t
Availability of labor depends, in part, on population growth and in-migration. Oregon added more than 1,120,000 new residents and about 465,000 ne 2014. The population-employment ratio for the State was about 2.2 residents per job over the 24-year period.
Availability of labor also depends on workers’ willingness to commute. Workers in Oregon typically have a commute that is 30 minutes or shorter.
Availability of skilled workers depends, in part, on educational attainment. About 30% of Oregon’s workers have a Bachelor’s degree or higher.
3 “Job Growth Steady in July, Possibly Easing Path for Fed Action,” The New York Times, August 7, 2015; “US Economy at a Glance,’ US Bureau of Economic Analysis, accessed December 14, 2015; “Employment Situation Summary,” Economic News Release, Bureau of Labor Statistics, December 4, 2015. 4 IHS Economics in “Oregon Economic and Revenue Forecast,” Oregon Office of Economic Analysis, Dec 2015. http://www.oregon.gov/DAS/OEA/docs/economic/forecast1215.pdf

ECONorthwest Talent Economic Opportunities Analysis– Draft 8
National, State, and Regional Economic Trends
Aging of the population
The number of Oregonians aged 65 and older will nearly double between 2015 and 2050, while the number of people under age 65 will grow by only a effects of this demographic change include a slowing of the growth of the labor force, an increase in the demand for healthcare services, and an increa federal budget dedicated to Social Security and Medicare.
Furthermore, people are retiring later than previous generations and continuing to work past 65 years old. This trend is seen both at the national and S trend, the need for workers to replace retiring Baby Boomers will outpace job growth. Management occupations and teachers will have the greatest nee because these occupations have older-than-average workforces.
Increases in energy prices
Although energy prices are currently low by historical standards, over the long-term, energy prices are forecast to return to relatively high levels, as the e grow.
As energy prices increase over the planning period, energy consumption for transportation may decrease. Increasing energy prices may decrease willing distances. However the impact on transportation costs from energy prices may be partly offset by increased energy efficiency of vehicles and stricter em
Comparatively low wages
The income of a region affects the workforce and the types of businesses attracted to the region. Average income affects workers and businesses in dif attracted to a region with higher average wage or high wage jobs. Businesses, however, may prefer to locate in regions with lower wages, where the cos lower.
Since the early 1980’s, Oregon’s per capita personal income has been consistently lower than the U.S. average. In 2014, Oregon’s per capita wage wa average. From 2000 to 2014 nominal wages in the nation grew by 46% from $35,300 to $51,400, while wages in Oregon increased by only 42% from
Education as a determinant of wages
The majority of the fastest growing occupations will require an academic degree, and on average they will yield higher incomes than occupations that d degree.
The fastest growing occupations requiring an academic degree will be: industrial-organizational psychologists, interpreters and translators, diagnostic m occupational therapy assistants, genetic counselors, physical therapist assistants, and physician assistants. Occupations that do not require an academ person, food preparation workers, and home care aides) will grow, accounting for almost two-thirds of all new jobs by 2022. These occupations typically occupations requiring an academic degree.
The national median income for people over the age of 25 in 2014 was about $43,628. Workers without a high school diploma earned $18,252 less th workers with a high school diploma earned $8,892 less than median income. Workers with some college earned $5,096 less than median income, and degree earned $13,624 more than median. Workers in Oregon experience the same patterns as the nation, but pay is generally lower in Oregon than t
Importance of high quality natural resources
The relationship between natural resources and local economies has changed as the economy has shifted away from resource extraction. Increases in households’ incomes, plus changes in tastes and preferences, have dramatically increased demands for outdoor recreation, scenic vistas, clean water amenities. Such amenities contribute to a region’s quality of life and play an important role in attracting both households and firms.

ECONorthwest Talent Economic Opportunities Analysis– Draft 9
3.3 National Trends Economic development in Talent over the next 20 years will occur in the context of long-run national trends. The most important of these trends include:
Economic growth will continue at a moderate pace. Analysis from the Congressional Budget Office (CBO) predicts moderate growth: 3.1% GDP growth in 2016, 3.7% in 2017, and 2.2% in 2018-2019. Increases in consumer spending, business investment, and residential investment are expected to drive this growth.
The unemployment rate is expected to decrease to 5.0% by the fourth quarter of 2017, and remain relatively steady after that. Growth in hourly compensation will increase labor force participation, slowing its longer-term decline.
Beyond 2019, CBO projects that output will increase by 2.1% per year, higher than 2008-2014 growth, but lower than growth in the 1980’s, 1990’s, and early 2000’s., mainly due to slower labor force growth. Unemployment is expected to be 5.25% from 2020-2025.5
The aging of the baby boom generation, accompanied by increases in life expectancy. As the baby boomer generation continues to retire, the number of Social Security recipients is expected to increase from 59 million in 2014 to over 90 million in 2035, a 53% increase. However, due to lower-birth rate replacement generations, the number of covered workers is only expected to increase 14.7% over the same time period, from 165 million to almost 190 million in 2035. Currently, there are 36 Social Security beneficiaries per 100 covered workers in 2014 but by 2035 there will be 58 beneficiaries per 100 covered workers. This will increase the percent of the federal budget dedicated to Social Security and Medicare.6
Baby boomers are expecting to work longer than previous generations. An increasing proportion of people in their early to mid-50s expect to work full-time after age 65. In 2004, about 40% of these workers expect to work full-time after age 65, compared with about 30% in 1992.7 This trend can be seen in Oregon, where the share of workers 65 years and older grew from 2.9% of the workforce in 2000 to 4.1% of the workforce in 2010,
5 Congressional Budget Office. An Update to the Budget and Economic Outlook: 2015-2025. August 2015. https://www.cbo.gov/publication/50724 6 The Board of Trustees, Federal Old-Age and Survivors Insurance and Federal Disability Insurance Trust Funds, 2015, The 2015 Annual Report of the Board of Trustees of the Federal Old-Age and Survivors Insurance and Federal Disability Insurance Trust Funds, May 13, 2011. 7 “The Health and Retirement Study,” 2007, National Institute of Aging, National Institutes of Health, U.S. Department of Health and Human Services.

ECONorthwest Talent Economic Opportunities Analysis– Draft 10
an increase of 41%. Over the same ten-year period, workers 45 to 64 years increased by 15%.8
Need for replacement workers. The need for workers to replace retiring baby boomers will outpace job growth. According to the Bureau of Labor Statistics, there will be 50.6 million total job openings over the 2012-2022 period, over two-thirds from replacement needs. Almost two thirds of job openings are in occupations that do not require postsecondary education.9
The importance of education as a determinant of wages and household income. According to the Bureau of Labor Statistics, a majority of the fastest growing occupations will require an academic degree, and on average, they will yield higher incomes than occupations that do not require an academic degree. The fastest growing occupations requiring an academic degree will be: industrial-organizational psychologists, interpreters and translators, diagnostic medical sonographers, occupational therapy assistants, genetic counselors, physical therapist assistants, and physician assistants. Occupations that do not require an academic degree (e.g., retail sales person, food preparation workers, and home care aides) will grow, accounting for almost two-thirds of all new jobs by 2022. These occupations typically have lower pay than occupations requiring an academic degree.10
The national median income for people over the age of 25 in 2014 was about $43,628. Workers without a high school diploma earned $18,252 less than the median income, and workers with a high school diploma earned $8,892 less than median income. Workers with some college earned $5,096 less than median income, and workers with a bachelor’s degree earned $13,624 more than median. Workers in Oregon experience the same patterns as the nation, but pay is generally lower in Oregon than the national average.11
Increases in labor productivity. Productivity, as measured by output per hour of labor input, increased in most sectors between 2000 and 2010, peaking in 2007. However, productivity increases were interrupted by the recession. After productivity decreases from 2007 to 2009, many industries saw large productivity increases from 2009 to 2010. Industries with the fastest productivity growth were Information Technology-
8 Analysis of 2000 Decennial Census data and 2010 U.S. Census American Community Survey, 1-Year Estimates for the table Sex by Age by Employment Status for the Population 16 Years and Over 9 “Occupational Employment Projections to 2012-2022,” Bureau of Labor Statistics, December 2013. 10 “Occupational Employment Projections to 2012-2022,” Bureau of Labor Statistics, December 2013. 11 Bureau of Labor Statistics, Employment Projections, April 2015. http://www.bls.gov/emp/ep_chart_001.htm

ECONorthwest Talent Economic Opportunities Analysis– Draft 11
related industries. These include wireless telecommunications carriers, computer and peripheral equipment manufacturing, electronics and appliance stores, and commercial equipment manufacturing wholesalers.12
The importance of high-quality natural resources. The relationship between natural resources and local economies has changed as the economy has shifted away from resource extraction. High-quality natural resources continue to be important in some states, especially in the Western U.S. Increases in the population and in households’ incomes, plus changes in tastes and preferences, have dramatically increased demands for outdoor recreation, scenic vistas, clean water, and other resource-related amenities. Such amenities contribute to a region’s quality of life and play an important role in attracting both households and firms.13
Continued increase in demand for energy. Energy prices are forecasted to increase over the planning period. While energy use per capita is expected to decrease to 2040, total energy consumption will increase with rising population. Energy consumption is expected to grow primarily from industrial and (to a lesser extent) commercial users, and slightly decrease in the residential sector. Energy consumption for transportation is expected to decrease, due to increased federal standards and increased technology for energy efficiency in vehicles.
Energy consumption by type of fuel is expected to change over the planning period. By 2040, the U.S. will continue to shift from crude oil towards natural gas and renewables. For example from 2013 to 2040, the Energy Information Administration projects that US overall energy consumption will average a 0.3% annual growth rate, while consumption of renewable sources grows at 1.4% per year. Despite increases in energy efficiency and decreases in demand for energy by some industries, demand for energy is expected to increase over the 2013 to 2040 period because of increases in population and economic activity.14
Impact of rising energy prices on commuting patterns. As energy prices increase over the planning period, energy consumption for transportation
12 Brill, Michael R. and Samuel T. Rowe, “Industry Labor Productivity Trends from 2000 to 2010.” Bureau of Labor Statistics, Spotlight on Statistics, March 2013. 13 For a more thorough discussion of relevant research, see, for example, Power, T.M. and R.N. Barrett. 2001. Post-Cowboy Economics: Pay and Prosperity in the New American West. Island Press, and Kim, K.-K., D.W. Marcouiller, and S.C. Deller. 2005. “Natural Amenities and Rural Development: Understanding Spatial and Distributional Attributes.” Growth and Change 36 (2): 273-297. 14 Energy Information Administration, 2015, Annual Energy Outlook 2015 with Projections to 2040, U.S. Department of Energy, April 2015. http://www.eia.gov/forecasts/aeo/pdf/0383(2015).pdf . Note, the cited growth rates are shown in the Executive Summary and in Table A2.

ECONorthwest Talent Economic Opportunities Analysis– Draft 12
will decrease. Increasing energy prices may decrease willingness to commute long distances.15 The increases in energy prices, may impact willingness to commute long distances, but may be partly offset by increased energy efficiency of vehicles and stricter emissions standards. Vehicle miles traveled (VMT) are expected to increase through 2040.
Potential impacts of global climate change. There is a consensus among the scientific community that global climate change is occurring and will have important ecological, social, and economic consequences over the next decades and beyond.16 Extensive research shows that Oregon and other western states already have experienced noticeable changes in climate, and predicts that more change will occur in the future.17
In the Pacific Northwest, climate change is likely to (1) increase average annual temperatures, (2) increase the number and duration of heat waves, (3) increase the amount of precipitation falling as rain during the year, (4) increase the intensity of rainfall events, and 5) increase sea level. These changes are also likely to reduce winter snowpack and shift the timing of spring runoff earlier in the year.18
15 Energy Information Administration, 2015, Annual Energy Outlook 2015 with Projections to 2040 Early Release Overview, U.S. Department of Energy, April 2015. 16 Karl, T.R., J.M. Melillo, and T.C. Peterson, eds. 2009. Global Climate Change Impacts in the United States. U.S. Global Change Research Program. June. Retrieved June 16, 2009, from www.globalchange.gov/usimpacts; and Pachauri, R.K. and A. Reisinger, eds. 2007. Climate Change 2007: Synthesis Report. Contribution of Working Groups I, II, and III to the Fourth Assessment Report of the Intergovernmental Panel on Climate Change. 17 Doppelt, B., R. Hamilton, C. Deacon Williams, et al. 2009. Preparing for Climate Change in the Upper Willamette River Basin of Western Oregon. Climate Leadership Initiative, Institute for a Sustainable Environment, University of Oregon. March. Retrieved June 16, 2009, from http://climlead.uoregon.edu/ pdfs/willamette_report3.11FINAL.pdf and Doppelt, B., R. Hamilton, C. Deacon Williams, et al. 2009. Preparing for Climate Change in the Rogue River Basin of Southwest Oregon. Climate Leadership Initiative, Institute for a Sustainable Environment, University of Oregon. March. Retrieved June 16, 2009 from http://climlead.uoregon.edu/pdfs/ROGUE%20WS_FINAL.pdf 18 Mote, P., E. Salathe, V. Duliere, and E. Jump. 2008. Scenarios of Future Climate for the Pacific Northwest. Climate Impacts Group, University of Washington. March. Retrieved June 16, 2009, from http://cses.washington.edu/db/pdf/moteetal2008scenarios628.pdf; Littell, J.S., M. McGuire Elsner, L.C. Whitely Binder, and A.K. Snover (eds). 2009. “The Washington Climate Change Impacts Assessment: Evaluating Washington's Future in a Changing Climate - Executive Summary.” In The Washington Climate Change Impacts Assessment: Evaluating Washington's Future in a Changing Climate, Climate Impacts Group, University of Washington. Retrieved June 16, 2009, from www.cses.washington.edu/db/pdf/ wacciaexecsummary638.pdf; Madsen, T. and E. Figdor. 2007. When it Rains, it Pours: Global Warming and the Rising Frequency of Extreme Precipitation in the United States. Environment America Research & Policy Center and Frontier Group.; and Mote, P.W. 2006. “Climate-driven variability and trends in mountain snowpack in western North America.” Journal of Climate 19(23): 6209-6220.
ECONorthwest Talent Economic Opportunities Analysis– Draft 13
These anticipated changes point toward some of the ways that climate change is likely to impact ecological systems and the goods and services they provide. There is considerable uncertainty about how long it would take for some of the impacts to materialize, and the magnitude of the associated economic consequences. Assuming climate change proceeds as today’s models predict, however, some of the potential economic impacts of climate change in the Pacific Northwest will likely include:19
Potential impact on agriculture and forestry. Climate change may impact Oregon’s agriculture through changes in: growing season, temperature ranges, and water availability.20 Climate change may impact Oregon’s forestry through increase in wildfires, decrease in the rate of tree growth, change in mix of tree species, and increases in disease and pests that damage trees.21
Potential impact on tourism and recreation. Impacts on tourism and recreation may range from: (1) decreases in snow-based recreation if snow-pack in the Cascades decreases, (2) negative impacts to tourism along the Oregon Coast as a result of damage and beach erosion from rising sea levels,22 (3) negative impacts on availability of water summer river recreation (e.g., river rafting or sports fishing) as a result of lower summer river flows, and (4) negative impacts on the availability of water for domestic and business uses.
Short-term national trends will also affect economic growth in the region, but these trends are difficult to predict. At times, these trends may run counter to the long-term trends described above. A recent example is the downturn in economic activity in 2008 and 2009 following declines in the housing market and the mortgage banking crisis. The result of the economic downturn was decreases in employment related to the housing market, such as construction and real estate. As these industries recover, they will continue to play a significant role in the national, state, and local economy over the long run. This report takes a long-run perspective on economic conditions (as the Goal 9 requirements intend) and
19 The issue of global climate change is complex and there is a substantial amount of uncertainty about climate change. This discussion is not intended to describe all potential impacts of climate change but to present a few ways that climate change may impact the economy of cities in Oregon and the Pacific Northwest. 20 “The Economic Impacts of Climate Change in Oregon: A preliminary Assessment,” Climate Leadership Initiative, Institute for Sustainable Environment, University of Oregon, October 2005. 21 “Economic Impacts of Climate Change on Forest Resources in Oregon: A Preliminary Analysis,” Climate Leadership Initiative, Institute for Sustainable Environment, University of Oregon, May 2007. 22 “The Economic Impacts of Climate Change in Oregon: A preliminary Assessment,” Climate Leadership Initiative, Institute for Sustainable Environment, University of Oregon, October 2005.

ECONorthwest Talent Economic Opportunities Analysis– Draft 14
does not attempt to predict the impacts of short-run national business cycles on employment or economic activity.
3.4 State Trends
Short-Term Trends Oregon is on its way to recovery from the recent recession. According to the Oregon Office of Economic Analysis (OEA), the Oregon Economy “continues to be full throttle.” Wages remain below the national average, but they are at a relative high compared to the early 1980s. Over the past year, Oregon added over 57,000 jobs, a 3.3% growth rate. The professional and business services, health services, and leisure and hospitality industries have accounted for almost half of total growth in the State. Oregon continues to have an advantage in job growth compared to other states, due to its industrial sector and in-migration flows. Its labor market continues to gain more workers, signaled by an improving market participation rate relative to its low recessionary levels.23.
The housing market is continuing to recover. Oregon is seeing high household formation rates, which is good for the housing market. However, supply (both rental and ownership) of housing has not kept pace with housing demand, causing home prices and rents to rise. If construction cannot keep pace with household growth, housing affordability will become a greater issue. The OEA expects construction to increase over the next three years, relieving some of this pressure.24
The Oregon Index of Leading Indicators has grown since 2012. The leading indicators showing improvement are: volume of air freight, increase in housing permits, initial claims for unemployment, new incorporations of companies, and withholdings out of wages and salaries. However, negative indicators include a low book-to-bill ratio, decreasing industrial production, and the appreciating Oregon Dollar Index.25
Oregon’s economic health is dependent on the export market. The value of Oregon exports in 2015 was $20 billion. The countries that Oregon has the most exports to are China (24% of total Oregon exports), Canada (13%), Malaysia
23 Office of Economic Analysis. Oregon Economic and Revenue Forecast, March 2016. Vol. XXXVI, No. 1, page 2 http://www.oregon.gov/das/OEA/Documents/forecast0316.pdf 24 Office of Economic Analysis. Oregon Economic and Revenue Forecast, March 2016. Vol. XXXVI, No. 1, page 13-4. 25 Office of Economic Analysis. Oregon Economic and Revenue Forecast, March 2016 Vol. XXXVI, No. 1, page 11.

ECONorthwest Talent Economic Opportunities Analysis– Draft 15
(12%), Japan (7%), South Korea (5%), and Taiwan (4%).26 With the appreciation of Oregon’s dollar, Oregon’s exports have slowed.27 The economic slowdown across many parts of Asia will continue to affect the Oregon economy. However, the Trans-Pacific Partnership, a trade agreement that would reduce trade barriers if approved, is expected to increase Oregon exports to participating countries (such as Malaysia, Japan, and Canada).
Long-term Trends State, regional, and local trends will also affect economic development in Talent over the next 20 years. The most important of these trends includes: continued in-migration from other states, distribution of population and employment across the state, and change in the types of industries in Oregon.
Continued in-migration from other states. Oregon will continue to experience in-migration (more people moving to Oregon than from Oregon) from other states, especially California and Washington. From 1990 to 2015, Oregon’s population increased by over 1.1 million, 66% of which was from people moving into Oregon (net migration). The average annual increase in population from net migration over the same time period was just under 31,000. During the early- to mid-1990’s, Oregon’s net migration was highest, reaching over 60,000 in 1991, with another smaller peak in the mid 2000’s. Oregon hasn’t seen negative net migration since a period of negative net migration in the early- to mid-1980’s.28
Forecast of job growth. Total nonfarm employment is expected to increase from 1.8 million in 2015 to just below 2 million in 2022, an increase of 218,000 jobs. The industries with the largest growth will be Professional and Business Services, Leisure and Hospitality, Health Services, and Retail Trade, accounting for 61% of the forecasted growth.29
Continued importance of manufacturing to Oregon’s economy. Oregon’s exports totaled $19.4 billion in 2008, nearly doubling since 2000, and reached $21 billion in 2014. In 2015, exports are on track to meet 2014’s exports. The majority of Oregon exports go to countries along the Pacific Rim, with Canada, China, Japan, Korea, and Malaysia as top destinations. Oregon’s largest exports are tied to high-tech and mining, as
26 United States Census. State Exports from Oregon, 2012-2015. https://www.census.gov/foreign-trade/statistics/state/data/or.html 27 Office of Economic Analysis. Oregon Economic and Revenue Forecast, March 2016. Vol. XXXVI, No. 1, page 6. 28 Portland State University Population Research Center. 2013 Annual Population Report. April 2014. http://www.pdx.edu/prc/annual-oregon-population-report 29 Office of Economic Analysis. Oregon Economic and Revenue Forecast, March 2016. Vol. XXXVI, No. 1, page 39-40.

ECONorthwest Talent Economic Opportunities Analysis– Draft 16
well as agricultural products.30 Manufacturing employment is concentrated in five counties in the Willamette Valley or Portland area: Washington, Multnomah, Lane, Clackamas, and Marion Counties.31
Shift in manufacturing from natural resource-based to high-tech and other manufacturing industries. Since 1970, Oregon started to transition away from reliance on traditional resource-extraction industries. A significant indicator of this transition is the shift within Oregon’s manufacturing sector, with a decline in the level of employment in the Lumber & Wood Products industry and concurrent growth of employment in other manufacturing industries, such as high-technology manufacturing (Industrial Machinery, Electronic Equipment, and Instruments), Transportation Equipment manufacturing, and Printing and Publishing.32
Income. Oregon’s income and wages are below that of a typical state. However, mainly due to the wage growth over the last two to three years, Oregon wages are at their highest point relative to other states since the recession in the early 1980’s. In 2014, the average annual wage was $46,515, and median household income was $51,075 (compared to national average wages of $51,364, and national household income of $53,657).33 Total personal income (all classes of income, minus Social Security contributions, adjusted for inflation) in Oregon is expected to increase by 47%, from $173 billion in 2015 to $255 billion in 2022. Per capita income is expected to increase by 36% over the same time period, from $43,000 in 2015 to $58,400 in 2022 (in nominal dollars).34
Small businesses continue to account for a large share of employment in Oregon. While small firms played a large part in Oregon’s expansion between 2003 and 2007, they also suffered disproportionately in the recession and its aftermath (64% of the net jobs lost between 2008 and 2010 were from small businesses).
30 Oregon Office of Economic Analysis. Oregon Exports 2015: Destination Countries. August 2015. http://oregoneconomicanalysis.com/2015/08/13/oregon-exports-2015-destination-countries/ 31 Business Oregon, “Economic Data Packet” 32 Although Oregon’s economy has diversified since the 1970’s, natural resource-based manufacturing accounts for nearly 40% of employment in manufacturing in Oregon in 2014, with the most employment in Wood Product and Food manufacturing (QCEW). 33 Average annual wages are for “Total, all industries,” which includes private and public employers. Oregon Quarterly Census of Employment and Wages, 2014. https://www.qualityinfo.org; Bureau of Labor Statistics, Quarterly Census of Employment and Wages, 2014, Total,US Census American Community Survey 1-Year Estimates, 2014, Table B19013. 34 Office of Economic Analysis. Oregon Economic and Revenue Forecast, March 2016. Vol. XXXVI, No. 1, page 38.

ECONorthwest Talent Economic Opportunities Analysis– Draft 17
In 2013 small businesses (those with 100 or fewer employees) accounted for 96% of all businesses and 41% of all private-sector employment in Oregon. Said differently, most businesses in Oregon are small (in fact, 77% of all businesses have fewer than 10 employees), but the largest share of Oregon’s workers work for large businesses.
The average annualized payroll per employee at small businesses was $34,527 in 2013, which is considerably less than that at large businesses ($50,114) and the statewide average for all businesses ($46,669).35
Younger workers are important to continued growth of small businesses across the nation. More than one-third of Millennials (those born between 1980 - 1999) are self-employed, with approximately half to two-thirds interested in becoming an entrepreneur. Furthermore, in 2011, about 160,000 start-up companies were created each month; 29% of these companies were founded by people between 20 to 34 years of age.36
35 U.S Census Bureau, 2013 Statistics of U.S. Businesses, Annual Data, Enterprise Employment Size, U.S and States. http://www.census.gov/econ/susb/ 36 Cooper, Rich, Michael Hendrix, Andrea Bitely. (2012). "The Millennial Generation Research Review." Washington, DC: The National Chamber Foundation. Retrieved from: https://www.uschamberfoundation.org/sites/default/files/article/foundation/MillennialGeneration.pdf.

ECONorthwest Talent Economic Opportunities Analysis– Draft 18
3.5 Regional and Local Trends
Availability of Labor The availability of trained workers in Talent will impact development of its economy over the planning period. A skilled and educated populace can attract well-paying businesses and employers and spur the benefits that follow from a growing economy. Key trends that will affect the workforce in Talent over the next 20 years include its growth in its overall population, growth in the senior population, and commuting trends.
Growing Population Population growth in Oregon tends to follow economic cycles. Historically, Oregon’s economy is more cyclical than the nation’s, growing faster than the national economy during expansions, and contracting more rapidly than the nation during recessions. Oregon grew more rapidly than the U.S. in the 1990s (which was generally an expansionary period) but lagged behind the U.S. in the 1980s. Oregon’s slow growth in the 1980s was primarily due to the nationwide recession early in the decade. As the nation’s economic growth slowed during 2007, Oregon’s population growth began to slow.
Oregon’s population grew from 2.8 million people in 1990 to 4.0 million people in 2014, an increase of over 1,100,000 people at an average annual rate of 1.39%. Oregon’s growth rate slowed to 1.05% annual growth between 2000 and 2014.
From 1990 to 2014, Talent’s population increased by 2,956 people or 90%.
Exhibit 1. Population, Talent, 1990 - 2014 Source: PSU Population Research Center, US Decennial Census
From 1990 to 2014, Talent’s population grew by 2,956 people, accounting for 4.8% of population growth in Jackson County.
Exhibit 2. Population Growth, 1990 - 2014 Source: PSU Population Research Center Certified Population Estimates, 1990 and 2014
90% 42% 39% Talent Jackson County Oregon

ECONorthwest Talent Economic Opportunities Analysis– Draft 19
Talent’s population grew faster than both the County and the State.
Exhibit 3. Population Growth, 1990 - 2014 Source: PSU Population Research Center Certified Population Estimates, 1990 and 2014
2.7% 1.5% 1.4% Talent Jackson County Oregon
Age Distribution The number of people aged 65 and older in the U.S. is expected to double by 2050, while the number of people under age 65 will only grow by 12%. The economic effects of this demographic change include a slowing of the growth of the labor force, need for workers to replace retirees, aging of the workforce for seniors that continue working after age 65, an increase in the demand for healthcare services, and an increase in the percent of the federal budget dedicated to Social Security and Medicare.37
The median age of Talent residents is increasing. This is similar for Jackson County and Oregon.
Talents’ median age has increased by six years since 2000. Over the same period, the median age increased in both Jackson County and Oregon, but by fewer years relative to Talent.
Exhibit 4. Median Age, 2000 to 2010-14 Source: US Census Bureau, 2000 Decennial Census Table P013, 2010-14 ACS Table B01002.
2000 34.3 Talent
39.2 Jackson County
36.3 Oregon
2010-14 40.5 Talent
42.7 Jackson County
38.9 Oregon
37 The Board of Trustees, Federal Old-Age and Survivors Insurance and Federal Disability Insurance Trust Funds, 2008, The 2008 Annual Report of the Board of Trustees of the Federal Old-Age and Survivors Insurance and Federal Disability Insurance Trust Funds, April 10, 2008. The Budget and Economic Outlook: Fiscal Years 2007 to 2016, January; and Congressional Budget Office, 2005, The Long-Term Budget Outlook, December.

ECONorthwest Talent Economic Opportunities Analysis– Draft 20
From 2000 to 2014, Talent’s largest population increase was for the population aged 45 to 64 years old. This is larger than statewide trends.
Exhibit 5. Talent population change by age, 2000-2014 Source: U.S. Census 2000 Summary File, American Community Survey 2014 5-year estimate Table B01001
In 2014, 48% of Talent’s residents were between 20 and 59 years old. Talent has a larger share of residents under the age of 20 than Jackson County and the State. Talent has a comparatively small population of residents between the ages of 20 to 39 (22%).
Exhibit 6. Population distribution by age, Oregon, Jackson County, and Talent, 2010-2014 Source: American Community Survey, 2014 5-year estimate

ECONorthwest Talent Economic Opportunities Analysis– Draft 21
By 2035, Jackson County will have a larger share of residents older than sixty than it does today. The share of residents aged 60 years and older will account for 36% of Jackson County’s population, compared to 28% in 2015.
Exhibit 7. Population Growth by Age Group, Jackson County, 2015 - 2035 Source: Oregon Office of Economic Analysis, Long-term County Forecast, 2013 Release

ECONorthwest Talent Economic Opportunities Analysis– Draft 22
Income Income and wages affect business decisions for locating in a city. Areas with higher wages may be less attractive for industries that rely on low-wage workers.
Per capita income38 grew most years during the 34-year period, with the exception of a decrease during the recession. Between 1980 and 2015, Oregon’s per capita personal income was consistently lower than the U.S. average. In 1980, Oregon’s per capita personal income equaled the national average. By 2013, Oregon’s per capita personal income reached 90% of the national average. Oregon’s relatively low wages make the state attractive to businesses seeking to locate in areas with lower-than-average wages.
Jackson County’s per capita income remained consistently below the State average, though it followed similar growth trends as State personal income. In 2006, Jackson County reached an almost identical level compared to the State, but remained below the State’s average for following years.
Per capita income (adjusted for inflation) in the nation, Oregon, and Jackson County has grown since 1980. Since 2000, per capita personal income increased nationally and remained relatively flat in Oregon and Jackson County. Oregon grew 6% in the post-recession period between 2009 and 2014, larger than Jackson County’s 2% growth over the same period. Jackson County’s per capita income was 91% of Oregon’s average in 2014.
Exhibit 8. Per Capita Personal Income, US, Oregon, and Jackson County, 1980 to 2014, Inflation-adjusted 2014 Dollars Source: Bureau of Economic Analysis, Per Capita Personal Income, Table CA-1
38 Personal income includes wages, dividends and interest from investments, rent from investments, pension play payments and transfer payments (e.g., social security payments). Per capita personal income is the personal income of the area divided by the total number of people in the area.

ECONorthwest Talent Economic Opportunities Analysis– Draft 23
Between 2000 and 2014, Jackson County’s per capita personal income grew and its average wages increased. Over the same period, average wages increased in Oregon and the U.S. The increase in average wages in Jackson County has many causes but one cause is the change in mix of jobs in Jackson County since 2001.
From 2000 to 2014, average annual wages rose in Jackson County, Oregon, and the nation. In 2014, average annual wages were about $38,005 in Jackson County, $46,515 in Oregon, and $51,361 in the nation.
Exhibit 9. Average Annual Wage, Covered Employment, US, Oregon, and Jackson County, 2000 to 2014, Inflation-adjusted 2014 Dollars Source: Bureau of Labor Statistics, Quarterly Census of Employment and Wages
In the 2010-14 period, Talent’s median household income was below that of the County and the State.
Exhibit 10. Median Household Income, 2010-14 Source: US Census Bureau, 2014 ACS Table B19013
$32,168 $44,086 $50,521 Talent Jackson County Oregon
In the 2010-14 period, Talent’s median family income was below that of the County and the State.
Exhibit 11. Median Family Income, 2010-14 Source: US Census Bureau, 2014 ACS Table B19113
$46,425 $52,952 $61,890 Talent Jackson County Oregon

ECONorthwest Talent Economic Opportunities Analysis– Draft 24
Exhibit 12 shows the distribution of household income in Oregon, Jackson County, and Talent in 2014.
In the 2010-14 period, 34% of Talent households had less than $20,000 in income. 76% of Talent households had an income of less than $60,000 compared to 58% statewide.
Exhibit 12. Household Income by Income Group, Oregon, Jackson County, and Talent, 2010-14, Inflation-adjusted 2014 Dollars Source: US Census Bureau, 2014 ACS Table B19001

ECONorthwest Talent Economic Opportunities Analysis– Draft 25
Educational Attainment The availability of trained, educated workers affects the quality of labor in a community. Educational attainment is an important labor force factor because firms need to be able to find educated workers.
Talent has a larger share of residents with Some College or an Associate’s Degree (39%) than Jackson County (25%) and Oregon (35%).
Exhibit 13. Educational Attainment for the Population 25 Years and Over, 2010-14 Source: US Census Bureau, 2014 ACS Table B15003

ECONorthwest Talent Economic Opportunities Analysis– Draft 26
Labor Force Participation and Unemployment The current labor force participation rate is an important consideration in the availability of labor. The labor force in any market consists of the adult population (16 and over) who are working or actively seeking work. The labor force includes both the employed and unemployed. Children, retirees, students, and people who are not actively seeking work are not considered part of the labor force. According to the 2010-2014 American Community Survey, Talent has more than 3,070 people in its labor force.
In 2015, the Oregon Office of Economic Analysis observed that about 32% of all job vacancies in the state were attributable to a lack of qualified applicants—people who don’t have the education, certification, or experience to fill the job posting. This indicates a mismatch between the types of jobs that employers are demanding and the skills that potential employees can provide.
Talent has a higher labor force participation rate (64%) than Jackson County (59%) and Oregon (62%). The likely reason for the higher labor force participation rate is Talent’s smaller share of people over 60 years old.
Exhibit 14. Labor Force Participation, Talent, Jackson County, Oregon, 2010-14 Source: US Census Bureau, 2010-14 ACS Table B23001
The unemployment rate in Oregon and the US has declined since the recession. In 2014, the unemployment rate in Jackson County was about 8.6%, higher than both 6.9% in Oregon and 6.2% in the nation.
Exhibit 15. Unemployment Rate, US, Oregon, Jackson County, 2000-2014 Source: Bureau of Labor Statistics, Local Area Unemployment Statistics and Labor Force Statistics
ECONorthwest Talent Economic Opportunities Analysis– Draft 27
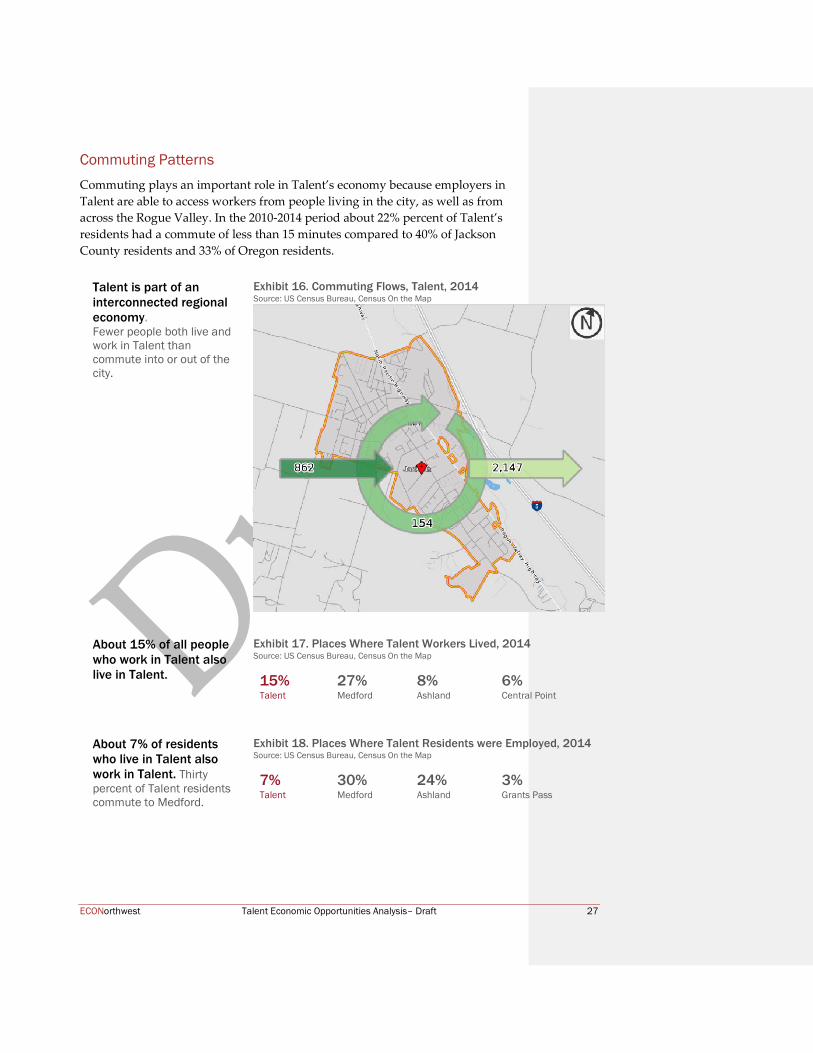
Commuting Patterns Commuting plays an important role in Talent’s economy because employers in Talent are able to access workers from people living in the city, as well as from across the Rogue Valley. In the 2010-2014 period about 22% percent of Talent’s residents had a commute of less than 15 minutes compared to 40% of Jackson County residents and 33% of Oregon residents.
Talent is part of an interconnected regional economy. Fewer people both live and work in Talent than commute into or out of the city.
Exhibit 16. Commuting Flows, Talent, 2014 Source: US Census Bureau, Census On the Map
About 15% of all people who work in Talent also live in Talent.
Exhibit 17. Places Where Talent Workers Lived, 2014 Source: US Census Bureau, Census On the Map 15% Talent
27% Medford
8% Ashland
6% Central Point
About 7% of residents who live in Talent also work in Talent. Thirty percent of Talent residents commute to Medford.
Exhibit 18. Places Where Talent Residents were Employed, 2014 Source: US Census Bureau, Census On the Map 7% Talent
30% Medford
24% Ashland
3% Grants Pass

ECONorthwest Talent Economic Opportunities Analysis– Draft 28
Talent’s businesses attract workers from across the Southern Oregon region. Exhibit 17 shows 27% of people who work in Talent commute from Medford, 8% from Ashland, and 6% from Central Point. The remaining workers commute from many other cities located in Southern Oregon.
Most Talent residents have a commute time of less than 30 minutes. About 80% of Talent residents have commute times less than 30 minutes, and only 2% commute for longer than one hour.
Exhibit 19. Commute Time by Place of Residence, 2010-14 Source: US Census Bureau, 2010-14 ACS Table B08303

ECONorthwest Talent Economic Opportunities Analysis– Draft 29
Changes in Employment in Jackson County and Talent The economy of the nation changed substantially between 1980 and 2014. These changes affected the composition of Oregon’s economy, including Jackson County and Talent’s economy. At the national level, the most striking change was the shift from manufacturing employment to service-sector employment. The most important shift in Oregon during this period has been the shift from a timber-based economy to a more diverse economy, with the greatest employment in services.
Employment Trends in Jackson County Over the past few decades, employment in the U.S. has shifted from manufacturing and resource-intensive industries to service-oriented sectors of the economy. Increased worker productivity and the international outsourcing of routine tasks have led to declines in employment in the major goods-producing industries.
In the 1970s, Oregon started to transition away from reliance on traditional resource-extraction industries. An important indicator of this transition is the shift within Oregon’s manufacturing sector, with a decline in the level of employment in the Lumber & Wood Products industry39 and concurrent growth of employment in high-technology manufacturing industries (Industrial Machinery, Electronic Equipment, and Instruments).40
As Oregon has transitioned away from natural resource-based industries, the composition of Oregon’s employment has shifted from natural resource based manufacturing and other industries to service industries. The share of Oregon’s total employment in Service industries increased from its 1970s average of 19% to 30% in 2000, while employment in Manufacturing declined from an average of 18% of total employment in the 1970s to an average of 12% in 2000.
The changes in sectors and industries are shown in two tables: (1) between 1980 and 2000 and (2) between 2001 and 2014. The analysis is divided in this way because of changes in industry and sector classification that made it difficult to compare information about employment collected after 2001 with information collected prior to 2000.
Employment data in this section is summarized by sector, each of which includes several individual industries. For example, the Retail Trade sector includes General Merchandise Stores, Motor Vehicle and Parts Dealers, Food and Beverage Stores, and other retail industries.
39 Lumber and Wood Products manufacturing is in Standard Industrial Classification (SIC) 24 40 SIC 35, 36, 38

ECONorthwest Talent Economic Opportunities Analysis– Draft 30
Exhibit 20 shows changes in the Jackson County MSA between 1980 and 2000. Over the total period, total employment in Jackson County increased by 73% from about 42,600 to 73,600 employees. Between 1980 and 2000, employment in services as a share of total employment rose from 17% to 28%.
Exhibit 20. Covered Employment by SIC Industries, Jackson County, 1980-2000
Source: Bureau of Labor Statistics, Quarterly Census of Employment and Wages, 1980-2000. Note: “ND” stands for “Not disclosed” and indicates that the data has been suppressed by the BLS due to confidentiality constraints. In most years, the non-disclosure is negligible.
Exhibit 21 shows employment in NAICS-categorized industries in Jackson County for 2001 and 2014. Employment increased by 5,652 jobs, or 8%, during this period. The private sectors with the largest increases in numbers of employees were Education and Health Services, Leisure and Hospitality, and State Government. Employment in higher wage industries such as construction and manufacturing decreased by approximately 350 and 360 jobs, respectively over the 2001 to 2014 time period. The education and health service sector increased by 3,800 jobs.
Exhibit 21. Covered Employment by Industry, Jackson County, 2001-2014
Source: Bureau of Labor Statistics, Quarterly Census of Employment and Wages, 2001-2014 Note: “ND” stands for “Not Disclosed” and indicates that the data has been suppressed by the BLS due to confidentiality constraints. The total amount of not-disclosed employment is shown in the table.

ECONorthwest Talent Economic Opportunities Analysis– Draft 31
Exhibit 22 shows covered employment and average wage for the 10 largest industries in Jackson County. Jobs in Education and Health Services, which account for about 18% of the County’s covered employment, pay more per year than the county average ($46,069 compared to $38,353). Jobs in Manufacturing, Local Government, Professional and Business Services, Construction, Financial Activities, and State Government all pay about the county average, while those in Trade, Transportation, and Utilities, Leisure and Hospitality, and Other Services pay less than the average.
Exhibit 22. Covered Employment and Average Pay by Industry, 10 Largest Industries Jackson County, 2014
Source: Bureau of Labor Statistics, Quarterly Census of Employment and Wages, 2014.

ECONorthwest Talent Economic Opportunities Analysis– Draft 32
Employment Trends in Talent Exhibit 23 shows a summary of confidential employment data for the city of Talent in 2014. The sectors with the greatest number of employees were: Manufacturing (18%), Government (17%), and Construction (12%). These sectors accounted for 465 jobs or 47% of Talents’ employment.
The average size for a private business in Talent is 5.1 employees per business, compared to the State average of 11 employees per private business. Businesses with 20 or fewer employees account for roughly 64% of private employment in Talent. Businesses with 9 or fewer employees account for 44% of private employment and 4 or fewer account for 20% of private employment.
Exhibit 23. Covered Employment and Average Pay by Industry, Talent UGB, 2014
Source: Oregon Employment Department, Quarterly Census of Employment and Wages, 2014.

ECONorthwest Talent Economic Opportunities Analysis– Draft 33
Exhibit 24 shows the employment and average pay per employee for selected industrial sectors in Talent. Average pay for all employees ($33,843) is shown as a light brown line across the graph and average pay for individual sectors as short red lines. The figure shows that Government, Construction, and Manufacturing have above average wages. The lowest wages are in Retail Trade and Accommodations and Food Services.
Exhibit 24. Covered Employment and Average Pay by Industry, Talent UGB, 2014
Source: Oregon Employment Department, Quarterly Census of Employment and Wages, 2014.
ECONorthwest Talent Economic Opportunities Analysis– Draft 34
Tourism in Southern Oregon and Talent Longwoods International provides regional statistics on travel. The following information is from Longwoods International’s Oregon 2013 regional visitor report for the Southern Oregon region.41 Broadly, travelers to Southern Oregon account for:
3.7 million overnight trips annually; 12% of Oregon Travel
Primary market area for travelers is Oregon, California, and Washington: 44% of Southern Oregon visitors are from Oregon; 22% are from California; and 12% are from Washington
64% stayed 2 or fewer nights; 31% stayed 3-6 days; and 5% stayed 7 or more days
Average per person expenditures on overnight trips range from $11 to $33 per night
About 72% of visits are by automobile; 9% travel by RV
Visitors are affluent, older, and well-educated: over half have college degrees; 30% between ages 50-64; 22% 65+; 21% between $50 and $70k; 14% between $70 and $100k; and 22% over $100k
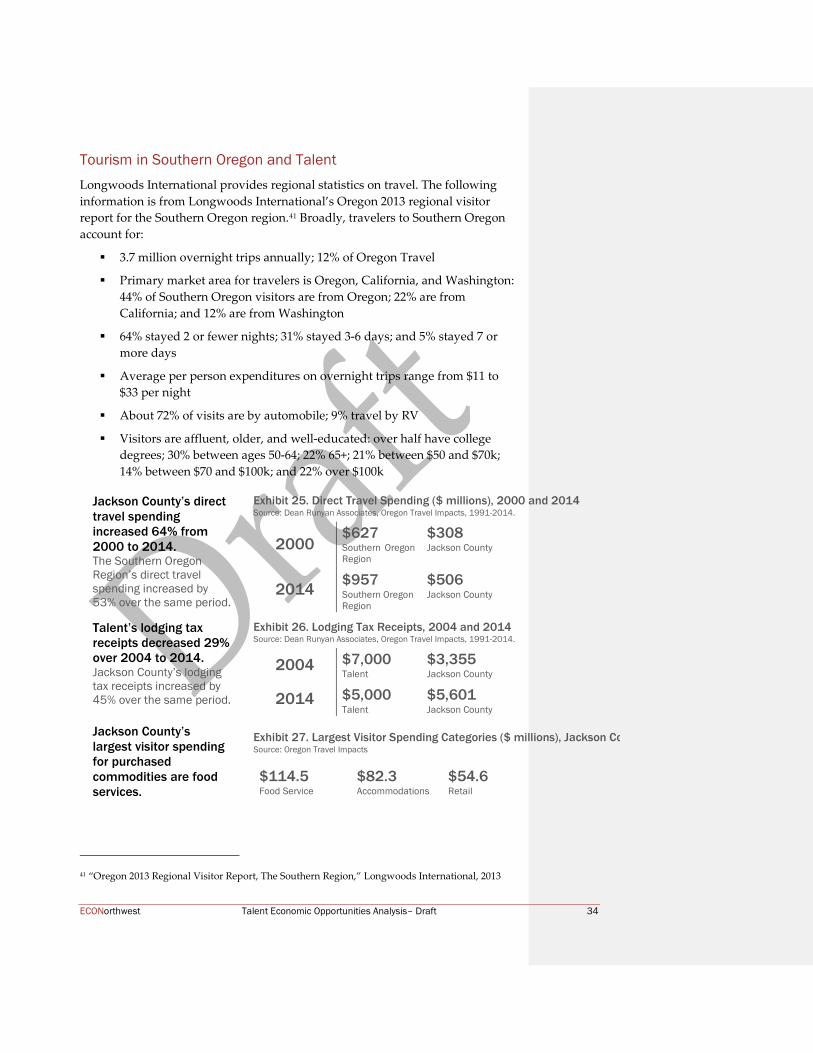
Jackson County’s direct travel spending increased 64% from 2000 to 2014. The Southern Oregon Region’s direct travel spending increased by 53% over the same period.
Exhibit 25. Direct Travel Spending ($ millions), 2000 and 2014 Source: Dean Runyan Associates, Oregon Travel Impacts, 1991-2014.
2000 $627 Southern Oregon Region
$308 Jackson County
2014 $957 Southern Oregon Region
$506 Jackson County
Talent’s lodging tax receipts decreased 29% over 2004 to 2014. Jackson County’s lodging tax receipts increased by 45% over the same period.
Exhibit 26. Lodging Tax Receipts, 2004 and 2014 Source: Dean Runyan Associates, Oregon Travel Impacts, 1991-2014.
2004 $7,000 Talent
$3,355 Jackson County
2014 $5,000 Talent
$5,601 Jackson County
Jackson County’s largest visitor spending for purchased commodities are food services.
Exhibit 27. Largest Visitor Spending Categories ($ millions), Jackson Co Source: Oregon Travel Impacts
$114.5 $82.3 $54.6 Food Service Accommodations Retail
41 “Oregon 2013 Regional Visitor Report, The Southern Region,” Longwoods International, 2013

ECONorthwest Talent Economic Opportunities Analysis– Draft 35
Jackson County’s largest employment generated by travel spending is in the accommodations and food service industry.
Exhibit 28. Largest Industry Employment Generated by Travel Spending, Jackson County, 2014 Source: Oregon Travel Impacts
3,600 jobs 700 jobs 480 jobs Accommodations & Food Service
Arts, Entertainment. & Recreation
Retail

ECONorthwest Talent Economic Opportunities Analysis– Draft 36
Regional Business Clusters One way to assess the types of businesses that are likely to have future growth in an area is to examine relative concentration and employment growth of existing businesses. This method of analysis can help determine relationships and linkages within industries, also called industrial clusters. Sectors that are highly concentrated (meaning there are more than the “average” number of businesses in a sector in a given area) and have had high employment growth are likely to be successful industrial clusters. Sectors with either high concentration of businesses or high employment groups may be part of an emerging cluster, with potential for future growth.
The U.S. Cluster Mapper is a database created by the Harvard Business School and the U.S. Economic Development Administration. It provides a snapshot of the business clusters in Jackson County. The business clusters it identified were:
Business Services. This cluster includes businesses such as consulting services, employment placement services, engineers, architects, and others. In Jackson County, this cluster employed 4,278 people in 2013.
Distribution and Electronic Commerce. This cluster consists of firms providing wholesale of electronic goods, sporting and recreational goods, and professional equipment supplies, among other services. In Jackson County, this cluster employed 2,732 people in 2013.
Transportation and Logistics. This cluster consists of firms providing air transportation, specialties in air transportation, ground transportation support activities, trucking, and bus transportation. In Jackson County, this cluster employed 2,024 people in 2013.
Wood Products. Production of wood components and products, processing wood, and prefabricated wood building continue to be a significant employment cluster in Oregon. Oregon is the dominant producer of softwood plywood, softwood veneer, engineered wood products, and lumber. Emerging forest products include generation of renewable electric energy and producing transportation bio-fuels from woody biomass. In Jackson County, this cluster employed 1,836 people in 2013.
One of Jackson County’s largest business clusters is in business services.
Exhibit 29. Business Clusters in Jackson County, 2013 Source: U.S. Economic Development Administration, U.S. Cluster Mapper 4,278 jobs Business Services
2,732 jobs Distribution & E-Commerce.
2,024 jobs Transportation & Logistics
1,836 jobs Wood Products

ECONorthwest Talent Economic Opportunities Analysis– Draft 37
Outlook for growth in Jackson County Exhibit 30 shows the Oregon Employment Department’s forecast for employment growth by industry for the Rogue Valley Region (Jackson and Josephine Counties) over the 2012 to 2022 period. Exhibit 30 shows employment in the Rogue Valley is forecast to grow at an average annual growth rate of 1.24%.
The sectors that will lead employment in the region for the 10-year period are Private Educational and Health Service (adding 3,750 jobs), Trade, Transportation, and Utilities (2,310), Leisure and Hospitality (1,810), Professional and Health Services (1,550), and Government (1,030). In sum, these sectors are expected to add 10,450 new jobs or about 80% of employment growth in the Rogue Valley Region.
Exhibit 30. Regional Employment Projections, 2012-2022, Rogue Valley Region (Jackson and Josephine Counties)
Source: Oregon Employment Department. Employment Projections by Industry 2012-2022.

ECONorthwest Talent Economic Opportunities Analysis– Draft 38
3.6 Talent’s Competitive Advantages Economic development opportunities in Talent will be affected by local conditions as well as the national and state economic conditions addressed above. Economic conditions in Talent relative to these conditions in other portions of the Southern Oregon region form Talent’s competitive advantage for economic development. Talent’s competitive advantages have implications for the types of firms most likely to locate and expand in the Area.
There is little that metropolitan area jurisdictions can do to influence national and state conditions that affect economic development, though they can influence local factors that affect economic development. Talent’s primary competitive advantages are: location, access to transportation, and quality of life. These factors make Talent attractive to residents and businesses that want a high quality of life where they live and work.
The local factors that form Talent competitive advantage are summarized in the subsections below.
Location Talent is a city with a population of approximately 6,230 people as of 2014, located in Southern Oregon to the southeast of Medford and Phoenix. Interstate 5 runs just along the northeastern boundary of Talent and Highway 99 runs northeast-southeast through the city. Both Interstate 5 and Highway 99 provide access to Ashland in the south as well as Phoenix and Medford up north. Talent’s location will impact the area’s future economic development:
Talent has easy and quick access to the State’s highway system and other transportation opportunities. Interstate 5 is just beyond the northeastern Talent UGB, with Exit 21 taking drivers immediately into the City. Highway 99 is the primary northeast-southeast route through the City, connecting residents and commuters to other Southern Oregon cities. Residents and businesses in Talent have access to other modes of transportation in Medford, including the Medford airport, Greyhound bus service, and Amtrak rail service.
Talent is located within Jackson County, the sixth-most populated county in the State, with 208,375 people in 2014. Talent is about 7.5 miles southeast of Medford via Highway 99, the eighth-most populated city in Oregon with 76,650 people in 2014. Other nearby and relatively large cities include Ashland, Central Point, and Grants Pass.
Residents of Talent have access to cultural activities such as the Camelot Theatre, the annual Harvest Festival, and the City-Wide Yard Sale. Residents also have access to outdoor recreational activities and shopping.

ECONorthwest Talent Economic Opportunities Analysis– Draft 39
Talent’s location, access to Interstate 5, and proximity to larger cities in Southern Oregon such as Medford are primary competitive advantages for economic development in Talent.
Availability of Transportation All firms are heavily dependent upon surface transportation for efficient movement of goods, customers, and workers. Access to an adequate highway and arterial roadway network is needed for all industries. Close proximity to a highway or arterial roadway is critical for firms that generate a large volume of truck or auto trips as well as firms that rely on visibility from passing traffic to help generate business.
Businesses and residents in Talent have access to a variety of modes of transportation: automotive (I-5, 99, and local roads); bus (Greyhound); and air (Medford Airport).
Talent has exceptional automotive access for commuting via I-5, due to its close proximity. Highway 99 runs near Talent’s downtown, which makes moving freight along the highway undesirable from the City’s perspective because of disruption from trucks.
Public Facilities and Services Provision of public facilities and services can impact a firm’s decision regarding location within a region, but ECO’s past research has shown that businesses make locational decisions primarily based on factors that are similar within a region. These factors are: the availability and cost of labor, transportation, raw materials, capital, and amenities. The availability and cost of these production factors are usually similar within a region.
Once a business has chosen to locate within a region, they consider the factors that local governments can most directly affect: tax rates, the cost and quality of public services, and regulatory policies. Economists generally agree that these factors do affect economic development, but the effects on economic development are modest. Thus, most of the strategies available to local governments have only a modest affect on the level and type of economic development in the community.
Water Talent used to own and operate their own potable water system, which served about 6,000 customers. Now, the City obtains most of its water from the Medford Water Commission through the TAP (Talent, Ashland, and Phoenix)
ECONorthwest Talent Economic Opportunities Analysis– Draft 40
transmission main line.42 The transmission line is 24-inches in diameter. Most of the water purchased and transmitted through the TAP pipeline comes directly from Big Butte Springs, which is located near the town of Butte Falls. In addition, Talent receives some of its drinking water from the City of Ashland via the TAP transmission pipeline.43
Despite Talent not operating its personal water source, it does maintain its own storage and distribution system. The distribution system consists of 26 miles of pipeline 4 inches or larger and Talent’s storage is three tanks. Two of the tanks, named Belmont Reservoir #1 and #2, the first of which is larger, can hold up to 1.5 million gallons (MG) of water.44 Most customers of Talents’ water service lie within the City’s limits in addition to the unincorporated, adjacent parts of Jackson County.
Wastewater The City of Talent is provided sanitary sewer services by the Bear Creek Valley Sanitary Authority (BCVSA). The BCVSA has three points to connect the Talent system to the Bear Creek Regional Interceptor and there are two pump stations that move sewage to the Regional Water Reclamation Facility. At this facility, the wastewater is then dumped in the Rogue River.45
42 Water distribution information for Talent can be found on the City’s website at the following web address: http://www.cityoftalent.org/Page.asp?NavID=104. 43 City of Talent’s 2014 Water Quality Report. Retrieved from: http://www.cityoftalent.org/SIB/files/PW/WaterQualityReport2014.pdf. 44 Information on Talent’s current storage and distribution system can be located on the City’s website at the following web address: http://www.cityoftalent.org/Page.asp?NavID=104. 45 City of Talent’s Comprehensive Plan, Effective September 9th, 2015. Retrieved from: http://www.cityoftalent.org/SIB/files/Planning/Development_Codes/Comprehensive%20Plan%20(Effective%209-5-15).pdf.
Commented [ZM1]: Not sure this information is correct. BCVSA is now RVS, but not sure about infrastructure statements.

ECONorthwest Talent Economic Opportunities Analysis– Draft 41
Quality of Life Quality of life is difficult to assess because it is subjective—different people will have different opinions about factors that affect quality of life, desirable characteristics of those factors, and the overall quality of life in any community. Economic factors such as income, job security, and housing cost are often cited as important to quality of life. These economic factors and overall economic conditions are the focus of this report, so this section will focus on non-economic factors that affect quality of life.
Talent’s quality of life is a key comparative advantage for economic development. Key quality of life factors in Talent are:
Outdoor recreational activities. There are a number of outdoor recreational opportunities available in surrounding Jackson County, including: hiking, fishing and boating on the Rogue River, the Bear Creek Greenway (which runs along the Bear Creek from Ashland to the Rogue River), skiing, and other activities.
Ease of auto access. Both Highway 99 and Interstate 5 connect Talent to Medford and Ashland. Although some of the roads in the region suffer from congestion, Jackson County has excellent automobile access, especially to I-5.
Cultural amenities and events. Residents of Talent have access to cultural amenities in Talent, such as the Camelot Theatre and events in nearby cities, and rural Jackson County, such as museums and wine tasting and vineyard activities. The County is home to a number of events, including: the Shakespeare Festival, the Britt Music Festival, the Jackson County Fair, and other events.
Access to higher education. Southern Oregon University, located in Ashland, and Rogue Community College, located in Medford and White City, provide access to higher education to residents of Talent and the rest of the County.
Access to medical care. Residents of Talent can access medical care through two regional medical centers: the Rogue Valley Medical Center, and the Providence Medford Medical Center.
Talent’s quality of life makes the City attractive to in-migrants and businesses that are attracted to Jackson County.

ECONorthwest Talent Economic Opportunities Analysis– Draft 42
3.7 Talent’s Strengths, Weaknesses, Opportunities and Threats for Economic Development
Based on the discussion above and discussion with stakeholders in Talent, the following are the city’s strengths, weaknesses, opportunities and threats for Economic Development.
Strengths Access to I-5. Talent has excellent transportation access to the State’s
highway network through its proximity to I-5. Being adjacent to I-5 makes it easy to commute to and from Talent and provides access to the nearby cities of Medford and Ashland.
Existing businesses. Talent many small businesses in a range of industries from manufacturing to retail trade to health care. Talent’s existing businesses provide a base to build new businesses that bring needed services or goods to the city for residents, other businesses, or visitors.
Walkable downtown. Talent’s existing downtown is pedestrian-friendly downtown. The City has plans for continuing to develop in downtown, with relocation of the Irrigation District offices. Physically active community members among a walkable community provide a higher quality of life.
Arts and culture. Talent has an arts community that includes small business owners, artists, and musicians. Residents of Talent have access to cultural activities such as the Camelot Theatre, the annual Harvest Festival, and the City-Wide Yard Sale.
Agriculture. Talent is located in a rich agricultural region, with diverse offering of agricultural products including fruits, cattle, wine, and nursery plants. The nearby agricultural activity provides inputs for locally produced food and beverage products.
Relatively affordable housing. In comparison with nearby cities, Talent’s real estate market is relatively affordable.
Regional access to workforce. Talent’s location within the Rogue Valley gives the City’s businesses access to a pool of experienced professionals. Higher education establishments in the region provide training for young and lower skilled workers.
High quality of life. Talent’s small-town feel and close proximity to outdoor recreation activities make it a desirable place to live.

ECONorthwest Talent Economic Opportunities Analysis– Draft 43
Weaknesses Need for downtown redevelopment. Talent’s downtown business
district has vacant buildings, and business growth has been stagnant.
Lack of cohesive economic development planning and marketing. The City currently lacks an economic development strategy and brand for attracting and retaining new businesses and growing small businesses.
Distance from major airport and markets. Although Talent has excellent automotive access through I-5, it is far from any major airports, which is a weakness for attracting businesses that need frequent access to flying. Talent is also remote from the major markets along I-5 (e.g., Portland).
Small base of business. Talent’s employment base is relatively small in comparison to Medford and Ashland. Some types of businesses, such as big box stores or banks, are less likely to locate in Talent because of the small population base and relatively close proximity of larger cities with retail and personal services.
Challenging regulatory climate for business growth. Talent has relatively high fees for new development and System Development Charges (SDCs). In addition, there is a lack of incentives for new businesses.
Opportunities (Re)develop vacant buildings and land. Talent’s supply of vacant land
and affordable real estate prices offer a number of opportunities for redevelopment, particularly in commercial areas near downtown.
Improve services for tourists. Offering additional services for tourists, such as a hotel, could help Talent grow its tourism market and capitalize on its proximity to Ashland. Talent currently lacks services to support overnight visitors.
Improve rail access. Talent’s proximity to rail and I-5 could support growth in manufacturing, warehousing, and other freight shipping industries.
Expand arts and agricultural businesses. Talent’s arts and agricultural businesses could be target industries for the City. In particular, Talent could focus on expanding production and processing of local agricultural products, for example by creating spaces for food trucks.
Improve workforce training opportunities. Nearby higher educational institutions like Southern Oregon University and Rogue Community College provide an opportunity for Talent to gain a more highly-trained workforce.

ECONorthwest Talent Economic Opportunities Analysis– Draft 44
Threats National and regional economic cycles. Talent, like all other cities, is
subject to national and regional economic cycles. The 2007-2009 recession negatively affected Talent, with downsizing or closure of businesses in Talent.
Difficulty attracting highly skilled workers. Businesses in Talent may have difficulties attracting and retaining skilled workers, both for production jobs and for jobs requiring higher education. This problem is not unique to Talent and businesses in most smaller cities in Oregon have a similar problem. This problem is worse in small cities in relatively small regions, such as the Rogue Valley, where it can be difficult for families to move to the region if jobs are not available to both adults in the household.