Embed Size (px)
Citation preview
Facilities Management
Quarterly Strategic Planning Report
First Quarter – Fiscal Year 2016
July – September 2015
…Creating a Campus of Distinction

Goal 1 - Continuously Improve Operation of Campus Facilities
Goal 2 - Create a Reliable and Sustainable Physical Infrastructure
Goal 3 - Foster a Customer Focused Organization
Goal 4 - Recruit, Develop, and Retain Quality Employees
Goal 5 - Promote Good Stewardship
Facilities Management
…Creating a Campus of Distinction
Strategic Planning Session Facilities Management’s Goals
GOAL #1
Continuously Improve Operations of Campus
"In business, words are
words, explanations are
explanations, promises are
promises, but only
performance is reality."
-- Harold Geneen, industrialist

GOAL #1 – Continuously Improve Operations of Campus Facilities Objective: 1.1: Improve Labor Availability Tactic: 1.1.1: Maintain “Wrench” Time at 70%
ACTION PLAN
4
Lead
F. O.
Actions Planned 1. Daily assignment; coordinating and monitoring of work effort.
2. Continue assignment of lead technician in absence of supervisor.
3. Supervisors and Managers weekly assignment; “Manage by Walking around.”
4. Continue to work with Zones and Shops to increase efficiencies.
5. Work with FBO and FIS to finalize RFP “Work Order Process Improvement”
Actions Completed 1. Weekly review of work assignment completion.
2. Completed initial training in all Zones “Operating like a business.”

Facilities Management Strategic Planning Session – First Quarter FY 2016 GOAL #1 – Continuously Improve Operations of Campus Facilities Objective: 1.1: Improve Labor Availability Tactic: 1.1.1: Maintain “Wrench” Time at 70% Measure: Hours (total hours charged to work requests divided by total hours recorded) Lead: Facilities Operations Balanced Scorecard Category: Internal Business Process
Lead
F. O.
5
STATUS
0.0%
10.0%
20.0%
30.0%
40.0%
50.0%
60.0%
70.0%
80.0%
FY 15Annual Average
1st Qtr FY16 2nd Qtr FY16 3rd Qtr FY16 4th Qtr FY16
79.2%
60.0%
0.0% 0.0% 0.0%
Wrench Time
Goal = MaintainWrench Time at70%

GOAL #1 – Continuously Improve Operations of Campus Facilities Objective: 1.2: Improve Logistics Efficiency Tactic: 1.2.1: Improve Non-stock on-time delivery to 95% Tactic: 1.2.2: Reduce Average Non-stock Requisition to Receipt Time to 3.5 Days
ACTION PLAN
6
Lead
F. O.
Actions Planned
1. Weekly review of items that have been ordered repeatedly as non-stock items to stock as order-on-request items (carried at an inventory level of “zero” but pre-sourced for faster ordering and delivery). Monitor daily tracking of long lead items and spikes in usage (historically the main causes for inability to fill).
2. Continue to send out daily email reminders for approvers (Supervisors, Admins and Managers).
3. Monitor the req to PO processing time and discuss weekly.
Actions Completed
1. Promoted the continued use of SDI Punch-out.
2. Assigned additional approvers to help expedite the process.

Facilities Management Strategic Planning Session – First Quarter FY 2016
GOAL #1 – Continuously Improve Operations of Campus Facilities Objective: 1.2: Improve Logistics Efficiency Tactic: 1.2.2: Reduce Average Non-stock Requisition to Receipt Time to 3.5 Days Measure: Average Days from requisition to receipt (SDI KPI – Non-stock Requisition to Receipt Time) Lead: Facilities Operations Balance Scorecard Category: Internal Business Process
7
Lead
F. O.
STATUS 0.00
1.00
2.00
3.00
4.00
5.00
6.00
FY15Annual Average
1st Qtr FY16 2nd Qtr FY16 3rd Qtr FY16 4th Qtr FY16
5.08
4
0 0 0
Reduce Average Non-stock Requisition to Receipt Time
Goal 3.5 Days
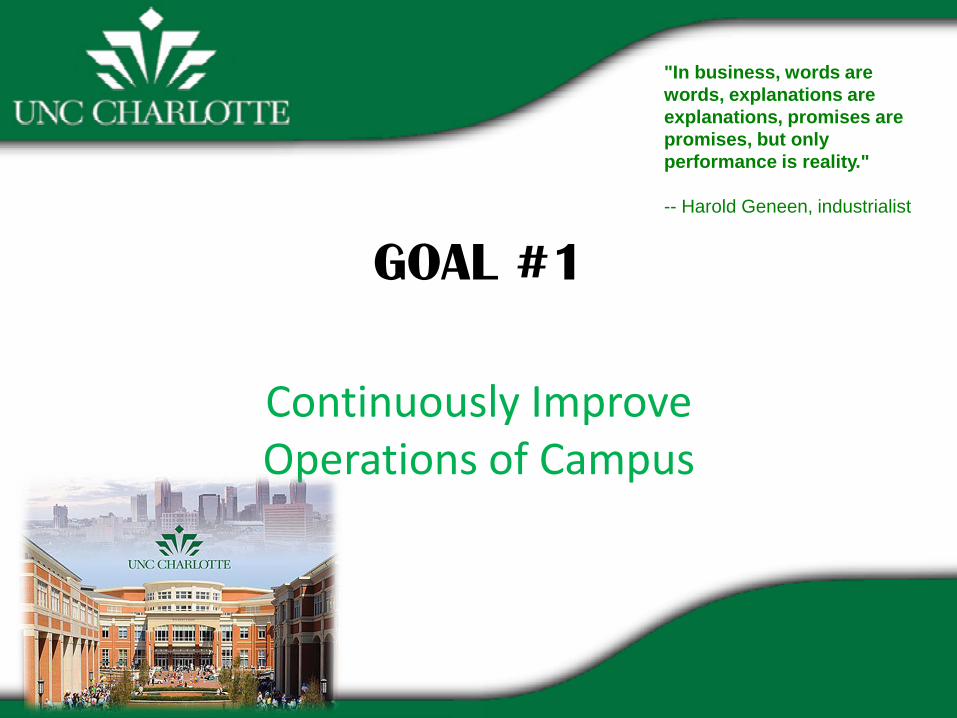
GOAL #1 – Continuously Improve Operations of Campus Facilities Objective: 1.3: Improve Work Request Process Tactic: 1.3.1: Decrease Number of Work Orders Over 14 Days Old by 15% Tactic: 1.3.2: Decrease Work Request Cycle Time by 10% Measure: Hours from Work Request Submitted to Work Complete (APPA Benchmark)
ACTION PLAN
8
Lead
F. O.
Actions Planned
1. Bi-weekly review of recurring services and scheduled services currently being completed using PM work request..
2. Emphasize Facilities Operations OP-16 Timely and Accurate Handling/Processing of WRs.
3. Weekly meeting with Zone Supervisors to monitor 30 day report.
4. Communicate work order priorities (Quarterly Customer, Building Liaison and specific College Meetings); implemented Sept 2015.
5. Supervisors meeting with technicians on a daily basis.
Actions Completed
1. Communicated work order priorities (Quarterly Customer, Building Liaison and specific College Meetings); implemented July 2014.
2. Reviewed recurring services and scheduled services currently being completed using PM work requests; August 2014.

Facilities Management Strategic Planning Session – First Quarter FY 2016
GOAL #1 – Continuously Improve Operations of Campus Facilities Objective: 1.3: Improve Work Request Process Tactic: 1.3.1: Decrease Number of Work Orders Over 14 Days Old by 15% Measure: Number of open reactive work orders over 14 Days from request (excluding scheduled work orders)
Lead: Facilities Operations Balance Scorecard Category: Customer Perspective
9
Lead
F. O.
100
300
500
700
900
1100
1300
1500
1700
1900
2100
2300
2500
FY15Annual Average
1st Qtr FY16 2nd Qtr FY16 3rd Qtr FY16 4th Qtr FY16
1048
2017
0 0 0
Number of Work Orders Over 14 Days
Goal equals< 15% (891)
STATUS
Facilities Management Strategic Planning Session – First Quarter FY 2016
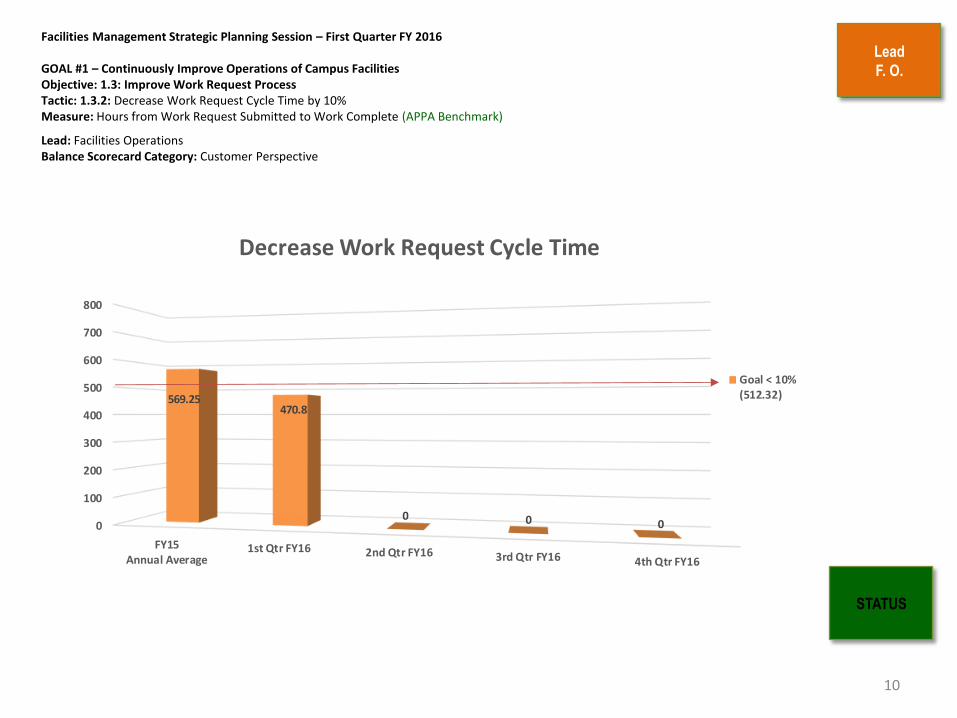
GOAL #1 – Continuously Improve Operations of Campus Facilities Objective: 1.3: Improve Work Request Process Tactic: 1.3.2: Decrease Work Request Cycle Time by 10% Measure: Hours from Work Request Submitted to Work Complete (APPA Benchmark)
Lead: Facilities Operations Balance Scorecard Category: Customer Perspective
10
STATUS
Lead
F. O.
0
100
200
300
400
500
600
700
800
FY15Annual Average
1st Qtr FY16 2nd Qtr FY16 3rd Qtr FY16 4th Qtr FY16
569.25470.8
0 0 0
Decrease Work Request Cycle Time
Goal < 10%(512.32)

GOAL #1 – Continuously Improve Maintenance and Operations Objective: 1.4: Improve BES Processes Tactic 1.4.1: Achieve APPA Level 2 in 98% of Buildings
ACTION PLAN
• Actions Completed
– Began routine process of EDA Inventory Count (6/2015)
– (OS1) Boot-camp Part II (8/2015)
– Simon Institute Symposium (8/9/2015 – 8/12/2015)
– Implemented new Daily Task Process at Center City (9/2015)
– Janitor University – sent 3rd BES Group (9/29/2015 – 10/1/2015)
– Building Audit Inspections (10/2015)
• Actions Planned
– Update Hiring Process/Flow Chart (10/2015)
– Full utilization of Daily Logs by Zone Supervisors and Lead Technicians (11/2015)
– (OS1) Boot-camp Part III (12/2015)
– Implement new quarterly self-audit process in Archibus – Monthly inspection of PMs per building (12/2015)
– Develop In-service training curriculum and matrix (12/2015)
– Develop Standard Operating Procedures Manual (SOP) for BES&R (12/2015)
11
Lead BES

Facilities Management Strategic Planning Session – First Quarter FY 2016
GOAL #1 – Continuously Improve Maintenance and Operations of the Campus Objective: 1.4: Improve BES Processes Tactic 1.4.1: Achieve APPA Level 2 in 98% of Buildings Measure: Percentage of buildings meeting APPA Level 2 cleanliness standards during quarterly inspection (APPA Benchmark) Lead: Building Environmental Services Balanced Scorecard Category: Customer Perspective
Lead BES
12
STATUS
Percentage = 62%
0%
20%
40%
60%
80%
100%
FY15-2nd QTRFY15-3rd QTR
FY15-4THQTR FY16-1st
QTR
82% 90% 95%
62%
APPA LEVELS
Lead BES
13
0%
1%
2%
3%
4%
5%
6%
7%
8%
9% 8% 8%
9%
6%
9%
8%
Pe
rce
nta
ge
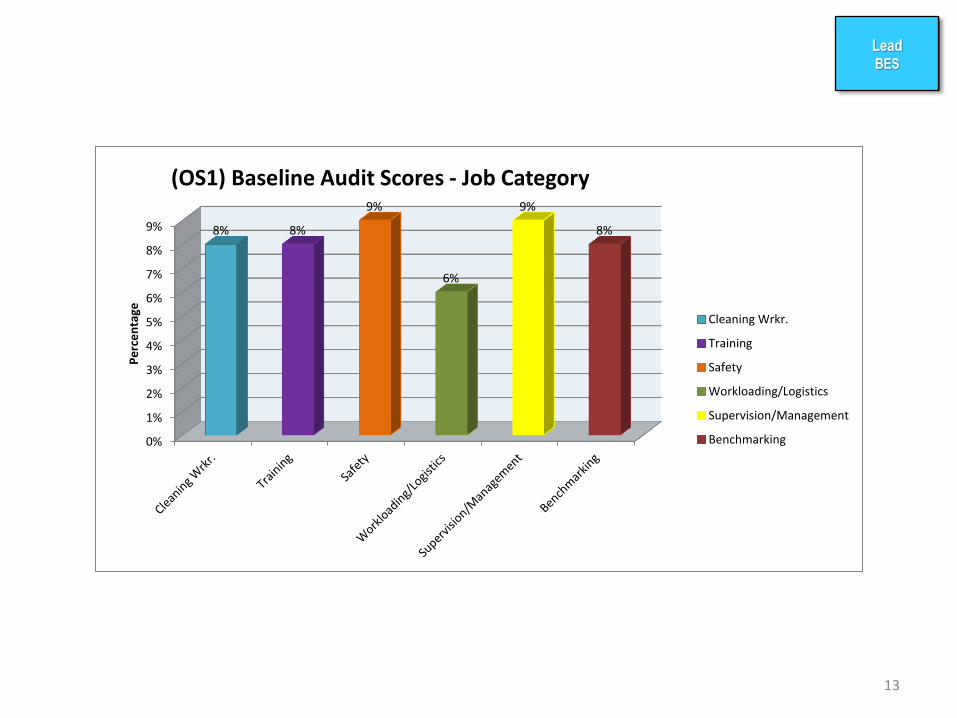
(OS1) Baseline Audit Scores - Job Category
Cleaning Wrkr.
Training
Safety
Workloading/Logistics
Supervision/Management
Benchmarking

Lead BES
14
0
10
20
30
40
50
60
70
80
13 8
12 12 11 6 8
80
Pe
rce
nta
ge
(OS1) Baseline Audit Scores - Organization Comparison
UNC Chapel Hill
U Mich
WFU
MSU
MT SAC
Provo School District
UNC Charlotte
STANDARD

GOAL #1 – Continuously Improve Operation of Campus Facilities Objective: 1.5: Improve Facility Systems Reliability Tactic: 1.5.1: Improve Completion of Preventative Maintenance Work Requests to 90% Tactic: 1.5.2: Decrease number of Unscheduled Equipment Replacement Projects to less than 2 incidents per quarter Tactic: 1.5.3: Fewer than 5 unscheduled outages per quarter Tactic: 1.5.4: Improve Ratio of Preventive/Predictive work requests to reactive request to 50%
ACTION PLAN
Actions Planned
1. Reorganize PM Program; Hire PM Supervisor (November 2015)
2. Complete conversion from old PM Module to new PM Module.
3. Continue expansion of PM Program and predictive maintenance program. Work with key customers.
4. Continue to review CRDM Project List. Identify and prioritize equipment conditions and needs, for replacement. Indicate urgency and recommend future funding dates.
5. Re-emphasize the Customer Handbook, get out and see the customer; swiftly and accurately report outages.
Actions Completed
1. Incorporate FCAP inspection process into CRDM and Daily Operations
15
Lead
F. O.

Facilities Management Strategic Planning Session – First Quarter FY 2016 GOAL #1 – Continuously Improve Operations of Campus Facilities Objective: 1.5: Improve Facility Systems Reliability Tactic: 1.5.1: Improve Completion of Preventative Maintenance Work Requests to 90% Measure: Percentage of Preventive Maintenance Work Requests Completed
Lead: Facilities Operations Balance Scorecard Category: Internal Business Process
16
Lead
F. O.
STATUS
0.0%
10.0%
20.0%
30.0%
40.0%
50.0%
60.0%
70.0%
80.0%
90.0%
100.0%
FY15Annual Average
1st Qtr FY16 2nd Qtr FY16 3rd Qtr FY16 4th Qtr FY16
83.3%85.7%
0.0% 0.0% 0.0%
Improve Completion of PM Work Orders
Goal to 90%

Facilities Management Strategic Planning Session – First Quarter FY 2016
GOAL #1 – Continuously Improve Operations of Campus Facilities Objective: 1.5: Improve Facility Systems Reliability Tactic: 1.5.2: Decrease number of Unscheduled Equipment Replacement Projects to less than 2 incidents per quarter Measure: Number of Unscheduled Equipment Replacement Projects
Lead: Facilities Operations Balance Scorecard Category: Internal Business Process
17
Lead
F. O.
STATUS
0.0
0.5
1.0
1.5
2.0
2.5
3.0
3.5
4.0
FY15Annual Average
1st Qtr FY16 2nd Qtr FY16 3rd Qtr FY16 4th Qtr FY16
0.5
2.0
0.0 0.0 0.0
Unscheduled Equipment Replacement Projects
Goal = Less than2 incidents perquarter
Facilities Management Strategic Planning Session – First Quarter FY 2016
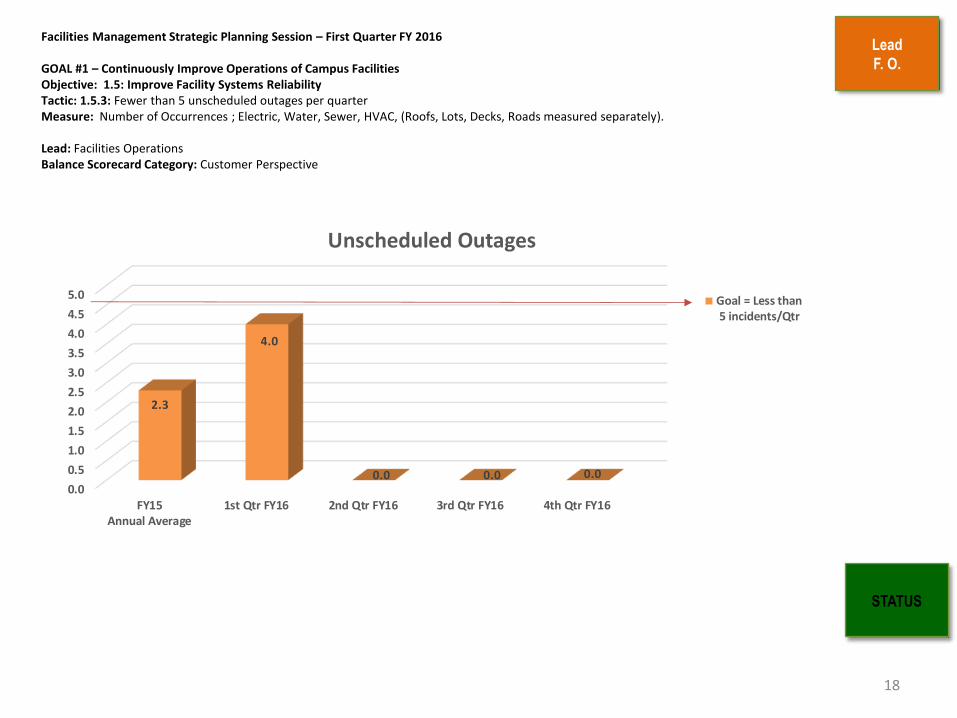
GOAL #1 – Continuously Improve Operations of Campus Facilities Objective: 1.5: Improve Facility Systems Reliability Tactic: 1.5.3: Fewer than 5 unscheduled outages per quarter Measure: Number of Occurrences ; Electric, Water, Sewer, HVAC, (Roofs, Lots, Decks, Roads measured separately). Lead: Facilities Operations Balance Scorecard Category: Customer Perspective
18
Lead
F. O.
STATUS
0.0
0.5
1.0
1.5
2.0
2.5
3.0
3.5
4.0
4.5
5.0
FY15Annual Average
1st Qtr FY16 2nd Qtr FY16 3rd Qtr FY16 4th Qtr FY16
2.3
4.0
0.0 0.0 0.0
Unscheduled Outages
Goal = Less than 5 incidents/Qtr

Facilities Management Strategic Planning Session – First Quarter FY 2016
GOAL #1 – Continuously Improve Operations of Campus Facilities Objective: 1.5: Improve Facility Systems Reliability Tactic: 1.5.4: Improve Ratio of Preventive/Predictive work requests to reactive request to 50% Measure: Percentage (Number of completed reactive work requests divided by total number of completed work requests including PM and Predictive work requests) (APPA Benchmark)
Lead: Facilities Operations Balance Scorecard Category: Customer Perspective
19
Lead
F. O.
STATUS
0.0%
10.0%
20.0%
30.0%
40.0%
50.0%
60.0%
FY15Annual Average
1st Qtr FY16 2nd Qtr FY16 3rd Qtr FY16 4th Qtr FY16
50.1% 52.2%
0.0% 0.0% 0.0%
Improve Ratio of Preventive/Predictive Work Requests
Goal = ImproveRatio to 50%

GOAL #2
Create a Reliable and Sustainable Physical Infrastructure
"People with goals
succeed because they
know where they're going"
-- Earl Nightingale,
Motivational Speaker

Lead
FIS
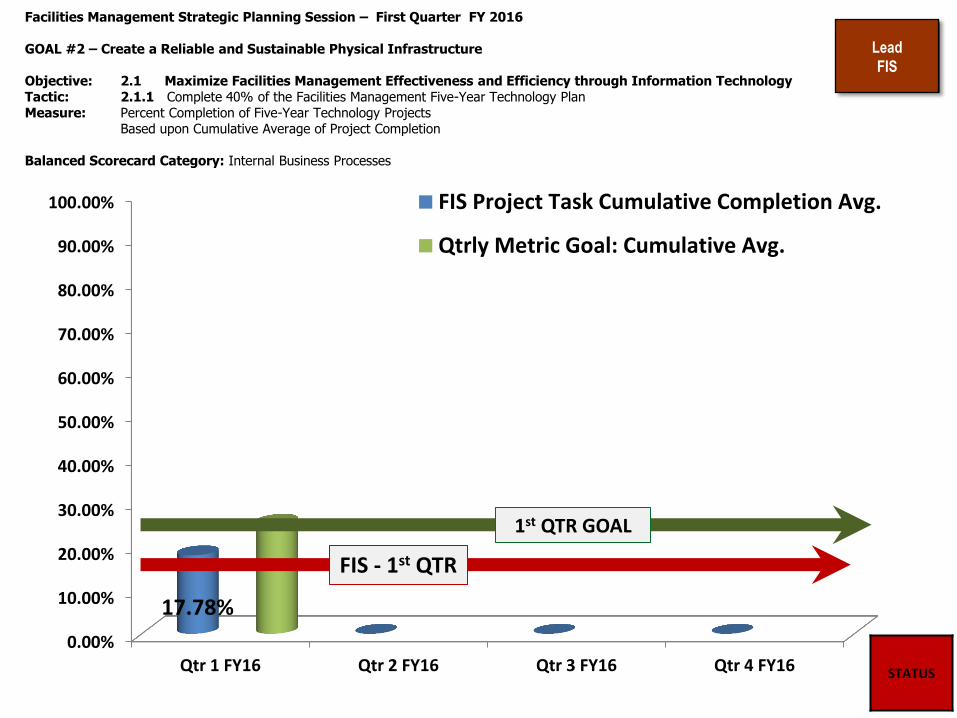
GOAL #2 – Create a Reliable and Sustainable Physical Infrastructure Objective: 2.1 Maximize Facilities Management Effectiveness and Efficiency through Information Technology Tactic: 2.1.1 Complete 40% of the Facilities Management Five-Year Technology Plan
ACTION PLAN
Actions Planned: 1. Migrated Primavera to State Construction Nov 2015. 2. Deploy and Test ARCHIBUS Mobile Space Survey Nov 2015. 3. Complete Testing and Go Live with Mobile Map Utilities Nov 2015. 4. Finalize and Test Space Management GIS Setup by Nov 15, 2015. 5. Complete 25% of Building Space Audits by Dec 31, 2015. 6. Go Live with Project Customer Moodle 2 training by Dec 31, 2015. 7. Complete Belk Gym BIM project by Jan 15, 2016. 8. Work with ITS to begin Set up for ImageNOW Capital Document
Management and Schedule Capital Training by Jan 31, 2016. 9. Finalize Real Estate Lease application updates by Nov 30, 2015. 10. Complete SDI Enhancements/WR part update notifications Dec 30, 2015. 11. Complete Avigilon NVR Upgrade by Dec 31, 2015. 12. Deploy/Test New BAS Upgrade (N4) by Dec 1, 2015. 13. Complete Additional Open Options Script Improvements for faster data
pull and craftsperson data by Dec 31, 2015.

Lead
FIS
GOAL #2 – Create a Reliable and Sustainable Physical Infrastructure Objective: 2.1 Maximize Facilities Management Effectiveness and Efficiency through Information Technology Tactic: 2.1.1 Complete 40% of the Facilities Management Five-Year Technology Plan
ACTION PLAN
Actions Completed: 1. Completed and Went Live with all requested Design Services
Enhancements.
2. Completed GIS Mobile Utilities Mapping Project.
3. Finalized/Went Live with Motor Fleet Customer Module Moodle2 Training.
4. Scheduled/Completed ImageNOW training for Design personnel.
5. Completed Archive Drawing ImageNOW Phase 1 project.
6. Completed new Space Survey Views for Space Building Auditing process.
7. Completed Open Options Scripting Improvements by Adding Additional Employee information.
0.00%
10.00%
20.00%
30.00%
40.00%
50.00%
60.00%
70.00%
80.00%
90.00%
100.00%
Qtr 1 FY16 Qtr 2 FY16 Qtr 3 FY16 Qtr 4 FY16
17.78%
FIS Project Task Cumulative Completion Avg.
Qtrly Metric Goal: Cumulative Avg.
Facilities Management Strategic Planning Session – First Quarter FY 2016 GOAL #2 – Create a Reliable and Sustainable Physical Infrastructure Objective: 2.1 Maximize Facilities Management Effectiveness and Efficiency through Information Technology Tactic: 2.1.1 Complete 40% of the Facilities Management Five-Year Technology Plan Measure: Percent Completion of Five-Year Technology Projects Based upon Cumulative Average of Project Completion Balanced Scorecard Category: Internal Business Processes
Lead
FIS
STATUS
1st QTR GOAL
FIS - 1st QTR

Facilities Management Strategic Planning Session – First Quarter FY 2015
GOAL #2 – Create a Reliable and Sustainable Physical Infrastructure
Objective: 2.1 Maximize Facilities Management Effectiveness and Efficiency through Information Technology Tactic: 2.1.1 Complete 40% of the Facilities Management Five-Year Technology Plan Measure: Percent Completion of Five-Year Technology Projects Project Status Completion Percentage Balanced Scorecard Category: Internal Business Processes
Lead
FIS
0.00%
10.00%
20.00%
30.00%
40.00%
50.00%
60.00%
70.00%
80.00%
90.00%
100.00%
FY16 Q4
FY16 Q3
FY16 Q2
FY16 Q1
STATUS

FM Prioritized Projects – FY16 1. ARCHIBUS Real Estate Leases and Suites – Estimated Completion Nov 2015
2. Access and Key Management – Roll over; New Estimated Completion Oct 2015
3. Space Audit, Approvals and Occupancy – Roll Over; New Estimated Completion Jan 2016
4. ARCHIBUS State Construction Interscope Integration – Estimated Completion Feb 2015
5. Building Automation System (BAS) Website Updates – Estimated Completion May2016
6. ImageNOW Phase 2: Capital Document Management – Estimated Completion Jan 2016
7. Mobile Recycling – Estimated Completion Oct 2015
8. ARCHIBUS Mobile Proof of Concept – Roll over; New Estimated Completion Aug 2015
9. Mobile Equipment Survey – Roll over; New Estimated Completion Jan 2016
10. Mobile Space Inventory – Roll over; New Estimated Completion Oct 2015
11. Mobile Map Utilities Field Units – Roll Over; New Estimated Completion Jul/Aug 2015
12. Mobile PM & WR for IPad – Estimated Completion May 2016
13. ARCHIBUS Moodle 2 Training – Motor Fleet, Project Customer, FAM and Key Customer
14. GIS Departmental Map Search – Estimated Completion May 2016
15. NVR Upgrade Phase 2 – Estimated Completion Apr 2016
16. GIS Construction Outage Alerts/Notifications - Estimated Completion Nov 15, 2015
17. GIS Wayfinding Digital Signage System Estimated Completion March 2016
18. Mobile Door Inventory – Roll Over; Estimated Completion May 2016
19. ARCHIBUS Work Order Process Reinvention Support – Estimated Completion Mar 2016
20. GIS Live Planning Master Plan Map – Estimated Completion May 30, 2016
21. JIRA FIS Project Management – Estimated Completion Apr 2016
22. BIM Belk Gym – Roll over; Estimated Completion Aug 2015
23. GIS Space Mgmt. Set Up – Estimated Completion Aug 2015
24. SDI Enhancements – Roll Over; New Estimated Completion Nov 2015
25. Neo Terra Radio – Estimated Completion Jan 1, 2016
26. ARCHIBUS Training Work flow – Estimated Completion May 2016
27. ARCHIBUS Testing Framework – Estimated Completion April 2016
28. ARCHIBUS Shibboleth – Estimated Completion May 15, 2016
29. Open Options Scripting Updates – Estimated Completion Dec 31, 2015

NEW IMPROVEMENTS
Reduce and Eliminate Paper Processes – Requires interface assistance with FIS:
Convert Scope & Budget to format in Archibus similar to Estimating Workbook.
Timeline: FY16 QTR 2 – DESIGN SERVICES TESTING PHASE IS NOW ONGOING
Convert Excel Purchase Requisition (PR) to Archibus PR. Timeline: On Hold
Updates to Estimating Workbook to improve Contingency and Fee calculations.
Timeline: FY15 QTR 4 – UPDATED AND PROVIDING ACCURATE CALCULATIONS
26
ACTION PLANS FOR IMPROVEMENT
GOAL #2 – Create a Reliable and Sustainable Physical Infrastructure Objective: 2.2: Improve Informal Project Design and Construction Process Lead: Design Services Balanced Scorecard Category: Internal Business Process
Customer Orientation for Design Services Processes and Archibus Design Services Project Management: Customer meetings to help our Customers understand our processes – Project entry, approvals, timelines, SCO, etc.
Timeline: FY16 QTR 2 - FY16 QTR 4 – Work In Progress
Tactic 2.2.1: 95% of All Construction Projects Meet Scheduled Beneficial Occupancy Date (BOD) Measure: Percentage (Number of Construction Projects completed on or before delivery date divided by total number of project completed.) Tactic 2.2.2: Review Project Capacity - Goal 250 projects per year. Measure: Number of Projects Completed (Annual Goal)
Continue ongoing efforts to assign Classroom Capacity and provide ADA egress information per building.
ONGOING IMPROVEMENTS
Lead Design Services

GOAL #2 – Create a Reliable and Sustainable Physical Infrastructure Objective: 2.2: Improve Informal Project Design and Construction Process Lead: Design Services Balanced Scorecard Category: Internal Business Process
27
Lead Design Services
Tactic 2.2.1: 95% of All Construction Projects Meet Scheduled Beneficial Occupancy Date (BOD) Measure: Percentage (Number of Construction Projects completed on or before delivery date divided by total number of project completed.)
87.0% 92.3% 89.3%96.3% 96.4% 95.5% 95.4%
0.0%
95%
85%
FY09 FY10 FY11 FY12 FY13 FY14 FY15 Q 1 Q 2 Q 3 Q 4 FY16
STATUS
GOAL ALERT
QUARTERLY
REVIEWNo. Of Projects
Projects
Occupied by
scheduled date
Projects not
Occupied by
scheduled date
Percent
FY09 115 100 15 87.0%
FY10 182 168 14 92.3%
FY11 224 200 24 89.3%
FY12 240 231 9 96.3%
FY13 139 134 5 96.4%
FY14 221 211 10 95.5%
FY15 216 206 10 95.4%
Q 1 19 18 1 94.7%
Q 2 0 0 0 0.0%
Q 3 0 0 0 0.0%
Q 4 0 0 0 0.0%
FY16 STATUS 19 18 1 94.7%
95% of All Construction Projects Meet Scheduled
Beneficial Occupancy Date (BOD)
STATUS GOAL STATUS
94.7% 95.0% 94.7%
1st QRTANNUALYTD
GOAL #2 - Create a Reliable and Sustainable Physical Infrastructure Objective 2.3: Develop a Comprehensive Capital Renewal/Deferred Maintenance (CRDM) Program Tactic 2.3.1: Refine FCI tracking method to illustrate changes over time (by quarter) and use this information as a tool for recommending projects to improve campus FCI by 5% NLT March 2016. Lead: Facilities Planning Balanced Scorecard Category: Internal Business Process
28
STATUS
ACTION PLAN
o Continue to update CRDM data (ongoing)
o Integrate feedback from users of map and master list (ongoing)
o Update FCI tracker by building to capture FCAP changes and project completions to calculate movement in FCI (ongoing)
o Provide status and recommendations to attain a 5% improvement (July 2016)
Lead
Facilities
Planning

Facilities Management Strategic Planning Session – First Quarter FY 2016 GOAL #2 - Create a Reliable and Sustainable Physical Infrastructure Objective 2.3: Develop a Comprehensive Capital Renewal/Deferred Maintenance (CRDM) Program Tactic 2.3.1: Refine FCI tracking method to illustrate changes over time (by quarter) and use this information as a tool for recommending projects to improve campus FCI by 5% NLT March 2016. . Measure: Average Building FCI for campus Lead: Facilities Planning Balanced Scorecard Category: Internal Business Process
Lead
Facilities
Planning
29
Status
Percentage of Completion 1
st Q
tr
FY 1
6
1.0 .9 .8 .7 .6 .5 .4 .3 .2 .1 0
4th
Qtr
FY
16
50%
2n
d Q
tr
FY 1
6
3rd
Qtr
FY
16

GOAL #2 - Create a Reliable and Sustainable Physical Infrastructure Objective 2.4: Improve Campus Space Planning and Utilization Tactic 2.4.1: Assignable square footage of space allocation for specific room uses for new and renovation projects will be
within +/- 10% of recommended range. Measure: Measure Assignable Square Feet of allocated space compared to recommended guideline and metric. Lead: Space Management Balanced Scorecard Category: Internal Business Process
30
STATUS
ACTION PLAN
o Conduct physical audit of all campus space Fall 2015
o Develop Space Guidelines – incorporate in Space Management Policy
o Develop Metrics for Room Use Categories based on national standards
o Assess current utilization of space associated with UNC Charlotte science programs (engage consultant)
o Assess current utilization of space associated with UNC Charlotte science programs (engage consultant)
o Develop recommendations for space use for existing and future science space (instructional labs, research labs, faculty and staff office space)
o Assess proposed space use for new construction and renovation projects to evaluate alignment with accepted metrics
Lead
Space
Management

• Status
o Tactic was transitioned from Planning to Space Management in August 2015
o Physical audit is underway
o Space Guidelines - included in draft of proposed revisions to Space Policy
o Establish Metrics for Room Use Categories – not started
o RFP for Science Space Utilization Study due Nov. 3, 2015
GOAL #2 - Create a Reliable and Sustainable Physical Infrastructure Objective 2.4: Improve Campus Space Planning and Utilization Tactic 2.4.1: Assignable square footage of space allocation for specific room uses for new and renovation projects will be
within +/- 10% of recommended range. Measure: Measure Assignable Square Feet of allocated space compared to recommended guideline and metric. Lead: Space Management Balanced Scorecard Category: Internal Business Process
31
STATUS
Lead
Space
Management

GOAL #2 - Create a Reliable and Sustainable Physical Infrastructure Objective 2.5: Improve the Capital Planning and Design Process Tactic 2.5.1: Develop Lifecycle cost analysis and funding process for capital projects (Action Plan only) Lead: Facilities Planning Balanced Scorecard Category: Internal Business Process
32
STATUS
ACTION PLAN ONLY
o Sustain current process of completing Operating Budget sheets
for new projects
o Support Capital, when required, with further study related
to funding (e.g. Health and Wellness Center, etc. work)
o Complete for projects Science Building, to date
Lead
Facilities
Planning

Lead
Capital
GOAL #2 – Create a Reliable and Sustainable Physical Infrastructure Objective 2.5 Improve the Capital Planning and Design Process Tactic 2.5.2 90% of designers under contract within 120 days of the Project posting in CAPSTAT 2.5.3 90% of Designs complete by the scheduled completion date 2.5.4 90% of designs complete within design budgeted fee ACTION PLAN
Actions Completed
• Interscope Plus go live date was September 1, 2015. (Design posting no longer performed in Capstat)
Actions Planned • PMs, prior to executing the design agreement, arrange a meeting between capital projects, design team,
and user group to plan / agree on a design production schedule to be reflected in the designer’s agreement.
• Baseline (BL) schedules – accurate, used weekly by PMs & CMs • PMs print project budget / financial sheets. Have them on hand for all design meetings. PMs must know
their project authorization, current source of funding, available balances. • Develop a standardized design meeting agenda and make budget, contingency, scope creep, and design
production schedule required topics for updating the project team. • Report monthly to AVC FM status of changes relating to designer fees, scope creep, schedule misses, etc.. • Protect contingency limit uses for unforeseen conditions, inflation. • Hire one project manager.
33
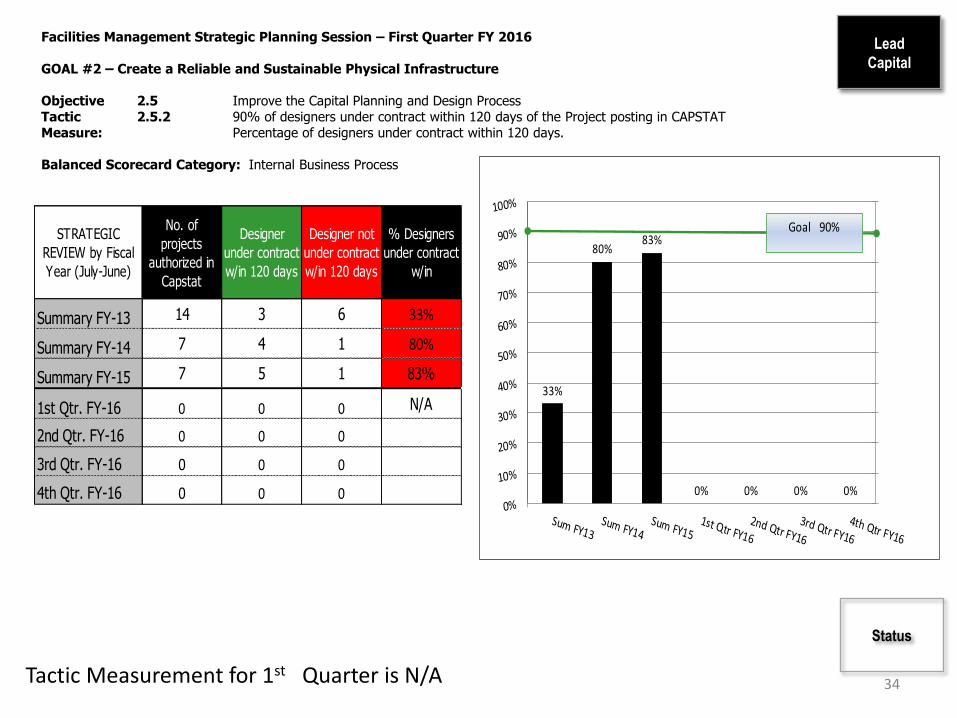
Facilities Management Strategic Planning Session – First Quarter FY 2016 GOAL #2 – Create a Reliable and Sustainable Physical Infrastructure Objective 2.5 Improve the Capital Planning and Design Process Tactic 2.5.2 90% of designers under contract within 120 days of the Project posting in CAPSTAT Measure: Percentage of designers under contract within 120 days. Balanced Scorecard Category: Internal Business Process
Lead
Capital
34 Tactic Measurement for 1st Quarter is N/A
Status
STRATEGIC
REVIEW by Fiscal
Year (July-June)
No. of
projects
authorized in
Capstat
Designer
under contract
w/in 120 days
Designer not
under contract
w/in 120 days
% Designers
under contract
w/in
Summary FY-13 14 3 6 33%
Summary FY-14 7 4 1 80%
Summary FY-15 7 5 1 83%
1st Qtr. FY-16 0 0 0 N/A
2nd Qtr. FY-16 0 0 0 0%
3rd Qtr. FY-16 0 0 0 0%
4th Qtr. FY-16 0 0 0 0%
33%
80%83%
0% 0% 0% 0%
Goal 90%

Facilities Management Strategic Planning Session – First Quarter FY 2016 GOAL #2 – Create a Reliable and Sustainable Physical Infrastructure Objective 2.5 Improve the Capital Planning and Design Process Tactic 2.5.3 90% of designs complete by the scheduled completion date Measure: Percentage of designs completed on or before the original completion time Balanced Scorecard Category: Internal Business Process
Lead
Capital
35 Tactic Measurement for 1st Quarter is 100%
Status
STRATEGIC
REVIEW by Fiscal
Year (July-June)
No. of
projects
completed by
scheduled
#not
completed by
scheduled
time
% Designs
complete by
completion
timeSummary FY-13 3 1 75%Summary FY-14 8 0 100%Summary FY-15 3 1 75%1st Qtr. FY-16 1 0 100%2nd Qtr. FY-16 3rd Qtr. FY-16 4th Qtr. FY-16
75%
100%
75%
100%
0% 0% 0%
Goal 90%
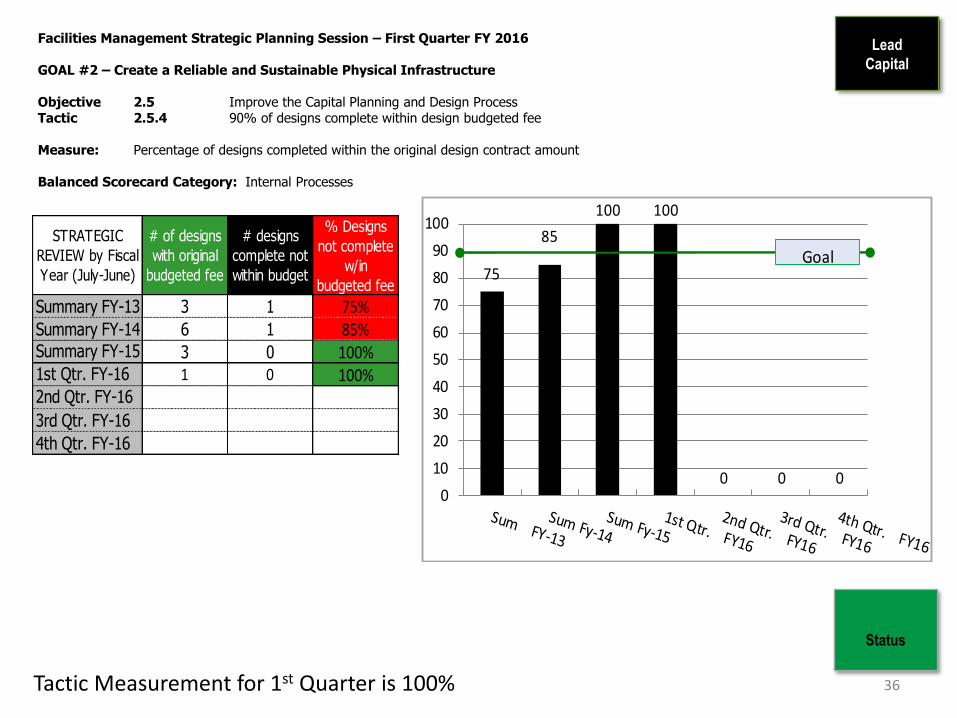
Facilities Management Strategic Planning Session – First Quarter FY 2016 GOAL #2 – Create a Reliable and Sustainable Physical Infrastructure Objective 2.5 Improve the Capital Planning and Design Process Tactic 2.5.4 90% of designs complete within design budgeted fee Measure: Percentage of designs completed within the original design contract amount Balanced Scorecard Category: Internal Processes
Lead
Capital
36
Status
Tactic Measurement for 1st Quarter is 100%
STRATEGIC
REVIEW by Fiscal
Year (July-June)
# of designs
with original
budgeted fee
# designs
complete not
within budget
% Designs
not complete
w/in
budgeted fee
Summary FY-13 3 1 75%Summary FY-14 6 1 85%Summary FY-15 3 0 100%1st Qtr. FY-16 1 0 100%2nd Qtr. FY-16 3rd Qtr. FY-16
4th Qtr. FY-16
75
85
100 100
0 0 00
10
20
30
40
50
60
70
80
90
100
Goal
Lead
Capital
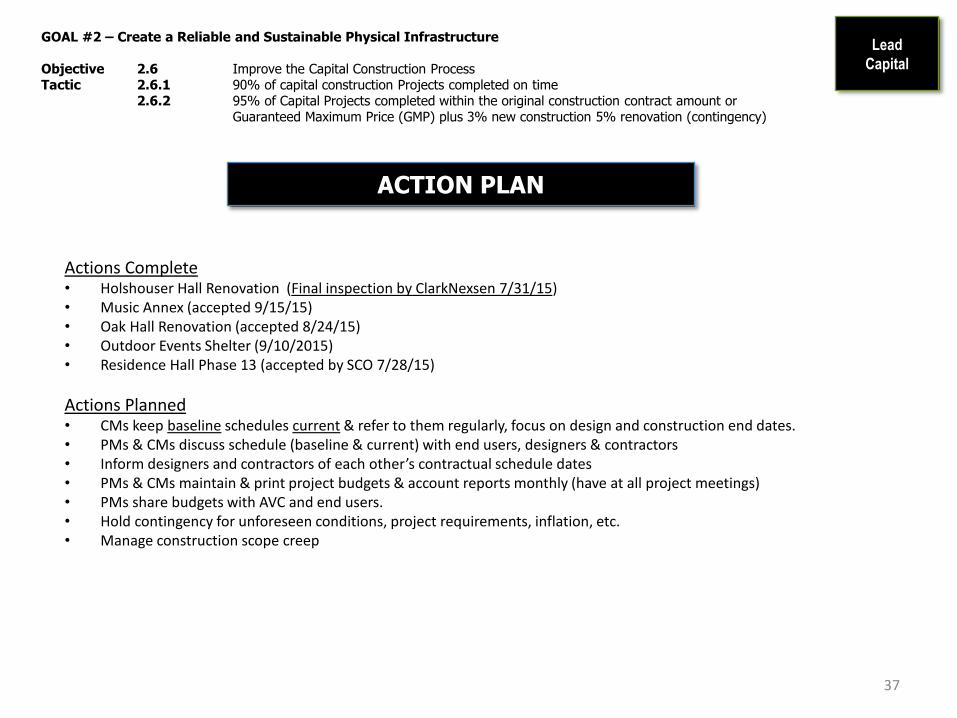
GOAL #2 – Create a Reliable and Sustainable Physical Infrastructure Objective 2.6 Improve the Capital Construction Process Tactic 2.6.1 90% of capital construction Projects completed on time 2.6.2 95% of Capital Projects completed within the original construction contract amount or Guaranteed Maximum Price (GMP) plus 3% new construction 5% renovation (contingency)
ACTION PLAN
Actions Complete • Holshouser Hall Renovation (Final inspection by ClarkNexsen 7/31/15) • Music Annex (accepted 9/15/15) • Oak Hall Renovation (accepted 8/24/15) • Outdoor Events Shelter (9/10/2015) • Residence Hall Phase 13 (accepted by SCO 7/28/15)
Actions Planned • CMs keep baseline schedules current & refer to them regularly, focus on design and construction end dates. • PMs & CMs discuss schedule (baseline & current) with end users, designers & contractors • Inform designers and contractors of each other’s contractual schedule dates • PMs & CMs maintain & print project budgets & account reports monthly (have at all project meetings) • PMs share budgets with AVC and end users. • Hold contingency for unforeseen conditions, project requirements, inflation, etc. • Manage construction scope creep
37
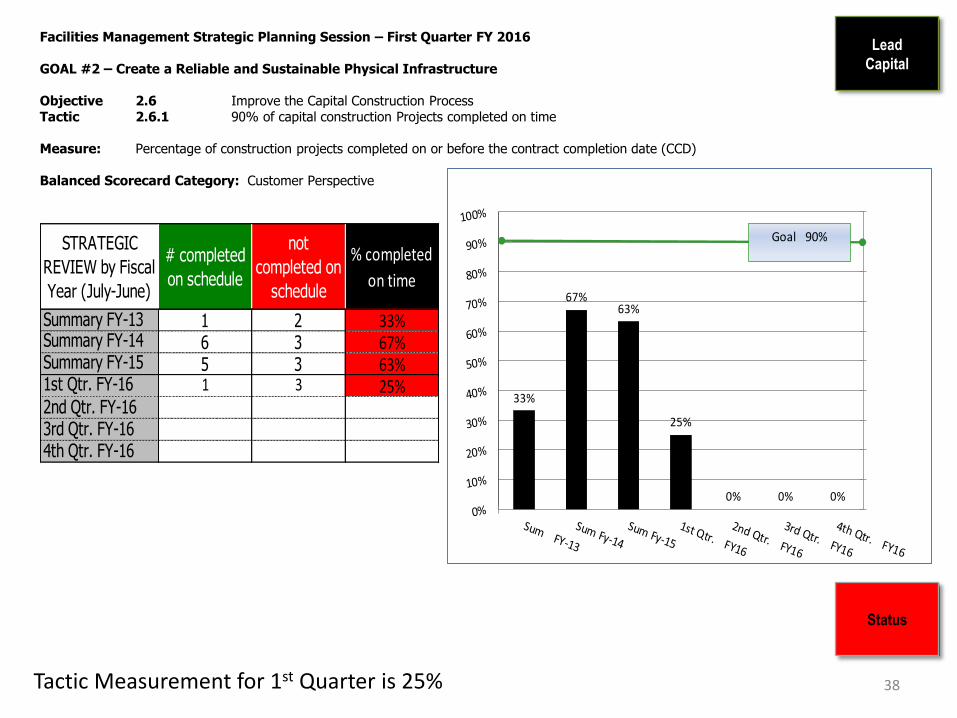
Facilities Management Strategic Planning Session – First Quarter FY 2016 GOAL #2 – Create a Reliable and Sustainable Physical Infrastructure Objective 2.6 Improve the Capital Construction Process Tactic 2.6.1 90% of capital construction Projects completed on time Measure: Percentage of construction projects completed on or before the contract completion date (CCD) Balanced Scorecard Category: Customer Perspective
Lead
Capital
38 Tactic Measurement for 1st Quarter is 25%
Status
STRATEGIC
REVIEW by Fiscal
Year (July-June)
# completed
on schedule
not
completed on
schedule
% completed
on time
Summary FY-13 1 2 33%Summary FY-14 6 3 67%Summary FY-15 5 3 63%1st Qtr. FY-16 1 3 25%2nd Qtr. FY-16 3rd Qtr. FY-16 4th Qtr. FY-16
33%
67%63%
25%
0% 0% 0%
Goal 90%
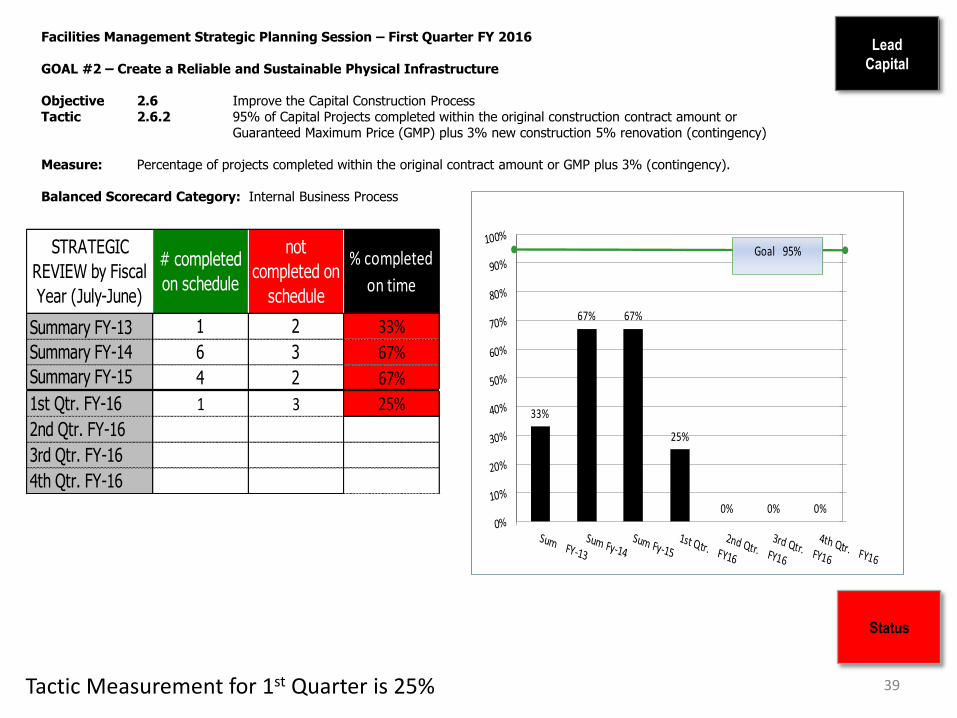
Facilities Management Strategic Planning Session – First Quarter FY 2016 GOAL #2 – Create a Reliable and Sustainable Physical Infrastructure Objective 2.6 Improve the Capital Construction Process Tactic 2.6.2 95% of Capital Projects completed within the original construction contract amount or Guaranteed Maximum Price (GMP) plus 3% new construction 5% renovation (contingency) Measure: Percentage of projects completed within the original contract amount or GMP plus 3% (contingency). Balanced Scorecard Category: Internal Business Process
Lead
Capital
39
Status
Tactic Measurement for 1st Quarter is 25%
STRATEGIC
REVIEW by Fiscal
Year (July-June)
# completed
on schedule
not
completed on
schedule
% completed
on time
Summary FY-13 1 2 33%
Summary FY-14 6 3 67%Summary FY-15 4 2 67%
1st Qtr. FY-16 1 3 25%
2nd Qtr. FY-16
3rd Qtr. FY-16
4th Qtr. FY-16
33%
67% 67%
25%
0% 0% 0%
Goal 95%

GOAL #3
Foster a Customer Focused Organization
“People don’t want to
communicate with an
organization or a computer.
They want to talk to a real, live,
responsive, responsible person
who will listen and help them
get satisfaction.”
- Theo Michelson, State Farm
Insurance
Facilities Management Strategic Planning Session – First Quarter 2016 GOAL #3 Foster a Customer Focused Organization Objective 3.1: Continuously improve customer service/satisfaction Tactic 3.1.1: Achieve overall customer satisfaction of 93% (proposed) for FM services. Measure: Annual Customer Survey results: Percentage of customers selecting “fair, good or very good” with the statement: “Overall I am satisfied with <the service> I received from Facilities Management” Lead: Facilities Management Wide Balanced Scorecard Category: Customer Perspective
41
Lead
FBO
ACTION PLAN
Customer Survey
• Customer interview feedback to be shared with Directors On Hold for new Communications Officer
Questions will relate to how FM can help customers get their work done better and/or faster via website, projects, etc.
Ask feedback for following scenario: a customer service center entering and managing work requests
• Action plans, based on interviews and 2014 Customer Survey to be developed by Directors. On Hold
• Next Urban Institute survey projected: FY 2016
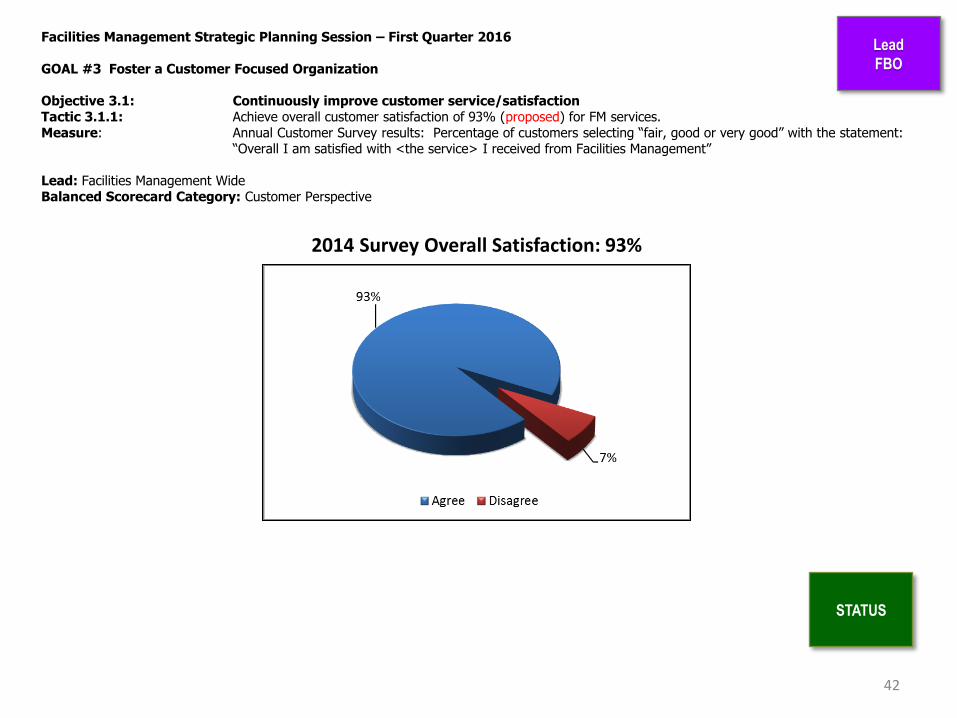
Facilities Management Strategic Planning Session – First Quarter 2016 GOAL #3 Foster a Customer Focused Organization Objective 3.1: Continuously improve customer service/satisfaction Tactic 3.1.1: Achieve overall customer satisfaction of 93% (proposed) for FM services. Measure: Annual Customer Survey results: Percentage of customers selecting “fair, good or very good” with the statement: “Overall I am satisfied with <the service> I received from Facilities Management” Lead: Facilities Management Wide Balanced Scorecard Category: Customer Perspective
42
Lead
FBO
2014 Survey Overall Satisfaction: 93%
STATUS
GOAL #3 – Foster a Customer Focused Organization Objective: 3.1: Continuously improve customer service/satisfaction Tactic: 3.1.2: Decrease the Number of Hot/Cold Calls by 20% Tactic: 3.1.4: 90% of Reactive Work Request Customers are satisfied or very satisfied
ACTION PLAN
43
Lead
F. O.
Actions Planned
1. Continue to work with customers; educate them on the UNCC Temperature Control Policy and monitor requests for accuracy.
2. Continue to develop BAS Controls section and cross-train with Zones.
3. Continue to include Energy Manager in Bi-Weekly Operations’ meetings.
4. Continue daily monitoring of building temperatures within Zones.
5. Develop Utilities Team (focus on BAS Team; retro commissioning and Utility Manager) December 2015
Actions Completed
1. Supported Capital to get buildings commissioned and retro-commissioned (ie, Kennedy Building).
2. Implemented daily monitoring of temperature using BAS and field verification. Continue to develop controls section and cross-train with Zones.
3. Implemented Customer Satisfaction Survey.
4. Stayed engaged with performance of ESCO contract; kept customers informed; walked the buildings and worked with the Energy Manager to keep customers informed; daily communication.

Facilities Management Strategic Planning Session – First Quarter FY 2016
GOAL #3 – Foster a Customer Focused Organization Objective: 3.1: Continuously improve customer service/satisfaction Tactic: 3.1.2: Decrease the Number of Hot/Cold Calls by 20% Measure: Number of Hot/Cold Calls submitted on work requests Lead: Facilities Operations Balance Scorecard Category: Customer Perspective
44
Lead
F. O.
STATUS
5
25
45
65
85
105
125
145
165
185
205
FY15Annual Average
1st Qtr FY16 2nd Qtr FY16 3rd Qtr FY16 4th Qtr FY16
TooHot85
TooHot121
TooCold96
TooCold55
Total181
Total176
Decrease the Number of Hot/Cold Calls
Goal = DecreaseNumber by 20%(145 Total)

Actions taken by Members of the Design Services Team & Results of Actions: • Stop by Customers after the project is complete and in use to review how the renovated space is performing. Received excellent feedback; this helps the design and finish options going forward on other projects.
• Keeping the communication lines open by email, phone and face to face works wonders. • Sending daily construction field reports has been working for one very “hands on” Customer. • Hold weekly meetings on job site to discuss progress with Customer. Customers enjoy getting to see the project and discuss any issues or concerns face to face. • Each Customer is unique and so must be the way I communicate with them. Sometimes it's face to face, other times email or a phone call. It also depends on what needs to be discussed. The process is simple to state and difficult to master; effective communication is not easy.
GOAL #3 – Foster a Customer Focused Organization Objective: 3.1: Continuously improve customer service/satisfaction Lead: Design Services Balanced Scorecard Category: Internal Business Process
45
Lead Design Services
Tactic 3.1.3: 90% of Informal Project Customers are satisfied or very satisfied Measure: Results from Archibus – Design Services Projects Customer Survey
ACTION PLANS FOR IMPROVEMENT
Archibus - Design Services Customer Survey:

Facilities Management Strategic Planning Session – First Quarter FY 2016 GOAL #3 – Foster a Customer Focused Organization Objective: 3.1: Continuously Improve Customer Service and Satisfaction Lead: Design Services Balanced Scorecard Category: Internal Business Process
46
Lead Design Services
Customers Comments:
PC kept us informed on all issues, the project timeline was a concern, but to no fault of the PM, Very pleased with the out come. PC communicated updates and informed us on the status of the project. Very pleased with the results. PC is wonderful to work with - highly competent, responsive, organized. PC was very good about communicating issues and overcoming challenges. Project was done quicker than expected. PC kept deadlines in mind when scheduling work.
95.5%
76.7%
90.9%93.5%
95.5%
87.5%92.7%
100%
90%
85%
FY09 FY10 FY11 FY12 FY13 FY14 FY15 FY16
GOAL ALERT
Survey Totals by
Fiscal Year
Number of
Surveys
issued
Number of
Survey
Responses
More than
Satisfied Satisfied
Less then
Satisfied
Percent
Satisfied
FY09 22 22 18 3 0 95.5%
FY10 30 30 18 5 0 76.7%
FY11 33 33 24 6 2 90.9%
FY12 31 31 27 2 0 93.5%
FY13 22 22 18 3 0 95.5%
FY14 24 24 18 3 0 87.5%
FY15 117 41 35 3 0 92.7%
FY16 17 10 7 3 0 100%
17 10 58.8%
90% of Informal Project Customers More than Satisfied or Satisfied with
services received
REPSONSE RATE
Tactic 3.1.3: 90% of Informal Project Customers are more than satisfied or satisfied Measure: Results from Project Related Customer Surveys
YTD ANNUAL 1ST QRT
STATUS GOAL STATUS
100.0% 90.0% 100.0%

Facilities Management Strategic Planning Session – First Quarter FY 2016 GOAL #3 – Foster a Customer Focused Organization Objective: 3.1: Continuously improve customer service/satisfaction Tactic: 3.1.4: 90% of Reactive Work Request Customers are satisfied or very satisfied Measure: Percent satisfied or very satisfied on SurveyShare email Survey Results Lead: Facilities Operations Balance Scorecard Category: Customer Perspective
Lead
F. O.
STATUS
47
0.00%10.00%20.00%30.00%40.00%50.00%60.00%70.00%80.00%
Very Satisfied Satisfied DissatisfiedVery
DissatisfiedYes No
How satisfied were you with the time it takesfor Fac Ops staff to respond to you issue?
41.51% 56.60% 1.89% 0.00% 0 0
How satisfied were you with the resolution ofyour issue or concern?
50.94% 47.17% 1.89% 0.00% 0 0
Was there follow-up?Yes/No
52.83% 47.17%
How satisfied were you with our staff'scourteousness and professionalism?
73.58% 26.42% 0.00% 0.00%
How satisfied were you with your overallexperience?
52.83% 43.40% 3.77% 0.00%
Improve Customer Service Satisfaction

GOAL #3 Foster a Customer Focused Organization Objective 3.1: Continuously improve customer service/satisfaction Tactic 3.1.5: Build brand awareness Measure: Action Plan Only Lead: Facilities Business Office - Communications Balanced Scorecard Category: Customer Perspective
48
Lead
FBO
ACTION PLAN
Publicity/Public Relations: • Campus Construction Reports*: Goal to prepare and distribute approx. every six weeks. Last one sent March 3, 2015;
On Hold
• Press Releases: Write and distribute through several media channels. Continual through On Hold
Clean fuel grants, energy savings, Aperture sculpture, etc.
• Publicity documentation and analytics*: Will report annually. Next is On Hold
Internal Communications: • Intranet Begin content review and user feedback. (note: level 0 security information) On Hold
• Regularly scheduled communications meetings with BES and Operations On Hold
Bimonthly meetings for both. Had first meeting with Operations in March, 2015, prior to Shelly’s departure. BES meetings have been held for several months now.
• Focus group meeting facilitator for employee communications survey review. Group participants being identified.
Meeting On Hold; Completion and results: On Hold
• Workshops*: Expand FM audience and subject materials On Hold
• Communications Policy Update: Proposed policy given to Melanie and Jennifer On Hold
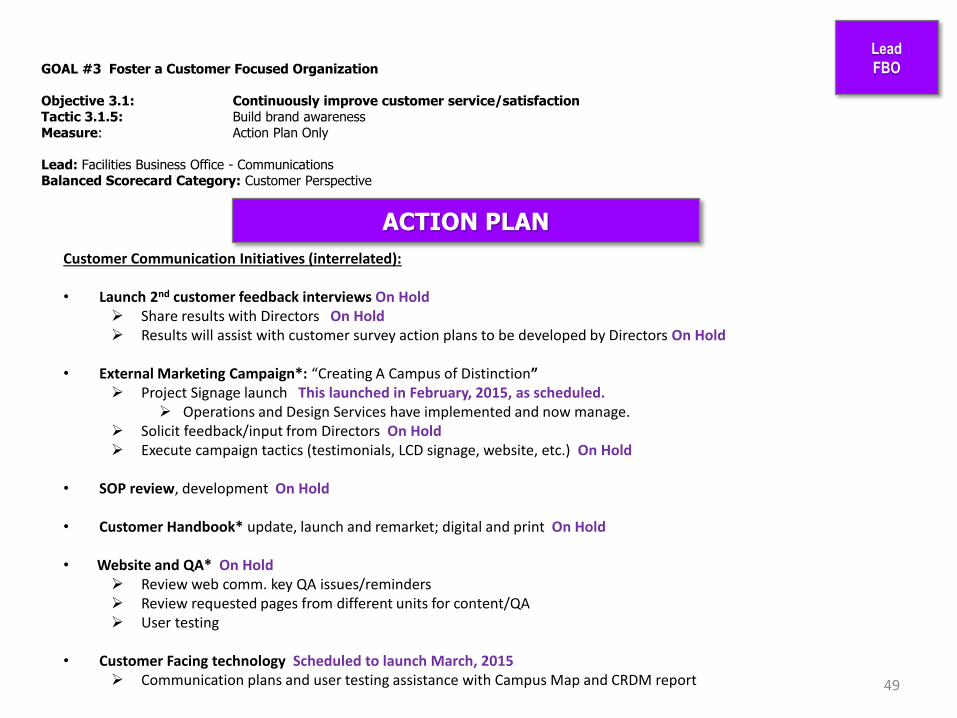
GOAL #3 Foster a Customer Focused Organization Objective 3.1: Continuously improve customer service/satisfaction Tactic 3.1.5: Build brand awareness Measure: Action Plan Only Lead: Facilities Business Office - Communications Balanced Scorecard Category: Customer Perspective
49
Lead
FBO
ACTION PLAN
Customer Communication Initiatives (interrelated): • Launch 2nd customer feedback interviews On Hold
Share results with Directors On Hold Results will assist with customer survey action plans to be developed by Directors On Hold
• External Marketing Campaign*: “Creating A Campus of Distinction” Project Signage launch This launched in February, 2015, as scheduled.
Operations and Design Services have implemented and now manage. Solicit feedback/input from Directors On Hold Execute campaign tactics (testimonials, LCD signage, website, etc.) On Hold
• SOP review, development On Hold • Customer Handbook* update, launch and remarket; digital and print On Hold • Website and QA* On Hold
Review web comm. key QA issues/reminders Review requested pages from different units for content/QA User testing
• Customer Facing technology Scheduled to launch March, 2015 Communication plans and user testing assistance with Campus Map and CRDM report

GOAL #3 Foster a Customer Focused Organization Objective 3.1: Continuously improve customer service/satisfaction Tactic 3.1.5: Build Brand Awareness Measure: Action Plan Only Lead: Facilities Business Office - Communications Balanced Scorecard Category: Customer Perspective
50
Lead
FBO
ACTION PLAN
Special Projects:
• Sustainability Magazine Launch Launched March 3, 2015 Limited print to occur in late Mar./Early April (see Mike Lizotte)
• Traffic communications committee (joint partnership with U. Communications): Research, write and provide upcoming and current campus and perimeter traffic/transportation-related projects to campus stakeholders.
Quarterly e-newsletter, articles, announcements, etc. On Hold
• Editing/writing award submissions. As requested On Hold Campus Tree USA Designation/Award: Submitted Dec. 2014; anticipated response March 2015.
Notified as award winner in February, 2015. To be announced in sync with Arbor Day and Campus Clean Up.
• Presentation assistance as requested • Communication Plans: BES and Operations key announcements, FIS new campus map, CRDM program, customer
handbook On Hold • Personnel: Temporary position request submitted and approved through FY 15 budget process On Hold
* = Areas where temp. communication position would assist to help meet timeframes and deliverables.

GOAL #4
Recruit, Develop, and Retain Quality Employees
"All growth depends upon activity.
There is no development
physically or intellectually without
effort, and effort means work."
-- Calvin Coolidge,
30th U.S. president

GOAL #4 Recruit, Develop and Retain Quality Employees Objective 4.1: Recruit a Qualified Workforce in a Timely Fashion Tactic 4.1.1: Vacancy time of no longer than 80 calendar days – Nonexempt Vacancy time of no longer than 120 calendar days - Exempt Tactic 4.1.2: Reduce Number of Employees Terminated During Probationary Period to less than 5% Lead: Facilities Business Office Balanced Scorecard Category: Innovation & Learning
52
Lead
FBO
ACTION PLAN
1. Increase the pool of qualified applicants and ensure a qualified, diverse applicant pool. As appropriate through
June 30, 2016
2. Timely and efficient processing position management actions. As appropriate through June 30, 2016
3. Ensure FM maintains current on budgeted positions. As appropriate through June 30, 2016
4. Targeted Selection. Ongoing
5. Interview Guides. Ongoing.
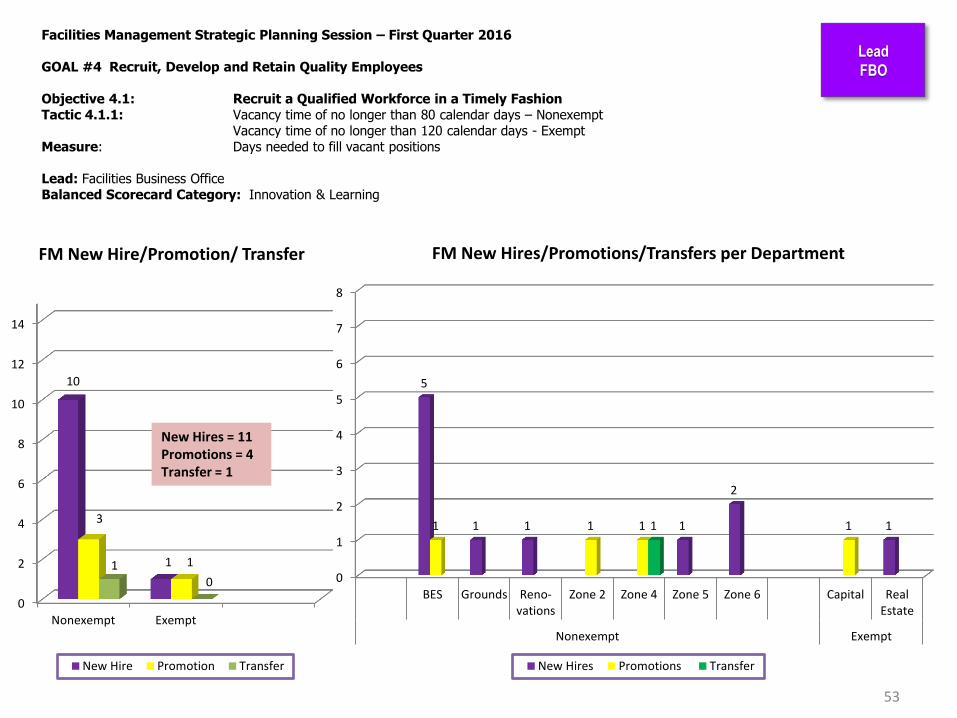
Facilities Management Strategic Planning Session – First Quarter 2016 GOAL #4 Recruit, Develop and Retain Quality Employees Objective 4.1: Recruit a Qualified Workforce in a Timely Fashion Tactic 4.1.1: Vacancy time of no longer than 80 calendar days – Nonexempt Vacancy time of no longer than 120 calendar days - Exempt Measure: Days needed to fill vacant positions Lead: Facilities Business Office Balanced Scorecard Category: Innovation & Learning
Lead
FBO
53
0
1
2
3
4
5
6
7
8
BES Grounds Reno-vations
Zone 2 Zone 4 Zone 5 Zone 6 Capital RealEstate
Nonexempt Exempt
5
1 1 1
2
1 1 1 1 1 1
FM New Hires/Promotions/Transfers per Department
New Hires Promotions Transfer
0
2
4
6
8
10
12
14
Nonexempt Exempt
10
1
3
1 1
0
FM New Hire/Promotion/ Transfer
New Hire Promotion Transfer
New Hires = 11 Promotions = 4 Transfer = 1

Facilities Management Strategic Planning Session – First Quarter 2016 GOAL #4 Recruit, Develop and Retain Quality Employees Objective 4.1: Recruit a Qualified Workforce in a Timely Fashion Tactic 4.1.1: Vacancy time of no longer than 80 calendar days – Nonexempt Vacancy time of no longer than 120 calendar days - Exempt Measure: Days needed to fill vacant positions Lead: Facilities Business Office Balanced Scorecard Category: Innovation & Learning
54
STATUS
Lead
FBO
0
20
40
60
80
100
120
140
160
Q1 Q2 Q3 Q4
14
0 0 0
153
0 0 0
Average Number of Days to Fill Nonexempt Vacancies
# of Nonexempt Hires/Prom/Trans Average Number of Days
Target - 80 Calendar Days Missed by - 73 Days

Facilities Management Strategic Planning Session – First Quarter 2016 GOAL #4 Recruit, Develop and Retain Quality Employees Objective 4.1: Recruit a Qualified Workforce in a Timely Fashion Tactic 4.1.1: Vacancy time of no longer than 80 calendar days – Nonexempt Vacancy time of no longer than 120 calendar days - Exempt Measure: Days needed to fill vacant positions Lead: Facilities Business Office Balanced Scorecard Category: Innovation & Learning
55
Lead
FBO
STATUS
0
20
40
60
80
100
120
140
160
180
Q1 Q2 Q3 Q4
2 0 0 0
161
0 0 0
Number of Days to Fill Exempt (Salaried) Vacancies
# of Exempt Hires/Prom Average Number of Days
Target – 120 days Missed by – 41 days

GOAL #4 Recruit, Develop and Retain Quality Employees Objective 4.1: Recruit a Qualified Workforce in a Timely Fashion Tactic 4.1.2: Reduce Number of Employees Terminated During Probationary Period to less than 5% Measure: Lead: Facilities Business Office Balanced Scorecard Category: Innovation & Learning
ONGOING AND CONTINUOUS – Through June, 2016
1) Strive to hire the best qualified candidate
2) Maintain updated position descriptions
3) Work Plans
4) Probationary Period
5) Employee Evaluations
6) Employee relations documentation - 3 causes for disciplinary action
a) Unsatisfactory job performance - problems with quantity/quality of performance; not following procedure; timeliness; accuracy & absenteeism
b) Unacceptable personal conduct - behavior, attitude (falsifying job application, theft, alcohol, refusing to accept assignment, betraying confidential info)
c) Grossly inefficient performance - destroying state property, causing harm or loss of life, etc.
56
ACTION PLAN
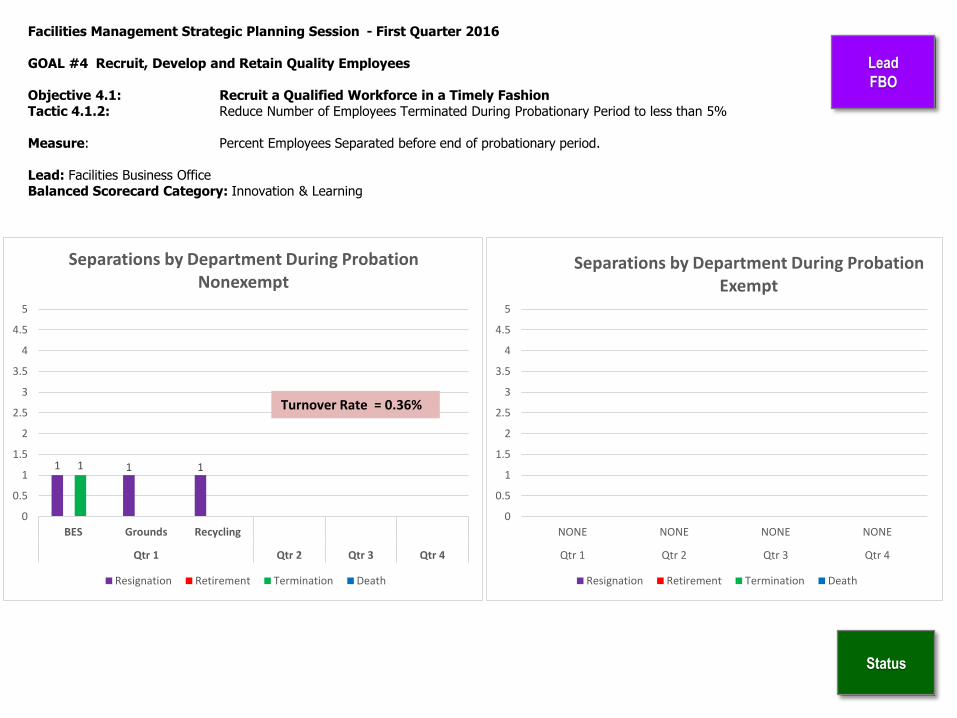
Facilities Management Strategic Planning Session - First Quarter 2016 GOAL #4 Recruit, Develop and Retain Quality Employees Objective 4.1: Recruit a Qualified Workforce in a Timely Fashion Tactic 4.1.2: Reduce Number of Employees Terminated During Probationary Period to less than 5% Measure: Percent Employees Separated before end of probationary period. Lead: Facilities Business Office Balanced Scorecard Category: Innovation & Learning
Lead
FBO
57
Status
0
0.5
1
1.5
2
2.5
3
3.5
4
4.5
5
NONE NONE NONE NONE
Qtr 1 Qtr 2 Qtr 3 Qtr 4
Separations by Department During Probation Exempt
Resignation Retirement Termination Death
1 1 1 1
0
0.5
1
1.5
2
2.5
3
3.5
4
4.5
5
BES Grounds Recycling
Qtr 1 Qtr 2 Qtr 3 Qtr 4
Separations by Department During Probation Nonexempt
Resignation Retirement Termination Death
Turnover Rate = 0.36%
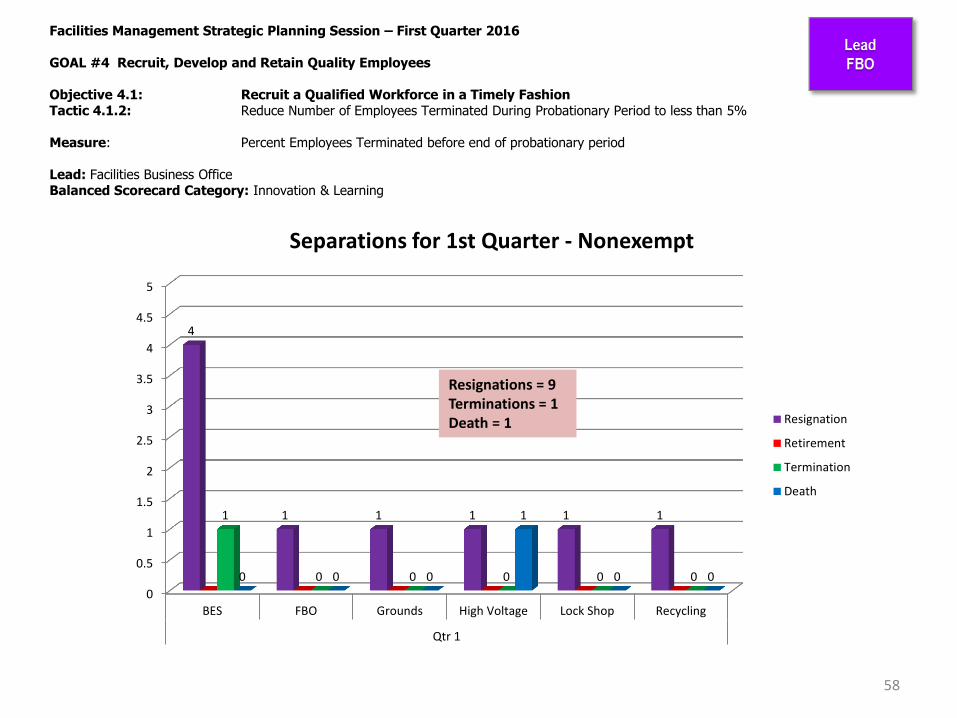
Facilities Management Strategic Planning Session – First Quarter 2016 GOAL #4 Recruit, Develop and Retain Quality Employees Objective 4.1: Recruit a Qualified Workforce in a Timely Fashion Tactic 4.1.2: Reduce Number of Employees Terminated During Probationary Period to less than 5% Measure: Percent Employees Terminated before end of probationary period Lead: Facilities Business Office Balanced Scorecard Category: Innovation & Learning
58
0
0.5
1
1.5
2
2.5
3
3.5
4
4.5
5
BES FBO Grounds High Voltage Lock Shop Recycling
Qtr 1
4
1 1 1 1 1 1
0 0 0 0 0 0 0 0
1
0 0
Separations for 1st Quarter - Nonexempt
Resignation
Retirement
Termination
Death
Resignations = 9 Terminations = 1 Death = 1

Facilities Management Strategic Planning Session – First Quarter 2016 GOAL #4 Recruit, Develop and Retain Quality Employees Objective 4.1: Recruit a Qualified Workforce in a Timely Fashion Tactic 4.1.2: Reduce Number of Employees Terminated During Probationary Period to less than 5% Measure: Percent Employees Terminated before end of probationary period Lead: Facilities Business Office Balanced Scorecard Category: Innovation & Learning
59
0
0.5
1
1.5
2
2.5
3
Capital Projects
1 1
0 0
Separations for 1st Quarter - Exempt
Resignation
Retirement
Termination
Death
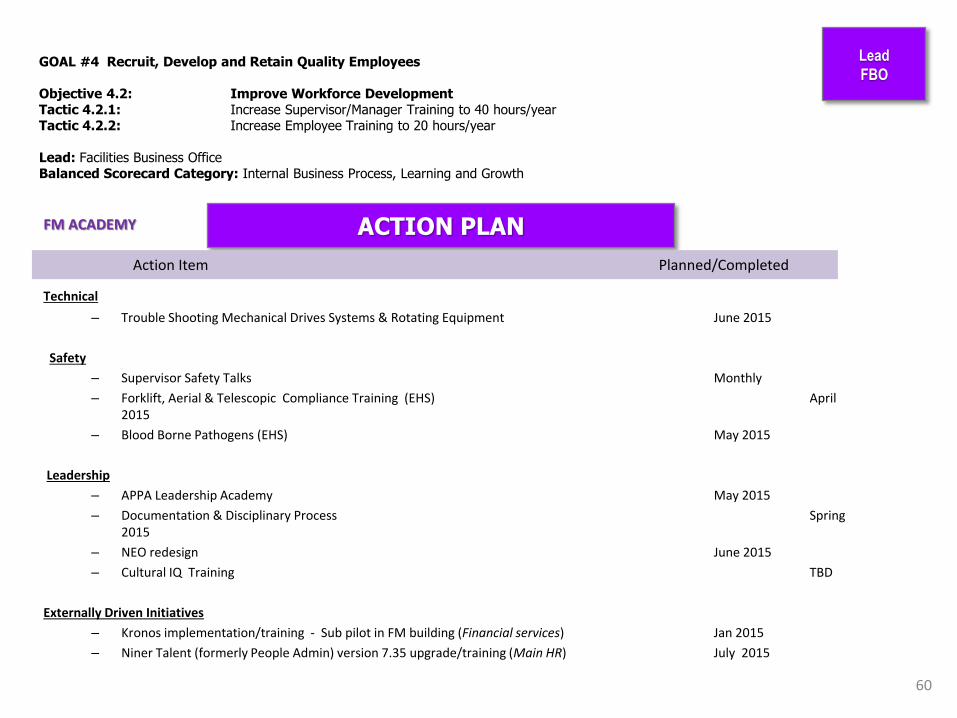
GOAL #4 Recruit, Develop and Retain Quality Employees Objective 4.2: Improve Workforce Development Tactic 4.2.1: Increase Supervisor/Manager Training to 40 hours/year Tactic 4.2.2: Increase Employee Training to 20 hours/year Lead: Facilities Business Office Balanced Scorecard Category: Internal Business Process, Learning and Growth
60
Lead
FBO
ACTION PLAN
Action Item Planned/Completed
FM ACADEMY
Technical
– Trouble Shooting Mechanical Drives Systems & Rotating Equipment June 2015
Safety
– Supervisor Safety Talks Monthly
– Forklift, Aerial & Telescopic Compliance Training (EHS) April 2015
– Blood Borne Pathogens (EHS) May 2015
Leadership
– APPA Leadership Academy May 2015
– Documentation & Disciplinary Process Spring 2015
– NEO redesign June 2015
– Cultural IQ Training TBD
Externally Driven Initiatives
– Kronos implementation/training - Sub pilot in FM building (Financial services) Jan 2015
– Niner Talent (formerly People Admin) version 7.35 upgrade/training (Main HR) July 2015

GOAL #4 Recruit, Develop and Retain Quality Employees Objective 4.2: Improve Workforce Development Tactic 4.2.1: Increase Supervisor/Manager Training to 40 hours/year Tactic 4.2.2: Increase Employee Training to 20 hours/year Lead: Facilities Business Office Balanced Scorecard Category: Internal Business Process, Learning and Growth
Lead
FBO
• Training hours for 1st Quarter FY16 – 583 hours
• Bi-weekly attendance at F/O staff meetings
• Monthly attendance at BES staff meetings
• Regular meetings with BES & FO training coordinators
• Lending Library – solicit subject matter requests from Directors/Managers
ACTION PLAN
61
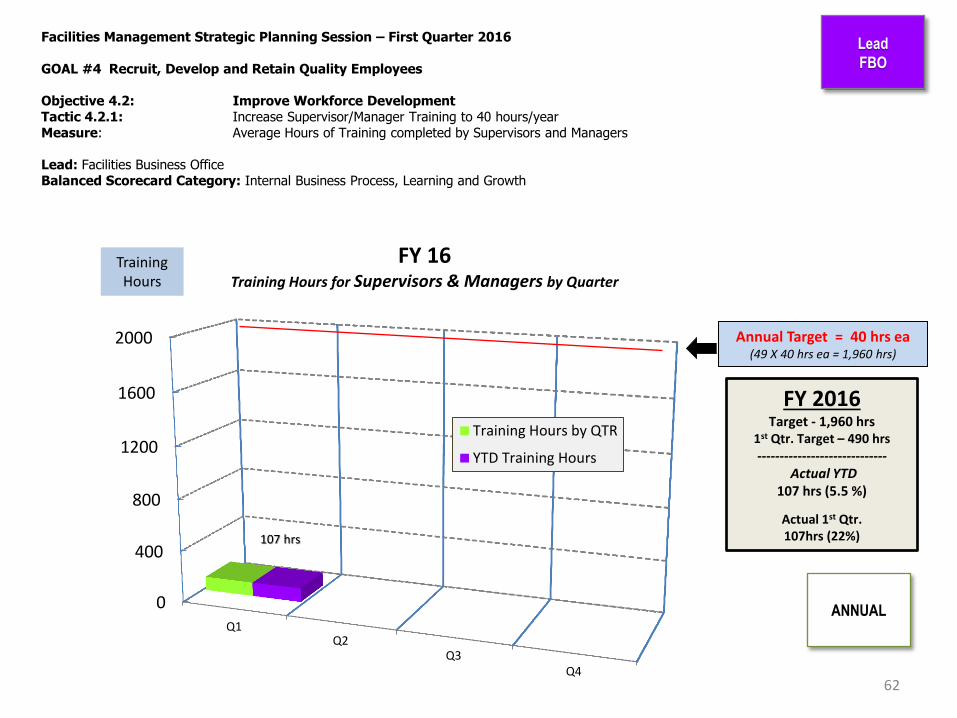
Facilities Management Strategic Planning Session – First Quarter 2016 GOAL #4 Recruit, Develop and Retain Quality Employees Objective 4.2: Improve Workforce Development Tactic 4.2.1: Increase Supervisor/Manager Training to 40 hours/year Measure: Average Hours of Training completed by Supervisors and Managers Lead: Facilities Business Office Balanced Scorecard Category: Internal Business Process, Learning and Growth
62
Lead
FBO
Annual Target = 40 hrs ea (49 X 40 hrs ea = 1,960 hrs)
0
400
800
1200
1600
2000
Q1Q2
Q3Q4
FY 16 Training Hours for Supervisors & Managers by Quarter
Training Hours by QTR
YTD Training Hours
Training Hours
FY 2016 Target - 1,960 hrs
1st Qtr. Target – 490 hrs -----------------------------
Actual YTD 107 hrs (5.5 %)
Actual 1st Qtr. 107hrs (22%) 107 hrs
ANNUAL

Facilities Management Strategic Planning Session – First Quarter 2016 GOAL #4 Recruit, Develop and Retain Quality Employees Objective 4.2: Improve Workforce Development Tactic 4.2.2: Increase Employee Training to 20 hours/year Measure: Average Hours of Training completed by front line employees Lead: Facilities Business Office Balanced Scorecard Category: Internal Business Process. Learning and Growth
63
Lead
FBO
Annual Target - 20 hrs ea (388 x 20 hrs ea = 7,760 hrs)
0
1000
2000
3000
4000
5000
6000
7000
8000
Q1Q2
Q3Q4
FY 16 Training Hours for front line employees by Quarter
Training Hours by QTR
YTD Training Hours
394 hrs
FY 2016 Annual Target - 7,760 hrs 1st Qtr. Target – 1,940 hrs
--------------------------- Actual YTD
394 hrs (5 %)
Actual 1st Qtr. 394 hrs (20 %)
ANNUAL
Training Hours

GOAL #4 Recruit, Develop and Retain Quality Employees Objective 4.3: Create and Maintain a Quality Work Environment Tactic 4.3.1: 90% of Employees satisfied or very satisfied working in FM Tactic 4.3.2: 87% of Employees satisfied or very satisfied in each unit of FM Lead: Facilities Business Office Balanced Scorecard Category: Customer Perspective
Survey Logistics: • Update survey instrument based on feedback from employees (add progress bar, investigate adding a comment box after
each section or field for employees to provide feedback, etc.) – Winter 2015
– Creation of a survey focus group consisting of non-supervisory employees from each of the major depts. to provide feedback on the questions as currently presented – i.e., are the questions clearly phrased for understanding, are we asking the right questions, etc. 01/15/2016
– Focus group members to be notified in December 2015; Work/meetings anticipated to begin in January 2016 with a proposed 3 week maximum time commitment by members;
• Next survey date TBD.
64
Lead
FBO
ACTION PLAN
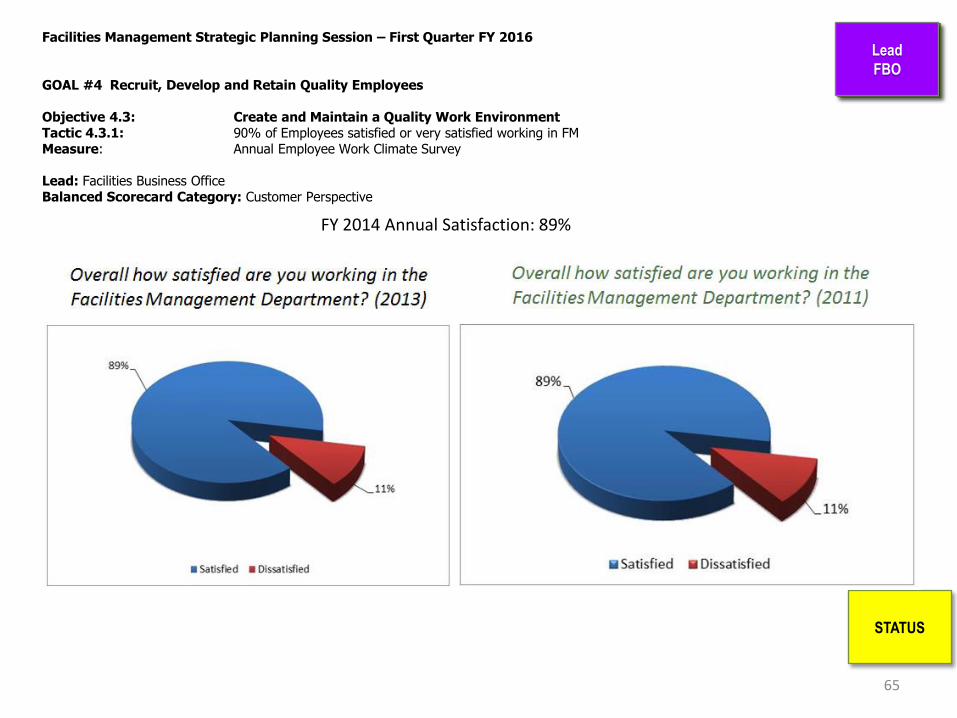
Facilities Management Strategic Planning Session – First Quarter FY 2016 GOAL #4 Recruit, Develop and Retain Quality Employees Objective 4.3: Create and Maintain a Quality Work Environment Tactic 4.3.1: 90% of Employees satisfied or very satisfied working in FM Measure: Annual Employee Work Climate Survey Lead: Facilities Business Office Balanced Scorecard Category: Customer Perspective
65
Lead
F. O.
STATUS
Lead
FBO
ON HOLD
FY 2014 Annual Satisfaction: 89%

Facilities Management Strategic Planning Session – First Quarter FY 2016 GOAL #4 Recruit, Develop and Retain Quality Employees Objective 4.3: Create and Maintain a Quality Work Environment Tactic 4.3.2: 87% of Employees satisfied or very satisfied in each unit of FM Measure: Annual Employee Work Climate Survey Lead: Facilities Business Office Balanced Scorecard Category: Customer Perspective
66
Lead
F. O.
Lead
FM
Operational
Units
88 90 92 84
96 88 87 90
86
67
100
0
20
40
60
80
100
120
Design Services Other Facilities Ops BES Recycling Capital
Unit Customer Satisfaction Survey FY Rating Comparison (%)
2012 Rating (%)
2014 Rating %
Goal = 87%
STATUS
All units are not at 87% satisfied
Unit 2014 Rating Extremely Satisfied Very Satisfied Satisfied
Design Services 88 0 44 44
Other 87 0 56 31
Facilities Ops 90 16 35 39
BES 86 16 33 40
Recycling 67 17 25 25
Capital 100 25 63 12

GOAL #4 Recruit, Develop and Retain Quality Employees Objective 4.4: Improve Employee Safety Tactic 4.4.1: Reduce the number of reportable accidents by 20% Tactic 4.4.2: 98% of Mandatory Compliance Training completed annually Measure: Percent of employees completing mandatory compliance training Lead: Facilities Business Office Balanced Scorecard Category: Innovation and Learning Perspective
67
Lead
FM Wide
Activities to foster “Safety Mindset”
• Supervisor Safety Talks (SST) Monthly • 5th Annual FM Safety Fair Annual • 7th Annual FM Safety Slogan Contest
Annual Safety Training
• “Safety Training Needs Assessment” sent to new employees & their supervisor Ongoing
• “EHS Safety Check List” sent to Directors Oct 2015
• List Safety training topics/links on FM Learning & Development web page Oct 2015
• Communicate EH&S training schedule to FM Monthly
ACTION PLAN

45
37
40
2826
24
17
24
19
1112
14
76
42
01
57
12 2
0
5
10
15
20
25
30
35
40
45
50
2004 2005 2006 2007 2008 2009 2010 2011 2012 2013 2014 2015
Accidents First Aid Only
Facilities Management Strategic Planning Session – First Quarter 2016 GOAL #4 Recruit, Develop and Retain Quality Employees Objective 4.4: Improve Employee Safety Tactic 4.4.1: Reduce the number of reportable accidents by 20% Measure: Number of Reportable Accidents (Measured by Calendar Year) Lead: FM Wide Balanced Scorecard Category: Innovation and Learning Perspective
2015 Continuous Improvement
Target ≤ 9
STATUS
Lead
FM Wide
FM Accident Trends
YTD
68

GOAL #4 Recruit, Develop and Retain Quality Employees Objective 4.4: Improve Employee Safety Tactic 4.4.1: Reduce the number of reportable accidents by 20% Tactic 4.4.2: 98% of Mandatory Compliance Training completed annually Lead: FM Wide Balanced Scorecard Category: Innovation and Learning Perspective
69
Lead
FM Wide
ACTION PLAN
Action Item _ Target Date
Safety Training stats FY15 YTD – 583 hours • Training Needs Assessment to new employees Ongoing • Safety Training Checklist to Supervisors/Managers Oct 2015
• Winter Preparedness Expo Dec 2015
• Safety related activities
• FM Safety Committee meeting Bi-monthly • Supervisor Safety Talks Monthly
• Safety Slogan Contest - “Safety Pays In Many Ways” July 2015
• Accident/Incident totals YTD (CY15) • Accidents - 14 2015 YTD • Minor incidents - 2 2015 YTD

GOAL #4 Recruit, Develop and Retain Quality Employees Objective 4.5: Improve Workforce Performance (Action Plan Only) Lead: Facilities Business Office Balanced Scorecard Category: Innovation and Learning Perspective
70
Lead
F. O.
Lead
FM Wide
ACTION PLAN
FM Academy
• Web Content Development, working with NiCole Lynch, FM Communications Officer, on updates in Ongoing
Learning & Development webpage.
– Developed an online training evaluation form with FIS (Pam); Under review for approval;
– Adding Safety topics/links
– Training vendor sourcing & selection (as needed/as funded)
– Updates to website on upcoming L & D events
Leadership
• Contacted Suzanne Healy at APPA; working to arrange the hosting of APPA leadership courses onsite.
Leadership Academy Level 1 completed May 2015. Courses be held at Center City as availability allows.
– APPA Leadership Academy (Level 2) Feb 2016
– APPA Leadership Academy (Level 3) Mar/Apr 2016
– APPA Supervisor Toolkit Summer 2016
Technical
• Working with Doug Pierce in Materials Management. Highly recommended that FM does an RFP to secure onsite training providers. As this process can be lengthy, exact dates will be confirmed and communicated.
– Electrical Troubleshooting & Preventive Maintenance Mar 2016
– Pump Repair & Maintenance Apr/May 2016
Action Item Target Date

GOAL #5
Promote Good Stewardship
"The more positive you are
when you think and work
toward your goals, the faster
you achieve them.”
-- Brian Tracy, Speaker, Author,
Consultant

GOAL #5 Promote Good Stewardship Objective 5.1: Promote Fiscal Responsibility Tactic 5.1.1: 100% of financial accounts within budget Tactic 5.1.2: Increase Supplemental Funding to the Department by 10% annually Tactic 5.1.3: Achieve Administrative cost/GSF ± 5% of APPA Average for Peer Institutions Lead: Facilities Business Office Balanced Scorecard Category: Financial Perspective
Finance/Budget:
• Call for Recurring and One-Time funding completed on time; Total FM request approx. $13M;
• Call for Divisional one-time funding list for FY 16 completed on time; Total FM request $2.8M
• Awaiting new recurring budget for FY 16 – General fund anticipated late Fall (November 2015); Currently operating using FY 15 budget amounts;
• Holding Budget Meetings for BES and FO Departments monthly with director and quarterly with respective leadership teams;
• Reinstitute capital project budget meetings with Capital team; Meetings to begin in October 2015
• FM Budgeting 101 training development underway with “color of green” sessions/meetings; Date of first session TBD; Training will incorporate both the GF and Capital;
Supplemental Grant/Award Funding:
• Search for grant and award possibilities for Facilities Management organizations. For those grants requiring “matching funds”, ensure buy-in from AVC prior to submitting proposals – thru June 2016;
72
Lead
FBO
ACTION PLAN

GOAL #5 Promote Good Stewardship Objective 5.1: Promote Fiscal Responsibility Tactic 5.1.1: 100% of financial accounts within budget Tactic 5.1.2: Increase Supplemental Funding to the Department by 10% annually Tactic 5.1.3: Achieve Administrative cost/GSF ± 5% of APPA Average for Peer Institutions Lead: Facilities Business Office Balanced Scorecard Category: Financial Perspective
Cost Accounting: • Devise strategy to improve cost accounting measures within all areas of Facilities Management – FY 2016
– Improve org code usage – July 2015 through June 2016; Three part org code concerns being addressed to include home org, timesheet org and pay/funding org;
• Home Org completed for KRONOS pilot;
• Timesheet org complete
• Funding org underway with several changes made in June 2015; Additional changes are under discussion with Position Control and should be completed by September 2015.
– Reviewing budget revision process departmental wide to begin July 2015 – will not be completed until the new FY 16 budget has been allocated by the AVC;
– Workflow approvals in 49er Mart: review completed in July 2015;
• Review monthly position control reports to ensure that positions/budgets are appropriately aligned. – 15th of each month;
• Requested an entry-level accountant position for FY 16 to improve and monitor use of account codes across FM;
• APPA Survey – Data gathering; Survey underway. Anticipated submission to AVC for review: November 23rd
73
Lead
FBO
ACTION PLAN
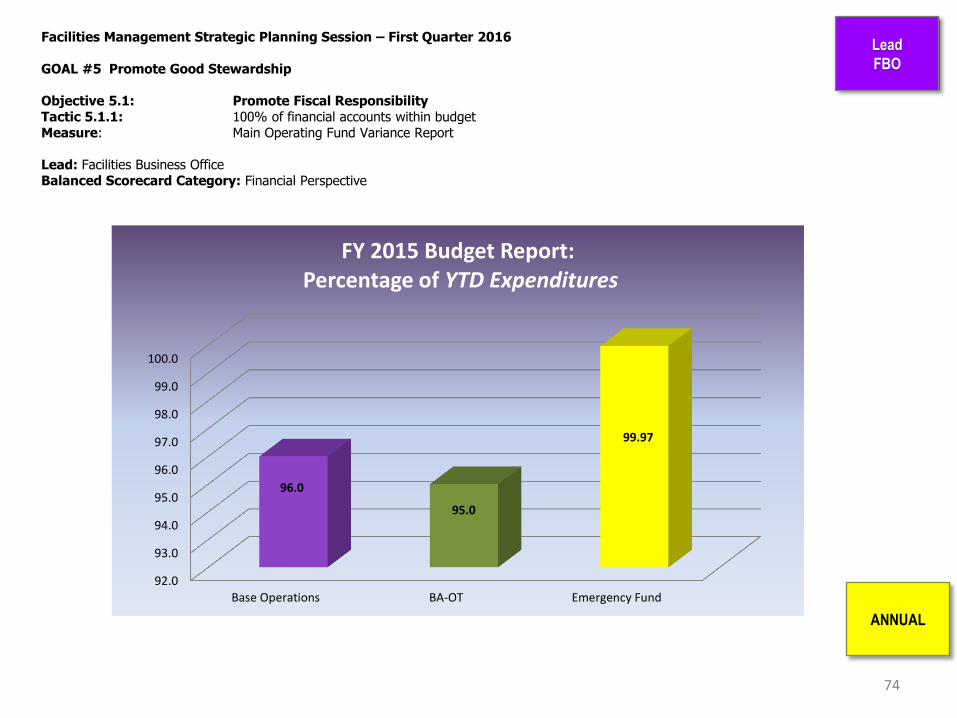
Facilities Management Strategic Planning Session – First Quarter 2016 GOAL #5 Promote Good Stewardship Objective 5.1: Promote Fiscal Responsibility Tactic 5.1.1: 100% of financial accounts within budget Measure: Main Operating Fund Variance Report Lead: Facilities Business Office Balanced Scorecard Category: Financial Perspective
74
Lead
FBO
ANNUAL
92.0
93.0
94.0
95.0
96.0
97.0
98.0
99.0
100.0
Base Operations BA-OT Emergency Fund
96.0
95.0
99.97
FY 2015 Budget Report: Percentage of YTD Expenditures

Facilities Management Strategic Planning Session – First Quarter 2016 GOAL #5 Promote Good Stewardship Objective 5.1: Promote Fiscal Responsibility Tactic 5.1.2: Increase Supplemental Funding to the Department by 10% annually Measure: Percent increase in supplemental funding Lead: Facilities Business Office Balanced Scorecard Category: Financial Perspective
75
Lead
F. O.
ANNUAL
Lead
FBO

GOAL #5 Promote Good Stewardship Objective 5.1: Promote Fiscal Responsibility Tactic 5.1.3: Achieve Administrative cost/GSF ± 5% of APPA Average for Peer Institutions Measure: Administrative cost/GSF from annual APPA Facilities Performance Indicators Report (APPA Benchmark) Lead: Facilities Business Office Balanced Scorecard Category: Financial Perspective
76
Lead
FBO
FY 15 APPA Survey: • Data collection for FY 15 survey underway; • Upon opening of survey, questions will be reviewed; participants (data providers) will be given a heads up and the
survey questions will be delivered. • Anticipated submittal of survey for review by AVC is November 23, 2015.
ACTION PLAN
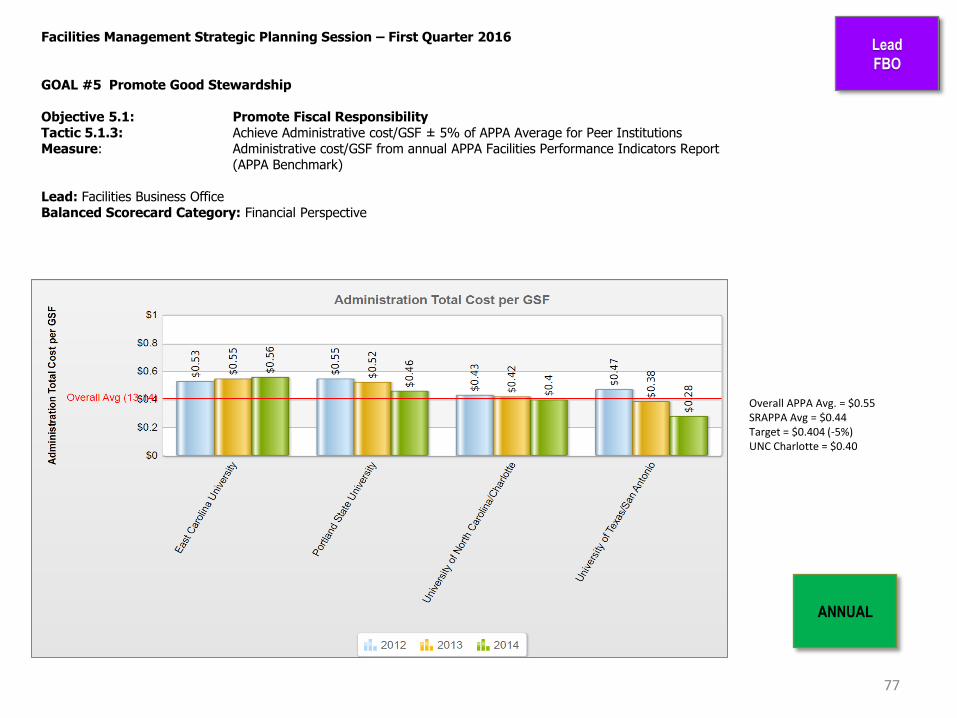
Facilities Management Strategic Planning Session – First Quarter 2016 GOAL #5 Promote Good Stewardship Objective 5.1: Promote Fiscal Responsibility Tactic 5.1.3: Achieve Administrative cost/GSF ± 5% of APPA Average for Peer Institutions Measure: Administrative cost/GSF from annual APPA Facilities Performance Indicators Report (APPA Benchmark) Lead: Facilities Business Office Balanced Scorecard Category: Financial Perspective
77
Lead
FBO
Overall APPA Avg. = $0.55 SRAPPA Avg = $0.44 Target = $0.404 (-5%) UNC Charlotte = $0.40
ANNUAL
$0.00
$0.10
$0.20
$0.30
$0.40
$0.50
$0.60
$0.70
East CarolinaUniversity
Portland StateUniversity
University ofNew Mexico
UNC Charlotte University ofTexas SanAntonio
SRAPPA Region
$0.56
$0.46
$0.00
$0.40
$0.28
$0.44
$ p
er
GSF
FY 14 Administrative Total Cost per GSF

GOAL #6 –Promote Good Stewardship Objective: 5.1: Promote Fiscal Responsibility Tactic 5.1.4: Achieve Custodial Costs/Student FTE Plus or Minus 5% of the APPA Average for Peer Institutions (Internal UNC Peers = East Carolina) (National Peers – Portland State University, University of New Mexico, University of Texas at San Antonio)
ACTION PLAN
• Actions Completed – Implemented new EDA-Equipment Inventory (EDA-EI) Process and developed Master List of
equipment for BES Zones (7/2015) – Implemented new Budget process for BES Zone Supervisors (8/2015) – EPIC laundry room installation (9/2015) – Submitted First Draft of 5-Year BES&R Plan to Phil Jones (9/1/2015)
• Actions Planned
– Research compostable PPE’s and Trash bags at Center City (11/2015) – Complete logistics portion of Supply Chain Management Project in McEniry (11/2015) – Develop a BES strategic dashboard that tracks cost, quality, and process data points over time
(12/2015) – Submit Second Draft of 5-Year BES&R Plan to Phil Jones (12/2015) – Install COED and Kennedy laundry rooms (2/2016) – Monitor and report custodial cost/student FTE on an annual basis using data from APPA survey
(ongoing)
78
Lead BES

79
Avg. cost/student = $217.99
UNCC = 6.105% above average
Facilities Management Strategic Planning Session – First Quarter FY 2016 GOAL #5 –Promote Good Stewardship
Objective: 5.1: Promote Fiscal Responsibility Tactic 5.1.4: Achieve Custodial Costs/Student between Plus or Minus 5% of the APPA Average for Peer Institutions (Internal UNC
Peers = East Carolina) (National Peers – Portland State University, University of New Mexico, University of Texas at San Antonio)
Measure: Custodial Costs/Student from annual APPA Facilities Performance Indicators Report (APPA Benchmark) = Salaries + Supplies/Student FTE Balanced Scorecard Category: Financial Perspective
Lead BES
STATUS
UNCC = 33.774% below SRAPPA average
$-
$50.00
$100.00
$150.00
$200.00
$250.00
$300.00
$350.00
EastCarolina
University
PortlandState
University
Universityof NewMexico
Universityof North
Carolina atCharlotte
Universityof Texas
SanAntonio
SRAPPARegion
$204.43 $204.42
$227.53 $231.30 $222.31
$349.23
Custodial-Total Cost/Student FTE
East Carolina University
Portland State University
University of New Mexico
University of North Carolina at Charlotte
University of Texas San Antonio
SRAPPA Region
Facilities Management Strategic Planning Session – First Quarter FY 2016
GOAL #5 – Promote Good Stewardship Objective: 5.1: Promote Fiscal Responsibility Tactic: 5.1.5: Achieve total Maintenance cost/GSF ± 5% of APPA Average for Peer Institutions Tactic: 5.1.6: Achieve total Landscape cost/acre ± 5% of APPA Average for Peer Institutions Tactic: 5.1.7: All Receipt Supported Funds Accounts have a positive balance at the end of the fiscal year
ACTION PLAN
80
Lead
F. O.
Actions Planned 1. Establish guidelines for qualifying reimbursable vs non-reimbursable work requests (To Charge or Not
to Charge) by July 2015. Rough draft completed; working with Dr. Jay Raja.
2. Weekly review of Facilities Operations Labor pool before going outside for additional staff support.
3. Tracking Labor Services bi-weekly with separate shop goals.
4. Active participants in upcoming Process for Reengineering Project.
Actions Completed 1. Identified opportunities to expand reimbursable work in an effort to support labor services funds by
Nov 2014.
2. Realigned the labor services positions to ensure maximum utilization of resources by Jan 2015.
3. Reviewed monthly Labor Service accounts with FBO to identify gaps and improved processes. Finished end of fiscal year in the black.

Facilities Management Strategic Planning Session – First Quarter FY 2016
GOAL #5 – Promote Good Stewardship Objective: 5.1: Promote Fiscal Responsibility Tactic: 5.1.5: Achieve total Maintenance cost/GSF ± 5% of APPA Average for Peer Institutions Measure: Maintenance cost/GSF from annual APPA Facilities Performance Indicators Report (APPA Benchmark) Lead: Facilities Operations Balance Scorecard: Financial Perspective
81
Lead
F. O.
STATUS
$1.92
$1.14
$1.72
$2.11$1.88
$1.01 $1.02
$2.051.87
1.32
0.77
1.94
$1.48
$0.00
$0.50
$1.00
$1.50
$2.00
$2.50
East Carolina University Portland State University University of Texas SanAntonio
UNC Charlotte 2014 Peer AverageUNC Charlotte = 23.7% above
Peer Average
Maintenance Total Cost per GSF
2012 2013 2014
Facilities Management Strategic Planning Session – First Quarter FY 2016
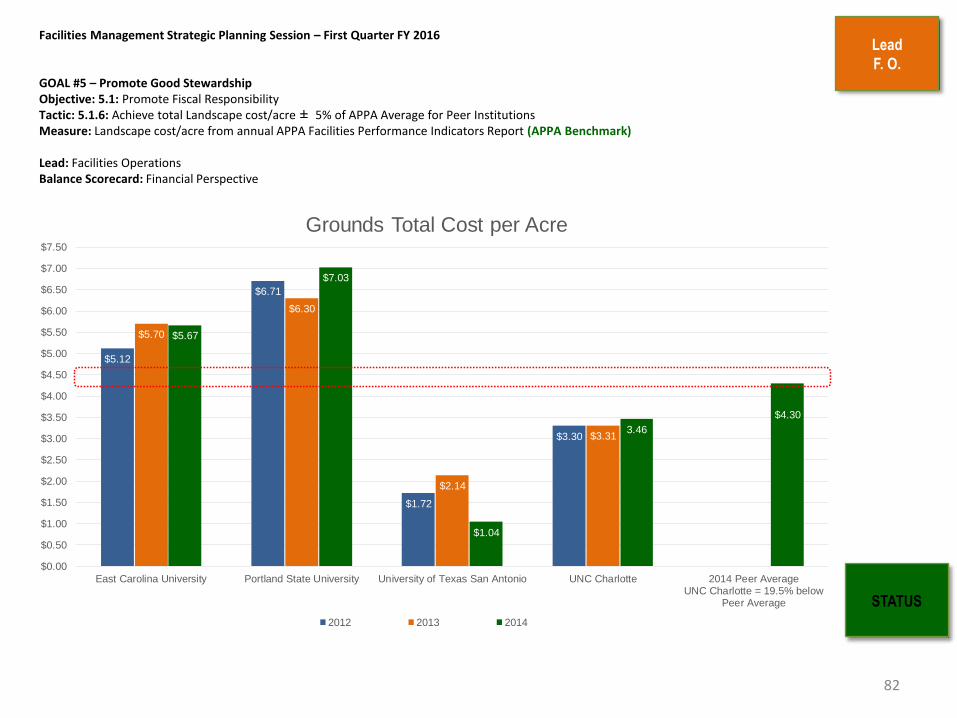
GOAL #5 – Promote Good Stewardship Objective: 5.1: Promote Fiscal Responsibility Tactic: 5.1.6: Achieve total Landscape cost/acre ± 5% of APPA Average for Peer Institutions Measure: Landscape cost/acre from annual APPA Facilities Performance Indicators Report (APPA Benchmark) Lead: Facilities Operations Balance Scorecard: Financial Perspective
82
Lead
F. O.
STATUS
$5.12
$6.71
$1.72
$3.30
$5.70
$6.30
$2.14
$3.31
$5.67
$7.03
$1.04
3.46
$4.30
$0.00
$0.50
$1.00
$1.50
$2.00
$2.50
$3.00
$3.50
$4.00
$4.50
$5.00
$5.50
$6.00
$6.50
$7.00
$7.50
East Carolina University Portland State University University of Texas San Antonio UNC Charlotte 2014 Peer AverageUNC Charlotte = 19.5% below
Peer Average
Grounds Total Cost per Acre
2012 2013 2014

Facilities Management Strategic Planning Session – First Quarter FY 2016
GOAL #5 – Promote Good Stewardship Objective: 5.1: Promote Fiscal Responsibility Tactic: 5.1.7: All Receipt Supported Funds Accounts have a positive balance at the end of the fiscal year Measure: Dollars in account at end of fiscal year Lead: Facilities Operations Balance Scorecard: Financial Perspective
83
Lead
F. O.
STATUS
0% 10% 20% 30% 40% 50% 60% 70% 80% 90% 100%
$671,684.02
24% of Annual Goal
$2,122,611.98
(Balance to meet Goal)
Dollars in Account at End of Fiscal Year
1st Qtr FY16 2nd Qtr FY16 3rd Qtr FY16 4th Qtr FY16
||||||||||||Goal$2.8M
Facilities Management Strategic Planning Session – First Quarter FY 2016
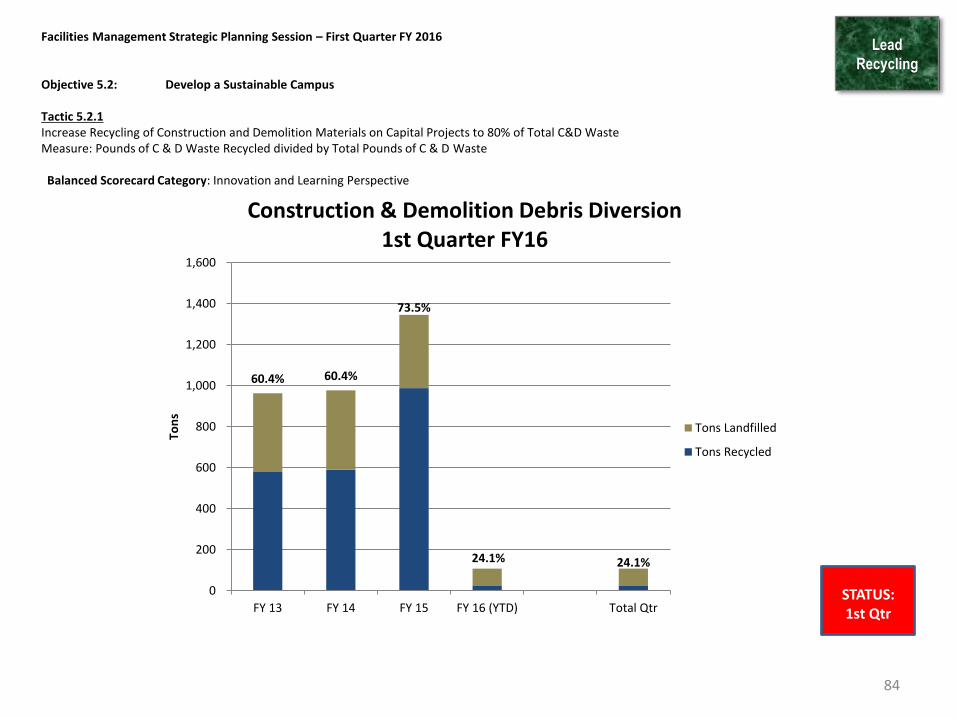
Objective 5.2: Develop a Sustainable Campus Tactic 5.2.1 Increase Recycling of Construction and Demolition Materials on Capital Projects to 80% of Total C&D Waste Measure: Pounds of C & D Waste Recycled divided by Total Pounds of C & D Waste Balanced Scorecard Category: Innovation and Learning Perspective
Lead
Recycling
84
STATUS: 1st Qtr
60.4% 60.4%
73.5%
24.1% 24.1%
0
200
400
600
800
1,000
1,200
1,400
1,600
FY 13 FY 14 FY 15 FY 16 (YTD) Total Qtr
Ton
s
Construction & Demolition Debris Diversion 1st Quarter FY16
Tons Landfilled
Tons Recycled

Facilities Management Strategic Planning Session – First Quarter FY 2016
Tactic 5.2.2 Increase Percent of Solid Waste Diversion on Campus to 45% by 2020 Measure: Pounds of Solid Waste Recycled, composted and reused Annually divided by Total Solid Waste Balanced Scorecard Category: Innovation and Learning Perspective
Lead
Recycling
85
*Notable increase in 4th quarter due to a Grounds project in May that removed tons of dirt from campus.

Lead
Recycling
GOAL #5 – Promote Good Stewardship Objective 5.2 Develop a Sustainable Campus Objective 5.2.2 Increase Percent of Solid Waste diversion on Campus to 45% by 2018
ACTION PLAN
• Waste Reduction and Recycling
Actions Complete • Continuing work with HRL to increase recycling rates in residence halls
• C&D Coordinator/Contract Administrator position filled; she begins November 30.
• Began Football season – Zero Waste programming. New signs and fewer volunteers.
2nd Quarter Actions Planned • Onboarding C&D Coordinator. (First day is November 30)
• Continue to conduct Waste audits for campus to determine amount of recyclables in waste stream – ON HOLD (space constraints and scheduling)
• Conduct waste audits in housing quads where there are no recycling bins (continue working with HRL to pair up all trash and recycling bins) – ON HOLD (space constraints and scheduling)
• Complete Football season (signage, materials sorting)
• Expand green events and explore going zero waste at basketball
• Continue working with FIS to update recycling location map
86

GOAL #5 – Promote Good Stewardship Objective: 5.2: Develop a Sustainable Campus Tactic 5.2.3: Achieve silver rating on the Sustainability Tracking and Reporting System (STARS) NLT end of FY 16. Measure: STARS points to achieve silver rating Lead: Facilities Planning Balanced Scorecard Category: Innovation and Learning Perspective
87
ACTION PLAN
o Assess additional actions list for achieving STARS Silver (completed – documentation actions only).
o Renewed AASHE and STARS Subscriptions
o Submit for rating by end of year.
Lead
Facilities
Planning
STATUS

Lead
Facilities
Planning
88
Percentage of Completion
1.10 Silver Rating 1.0
.9
.8
.7
.6
.5
.4
.3
.2
.1
Facilities Management Strategic Planning Session – First Quarter FY 2016 GOAL #5 – Promote Good Stewardship Objective: 5.2: Develop a Sustainable Campus Tactic 5.2.3: Achieve silver rating on the Sustainability Tracking and Reporting System (STARS) NLT end of FY 16. Measure: STARS points to achieve silver rating Lead: Facilities Planning Balanced Scorecard Category: Innovation and Learning Perspective
STATUS
1st
Qtr
FY
16
81%
4th
Qtr
FY
15
92% 72%
92%
2n
d Q
tr
FY 1
5
3rd
Qtr
FY
15
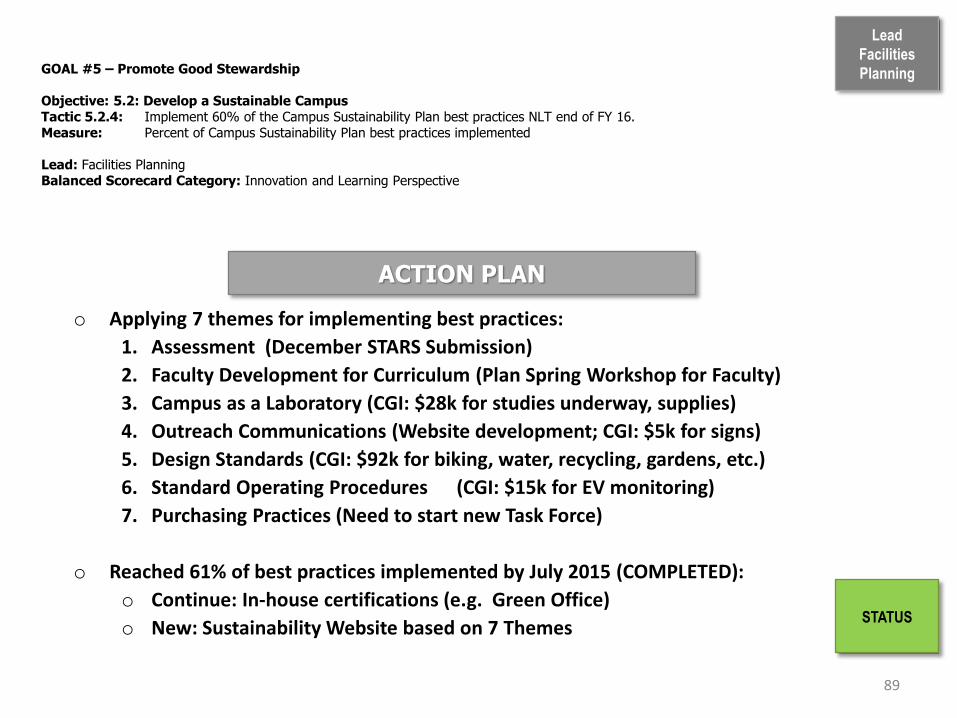
GOAL #5 – Promote Good Stewardship Objective: 5.2: Develop a Sustainable Campus Tactic 5.2.4: Implement 60% of the Campus Sustainability Plan best practices NLT end of FY 16. Measure: Percent of Campus Sustainability Plan best practices implemented Lead: Facilities Planning Balanced Scorecard Category: Innovation and Learning Perspective
89
ACTION PLAN
o Applying 7 themes for implementing best practices:
1. Assessment (December STARS Submission)
2. Faculty Development for Curriculum (Plan Spring Workshop for Faculty)
3. Campus as a Laboratory (CGI: $28k for studies underway, supplies)
4. Outreach Communications (Website development; CGI: $5k for signs)
5. Design Standards (CGI: $92k for biking, water, recycling, gardens, etc.)
6. Standard Operating Procedures (CGI: $15k for EV monitoring)
7. Purchasing Practices (Need to start new Task Force)
o Reached 61% of best practices implemented by July 2015 (COMPLETED):
o Continue: In-house certifications (e.g. Green Office)
o New: Sustainability Website based on 7 Themes
Lead
Facilities
Planning
STATUS

Lead
Facilities
Planning
90
Percentage of Completion 2
nd Q
tr
FY 1
5
100 90 80 70
Best Practices 60 50 40 30 20 10
0
Facilities Management Strategic Planning Session – First Quarter FY 2016 GOAL #5 – Promote Good Stewardship Objective: 5.2: Develop a Sustainable Campus Tactic 5.2.4: Implement 60% of the Campus Sustainability Plan best practices NLT end of FY 16. Measure: Percent of Campus Sustainability Plan best practices implemented Lead: Facilities Planning Balanced Scorecard Category: Innovation and Learning Perspective
STATUS
4th
Qtr
FY
15
61%
1st
Qtr
FY
16
3rd
Qtr
FY
15
57% 47%
61%

Lead
Capital
GOAL #5 – Promote Good Stewardship Objective 5.3 Conserve Natural Resources Tactics 5.3.1 Decrease Energy Usage 30% by FY2015
ACTIONS TO REDUCE CAMPUS ENERGY USAGE
91
• System Wide Lighting Performance Contract
• Continue retro-commissioning program
• Exterior Lighting upgrades to LED
• Street light replacements fixtures have been finalized project to
be complete by Jan.
• Replacing building mounted HID’s
• Pedestrian Lights to be replaced as funds become available –
start with campus core.
• New Goal of 40% reduction by 2025

Lead
Capital
GOAL #5 – Promote Good Stewardship Objective 5.3 Conserve Natural Resources Tactics 5.3.1 Decrease Energy Usage 30% by FY2015
ACCOMPLISHMENTS
92
• 2014 to 2015
• GSF Increased 4%
• Utility $ decreased by 2%
• $/GSF decreased by 9%
• Energy usage decreased by 4%

Facilities Management Strategic Planning Session – First Quarter FY 2016 GOAL #5 – Promote Good Stewardship Objective 5.3 Conserve Natural Resources Tactics 5.3.1 Decrease Energy Usage by 40% by FY2025 Measure: BTUs/GSF/Year consumed on campus
Balanced Scorecard Category: Financial Perspective
Lead
Capital
STATUS
CAMPUS ENERGY USAGE
Kbtu/GSF
Base Year FY 2003 Current Reduction 33% System Goal of 40% by 2025
124 117
113 109
93 90 82.5 81.6
74
0
20
40
60
80
100
120
140
FY03 FY10 FY11 FY12 FY13 FY14 FY15 FY16 FY25 GOAL
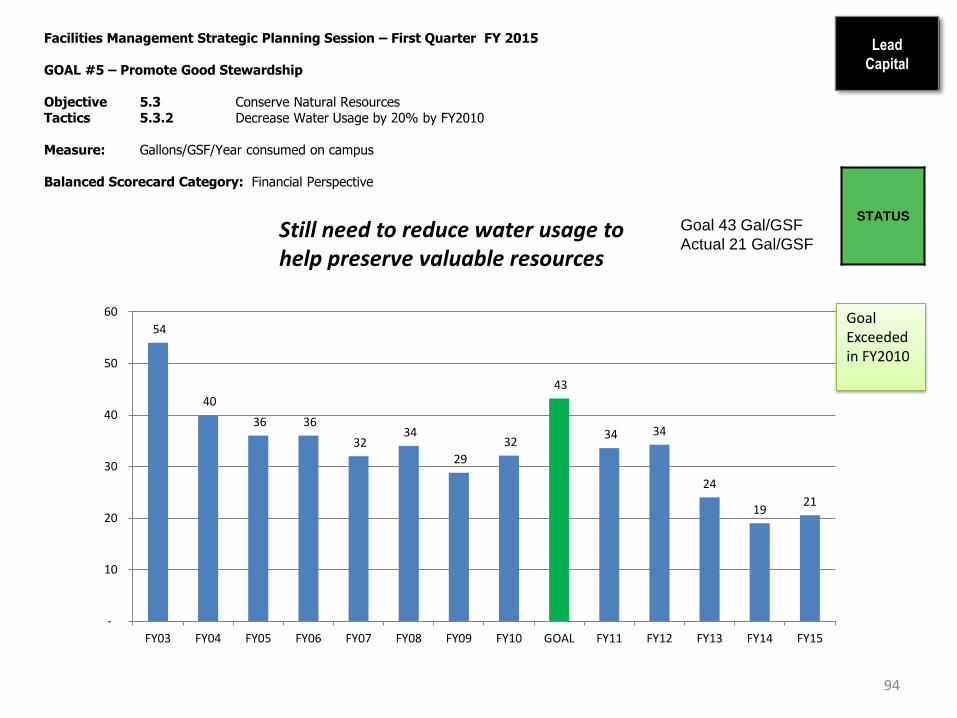
Facilities Management Strategic Planning Session – First Quarter FY 2015 GOAL #5 – Promote Good Stewardship Objective 5.3 Conserve Natural Resources Tactics 5.3.2 Decrease Water Usage by 20% by FY2010 Measure: Gallons/GSF/Year consumed on campus
Balanced Scorecard Category: Financial Perspective
Lead
Capital
94
STATUS
Still need to reduce water usage to help preserve valuable resources
Goal 43 Gal/GSF
Actual 21 Gal/GSF
54
40
36 36
32 34
29
32
43
34 34
24
19 21
-
10
20
30
40
50
60
FY03 FY04 FY05 FY06 FY07 FY08 FY09 FY10 GOAL FY11 FY12 FY13 FY14 FY15
Goal Exceeded in FY2010

Lead
Capital GOAL #5 – Promote Good Stewardship Objective 5.4: Improve Historically Underutilized Businesses (HUB) Participation Tactic 5.4.1: 12% HUB participation on 80% of Capital Projects Tactic 5.4.2: 5% African American Participation on Capital Projects
ACTION PLAN
Establish project specific participation goals for single prime projects
Challenge GCs to obtain 25% or better participation on CMAR projects
Review GFE documentation for compliance before 1st tier subcontracts are awarded on CMAR projects
Work with internal/external groups to identify skilled HUB contractors
Work with GA/SCO/DOA to ensure HUB information is accurately reflected in InterscopePlus
Work with SCO to revise new Prequalification Policy
Conduct Construction Meet & Greet March 10, 2016
95
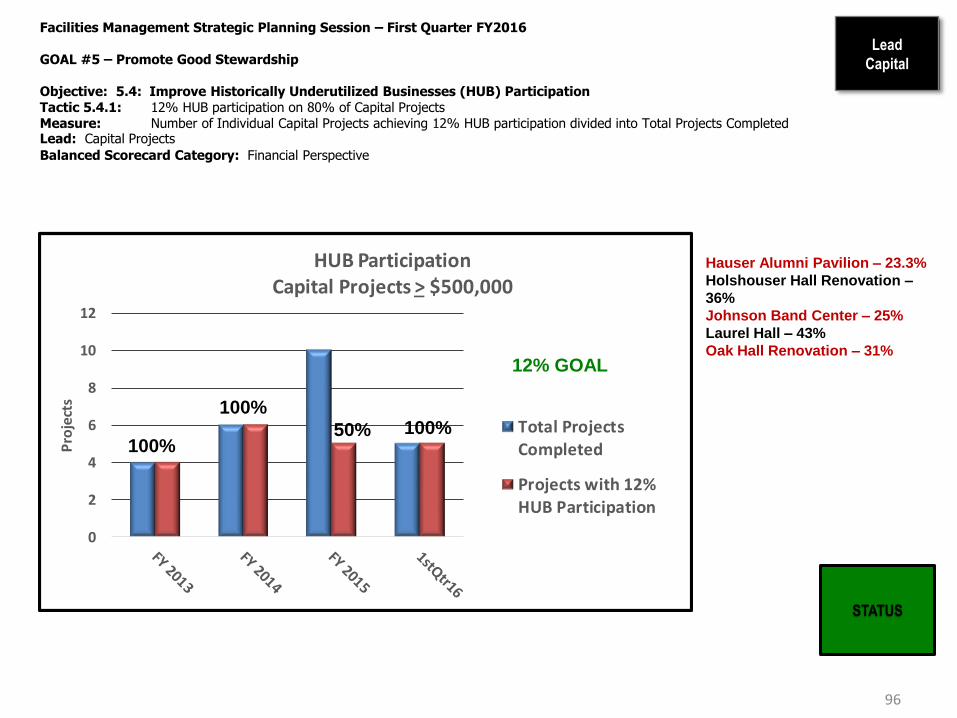
Facilities Management Strategic Planning Session – First Quarter FY2016 GOAL #5 – Promote Good Stewardship Objective: 5.4: Improve Historically Underutilized Businesses (HUB) Participation Tactic 5.4.1: 12% HUB participation on 80% of Capital Projects Measure: Number of Individual Capital Projects achieving 12% HUB participation divided into Total Projects Completed Lead: Capital Projects
Balanced Scorecard Category: Financial Perspective
Lead
Capital
96
STATUS
0
2
4
6
8
10
12
Pro
ject
s
HUB Participation Capital Projects > $500,000
Total ProjectsCompleted
Projects with 12%HUB Participation
Hauser Alumni Pavilion – 23.3%
Holshouser Hall Renovation –
36%
Johnson Band Center – 25%
Laurel Hall – 43%
Oak Hall Renovation – 31%
100%
100%
50% 100%
12% GOAL
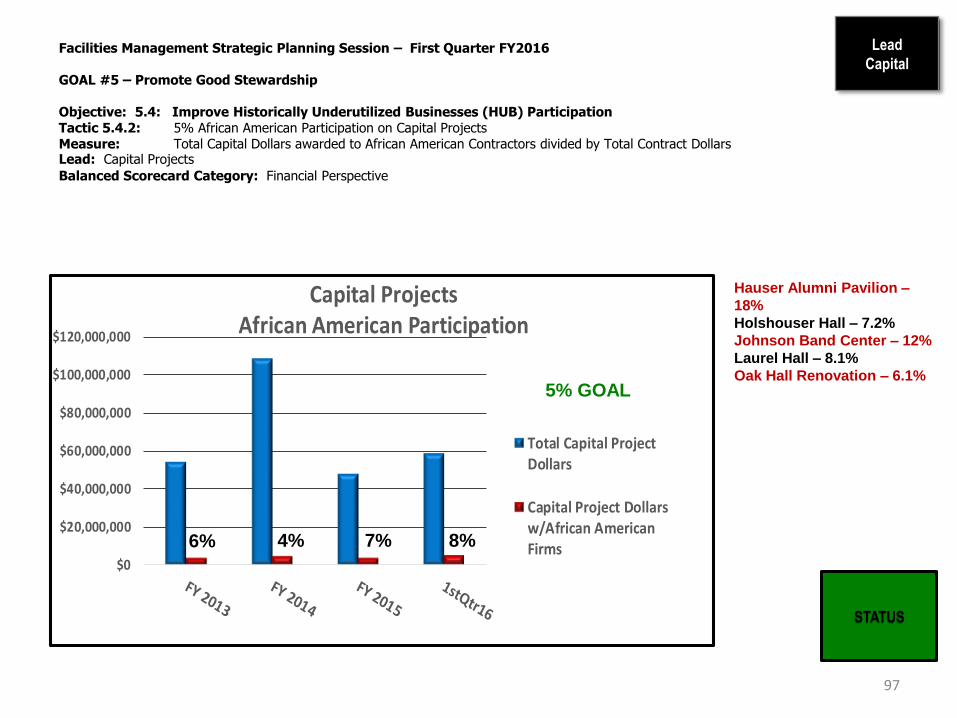
Facilities Management Strategic Planning Session – First Quarter FY2016 GOAL #5 – Promote Good Stewardship Objective: 5.4: Improve Historically Underutilized Businesses (HUB) Participation Tactic 5.4.2: 5% African American Participation on Capital Projects Measure: Total Capital Dollars awarded to African American Contractors divided by Total Contract Dollars Lead: Capital Projects
Balanced Scorecard Category: Financial Perspective
Lead
Capital
97
STATUS
$0
$20,000,000
$40,000,000
$60,000,000
$80,000,000
$100,000,000
$120,000,000
Capital Projects African American Participation
Total Capital ProjectDollars
Capital Project Dollarsw/African AmericanFirms
Hauser Alumni Pavilion –
18%
Holshouser Hall – 7.2%
Johnson Band Center – 12%
Laurel Hall – 8.1%
Oak Hall Renovation – 6.1%
6% 4% 7%
8%
5% GOAL

Facilities Management Strategic Planning Session – First Quarter FY2016 GOAL #5 – Promote Good Stewardship Objective: 5.4: Improve Historically Underutilized Businesses (HUB) Participation Tactic 5.4.3: 15% overall HUB participation on Informal contracts $30,000 and above Measure: Total Informal Contract Dollars awarded to HUB Contractors divided by Total Contract Dollars Lead: Capital Projects Balanced Scorecard Category: Financial Perspective
Lead
Capital
98
STATUS
$0
$1,000,000
$2,000,000
$3,000,000
$4,000,000
$5,000,000
$6,000,000
HUB Participation Informal Projects > $30,000
Total InformalProject Dollars
Informal ProjectDollars w/HUB Firms
15% GOAL
40% 39%
52%
100%
GOAL #5 – Promote Good Stewardship Objective: 5.4: Improve Historically Underutilized Business (HUB) Participation Lead: Design Services Balanced Scorecard Category: Internal Business Process
99
Lead Design Services
Tactic 5.4.4: 13% overall HUB participation on informal projects below $30,000 including 3% African American Measure: Total Percentage of HUB participation on all Informal Projects below $30,000 (Construction only) divided by Total Contracts Tactic 5.4.5: 3% African American participation on Informal projects below $30,000 Measure: Total African American contract dollars (Construction only) divided by Total Contract Dollars
Design Services’ HUB participation improvement is currently focused on expanding our outreach to new African American contractors & vendors.
All Coordinators are encouraged to reach out to new vendors for work on our Under $30K projects - Ongoing.
ACTION PLANS FOR IMPROVEMENT
ONGOING IMPROVEMENTS
NEW IMPROVEMENTS
Project Coordinators continue to review and discuss HUB contractors and vendors at Design Services weekly meetings.
Amanda Caudle acts as advisor for other Coordinators.
Design Services and Facilities Information Systems are working to improve HUB reporting of contractors & vendors via ARCHIBUS Strategic Quarterly Reports.
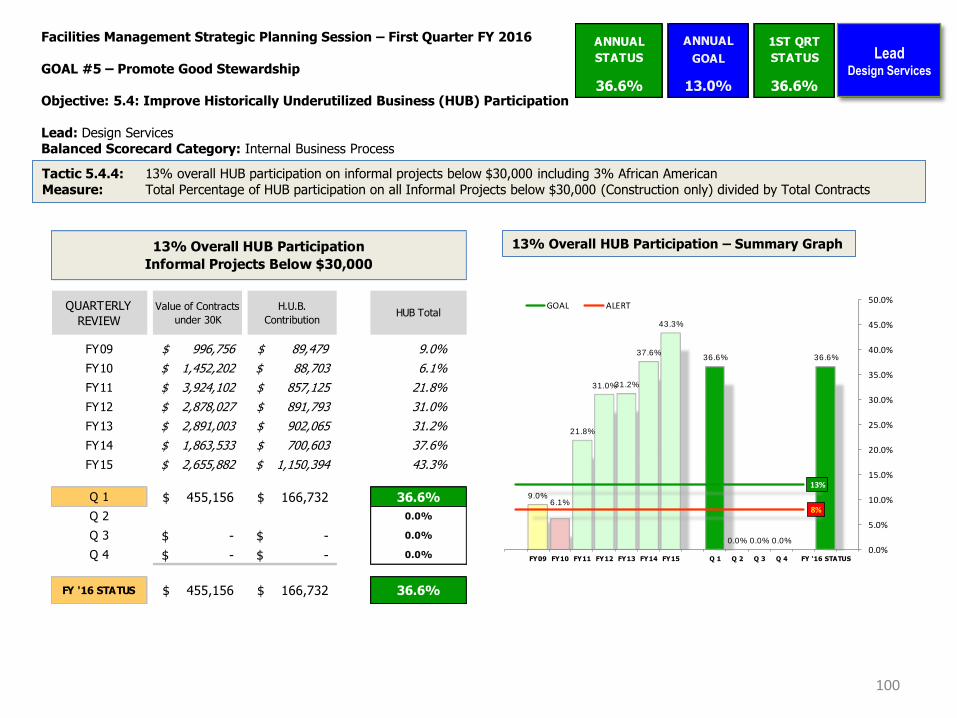
Facilities Management Strategic Planning Session – First Quarter FY 2016 GOAL #5 – Promote Good Stewardship Objective: 5.4: Improve Historically Underutilized Business (HUB) Participation Lead: Design Services Balanced Scorecard Category: Internal Business Process
100
Lead Design Services
13% Overall HUB Participation – Summary Graph
Tactic 5.4.4: 13% overall HUB participation on informal projects below $30,000 including 3% African American Measure: Total Percentage of HUB participation on all Informal Projects below $30,000 (Construction only) divided by Total Contracts
QUARTERLY
REVIEW
Value of Contracts
under 30K
H.U.B.
ContributionHUB Total
FY09 $ 996,756 $ 89,479 9.0%
FY10 1,452,202$ 88,703$ 6.1%
FY11 3,924,102$ 857,125$ 21.8%
FY12 2,878,027$ 891,793$ 31.0%
FY13 2,891,003$ 902,065$ 31.2%
FY14 1,863,533$ 700,603$ 37.6%
FY15 2,655,882$ 1,150,394$ 43.3%
Q 1 455,156$ 166,732$ 36.6%
Q 2 0.0%
Q 3 -$ -$ 0.0%
Q 4 -$ -$ 0.0%
FY '16 STATUS 455,156$ 166,732$ 36.6%
13% Overall HUB Participation
Informal Projects Below $30,000
9.0%6.1%
21.8%
31.0%31.2%
37.6%
43.3%
36.6%
0.0% 0.0% 0.0%
36.6%
13%
8%
0.0%
5.0%
10.0%
15.0%
20.0%
25.0%
30.0%
35.0%
40.0%
45.0%
50.0%
FY09 FY10 FY11 FY12 FY13 FY14 FY15 Q 1 Q 2 Q 3 Q 4 FY '16 STATUS
GOAL ALERT
ANNUAL ANNUAL 1ST QRT
STATUS GOAL STATUS
36.6% 13.0% 36.6%

Facilities Management Strategic Planning Session – First Quarter FY 2016 GOAL #5 – Promote Good Stewardship Objective: 5.4: Improve Historically Underutilized Business (HUB) Participation Lead: Design Services Balanced Scorecard Category: Internal Business Process
101
Lead Design Services
3% African American Participation – Summary Graph
Tactic 5.4.5: 3% African American participation on Informal projects below $30,000 Measure: Total African American contract dollars divided by Total Contract Dollars
QUARTERLY
REVIEW
Value of Contracts
under 30K
African Am.
ContributionAfrican Am. Total
FY09 $ 996,756 $ 40,894 4.1%
FY10 1,452,202$ 73,987$ 5.1%
FY11 3,924,102$ 77,377$ 2.0%
FY12 2,878,027$ 46,475$ 1.6%
FY13 2,891,003$ 115,219$ 4.0%
FY14 1,863,533$ 103,513$ 5.6%
FY15 2,655,882$ 46,795$ 1.8%
Q 1 455,156$ 1,250$ 0.3%
Q 2 0.0%
Q 3 -$ -$ 0.0%
Q 4 -$ -$ 0.0%
FY16 STATUS 455,156$ 1,250$ 0.3%
3% African American Participation
Informal Projects Below $30,000
4.1%
5.1%
2.0%1.6%
4.0%
5.6%
1.8%
0.3%
0.0% 0.0% 0.0%
0.3%
3%
2%
0.0%
1.0%
2.0%
3.0%
4.0%
5.0%
6.0%
FY09 FY10 FY11 FY12 FY13 FY14 FY15 Q 1 Q 2 Q 3 Q 4 FY16 STATUS
GOAL ALERT
ANNUAL ANNUAL 1ST QRT
STATUS GOAL STATUS
0.3% 3.0% 0.3%