Embed Size (px)
Citation preview
Facilitate Biomarker Discovery Using Integrated “Omics” Differential Analysis with High Resolution Accurate LC/MS Approach Reiko Kiyonami1, Sergei Snovida2, Devin Drew1, Rosa Viner1, Julian Saba1, David Peake1, Andreas Huhmer1, Ken Miller1, 1Thermo Fisher Scientific, San Jose, CA, USA; 2Thermo Fisher Scientific, Rockford, IL, USA
Po
ster No
te 64
735
Reiko Kiyonami1, Sergei Snovida2, Devin Drew1, Rosa Viner1 , Julian Saba1, David Peake1, Andreas Huhmer1, Ken Miller1, 1Thermo Fisher Scientific, San Jose, CA, USA, 2 Thermo Fisher Scientific, Rockford, IL, USA
RESULTS Lipidomics
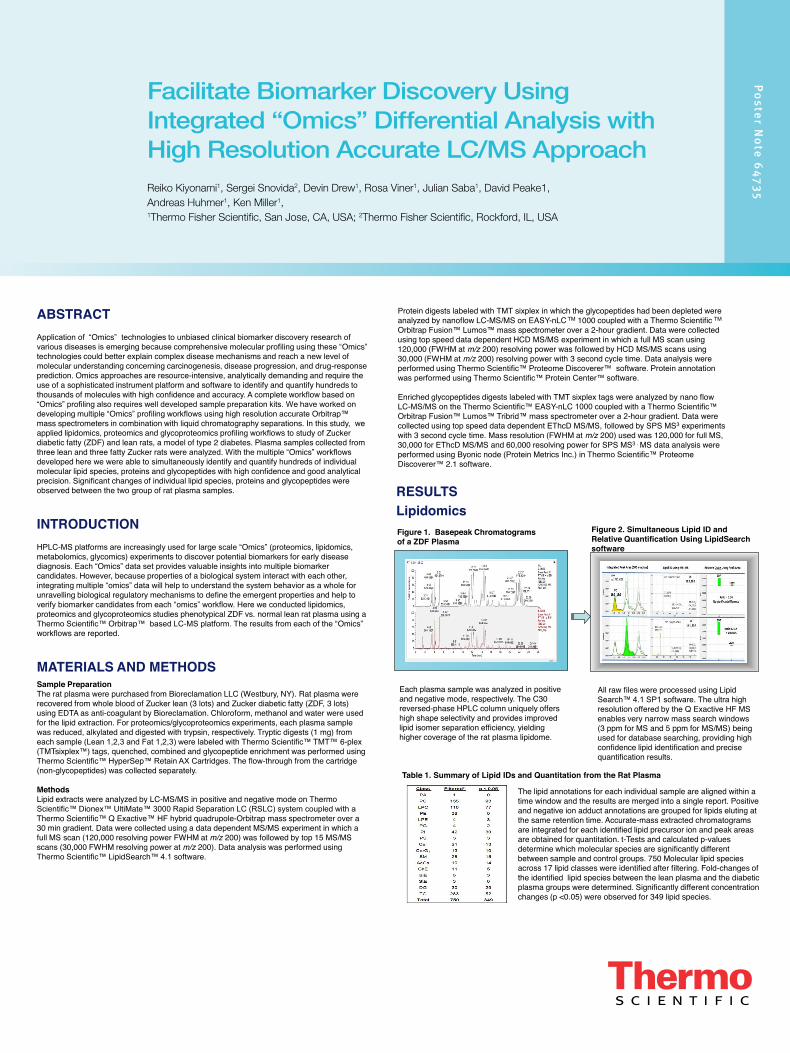
Table 1. Summary of Lipid IDs and Quantitation from the Rat Plasma
The lipid annotations for each individual sample are aligned within a time window and the results are merged into a single report. Positive and negative ion adduct annotations are grouped for lipids eluting at the same retention time. Accurate-mass extracted chromatograms are integrated for each identified lipid precursor ion and peak areas are obtained for quantitation. t-Tests and calculated p-values determine which molecular species are significantly different between sample and control groups. 750 Molecular lipid species across 17 lipid classes were identified after filtering. Fold-changes of the identified lipid species between the lean plasma and the diabetic plasma groups were determined. Significantly different concentration changes (p <0.05) were observed for 349 lipid species.
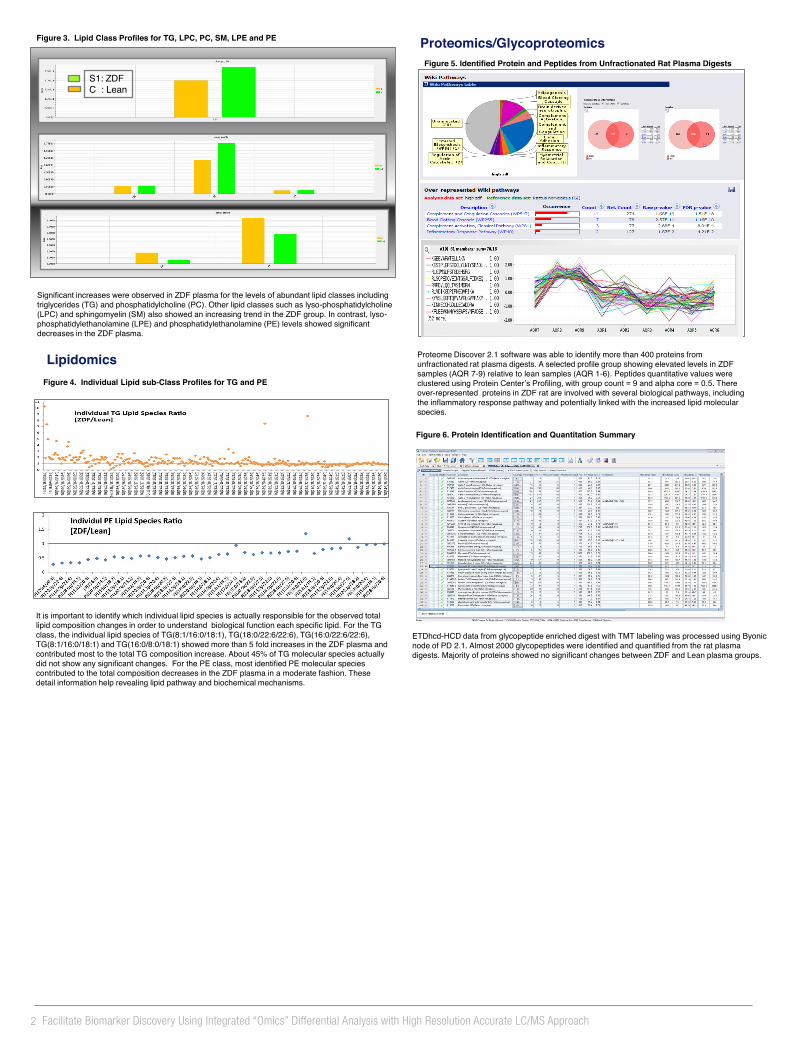
Figure 3. Lipid Class Profiles for TG, LPC, PC, SM, LPE and PE
Proteome Discover 2.1 software was able to identify more than 400 proteins from unfractionated rat plasma digests. A selected profile group showing elevated levels in ZDF samples (AQR 7-9) relative to lean samples (AQR 1-6). Peptides quantitative values were clustered using Protein Center’s Profiling, with group count = 9 and alpha core = 0.5. There over-represented proteins in ZDF rat are involved with several biological pathways, including the inflammatory response pathway and potentially linked with the increased lipid molecular species.
Significant increases were observed in ZDF plasma for the levels of abundant lipid classes including triglycerides (TG) and phosphatidylcholine (PC). Other lipid classes such as lyso-phosphatidylcholine (LPC) and sphingomyelin (SM) also showed an increasing trend in the ZDF group. In contrast, lyso-phosphatidylethanolamine (LPE) and phosphatidylethanolamine (PE) levels showed significant decreases in the ZDF plasma.
Figure 1. Basepeak Chromatograms of a ZDF Plasma
Each plasma sample was analyzed in positive and negative mode, respectively. The C30 reversed-phase HPLC column uniquely offers high shape selectivity and provides improved lipid isomer separation efficiency, yielding higher coverage of the rat plasma lipidome.
All raw files were processed using Lipid Search™ 4.1 SP1 software. The ultra high resolution offered by the Q Exactive HF MS enables very narrow mass search windows (3 ppm for MS and 5 ppm for MS/MS) being used for database searching, providing high confidence lipid identification and precise quantification results.
Figure 6. Protein Identification and Quantitation Summary
ABSTRACT Application of “Omics” technologies to unbiased clinical biomarker discovery research of various diseases is emerging because comprehensive molecular profiling using these “Omics” technologies could better explain complex disease mechanisms and reach a new level of molecular understanding concerning carcinogenesis, disease progression, and drug-response prediction. Omics approaches are resource-intensive, analytically demanding and require the use of a sophisticated instrument platform and software to identify and quantify hundreds to thousands of molecules with high confidence and accuracy. A complete workflow based on “Omics” profiling also requires well developed sample preparation kits. We have worked on developing multiple “Omics” profiling workflows using high resolution accurate Orbitrap™ mass spectrometers in combination with liquid chromatography separations. In this study, we applied lipidomics, proteomics and glycoproteomics profiling workflows to study of Zucker diabetic fatty (ZDF) and lean rats, a model of type 2 diabetes. Plasma samples collected from three lean and three fatty Zucker rats were analyzed. With the multiple “Omics” workflows developed here we were able to simultaneously identify and quantify hundreds of individual molecular lipid species, proteins and glycopeptides with high confidence and good analytical precision. Significant changes of individual lipid species, proteins and glycopeptides were observed between the two group of rat plasma samples. INTRODUCTION HPLC-MS platforms are increasingly used for large scale “Omics” (proteomics, lipidomics, metabolomics, glycomics) experiments to discover potential biomarkers for early disease diagnosis. Each “Omics” data set provides valuable insights into multiple biomarker candidates. However, because properties of a biological system interact with each other, integrating multiple “omics” data will help to understand the system behavior as a whole for unravelling biological regulatory mechanisms to define the emergent properties and help to verify biomarker candidates from each “omics” workflow. Here we conducted lipidomics, proteomics and glycoproteomics studies phenotypical ZDF vs. normal lean rat plasma using a Thermo Scientific™ Orbitrap™ based LC-MS platform. The results from each of the “Omics” workflows are reported. MATERIALS AND METHODS Sample Preparation The rat plasma were purchased from Bioreclamation LLC (Westbury, NY). Rat plasma were recovered from whole blood of Zucker lean (3 lots) and Zucker diabetic fatty (ZDF, 3 lots) using EDTA as anti-coagulant by Bioreclamation. Chloroform, methanol and water were used for the lipid extraction. For proteomics/glycoproteomics experiments, each plasma sample was reduced, alkylated and digested with trypsin, respectively. Tryptic digests (1 mg) from each sample (Lean 1,2,3 and Fat 1,2,3) were labeled with Thermo Scientific™ TMT™ 6-plex (TMTsixplex™) tags, quenched, combined and glycopeptide enrichment was performed using Thermo Scientific™ HyperSep™ Retain AX Cartridges. The flow-through from the cartridge (non-glycopeptides) was collected separately. Methods Lipid extracts were analyzed by LC-MS/MS in positive and negative mode on Thermo Scientific™ Dionex™ UltiMate™ 3000 Rapid Separation LC (RSLC) system coupled with a Thermo Scientific™ Q Exactive™ HF hybrid quadrupole-Orbitrap mass spectrometer over a 30 min gradient. Data were collected using a data dependent MS/MS experiment in which a full MS scan (120,000 resolving power FWHM at m/z 200) was followed by top 15 MS/MS scans (30,000 FWHM resolving power at m/z 200). Data analysis was performed using Thermo Scientific™ LipidSearch™ 4.1 software. Protein digests labeled with TMT sixplex in which the glycopeptides had been depleted were analyzed by nanoflow LC-MS/MS on EASY-nLC TM 1000 coupled with a Thermo Scientific TM Orbitrap Fusion™ Lumos™ mass spectrometer over a 2-hour gradient. Data were collected using top speed data dependent HCD MS/MS experiment in which a full MS scan using 120,000 (FWHM at m/z 200) resolving power was followed by HCD MS/MS scans using 30,000 (FWHM at m/z 200) resolving power with 3 second cycle time. Data analysis were performed using Thermo Scientific™ Proteome Discoverer™ software. Protein annotation was performed using Thermo Scientific™ Protein Center™ software. Enriched glycopeptides digests labeled with TMT sixplex tags were analyzed by nano flow LC-MS/MS on the Thermo Scientific™ EASY-nLC 1000 coupled with a Thermo Scientific™ Orbitrap Fusion™ Lumos™ Tribrid™ mass spectrometer over a 2-hour gradient. Data were collected using top speed data dependent EThcD MS/MS, followed by SPS MS3 experiments with 3 second cycle time. Mass resolution (FWHM at m/z 200) used was 120,000 for full MS, 30,000 for EThcD MS/MS and 60,000 resolving power for SPS MS3 . MS data analysis were performed using Byonic node (Protein Metrics Inc.) in Thermo Scientific™ Proteome Discoverer™ 2.1 software.
CONCLUSIONS • Complete multiple “Omics” workflows were developed on high resolution accurate
mass Orbitrap – based mass spectrometers coupled with liquid chromatography separation and sophisticated data processing software. The ultra high resolution offered by Orbitrap detector enables another dimension of mass separation, yielding confident unknown molecular identification and precise quantification.
• 750 Molecular lipid species were identified and quantified from the rat plasma samples. The relative concentration changes between the ZDF and lean plasma groups were measured at both total lipid class composition and individual lipid molecular species composition, providing more potential biological insights into understanding the complex processes that lead to the development of diabetes.
• Unique data dependent EThcD MS/MS and SPS MS3 workflows enabled very precise protein/peptide quantitation in a high throughput fashion. Unambiguous glycopeptide characterization was performed using HRAM EThcD spectra. Precise relative quantitation was carried out using HRAM SPS HCD MS3 data.
• Significant increases of glycopeptides containing high mannose species were observed between the ZDF and lean plasma without any changes at the protein level. Further studies will be done to see if these glycan composition changes are linked with lipid molecular species changes.
TRADEMARKS © 2016 Thermo Fisher Scientific Inc. All rights reserved. Lipid Search is a registered trademark of MKI. TMT and TMTsixplex are trademarks of Proteome Sciences plc. All other trademarks are the property of Thermo Fisher Scientific and its subsidiaries. This information is not intended to encourage use of these products in any manner that might infringe the intellectual property rights of others. For research use only. Not for use in diagnostic procedures.
Facilitate Biomarker Discovery Using Integrated “Omics” Differential Analysis with High Resolution Accurate LC/MS Approach
Lipidomics Proteomics/Glycoproteomics
Figure 2. Simultaneous Lipid ID and Relative Quantification Using LipidSearch software
S1: ZDF C : Lean
Figure 4. Individual Lipid sub-Class Profiles for TG and PE
It is important to identify which individual lipid species is actually responsible for the observed total lipid composition changes in order to understand biological function each specific lipid. For the TG class, the individual lipid species of TG(8:1/16:0/18:1), TG(18:0/22:6/22:6), TG(16:0/22:6/22:6), TG(8:1/16:0/18:1) and TG(16:0/8:0/18:1) showed more than 5 fold increases in the ZDF plasma and contributed most to the total TG composition increase. About 45% of TG molecular species actually did not show any significant changes. For the PE class, most identified PE molecular species contributed to the total composition decreases in the ZDF plasma in a moderate fashion. These detail information help revealing lipid pathway and biochemical mechanisms.
The protein of the Alpha-1 inhibitor did not show changes in protein levels. However, significant changes in glycopeptide profiles were observed as shown in Figure 7. For example, the amount of high mannose glycoforms for site N321 increased 2-4 times in ZDF rat plasma (Figure 8), but there are no changes for hybrid/complex glycosylated species.
Proteomics/Glycoproteomics Figure 5. Identified Protein and Peptides from Unfractionated Rat Plasma Digests
ETDhcd-HCD data from glycopeptide enriched digest with TMT labeling was processed using Byonic node of PD 2.1. Almost 2000 glycopeptides were identified and quantified from the rat plasma digests. Majority of proteins showed no significant changes between ZDF and Lean plasma groups.
0.5
2.3 2
2.4
4
0.2 0.98 0.875
0 0.5
1 1.5
2 2.5
3 3.5
4 4.5
Fat/Lean
Fat/Lean
Figure 7. Identification and Quantitation Results for Alpha-1 inhibitor , P14046
No changes on Protein level
Significant changes on Peptide level
Proteomics/Glycoproteomics
Figure 6. Expression Fold Changes of Peptide HVNATVTEEGTGSEFSGSGR- Site N321 in Alpha-1 inhibitor, P14046
The up and down changes in the peptide level with different glycan composition. High mannose species are up and complex/hybrid glycans are down.
Reiko Kiyonami1, Sergei Snovida2, Devin Drew1, Rosa Viner1 , Julian Saba1, David Peake1, Andreas Huhmer1, Ken Miller1, 1Thermo Fisher Scientific, San Jose, CA, USA, 2 Thermo Fisher Scientific, Rockford, IL, USA
RESULTS Lipidomics
Table 1. Summary of Lipid IDs and Quantitation from the Rat Plasma
The lipid annotations for each individual sample are aligned within a time window and the results are merged into a single report. Positive and negative ion adduct annotations are grouped for lipids eluting at the same retention time. Accurate-mass extracted chromatograms are integrated for each identified lipid precursor ion and peak areas are obtained for quantitation. t-Tests and calculated p-values determine which molecular species are significantly different between sample and control groups. 750 Molecular lipid species across 17 lipid classes were identified after filtering. Fold-changes of the identified lipid species between the lean plasma and the diabetic plasma groups were determined. Significantly different concentration changes (p <0.05) were observed for 349 lipid species.
Figure 3. Lipid Class Profiles for TG, LPC, PC, SM, LPE and PE
Proteome Discover 2.1 software was able to identify more than 400 proteins from unfractionated rat plasma digests. A selected profile group showing elevated levels in ZDF samples (AQR 7-9) relative to lean samples (AQR 1-6). Peptides quantitative values were clustered using Protein Center’s Profiling, with group count = 9 and alpha core = 0.5. There over-represented proteins in ZDF rat are involved with several biological pathways, including the inflammatory response pathway and potentially linked with the increased lipid molecular species.
Significant increases were observed in ZDF plasma for the levels of abundant lipid classes including triglycerides (TG) and phosphatidylcholine (PC). Other lipid classes such as lyso-phosphatidylcholine (LPC) and sphingomyelin (SM) also showed an increasing trend in the ZDF group. In contrast, lyso-phosphatidylethanolamine (LPE) and phosphatidylethanolamine (PE) levels showed significant decreases in the ZDF plasma.
Figure 1. Basepeak Chromatograms of a ZDF Plasma
Each plasma sample was analyzed in positive and negative mode, respectively. The C30 reversed-phase HPLC column uniquely offers high shape selectivity and provides improved lipid isomer separation efficiency, yielding higher coverage of the rat plasma lipidome.
All raw files were processed using Lipid Search™ 4.1 SP1 software. The ultra high resolution offered by the Q Exactive HF MS enables very narrow mass search windows (3 ppm for MS and 5 ppm for MS/MS) being used for database searching, providing high confidence lipid identification and precise quantification results.
Figure 6. Protein Identification and Quantitation Summary
ABSTRACT Application of “Omics” technologies to unbiased clinical biomarker discovery research of various diseases is emerging because comprehensive molecular profiling using these “Omics” technologies could better explain complex disease mechanisms and reach a new level of molecular understanding concerning carcinogenesis, disease progression, and drug-response prediction. Omics approaches are resource-intensive, analytically demanding and require the use of a sophisticated instrument platform and software to identify and quantify hundreds to thousands of molecules with high confidence and accuracy. A complete workflow based on “Omics” profiling also requires well developed sample preparation kits. We have worked on developing multiple “Omics” profiling workflows using high resolution accurate Orbitrap™ mass spectrometers in combination with liquid chromatography separations. In this study, we applied lipidomics, proteomics and glycoproteomics profiling workflows to study of Zucker diabetic fatty (ZDF) and lean rats, a model of type 2 diabetes. Plasma samples collected from three lean and three fatty Zucker rats were analyzed. With the multiple “Omics” workflows developed here we were able to simultaneously identify and quantify hundreds of individual molecular lipid species, proteins and glycopeptides with high confidence and good analytical precision. Significant changes of individual lipid species, proteins and glycopeptides were observed between the two group of rat plasma samples. INTRODUCTION HPLC-MS platforms are increasingly used for large scale “Omics” (proteomics, lipidomics, metabolomics, glycomics) experiments to discover potential biomarkers for early disease diagnosis. Each “Omics” data set provides valuable insights into multiple biomarker candidates. However, because properties of a biological system interact with each other, integrating multiple “omics” data will help to understand the system behavior as a whole for unravelling biological regulatory mechanisms to define the emergent properties and help to verify biomarker candidates from each “omics” workflow. Here we conducted lipidomics, proteomics and glycoproteomics studies phenotypical ZDF vs. normal lean rat plasma using a Thermo Scientific™ Orbitrap™ based LC-MS platform. The results from each of the “Omics” workflows are reported. MATERIALS AND METHODS Sample Preparation The rat plasma were purchased from Bioreclamation LLC (Westbury, NY). Rat plasma were recovered from whole blood of Zucker lean (3 lots) and Zucker diabetic fatty (ZDF, 3 lots) using EDTA as anti-coagulant by Bioreclamation. Chloroform, methanol and water were used for the lipid extraction. For proteomics/glycoproteomics experiments, each plasma sample was reduced, alkylated and digested with trypsin, respectively. Tryptic digests (1 mg) from each sample (Lean 1,2,3 and Fat 1,2,3) were labeled with Thermo Scientific™ TMT™ 6-plex (TMTsixplex™) tags, quenched, combined and glycopeptide enrichment was performed using Thermo Scientific™ HyperSep™ Retain AX Cartridges. The flow-through from the cartridge (non-glycopeptides) was collected separately. Methods Lipid extracts were analyzed by LC-MS/MS in positive and negative mode on Thermo Scientific™ Dionex™ UltiMate™ 3000 Rapid Separation LC (RSLC) system coupled with a Thermo Scientific™ Q Exactive™ HF hybrid quadrupole-Orbitrap mass spectrometer over a 30 min gradient. Data were collected using a data dependent MS/MS experiment in which a full MS scan (120,000 resolving power FWHM at m/z 200) was followed by top 15 MS/MS scans (30,000 FWHM resolving power at m/z 200). Data analysis was performed using Thermo Scientific™ LipidSearch™ 4.1 software. Protein digests labeled with TMT sixplex in which the glycopeptides had been depleted were analyzed by nanoflow LC-MS/MS on EASY-nLC TM 1000 coupled with a Thermo Scientific TM Orbitrap Fusion™ Lumos™ mass spectrometer over a 2-hour gradient. Data were collected using top speed data dependent HCD MS/MS experiment in which a full MS scan using 120,000 (FWHM at m/z 200) resolving power was followed by HCD MS/MS scans using 30,000 (FWHM at m/z 200) resolving power with 3 second cycle time. Data analysis were performed using Thermo Scientific™ Proteome Discoverer™ software. Protein annotation was performed using Thermo Scientific™ Protein Center™ software. Enriched glycopeptides digests labeled with TMT sixplex tags were analyzed by nano flow LC-MS/MS on the Thermo Scientific™ EASY-nLC 1000 coupled with a Thermo Scientific™ Orbitrap Fusion™ Lumos™ Tribrid™ mass spectrometer over a 2-hour gradient. Data were collected using top speed data dependent EThcD MS/MS, followed by SPS MS3 experiments with 3 second cycle time. Mass resolution (FWHM at m/z 200) used was 120,000 for full MS, 30,000 for EThcD MS/MS and 60,000 resolving power for SPS MS3 . MS data analysis were performed using Byonic node (Protein Metrics Inc.) in Thermo Scientific™ Proteome Discoverer™ 2.1 software.
CONCLUSIONS • Complete multiple “Omics” workflows were developed on high resolution accurate
mass Orbitrap – based mass spectrometers coupled with liquid chromatography separation and sophisticated data processing software. The ultra high resolution offered by Orbitrap detector enables another dimension of mass separation, yielding confident unknown molecular identification and precise quantification.
• 750 Molecular lipid species were identified and quantified from the rat plasma samples. The relative concentration changes between the ZDF and lean plasma groups were measured at both total lipid class composition and individual lipid molecular species composition, providing more potential biological insights into understanding the complex processes that lead to the development of diabetes.
• Unique data dependent EThcD MS/MS and SPS MS3 workflows enabled very precise protein/peptide quantitation in a high throughput fashion. Unambiguous glycopeptide characterization was performed using HRAM EThcD spectra. Precise relative quantitation was carried out using HRAM SPS HCD MS3 data.
• Significant increases of glycopeptides containing high mannose species were observed between the ZDF and lean plasma without any changes at the protein level. Further studies will be done to see if these glycan composition changes are linked with lipid molecular species changes.
TRADEMARKS © 2016 Thermo Fisher Scientific Inc. All rights reserved. Lipid Search is a registered trademark of MKI. TMT and TMTsixplex are trademarks of Proteome Sciences plc. All other trademarks are the property of Thermo Fisher Scientific and its subsidiaries. This information is not intended to encourage use of these products in any manner that might infringe the intellectual property rights of others. For research use only. Not for use in diagnostic procedures.
Facilitate Biomarker Discovery Using Integrated “Omics” Differential Analysis with High Resolution Accurate LC/MS Approach
Lipidomics Proteomics/Glycoproteomics
Figure 2. Simultaneous Lipid ID and Relative Quantification Using LipidSearch software
S1: ZDF C : Lean
Figure 4. Individual Lipid sub-Class Profiles for TG and PE
It is important to identify which individual lipid species is actually responsible for the observed total lipid composition changes in order to understand biological function each specific lipid. For the TG class, the individual lipid species of TG(8:1/16:0/18:1), TG(18:0/22:6/22:6), TG(16:0/22:6/22:6), TG(8:1/16:0/18:1) and TG(16:0/8:0/18:1) showed more than 5 fold increases in the ZDF plasma and contributed most to the total TG composition increase. About 45% of TG molecular species actually did not show any significant changes. For the PE class, most identified PE molecular species contributed to the total composition decreases in the ZDF plasma in a moderate fashion. These detail information help revealing lipid pathway and biochemical mechanisms.
The protein of the Alpha-1 inhibitor did not show changes in protein levels. However, significant changes in glycopeptide profiles were observed as shown in Figure 7. For example, the amount of high mannose glycoforms for site N321 increased 2-4 times in ZDF rat plasma (Figure 8), but there are no changes for hybrid/complex glycosylated species.
Proteomics/Glycoproteomics Figure 5. Identified Protein and Peptides from Unfractionated Rat Plasma Digests
ETDhcd-HCD data from glycopeptide enriched digest with TMT labeling was processed using Byonic node of PD 2.1. Almost 2000 glycopeptides were identified and quantified from the rat plasma digests. Majority of proteins showed no significant changes between ZDF and Lean plasma groups.
0.5
2.3 2
2.4
4
0.2 0.98 0.875
0 0.5
1 1.5
2 2.5
3 3.5
4 4.5
Fat/Lean
Fat/Lean
Figure 7. Identification and Quantitation Results for Alpha-1 inhibitor , P14046
No changes on Protein level
Significant changes on Peptide level
Proteomics/Glycoproteomics
Figure 6. Expression Fold Changes of Peptide HVNATVTEEGTGSEFSGSGR- Site N321 in Alpha-1 inhibitor, P14046
The up and down changes in the peptide level with different glycan composition. High mannose species are up and complex/hybrid glycans are down.
2 Facilitate Biomarker Discovery Using Integrated “Omics” Differential Analysis with High Resolution Accurate LC/MS Approach
Reiko Kiyonami1, Sergei Snovida2, Devin Drew1, Rosa Viner1 , Julian Saba1, David Peake1, Andreas Huhmer1, Ken Miller1, 1Thermo Fisher Scientific, San Jose, CA, USA, 2 Thermo Fisher Scientific, Rockford, IL, USA
RESULTS Lipidomics
Table 1. Summary of Lipid IDs and Quantitation from the Rat Plasma
The lipid annotations for each individual sample are aligned within a time window and the results are merged into a single report. Positive and negative ion adduct annotations are grouped for lipids eluting at the same retention time. Accurate-mass extracted chromatograms are integrated for each identified lipid precursor ion and peak areas are obtained for quantitation. t-Tests and calculated p-values determine which molecular species are significantly different between sample and control groups. 750 Molecular lipid species across 17 lipid classes were identified after filtering. Fold-changes of the identified lipid species between the lean plasma and the diabetic plasma groups were determined. Significantly different concentration changes (p <0.05) were observed for 349 lipid species.
Figure 3. Lipid Class Profiles for TG, LPC, PC, SM, LPE and PE
Proteome Discover 2.1 software was able to identify more than 400 proteins from unfractionated rat plasma digests. A selected profile group showing elevated levels in ZDF samples (AQR 7-9) relative to lean samples (AQR 1-6). Peptides quantitative values were clustered using Protein Center’s Profiling, with group count = 9 and alpha core = 0.5. There over-represented proteins in ZDF rat are involved with several biological pathways, including the inflammatory response pathway and potentially linked with the increased lipid molecular species.
Significant increases were observed in ZDF plasma for the levels of abundant lipid classes including triglycerides (TG) and phosphatidylcholine (PC). Other lipid classes such as lyso-phosphatidylcholine (LPC) and sphingomyelin (SM) also showed an increasing trend in the ZDF group. In contrast, lyso-phosphatidylethanolamine (LPE) and phosphatidylethanolamine (PE) levels showed significant decreases in the ZDF plasma.
Figure 1. Basepeak Chromatograms of a ZDF Plasma
Each plasma sample was analyzed in positive and negative mode, respectively. The C30 reversed-phase HPLC column uniquely offers high shape selectivity and provides improved lipid isomer separation efficiency, yielding higher coverage of the rat plasma lipidome.
All raw files were processed using Lipid Search™ 4.1 SP1 software. The ultra high resolution offered by the Q Exactive HF MS enables very narrow mass search windows (3 ppm for MS and 5 ppm for MS/MS) being used for database searching, providing high confidence lipid identification and precise quantification results.
Figure 6. Protein Identification and Quantitation Summary
ABSTRACT Application of “Omics” technologies to unbiased clinical biomarker discovery research of various diseases is emerging because comprehensive molecular profiling using these “Omics” technologies could better explain complex disease mechanisms and reach a new level of molecular understanding concerning carcinogenesis, disease progression, and drug-response prediction. Omics approaches are resource-intensive, analytically demanding and require the use of a sophisticated instrument platform and software to identify and quantify hundreds to thousands of molecules with high confidence and accuracy. A complete workflow based on “Omics” profiling also requires well developed sample preparation kits. We have worked on developing multiple “Omics” profiling workflows using high resolution accurate Orbitrap™ mass spectrometers in combination with liquid chromatography separations. In this study, we applied lipidomics, proteomics and glycoproteomics profiling workflows to study of Zucker diabetic fatty (ZDF) and lean rats, a model of type 2 diabetes. Plasma samples collected from three lean and three fatty Zucker rats were analyzed. With the multiple “Omics” workflows developed here we were able to simultaneously identify and quantify hundreds of individual molecular lipid species, proteins and glycopeptides with high confidence and good analytical precision. Significant changes of individual lipid species, proteins and glycopeptides were observed between the two group of rat plasma samples. INTRODUCTION HPLC-MS platforms are increasingly used for large scale “Omics” (proteomics, lipidomics, metabolomics, glycomics) experiments to discover potential biomarkers for early disease diagnosis. Each “Omics” data set provides valuable insights into multiple biomarker candidates. However, because properties of a biological system interact with each other, integrating multiple “omics” data will help to understand the system behavior as a whole for unravelling biological regulatory mechanisms to define the emergent properties and help to verify biomarker candidates from each “omics” workflow. Here we conducted lipidomics, proteomics and glycoproteomics studies phenotypical ZDF vs. normal lean rat plasma using a Thermo Scientific™ Orbitrap™ based LC-MS platform. The results from each of the “Omics” workflows are reported. MATERIALS AND METHODS Sample Preparation The rat plasma were purchased from Bioreclamation LLC (Westbury, NY). Rat plasma were recovered from whole blood of Zucker lean (3 lots) and Zucker diabetic fatty (ZDF, 3 lots) using EDTA as anti-coagulant by Bioreclamation. Chloroform, methanol and water were used for the lipid extraction. For proteomics/glycoproteomics experiments, each plasma sample was reduced, alkylated and digested with trypsin, respectively. Tryptic digests (1 mg) from each sample (Lean 1,2,3 and Fat 1,2,3) were labeled with Thermo Scientific™ TMT™ 6-plex (TMTsixplex™) tags, quenched, combined and glycopeptide enrichment was performed using Thermo Scientific™ HyperSep™ Retain AX Cartridges. The flow-through from the cartridge (non-glycopeptides) was collected separately. Methods Lipid extracts were analyzed by LC-MS/MS in positive and negative mode on Thermo Scientific™ Dionex™ UltiMate™ 3000 Rapid Separation LC (RSLC) system coupled with a Thermo Scientific™ Q Exactive™ HF hybrid quadrupole-Orbitrap mass spectrometer over a 30 min gradient. Data were collected using a data dependent MS/MS experiment in which a full MS scan (120,000 resolving power FWHM at m/z 200) was followed by top 15 MS/MS scans (30,000 FWHM resolving power at m/z 200). Data analysis was performed using Thermo Scientific™ LipidSearch™ 4.1 software. Protein digests labeled with TMT sixplex in which the glycopeptides had been depleted were analyzed by nanoflow LC-MS/MS on EASY-nLC TM 1000 coupled with a Thermo Scientific TM Orbitrap Fusion™ Lumos™ mass spectrometer over a 2-hour gradient. Data were collected using top speed data dependent HCD MS/MS experiment in which a full MS scan using 120,000 (FWHM at m/z 200) resolving power was followed by HCD MS/MS scans using 30,000 (FWHM at m/z 200) resolving power with 3 second cycle time. Data analysis were performed using Thermo Scientific™ Proteome Discoverer™ software. Protein annotation was performed using Thermo Scientific™ Protein Center™ software. Enriched glycopeptides digests labeled with TMT sixplex tags were analyzed by nano flow LC-MS/MS on the Thermo Scientific™ EASY-nLC 1000 coupled with a Thermo Scientific™ Orbitrap Fusion™ Lumos™ Tribrid™ mass spectrometer over a 2-hour gradient. Data were collected using top speed data dependent EThcD MS/MS, followed by SPS MS3 experiments with 3 second cycle time. Mass resolution (FWHM at m/z 200) used was 120,000 for full MS, 30,000 for EThcD MS/MS and 60,000 resolving power for SPS MS3 . MS data analysis were performed using Byonic node (Protein Metrics Inc.) in Thermo Scientific™ Proteome Discoverer™ 2.1 software.
CONCLUSIONS • Complete multiple “Omics” workflows were developed on high resolution accurate
mass Orbitrap – based mass spectrometers coupled with liquid chromatography separation and sophisticated data processing software. The ultra high resolution offered by Orbitrap detector enables another dimension of mass separation, yielding confident unknown molecular identification and precise quantification.
• 750 Molecular lipid species were identified and quantified from the rat plasma samples. The relative concentration changes between the ZDF and lean plasma groups were measured at both total lipid class composition and individual lipid molecular species composition, providing more potential biological insights into understanding the complex processes that lead to the development of diabetes.
• Unique data dependent EThcD MS/MS and SPS MS3 workflows enabled very precise protein/peptide quantitation in a high throughput fashion. Unambiguous glycopeptide characterization was performed using HRAM EThcD spectra. Precise relative quantitation was carried out using HRAM SPS HCD MS3 data.
• Significant increases of glycopeptides containing high mannose species were observed between the ZDF and lean plasma without any changes at the protein level. Further studies will be done to see if these glycan composition changes are linked with lipid molecular species changes.
TRADEMARKS © 2016 Thermo Fisher Scientific Inc. All rights reserved. Lipid Search is a registered trademark of MKI. TMT and TMTsixplex are trademarks of Proteome Sciences plc. All other trademarks are the property of Thermo Fisher Scientific and its subsidiaries. This information is not intended to encourage use of these products in any manner that might infringe the intellectual property rights of others. For research use only. Not for use in diagnostic procedures.
Facilitate Biomarker Discovery Using Integrated “Omics” Differential Analysis with High Resolution Accurate LC/MS Approach
Lipidomics Proteomics/Glycoproteomics
Figure 2. Simultaneous Lipid ID and Relative Quantification Using LipidSearch software
S1: ZDF C : Lean
Figure 4. Individual Lipid sub-Class Profiles for TG and PE
It is important to identify which individual lipid species is actually responsible for the observed total lipid composition changes in order to understand biological function each specific lipid. For the TG class, the individual lipid species of TG(8:1/16:0/18:1), TG(18:0/22:6/22:6), TG(16:0/22:6/22:6), TG(8:1/16:0/18:1) and TG(16:0/8:0/18:1) showed more than 5 fold increases in the ZDF plasma and contributed most to the total TG composition increase. About 45% of TG molecular species actually did not show any significant changes. For the PE class, most identified PE molecular species contributed to the total composition decreases in the ZDF plasma in a moderate fashion. These detail information help revealing lipid pathway and biochemical mechanisms.
The protein of the Alpha-1 inhibitor did not show changes in protein levels. However, significant changes in glycopeptide profiles were observed as shown in Figure 7. For example, the amount of high mannose glycoforms for site N321 increased 2-4 times in ZDF rat plasma (Figure 8), but there are no changes for hybrid/complex glycosylated species.
Proteomics/Glycoproteomics Figure 5. Identified Protein and Peptides from Unfractionated Rat Plasma Digests
ETDhcd-HCD data from glycopeptide enriched digest with TMT labeling was processed using Byonic node of PD 2.1. Almost 2000 glycopeptides were identified and quantified from the rat plasma digests. Majority of proteins showed no significant changes between ZDF and Lean plasma groups.
0.5
2.3 2
2.4
4
0.2 0.98 0.875
0 0.5
1 1.5
2 2.5
3 3.5
4 4.5
Fat/Lean
Fat/Lean
Figure 7. Identification and Quantitation Results for Alpha-1 inhibitor , P14046
No changes on Protein level
Significant changes on Peptide level
Proteomics/Glycoproteomics
Figure 6. Expression Fold Changes of Peptide HVNATVTEEGTGSEFSGSGR- Site N321 in Alpha-1 inhibitor, P14046
The up and down changes in the peptide level with different glycan composition. High mannose species are up and complex/hybrid glycans are down.
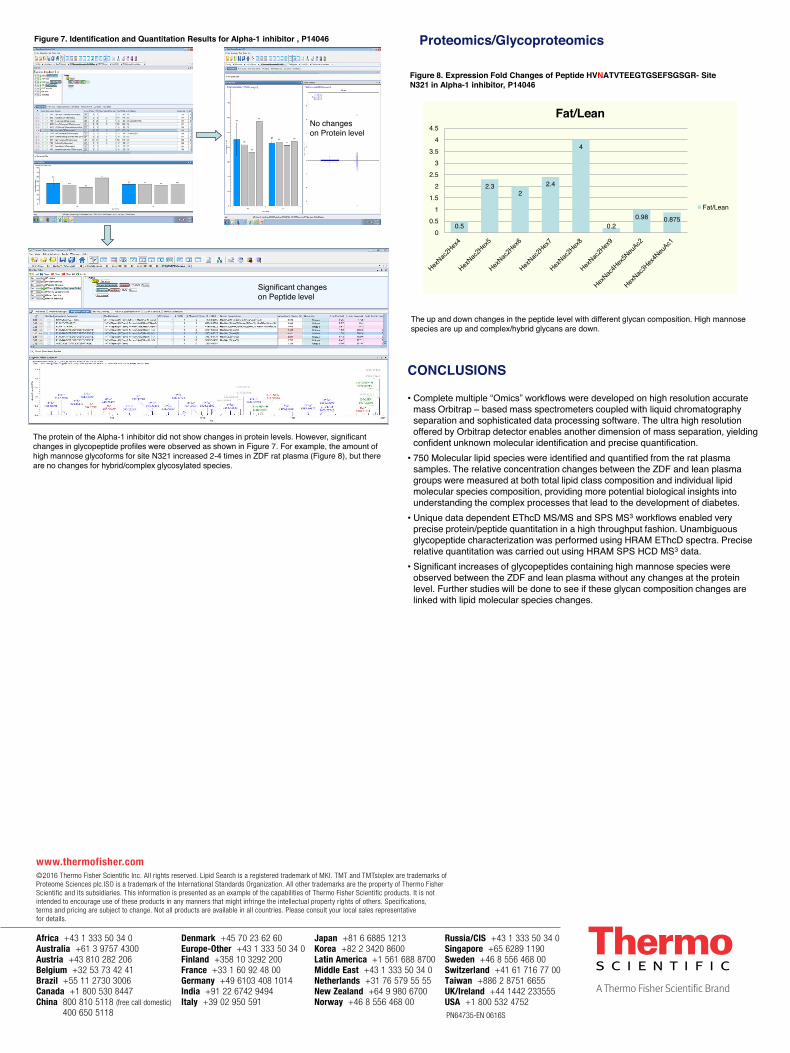
Reiko Kiyonami1, Sergei Snovida2, Devin Drew1, Rosa Viner1 , Julian Saba1, David Peake1, Andreas Huhmer1, Ken Miller1, 1Thermo Fisher Scientific, San Jose, CA, USA, 2 Thermo Fisher Scientific, Rockford, IL, USA
RESULTS Lipidomics
Table 1. Summary of Lipid IDs and Quantitation from the Rat Plasma
The lipid annotations for each individual sample are aligned within atime window and the results are merged into a single report. Positiveand negative ion adduct annotations are grouped for lipids eluting atthe same retention time. Accurate-mass extracted chromatograms are integrated for each identified lipid precursor ion and peak areas are obtained for quantitation. t-Tests and calculated p-values determine which molecular species are significantly different between sample and control groups. 750 Molecular lipid species across 17 lipid classes were identified after filtering. Fold-changes ofthe identified lipid species between the lean plasma and the diabetic plasma groups were determined. Significantly different concentrationchanges (p <0.05) were observed for 349 lipid species.
Figure 3. Lipid Class Profiles for TG, LPC, PC, SM, LPE and PE
Proteome Discover 2.1 software was able to identify more than 400 proteins fromunfractionated rat plasma digests. A selected profile group showing elevated levels in ZDFsamples (AQR 7-9) relative to lean samples (AQR 1-6). Peptides quantitative values were clustered using Protein Center’s Profiling, with group count = 9 and alpha core = 0.5. There over-represented proteins in ZDF rat are involved with several biological pathways, includingthe inflammatory response pathway and potentially linked with the increased lipid molecular species.
Significant increases were observed in ZDF plasma for the levels of abundant lipid classes includingtriglycerides (TG) and phosphatidylcholine (PC). Other lipid classes such as lyso-phosphatidylcholine(LPC) and sphingomyelin (SM) also showed an increasing trend in the ZDF group. In contrast, lyso-phosphatidylethanolamine (LPE) and phosphatidylethanolamine (PE) levels showed significant decreases in the ZDF plasma.
Figure 1. Basepeak Chromatogramsof a ZDF Plasma
Each plasma sample was analyzed in positiveand negative mode, respectively. The C30reversed-phase HPLC column uniquely offers high shape selectivity and provides improvedlipid isomer separation efficiency, yieldinghigher coverage of the rat plasma lipidome.
All raw files were processed using LipidSearch™ 4.1 SP1 software. The ultra highresolution offered by the Q Exactive HF MSenables very narrow mass search windows (3 ppm for MS and 5 ppm for MS/MS) beingused for database searching, providing highconfidence lipid identification and precisequantification results.
Figure 6. Protein Identification and Quantitation Summary
ABSTRACTApplication of “Omics” technologies to unbiased clinical biomarker discovery research ofvarious diseases is emerging because comprehensive molecular profiling using these “Omics” technologies could better explain complex disease mechanisms and reach a new level ofmolecular understanding concerning carcinogenesis, disease progression, and drug-responseprediction. Omics approaches are resource-intensive, analytically demanding and require the use of a sophisticated instrument platform and software to identify and quantify hundreds tothousands of molecules with high confidence and accuracy. A complete workflow based on“Omics” profiling also requires well developed sample preparation kits. We have worked ondeveloping multiple “Omics” profiling workflows using high resolution accurate Orbitrap™ mass spectrometers in combination with liquid chromatography separations. In this study, weapplied lipidomics, proteomics and glycoproteomics profiling workflows to study of Zuckerdiabetic fatty (ZDF) and lean rats, a model of type 2 diabetes. Plasma samples collected fromthree lean and three fatty Zucker rats were analyzed. With the multiple “Omics” workflows developed here we were able to simultaneously identify and quantify hundreds of individual molecular lipid species, proteins and glycopeptides with high confidence and good analytical precision. Significant changes of individual lipid species, proteins and glycopeptides were observed between the two group of rat plasma samples.
INTRODUCTIONHPLC-MS platforms are increasingly used for large scale “Omics” (proteomics, lipidomics, metabolomics, glycomics) experiments to discover potential biomarkers for early diseasediagnosis. Each “Omics” data set provides valuable insights into multiple biomarker candidates. However, because properties of a biological system interact with each other, integrating multiple “omics” data will help to understand the system behavior as a whole for unravelling biological regulatory mechanisms to define the emergent properties and help toverify biomarker candidates from each “omics” workflow. Here we conducted lipidomics, proteomics and glycoproteomics studies phenotypical ZDF vs. normal lean rat plasma using aThermo Scientific™ Orbitrap™ based LC-MS platform. The results from each of the “Omics” workflows are reported.
MATERIALS AND METHODSSample PreparationThe rat plasma were purchased from Bioreclamation LLC (Westbury, NY). Rat plasma were recovered from whole blood of Zucker lean (3 lots) and Zucker diabetic fatty (ZDF, 3 lots)using EDTA as anti-coagulant by Bioreclamation. Chloroform, methanol and water were usedfor the lipid extraction. For proteomics/glycoproteomics experiments, each plasma sample was reduced, alkylated and digested with trypsin, respectively. Tryptic digests (1 mg) fromeach sample (Lean 1,2,3 and Fat 1,2,3) were labeled with Thermo Scientific™ TMT™ 6-plex(TMTsixplex™) tags, quenched, combined and glycopeptide enrichment was performed usingThermo Scientific™ HyperSep™ Retain AX Cartridges. The flow-through from the cartridge(non-glycopeptides) was collected separately.
MethodsLipid extracts were analyzed by LC-MS/MS in positive and negative mode on Thermo Scientific™ Dionex™ UltiMate™ 3000 Rapid Separation LC (RSLC) system coupled with aThermo Scientific™ Q Exactive™ HF hybrid quadrupole-Orbitrap mass spectrometer over a 30 min gradient. Data were collected using a data dependent MS/MS experiment in which afull MS scan (120,000 resolving power FWHM at m/z 200) was followed by top 15 MS/MSscans (30,000 FWHM resolving power at m/z 200). Data analysis was performed usingThermo Scientific™ LipidSearch™ 4.1 software.
Protein digests labeled with TMT sixplex in which the glycopeptides had been depleted wereanalyzed by nanoflow LC-MS/MS on EASY-nLC TM 1000 coupled with a Thermo Scientific TM
Orbitrap Fusion™ Lumos™ mass spectrometer over a 2-hour gradient. Data were collectedusing top speed data dependent HCD MS/MS experiment in which a full MS scan using120,000 (FWHM at m/z 200) resolving power was followed by HCD MS/MS scans using30,000 (FWHM at m/z 200) resolving power with 3 second cycle time. Data analysis were performed using Thermo Scientific™ Proteome Discoverer™ software. Protein annotationwas performed using Thermo Scientific™ Protein Center™ software.
Enriched glycopeptides digests labeled with TMT sixplex tags were analyzed by nano flowLC-MS/MS on the Thermo Scientific™ EASY-nLC 1000 coupled with a Thermo Scientific™ Orbitrap Fusion™ Lumos™ Tribrid™ mass spectrometer over a 2-hour gradient. Data were collected using top speed data dependent EThcD MS/MS, followed by SPS MS3 experimentswith 3 second cycle time. Mass resolution (FWHM at m/z 200) used was 120,000 for full MS, 30,000 for EThcD MS/MS and 60,000 resolving power for SPS MS3 . MS data analysis were performed using Byonic node (Protein Metrics Inc.) in Thermo Scientific™ ProteomeDiscoverer™ 2.1 software.
CONCLUSIONS
• Complete multiple “Omics” workflows were developed on high resolution accurate mass Orbitrap – based mass spectrometers coupled with liquid chromatographyseparation and sophisticated data processing software. The ultra high resolution offered by Orbitrap detector enables another dimension of mass separation, yielding confident unknown molecular identification and precise quantification.
• 750 Molecular lipid species were identified and quantified from the rat plasma samples. The relative concentration changes between the ZDF and lean plasma groups were measured at both total lipid class composition and individual lipid molecular species composition, providing more potential biological insights into understanding the complex processes that lead to the development of diabetes.
• Unique data dependent EThcD MS/MS and SPS MS3 workflows enabled veryprecise protein/peptide quantitation in a high throughput fashion. Unambiguous glycopeptide characterization was performed using HRAM EThcD spectra. Precise relative quantitation was carried out using HRAM SPS HCD MS3 data.
• Significant increases of glycopeptides containing high mannose species were observed between the ZDF and lean plasma without any changes at the protein level. Further studies will be done to see if these glycan composition changes are linked with lipid molecular species changes.
TRADEMARKS© 2016 Thermo Fisher Scientific Inc. All rights reserved. Lipid Search is a registeredtrademark of MKI. TMT and TMTsixplex are trademarks of Proteome Sciences plc.All other trademarks are the property of Thermo Fisher Scientific and its subsidiaries.This information is not intended to encourage use of these products in any manner that might infringe the intellectual property rights of others. For research use only.Not for use in diagnostic procedures.
Facilitate Biomarker Discovery Using Integrated “Omics” Differential Analysis with High Resolution Accurate LC/MS Approach
Lipidomics Proteomics/Glycoproteomics
Figure 2. Simultaneous Lipid ID and Relative Quantification Using LipidSearch software
S1: ZDFC : Lean
Figure 4. Individual Lipid sub-Class Profiles for TG and PE
It is important to identify which individual lipid species is actually responsible for the observed total lipid composition changes in order to understand biological function each specific lipid. For the TG class, the individual lipid species of TG(8:1/16:0/18:1), TG(18:0/22:6/22:6), TG(16:0/22:6/22:6), TG(8:1/16:0/18:1) and TG(16:0/8:0/18:1) showed more than 5 fold increases in the ZDF plasma andcontributed most to the total TG composition increase. About 45% of TG molecular species actuallydid not show any significant changes. For the PE class, most identified PE molecular species contributed to the total composition decreases in the ZDF plasma in a moderate fashion. Thesedetail information help revealing lipid pathway and biochemical mechanisms.
The protein of the Alpha-1 inhibitor did not show changes in protein levels. However, significant changes in glycopeptide profiles were observed as shown in Figure 7. For example, the amount of high mannose glycoforms for site N321 increased 2-4 times in ZDF rat plasma (Figure 8), but there are no changes for hybrid/complex glycosylated species.
Proteomics/GlycoproteomicsFigure 5. Identified Protein and Peptides from Unfractionated Rat Plasma Digests
ETDhcd-HCD data from glycopeptide enriched digest with TMT labeling was processed using Byonic node of PD 2.1. Almost 2000 glycopeptides were identified and quantified from the rat plasmadigests. Majority of proteins showed no significant changes between ZDF and Lean plasma groups.
0.5
2.32
2.4
4
0.20.98 0.875
00.5
11.5
22.5
33.5
44.5
Fat/Lean
Fat/Lean
Figure 7. Identification and Quantitation Results for Alpha-1 inhibitor , P14046
No changes on Protein level
Significant changes on Peptide level
Proteomics/Glycoproteomics
Figure 6. Expression Fold Changes of Peptide HVNATVTEEGTGSEFSGSGR- Site N321 in Alpha-1 inhibitor, P14046
The up and down changes in the peptide level with different glycan composition. High mannosespecies are up and complex/hybrid glycans are down.
Reiko Kiyonami1, Sergei Snovida2, Devin Drew1, Rosa Viner1 , Julian Saba1, David Peake1, Andreas Huhmer1, Ken Miller1, 1Thermo Fisher Scientific, San Jose, CA, USA, 2 Thermo Fisher Scientific, Rockford, IL, USA
RESULTS Lipidomics
Table 1. Summary of Lipid IDs and Quantitation from the Rat Plasma
The lipid annotations for each individual sample are aligned within atime window and the results are merged into a single report. Positiveand negative ion adduct annotations are grouped for lipids eluting atthe same retention time. Accurate-mass extracted chromatograms are integrated for each identified lipid precursor ion and peak areas are obtained for quantitation. t-Tests and calculated p-values determine which molecular species are significantly different between sample and control groups. 750 Molecular lipid species across 17 lipid classes were identified after filtering. Fold-changes ofthe identified lipid species between the lean plasma and the diabetic plasma groups were determined. Significantly different concentrationchanges (p <0.05) were observed for 349 lipid species.
Figure 3. Lipid Class Profiles for TG, LPC, PC, SM, LPE and PE
Proteome Discover 2.1 software was able to identify more than 400 proteins fromunfractionated rat plasma digests. A selected profile group showing elevated levels in ZDFsamples (AQR 7-9) relative to lean samples (AQR 1-6). Peptides quantitative values were clustered using Protein Center’s Profiling, with group count = 9 and alpha core = 0.5. There over-represented proteins in ZDF rat are involved with several biological pathways, includingthe inflammatory response pathway and potentially linked with the increased lipid molecular species.
Significant increases were observed in ZDF plasma for the levels of abundant lipid classes includingtriglycerides (TG) and phosphatidylcholine (PC). Other lipid classes such as lyso-phosphatidylcholine(LPC) and sphingomyelin (SM) also showed an increasing trend in the ZDF group. In contrast, lyso-phosphatidylethanolamine (LPE) and phosphatidylethanolamine (PE) levels showed significant decreases in the ZDF plasma.
Figure 1. Basepeak Chromatogramsof a ZDF Plasma
Each plasma sample was analyzed in positiveand negative mode, respectively. The C30reversed-phase HPLC column uniquely offers high shape selectivity and provides improvedlipid isomer separation efficiency, yieldinghigher coverage of the rat plasma lipidome.
All raw files were processed using LipidSearch™ 4.1 SP1 software. The ultra highresolution offered by the Q Exactive HF MSenables very narrow mass search windows (3 ppm for MS and 5 ppm for MS/MS) beingused for database searching, providing highconfidence lipid identification and precisequantification results.
Figure 6. Protein Identification and Quantitation Summary
ABSTRACTApplication of “Omics” technologies to unbiased clinical biomarker discovery research ofvarious diseases is emerging because comprehensive molecular profiling using these “Omics” technologies could better explain complex disease mechanisms and reach a new level ofmolecular understanding concerning carcinogenesis, disease progression, and drug-responseprediction. Omics approaches are resource-intensive, analytically demanding and require the use of a sophisticated instrument platform and software to identify and quantify hundreds tothousands of molecules with high confidence and accuracy. A complete workflow based on“Omics” profiling also requires well developed sample preparation kits. We have worked ondeveloping multiple “Omics” profiling workflows using high resolution accurate Orbitrap™ mass spectrometers in combination with liquid chromatography separations. In this study, weapplied lipidomics, proteomics and glycoproteomics profiling workflows to study of Zuckerdiabetic fatty (ZDF) and lean rats, a model of type 2 diabetes. Plasma samples collected fromthree lean and three fatty Zucker rats were analyzed. With the multiple “Omics” workflows developed here we were able to simultaneously identify and quantify hundreds of individual molecular lipid species, proteins and glycopeptides with high confidence and good analytical precision. Significant changes of individual lipid species, proteins and glycopeptides were observed between the two group of rat plasma samples.
INTRODUCTIONHPLC-MS platforms are increasingly used for large scale “Omics” (proteomics, lipidomics, metabolomics, glycomics) experiments to discover potential biomarkers for early diseasediagnosis. Each “Omics” data set provides valuable insights into multiple biomarker candidates. However, because properties of a biological system interact with each other, integrating multiple “omics” data will help to understand the system behavior as a whole for unravelling biological regulatory mechanisms to define the emergent properties and help toverify biomarker candidates from each “omics” workflow. Here we conducted lipidomics, proteomics and glycoproteomics studies phenotypical ZDF vs. normal lean rat plasma using aThermo Scientific™ Orbitrap™ based LC-MS platform. The results from each of the “Omics” workflows are reported.
MATERIALS AND METHODSSample PreparationThe rat plasma were purchased from Bioreclamation LLC (Westbury, NY). Rat plasma were recovered from whole blood of Zucker lean (3 lots) and Zucker diabetic fatty (ZDF, 3 lots)using EDTA as anti-coagulant by Bioreclamation. Chloroform, methanol and water were usedfor the lipid extraction. For proteomics/glycoproteomics experiments, each plasma sample was reduced, alkylated and digested with trypsin, respectively. Tryptic digests (1 mg) fromeach sample (Lean 1,2,3 and Fat 1,2,3) were labeled with Thermo Scientific™ TMT™ 6-plex(TMTsixplex™) tags, quenched, combined and glycopeptide enrichment was performed usingThermo Scientific™ HyperSep™ Retain AX Cartridges. The flow-through from the cartridge(non-glycopeptides) was collected separately.
MethodsLipid extracts were analyzed by LC-MS/MS in positive and negative mode on Thermo Scientific™ Dionex™ UltiMate™ 3000 Rapid Separation LC (RSLC) system coupled with aThermo Scientific™ Q Exactive™ HF hybrid quadrupole-Orbitrap mass spectrometer over a 30 min gradient. Data were collected using a data dependent MS/MS experiment in which afull MS scan (120,000 resolving power FWHM at m/z 200) was followed by top 15 MS/MSscans (30,000 FWHM resolving power at m/z 200). Data analysis was performed usingThermo Scientific™ LipidSearch™ 4.1 software.
Protein digests labeled with TMT sixplex in which the glycopeptides had been depleted wereanalyzed by nanoflow LC-MS/MS on EASY-nLC TM 1000 coupled with a Thermo Scientific TM
Orbitrap Fusion™ Lumos™ mass spectrometer over a 2-hour gradient. Data were collectedusing top speed data dependent HCD MS/MS experiment in which a full MS scan using120,000 (FWHM at m/z 200) resolving power was followed by HCD MS/MS scans using30,000 (FWHM at m/z 200) resolving power with 3 second cycle time. Data analysis were performed using Thermo Scientific™ Proteome Discoverer™ software. Protein annotationwas performed using Thermo Scientific™ Protein Center™ software.
Enriched glycopeptides digests labeled with TMT sixplex tags were analyzed by nano flowLC-MS/MS on the Thermo Scientific™ EASY-nLC 1000 coupled with a Thermo Scientific™ Orbitrap Fusion™ Lumos™ Tribrid™ mass spectrometer over a 2-hour gradient. Data were collected using top speed data dependent EThcD MS/MS, followed by SPS MS3 experimentswith 3 second cycle time. Mass resolution (FWHM at m/z 200) used was 120,000 for full MS, 30,000 for EThcD MS/MS and 60,000 resolving power for SPS MS3 . MS data analysis were performed using Byonic node (Protein Metrics Inc.) in Thermo Scientific™ ProteomeDiscoverer™ 2.1 software.
CONCLUSIONS
• Complete multiple “Omics” workflows were developed on high resolution accurate mass Orbitrap – based mass spectrometers coupled with liquid chromatography separation and sophisticated data processing software. The ultra high resolution offered by Orbitrap detector enables another dimension of mass separation, yielding confident unknown molecular identification and precise quantification.
• 750 Molecular lipid species were identified and quantified from the rat plasma samples. The relative concentration changes between the ZDF and lean plasma groups were measured at both total lipid class composition and individual lipid molecular species composition, providing more potential biological insights into understanding the complex processes that lead to the development of diabetes.
• Unique data dependent EThcD MS/MS and SPS MS3 workflows enabled veryprecise protein/peptide quantitation in a high throughput fashion. Unambiguous glycopeptide characterization was performed using HRAM EThcD spectra. Precise relative quantitation was carried out using HRAM SPS HCD MS3 data.
• Significant increases of glycopeptides containing high mannose species were observed between the ZDF and lean plasma without any changes at the protein level. Further studies will be done to see if these glycan composition changes are linked with lipid molecular species changes.
TRADEMARKS© 2016 Thermo Fisher Scientific Inc. All rights reserved. Lipid Search is a registeredtrademark of MKI. TMT and TMTsixplex are trademarks of Proteome Sciences plc.All other trademarks are the property of Thermo Fisher Scientific and its subsidiaries.This information is not intended to encourage use of these products in any manner that might infringe the intellectual property rights of others. For research use only.Not for use in diagnostic procedures.
Facilitate Biomarker Discovery Using Integrated “Omics” Differential Analysis with High Resolution Accurate LC/MS Approach
Lipidomics Proteomics/Glycoproteomics
Figure 2. Simultaneous Lipid ID and Relative Quantification Using LipidSearch software
S1: ZDFC : Lean
Figure 4. Individual Lipid sub-Class Profiles for TG and PE
It is important to identify which individual lipid species is actually responsible for the observed total lipid composition changes in order to understand biological function each specific lipid. For the TG class, the individual lipid species of TG(8:1/16:0/18:1), TG(18:0/22:6/22:6), TG(16:0/22:6/22:6), TG(8:1/16:0/18:1) and TG(16:0/8:0/18:1) showed more than 5 fold increases in the ZDF plasma andcontributed most to the total TG composition increase. About 45% of TG molecular species actuallydid not show any significant changes. For the PE class, most identified PE molecular species contributed to the total composition decreases in the ZDF plasma in a moderate fashion. Thesedetail information help revealing lipid pathway and biochemical mechanisms.
The protein of the Alpha-1 inhibitor did not show changes in protein levels. However, significant changes in glycopeptide profiles were observed as shown in Figure 7. For example, the amount ofhigh mannose glycoforms for site N321 increased 2-4 times in ZDF rat plasma (Figure 8), but there are no changes for hybrid/complex glycosylated species.
Proteomics/GlycoproteomicsFigure 5. Identified Protein and Peptides from Unfractionated Rat Plasma Digests
ETDhcd-HCD data from glycopeptide enriched digest with TMT labeling was processed using Byonic node of PD 2.1. Almost 2000 glycopeptides were identified and quantified from the rat plasmadigests. Majority of proteins showed no significant changes between ZDF and Lean plasma groups.
0.5
2.3 2
2.4
4
0.2 0.98 0.875
0 0.5
1 1.5
2 2.5
3 3.5
4 4.5
Fat/Lean
Fat/Lean
Figure 7. Identification and Quantitation Results for Alpha-1 inhibitor , P14046
No changes on Protein level
Significant changes on Peptide level
Proteomics/Glycoproteomics
Figure 8. Expression Fold Changes of Peptide HVNATVTEEGTGSEFSGSGR- Site N321 in Alpha-1 inhibitor, P14046
The up and down changes in the peptide level with different glycan composition. High mannosespecies are up and complex/hybrid glycans are down.
PN64735-EN 0616S
Africa +43 1 333 50 34 0Australia +61 3 9757 4300Austria +43 810 282 206Belgium +32 53 73 42 41Brazil +55 11 2730 3006Canada +1 800 530 8447China 800 810 5118 (free call domestic)
400 650 5118
Denmark +45 70 23 62 60Europe-Other +43 1 333 50 34 0Finland +358 10 3292 200France +33 1 60 92 48 00Germany +49 6103 408 1014India +91 22 6742 9494Italy +39 02 950 591
Japan +81 6 6885 1213Korea +82 2 3420 8600Latin America +1 561 688 8700Middle East +43 1 333 50 34 0Netherlands +31 76 579 55 55 New Zealand +64 9 980 6700 Norway +46 8 556 468 00
Russia/CIS +43 1 333 50 34 0Singapore +65 6289 1190Sweden +46 8 556 468 00 Switzerland +41 61 716 77 00Taiwan +886 2 8751 6655UK/Ireland +44 1442 233555USA +1 800 532 4752
www.thermofisher.com©2016 Thermo Fisher Scientific Inc. All rights reserved. Lipid Search is a registered trademark of MKI. TMT and TMTsixplex are trademarks of Proteome Sciences plc.ISO is a trademark of the International Standards Organization. All other trademarks are the property of Thermo Fisher Scientific and its subsidiaries. This information is presented as an example of the capabilities of Thermo Fisher Scientific products. It is not intended to encourage use of these products in any manners that might infringe the intellectual property rights of others. Specifications, terms and pricing are subject to change. Not all products are available in all countries. Please consult your local sales representative for details.


![BIOMARKER SIGNATURE IDENTIFICATION IN “OMICS” DATA … · E-mail address: vlagani@ics.forth.gr (Vincenzo Lagani) 1 . supported by large scale evaluations [4,5] that have experimentally](https://img.dokumen.tips/doc/110x75/5e7dd8d441d5485e6b5983d1/biomarker-signature-identification-in-aoeomicsa-data-e-mail-address-vlaganiicsforthgr.jpg)