Embed Size (px)
Citation preview
Journal of Fiber Bioengineering and Informatics 6:1 (2013) 1–22doi:10.3993/jfbi03201301
Fabric and Garment Drape Measurement - Part 2
Reham Sanad∗, Tom Cassidy, Vien Cheung, Elaine Evans
University of Leeds, Woodhouse Lane, Leeds, Yorkshire LS2 9JT
Abstract
Fabric and garment drape were compared using an alternative drape measurement system based on animage analysis technique. Garment drape was investigated using dresses suspended on a mannequin.A graphical user interface was developed to carry out the image analysis and to calculate drape valuesidentifying and determining 21 parameters. A range of fabrics including knitted, woven and nonwovenfabrics were compared in terms of FAST properties, drape coefficient and drape values. Visual assessmentof the fabric range was carried out in terms of drape amount and preference. Low agreement was foundbetween individuals with regard to preferred drape amount and high agreement with respect to actualdrape amount. Nonwovens were found of better preference over some traditional fabrics. Most of thedrape values of fabric and garment were found to have poor correlations.
Keywords: Drape; Fabric; Garment; Drape Values; Image Analysis
1 Introduction
Drape is one of the most important fabric properties and plays an important role in garmentappearance. It is defined as “the extent to which a fabric will deform when it is allowed to hangunder its own weight” [1].
It is a complex combination of a fabric’s physical, mechanical and visual properties which can beevaluated either subjectively or objectively [2]. In 1950, a fabric research laboratory drapemeter(FRL) was developed to measure fabric drapeability objectively [3]. Studies and developmentscarried out by Chu et al. and Cusick are considered to be significant improvements for measuringfabric drapeability and the British standard of drape measurement is based on Cusick’s findings[3-5].
Drape coefficient is the traditional parameter used to express the drapeability of fabrics anddefined as the percentage of a paper ring (used to project/cast on the shadow of the drapedsample) covered by the vertically projected shadow of the partially centrally supported circularsample on a circular disc with smaller diameter [1]. Some investigations have used the weightto express this percentage and others have used the area. Limitations in the traditional method(such as time consuming and errors dependant on operator) have encouraged researchers to seek
∗Corresponding author.Email address: [email protected] (Reham Sanad).
1940–8676 / Copyright © 2013 Binary Information Press & Textile Bioengineering and Informatics SocietyMarch 2013
2 R. Sanad et al. / Journal of Fiber Bioengineering and Informatics 6:1 (2013) 1–22
alternative methods to investigate drape such as image analysis which showed good agreementwith the drapemeter.
There have been several studies carried out to investigate drape using image analysis. In 1988Collier et al. devised a drapemeter and a voltmeter to measure the amount of light blockedby the tested sample using a base of photovoltaic cells [6]. Typically, studies implementingimage analysis in investigating drape are based on one of two approaches to analyze the capturedimage and calculate the DC%, the first approach uses the number of pixels occupied by thearea of the supporting disc, shadow and the outer region [7-10]. The second approach disagreeswith the accuracy of the first and instead uses the boundaries of the shadow cast to investigatethe drape profile [11-15]. Much research has been carried out to investigate drape focused on:seeking reliable and representative drape parameters and formulas, factors affecting drape, itscorrelation with physical and mechanical properties, ease of analysing, predicting drapeability,static, dynamic and swinging motion drape. These have been described in Part 1 of this article[16].
During investigations into fabric drape, several parameters have been proposed such as: drapedistance ratio [17], drape profile circularity (CIRC), number of nodes, mean node severity andvariability of node severity [12] static and dynamic drape coefficients [13] wave amplitude, maxi-mum, minimum, average and variance of amplitude, wavelength [18].
Few researchers have been concerned with investigating the form of the supporting body usedto mount the fabric sample on. Most of the drapemeters used in these studies – even the appareldrape studies – were devised with a circular plate to mount the sample on.
Needless to say, if apparel fabric drape is to be investigated, the researcher should check if thesupporting surface form and the performance of the fabric suspended on it matches the humanbody. Investigating apparel drape is completely different from furnishing textiles which may lenditself well to using the Cusick drapemeter.
Some studies employed garment on mannequin in investigations related to drape. Cui et al.studied the effect of fabric drapeability on girth ease allowance (GEA) of garment at waist, hipand bust [19]. Moreover, drape simulation studies have been investigating a reliable method forvirtual presentation of garment drape. These were based on 3D scanning a garment, measuringits drape parameters followed by using alternative techniques and methods for reconstructing thedrape profile [20].
In this study, we are concerned with investigating apparel drape on a suspended mannequinusing image analysis. Garment drapeability was compared with fabric drapeability in terms ofdrape values measured for garment and fabric images. Moreover, nonwoven fabric drape forapparel use was investigated. Nonwovens are often used in the textile (apparel) industry whetheras lining fabrics or disposable gowns for medical use. It is rare to find them in the apparel marketas shell fabrics of a garment, top, skirt, etc. Their poor drape has been one of the reasons forthat rare existence. Perhaps, it is one of the major nonwovens’ drawbacks, which impedes usingthem in the apparel industry as shell fabrics. Therefore, it was considered essential to study andinvestigate this property, its measurement and its effect on garment appearance. It is proposed tocompare the nonwoven drape behaviour with woven and knitted fabrics to help the understandingof nonwoven fabrics’ behaviour.
The purpose of this study is to identify and determine an alternative method/system whichwould produce more dependable parameters than the extant traditional ones and would conse-

R. Sanad et al. / Journal of Fiber Bioengineering and Informatics 6:1 (2013) 1–22 3
quently give a better understanding of nonwoven materials for apparel. This system will use adress on a mannequin, instead of a fabric on circular disc (traditional method), which would bemore akin to the real apparel drape. A comparison between traditional and the new alternativemethods was conducted.
2 Experimental
2.1 Materials
A group of traditional fabrics were used including two knitted fabrics and five woven fabrics. Theirweights were suitable for making women’s dresses. For nonwovens, it was observed in publishedliterature that hydroentangled nonwoven fabrics have the lowest bending length, rigidity and shearrigidity and higher extensibility compared with other types of nonwoven fabrics (i.e. chemicallyand thermally bonded) in both machine and cross directions [21]. Based on this fact, this typeof nonwoven fabric could be used in the apparel industry as light weight fabric. A range of5 nonwoven fabrics (hydroentangled with polyamide and polyester based fibres) were providedby Freudenberg Nonwovens Company, their commercial name is Evolon (see Tables 1-3 for thedescription of the physical properties of each fabric group).
Table 1: Woven fabrics’ physical properties
Fabric
CodeStructure
Weight
(g/m2)Ends/cm Picks/cm
Yarn details
Warp Weft
Fibre
type
Count
(Denier)
Fibre
type
Count
(Denier)
W1 Plain 152 39 25 viscose 308 viscose 330
W2 Plain 108 43 24 viscose 120 viscose 120
W3Twill (warp
faced) 3/1158 44 27 polyester 180 polyester 337
W4 Plain 105 41 25 viscose 120 viscose 120
W5 Plain 250 26 24 cotton 276 cotton 298
Table 2: Knitted fabrics’ physical properties
Fabric
CodeGauge
Weight
(g/m2)Courses/cm Wales/cm
Yarn details
Fibre type Count (Denier)
K1 28 260 28 16 viscose 120 D
K2 28 197 28 18 viscose 120 D
4 R. Sanad et al. / Journal of Fiber Bioengineering and Informatics 6:1 (2013) 1–22
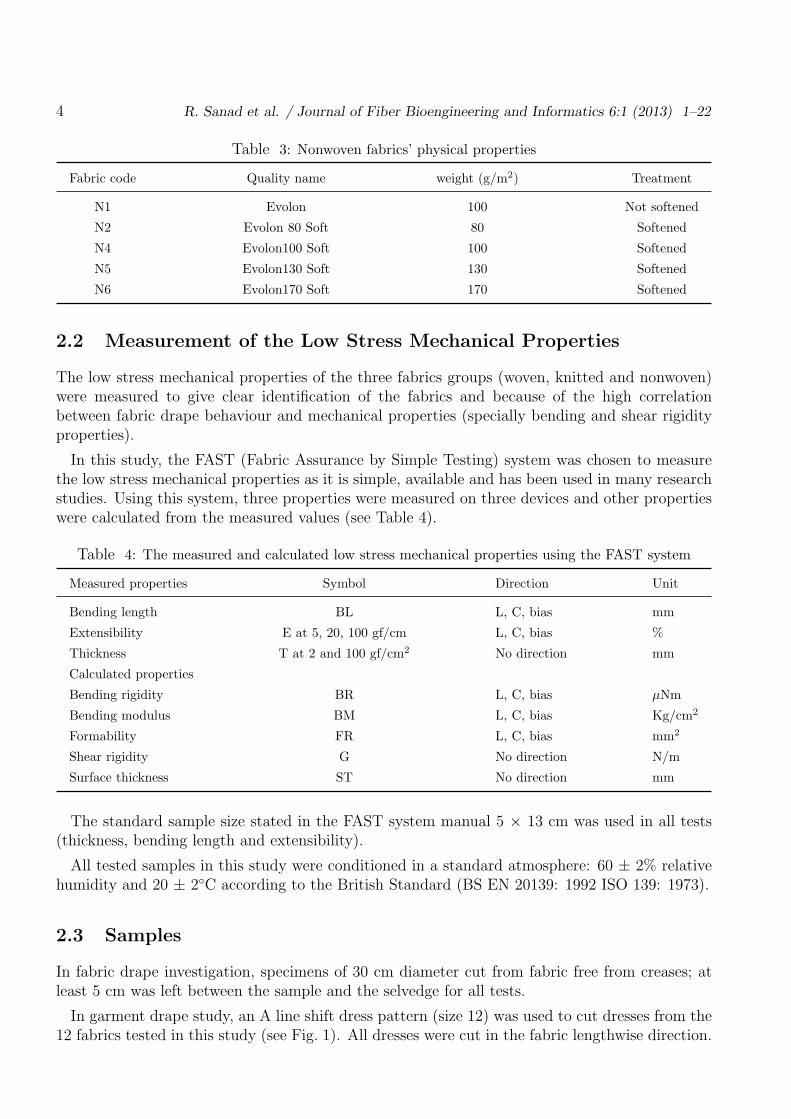
Table 3: Nonwoven fabrics’ physical properties
Fabric code Quality name weight (g/m2) Treatment
N1 Evolon 100 Not softened
N2 Evolon 80 Soft 80 Softened
N4 Evolon100 Soft 100 Softened
N5 Evolon130 Soft 130 Softened
N6 Evolon170 Soft 170 Softened
2.2 Measurement of the Low Stress Mechanical Properties
The low stress mechanical properties of the three fabrics groups (woven, knitted and nonwoven)were measured to give clear identification of the fabrics and because of the high correlationbetween fabric drape behaviour and mechanical properties (specially bending and shear rigidityproperties).
In this study, the FAST (Fabric Assurance by Simple Testing) system was chosen to measurethe low stress mechanical properties as it is simple, available and has been used in many researchstudies. Using this system, three properties were measured on three devices and other propertieswere calculated from the measured values (see Table 4).
Table 4: The measured and calculated low stress mechanical properties using the FAST system
Measured properties Symbol Direction Unit
Bending length BL L, C, bias mm
Extensibility E at 5, 20, 100 gf/cm L, C, bias %
Thickness T at 2 and 100 gf/cm2 No direction mm
Calculated properties
Bending rigidity BR L, C, bias µNm
Bending modulus BM L, C, bias Kg/cm2
Formability FR L, C, bias mm2
Shear rigidity G No direction N/m
Surface thickness ST No direction mm
The standard sample size stated in the FAST system manual 5 × 13 cm was used in all tests(thickness, bending length and extensibility).
All tested samples in this study were conditioned in a standard atmosphere: 60 ± 2% relativehumidity and 20 ± 2◦C according to the British Standard (BS EN 20139: 1992 ISO 139: 1973).
2.3 Samples
In fabric drape investigation, specimens of 30 cm diameter cut from fabric free from creases; atleast 5 cm was left between the sample and the selvedge for all tests.
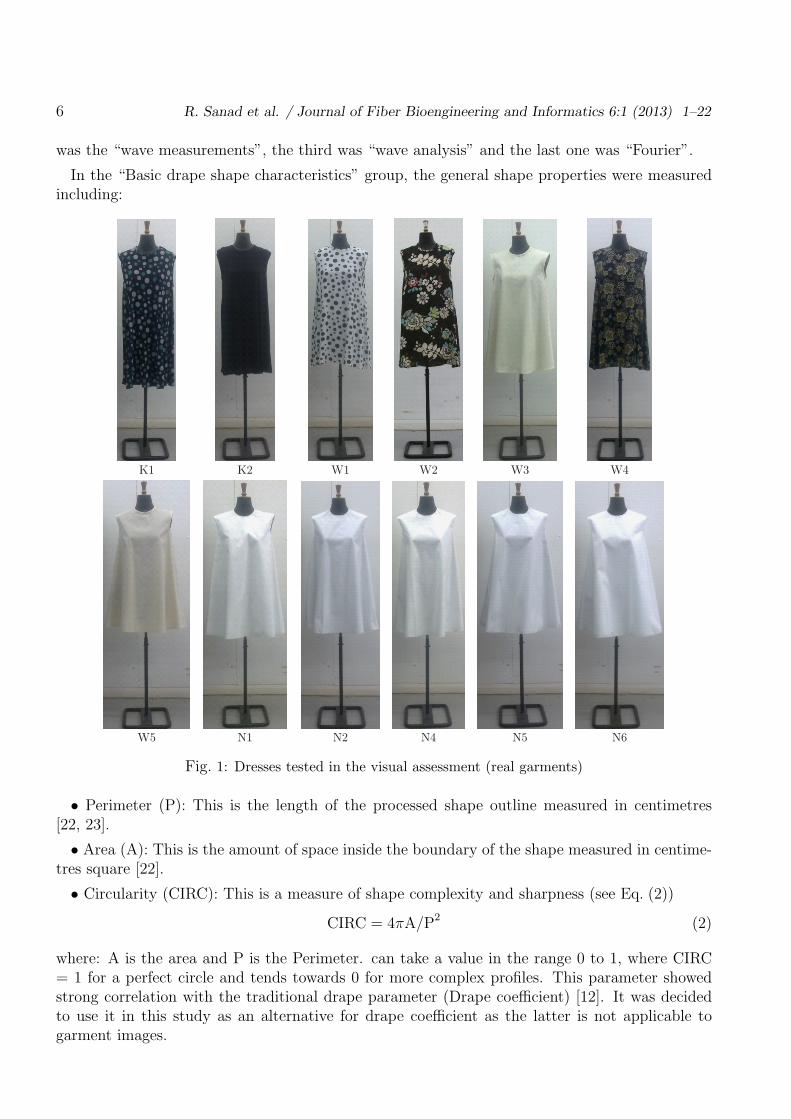
In garment drape study, an A line shift dress pattern (size 12) was used to cut dresses from the12 fabrics tested in this study (see Fig. 1). All dresses were cut in the fabric lengthwise direction.
R. Sanad et al. / Journal of Fiber Bioengineering and Informatics 6:1 (2013) 1–22 5
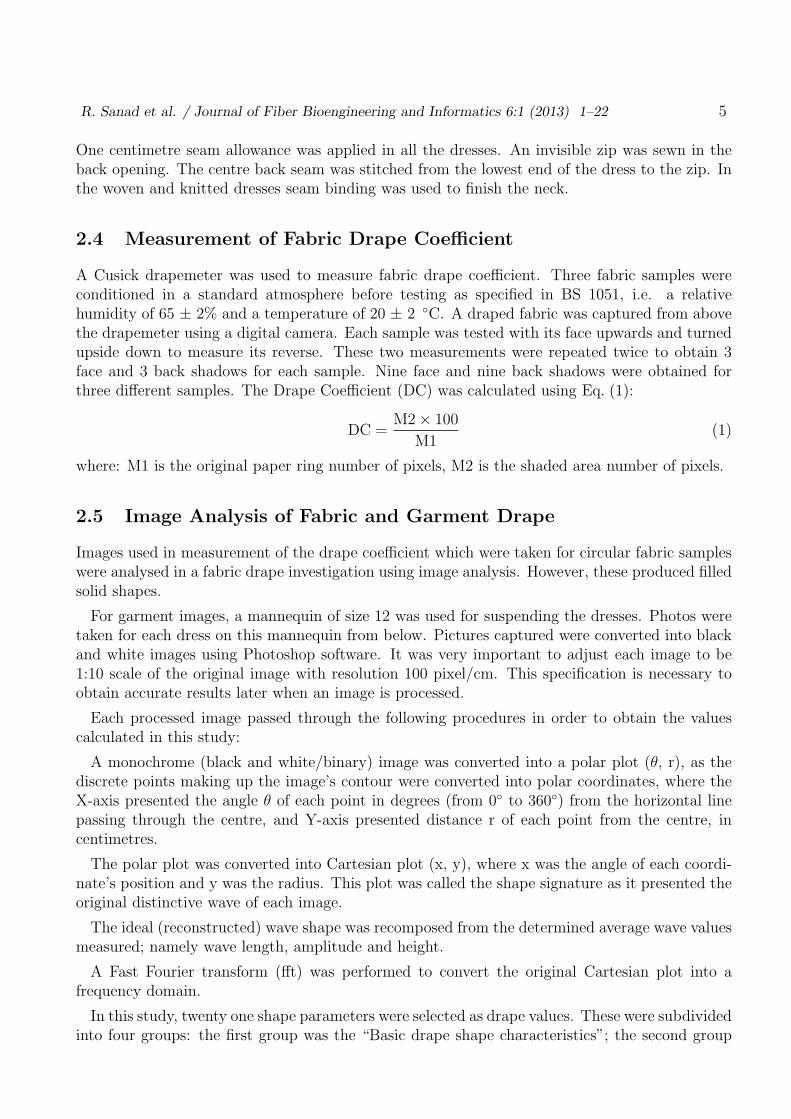
One centimetre seam allowance was applied in all the dresses. An invisible zip was sewn in theback opening. The centre back seam was stitched from the lowest end of the dress to the zip. Inthe woven and knitted dresses seam binding was used to finish the neck.
2.4 Measurement of Fabric Drape Coefficient
A Cusick drapemeter was used to measure fabric drape coefficient. Three fabric samples wereconditioned in a standard atmosphere before testing as specified in BS 1051, i.e. a relativehumidity of 65 ± 2% and a temperature of 20 ± 2 ◦C. A draped fabric was captured from abovethe drapemeter using a digital camera. Each sample was tested with its face upwards and turnedupside down to measure its reverse. These two measurements were repeated twice to obtain 3face and 3 back shadows for each sample. Nine face and nine back shadows were obtained forthree different samples. The Drape Coefficient (DC) was calculated using Eq. (1):
DC =M2× 100
M1(1)
where: M1 is the original paper ring number of pixels, M2 is the shaded area number of pixels.
2.5 Image Analysis of Fabric and Garment Drape
Images used in measurement of the drape coefficient which were taken for circular fabric sampleswere analysed in a fabric drape investigation using image analysis. However, these produced filledsolid shapes.
For garment images, a mannequin of size 12 was used for suspending the dresses. Photos weretaken for each dress on this mannequin from below. Pictures captured were converted into blackand white images using Photoshop software. It was very important to adjust each image to be1:10 scale of the original image with resolution 100 pixel/cm. This specification is necessary toobtain accurate results later when an image is processed.
Each processed image passed through the following procedures in order to obtain the valuescalculated in this study:
A monochrome (black and white/binary) image was converted into a polar plot (θ, r), as thediscrete points making up the image’s contour were converted into polar coordinates, where theX-axis presented the angle θ of each point in degrees (from 0◦ to 360◦) from the horizontal linepassing through the centre, and Y-axis presented distance r of each point from the centre, incentimetres.
The polar plot was converted into Cartesian plot (x, y), where x was the angle of each coordi-nate’s position and y was the radius. This plot was called the shape signature as it presented theoriginal distinctive wave of each image.
The ideal (reconstructed) wave shape was recomposed from the determined average wave valuesmeasured; namely wave length, amplitude and height.
A Fast Fourier transform (fft) was performed to convert the original Cartesian plot into afrequency domain.
In this study, twenty one shape parameters were selected as drape values. These were subdividedinto four groups: the first group was the “Basic drape shape characteristics”; the second group
6 R. Sanad et al. / Journal of Fiber Bioengineering and Informatics 6:1 (2013) 1–22
was the “wave measurements”, the third was “wave analysis” and the last one was “Fourier”.
In the “Basic drape shape characteristics” group, the general shape properties were measuredincluding:
K1 K2 W1 W2 W3 W4
W5 N1 N2 N4 N5 N6
Fig. 1: Dresses tested in the visual assessment (real garments)
• Perimeter (P): This is the length of the processed shape outline measured in centimetres[22, 23].
• Area (A): This is the amount of space inside the boundary of the shape measured in centime-tres square [22].
• Circularity (CIRC): This is a measure of shape complexity and sharpness (see Eq. (2))
CIRC = 4πA/P2 (2)
where: A is the area and P is the Perimeter. can take a value in the range 0 to 1, where CIRC= 1 for a perfect circle and tends towards 0 for more complex profiles. This parameter showedstrong correlation with the traditional drape parameter (Drape coefficient) [12]. It was decidedto use it in this study as an alternative for drape coefficient as the latter is not applicable togarment images.
R. Sanad et al. / Journal of Fiber Bioengineering and Informatics 6:1 (2013) 1–22 7
It is noteworthy that another complexity shape parameter Area/ Perimeter (A/P) was found tohave strong correlation with circularity (rDress images=0.96, p< 0.00001 and rFabric images = 0.995,p < 0.00001). The A/P parameter showed negative/reverse relation with drapeability as thisratio increased with low drapeable samples. However the Circularity was used for its advantagein being compared with a perfect circle.
• Symmetry: This is the reflection symmetry which measures the degree of two halves of ashape identical over the vertical axis (Y) for Left/Right symmetry and over the horizontal (x)axis for Front/Back symmetry. Symmetry ranges between 0 (completely asymmetrical halves)and 1 (identical symmetrical parts) [22].
• Number of peaks: This is the number of peaks/ nodes making up the original wave of theshape signature. The threshold of Peak-Trough distance/length stated in Shyr el al’s study whichwas found reliable to determine the number of drape wave peaks 0.3 cm was applied to detectthe peak number [24].
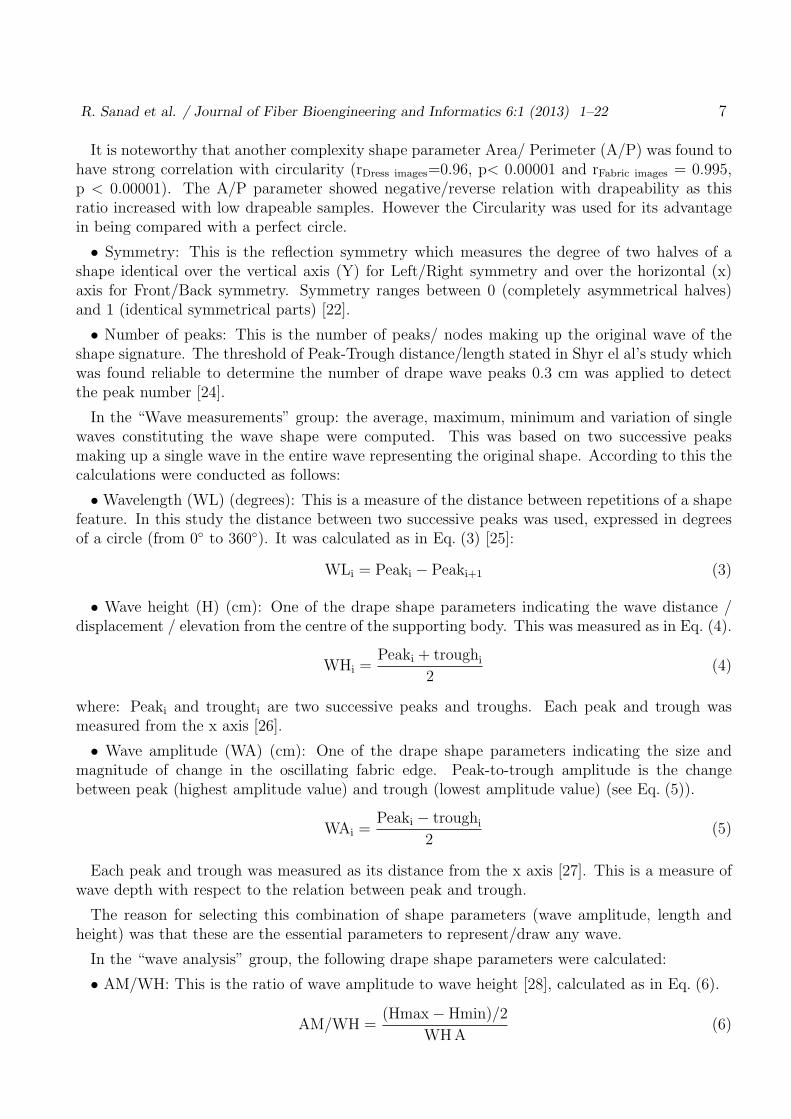
In the “Wave measurements” group: the average, maximum, minimum and variation of singlewaves constituting the wave shape were computed. This was based on two successive peaksmaking up a single wave in the entire wave representing the original shape. According to this thecalculations were conducted as follows:
• Wavelength (WL) (degrees): This is a measure of the distance between repetitions of a shapefeature. In this study the distance between two successive peaks was used, expressed in degreesof a circle (from 0◦ to 360◦). It was calculated as in Eq. (3) [25]:
WLi = Peaki − Peaki+1 (3)
• Wave height (H) (cm): One of the drape shape parameters indicating the wave distance /displacement / elevation from the centre of the supporting body. This was measured as in Eq. (4).
WHi =Peaki + troughi
2(4)
where: Peaki and troughti are two successive peaks and troughs. Each peak and trough wasmeasured from the x axis [26].
• Wave amplitude (WA) (cm): One of the drape shape parameters indicating the size andmagnitude of change in the oscillating fabric edge. Peak-to-trough amplitude is the changebetween peak (highest amplitude value) and trough (lowest amplitude value) (see Eq. (5)).
WAi =Peaki − troughi
2(5)
Each peak and trough was measured as its distance from the x axis [27]. This is a measure ofwave depth with respect to the relation between peak and trough.
The reason for selecting this combination of shape parameters (wave amplitude, length andheight) was that these are the essential parameters to represent/draw any wave.
In the “wave analysis” group, the following drape shape parameters were calculated:
• AM/WH: This is the ratio of wave amplitude to wave height [28], calculated as in Eq. (6).
AM/WH =(Hmax− Hmin)/2
WH A(6)
8 R. Sanad et al. / Journal of Fiber Bioengineering and Informatics 6:1 (2013) 1–22
where: H Max and H Min are maximum and minimum radii respectively, WH A is the waveheight average.
• WH/WL: This is the ratio of wave height to wavelength. This is a measure of drape foldseverity [12]. It was calculated as in Eq. (7).
WH/WL = Mean(Hi/Li (7)
where: Hi and Li were each single wave height and length respectively.
In the “Fourier” measurements group, three parameters called fitness factors were used toinvestigate the reliability of using Fourier transformation to represent drape were calculated:
• Fourier (cm): This is the area under the frequency (Fourier) plot for the measured shape.
• Fourier/ Original (%): This is the ratio between areas under frequency and original curves.
• Dominant/Original (%): This is the ratio between areas under reconstructed and originalcurves.
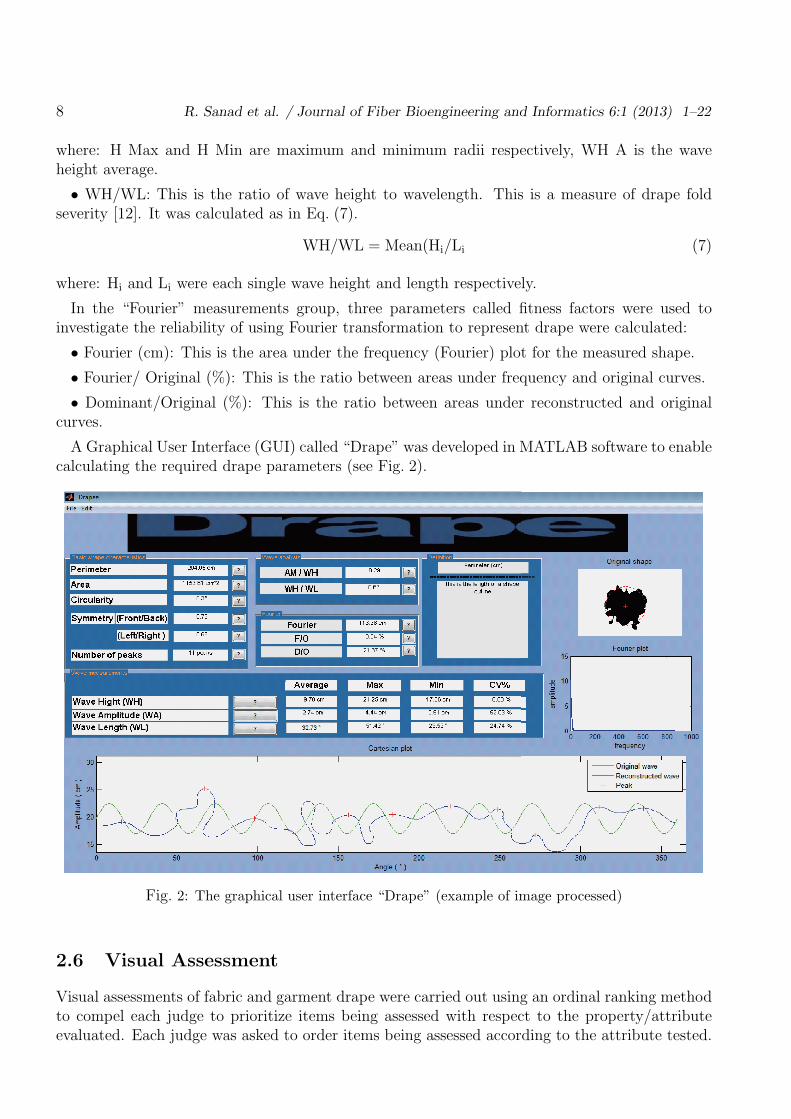
A Graphical User Interface (GUI) called “Drape” was developed in MATLAB software to enablecalculating the required drape parameters (see Fig. 2).
Fig. 2: The graphical user interface “Drape” (example of image processed)
2.6 Visual Assessment
Visual assessments of fabric and garment drape were carried out using an ordinal ranking methodto compel each judge to prioritize items being assessed with respect to the property/attributeevaluated. Each judge was asked to order items being assessed according to the attribute tested.
R. Sanad et al. / Journal of Fiber Bioengineering and Informatics 6:1 (2013) 1–22 9
2.6.1 Physical Samples Assessment
In this test, a convenience sample of 20 students studying in the last year of the fashion designprogramme were the assessors. Prior to the test, “Drape” was defined to each judge to clarifythe test and orient the judge. It was defined as the fabric’s ability to deform and orient itself intograceful folds or pleats when it is suspended under its own weight [3, 29].
The fabrics were hung from one tip to allow them to make folds. Assessors were asked to orderthem from the most drape to the least. They were allowed to handle and touch the fabrics.
In the garment tests, 12 garments constructed from the fabrics used in the previous test werehung on 12 mannequins of the same size (12) in a line. The mannequins were arranged randomlyin a row in front of the judge. First, each judge was asked to rank the dresses for drape amountand then to order them according to drape preferred.
Students were allowed to examine the dresses closely and touch them if necessary. Therefore,the evaluation process was dependant on visual and tactile senses which are usually used byapparel designers, makers and consumers in a drape assessment process.
2.6.2 Images Analysis
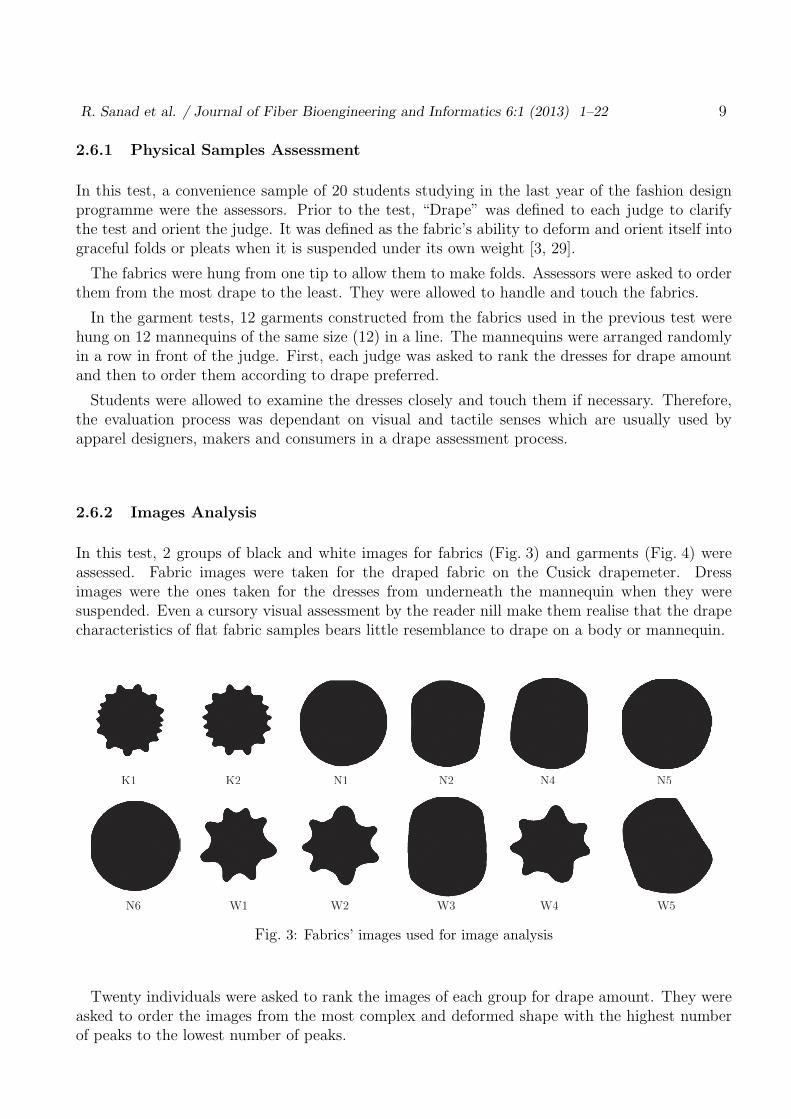
In this test, 2 groups of black and white images for fabrics (Fig. 3) and garments (Fig. 4) wereassessed. Fabric images were taken for the draped fabric on the Cusick drapemeter. Dressimages were the ones taken for the dresses from underneath the mannequin when they weresuspended. Even a cursory visual assessment by the reader nill make them realise that the drapecharacteristics of flat fabric samples bears little resemblance to drape on a body or mannequin.
K1 K2 N1 N2 N4 N5
N6 W1 W2 W3 W4 W5
K1 K2 N1 N2 N4 N5
Fig. 3: Fabrics’ images used for image analysis
Twenty individuals were asked to rank the images of each group for drape amount. They wereasked to order the images from the most complex and deformed shape with the highest numberof peaks to the lowest number of peaks.
10 R. Sanad et al. / Journal of Fiber Bioengineering and Informatics 6:1 (2013) 1–22
K1 K2 N1 N2 N4 N5
N6 W1 W2 W3 W4 W5
K1 K2 N1 N2 N4 N5
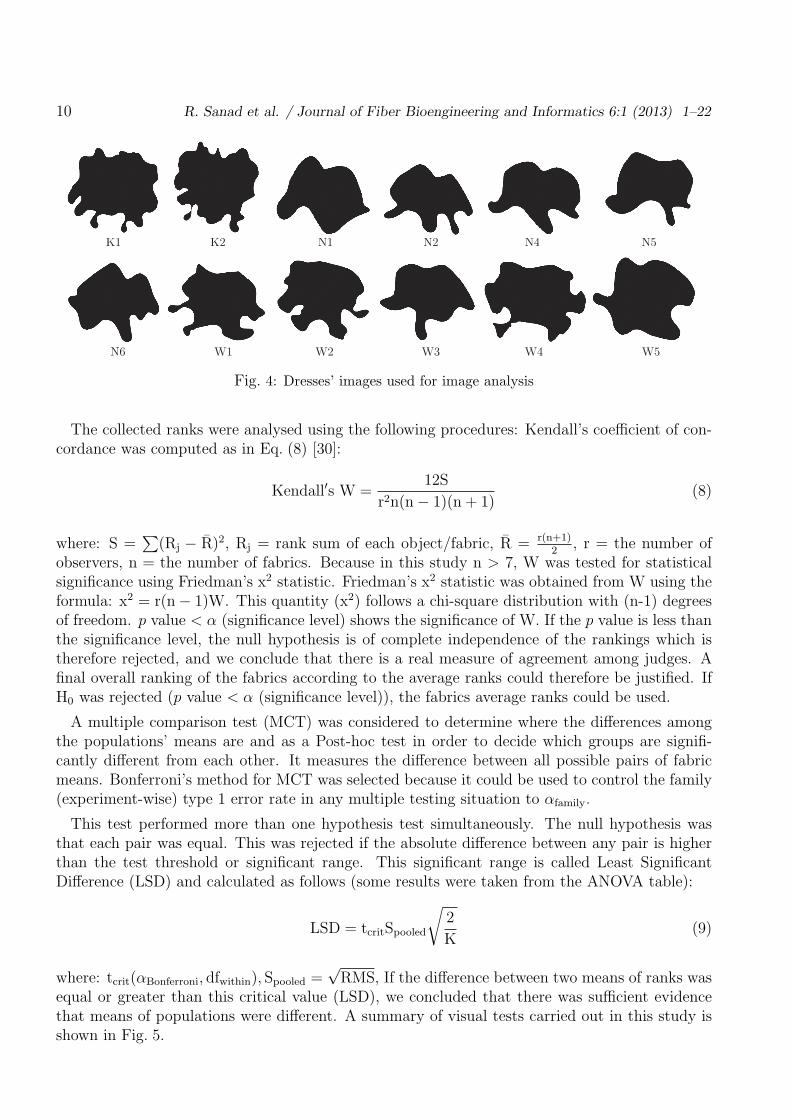
Fig. 4: Dresses’ images used for image analysis
The collected ranks were analysed using the following procedures: Kendall’s coefficient of con-cordance was computed as in Eq. (8) [30]:
Kendall′s W =12S
r2n(n− 1)(n + 1)(8)
where: S =∑
(Rj − R)2, Rj = rank sum of each object/fabric, R = r(n+1)2
, r = the number ofobservers, n = the number of fabrics. Because in this study n > 7, W was tested for statisticalsignificance using Friedman’s x2 statistic. Friedman’s x2 statistic was obtained from W using theformula: x2 = r(n− 1)W. This quantity (x2) follows a chi-square distribution with (n-1) degreesof freedom. p value < α (significance level) shows the significance of W. If the p value is less thanthe significance level, the null hypothesis is of complete independence of the rankings which istherefore rejected, and we conclude that there is a real measure of agreement among judges. Afinal overall ranking of the fabrics according to the average ranks could therefore be justified. IfH0 was rejected (p value < α (significance level)), the fabrics average ranks could be used.
A multiple comparison test (MCT) was considered to determine where the differences amongthe populations’ means are and as a Post-hoc test in order to decide which groups are signifi-cantly different from each other. It measures the difference between all possible pairs of fabricmeans. Bonferroni’s method for MCT was selected because it could be used to control the family(experiment-wise) type 1 error rate in any multiple testing situation to αfamily.
This test performed more than one hypothesis test simultaneously. The null hypothesis wasthat each pair was equal. This was rejected if the absolute difference between any pair is higherthan the test threshold or significant range. This significant range is called Least SignificantDifference (LSD) and calculated as follows (some results were taken from the ANOVA table):
LSD = tcritSpooled
√2
K(9)
where: tcrit(αBonferroni, dfwithin), Spooled =√
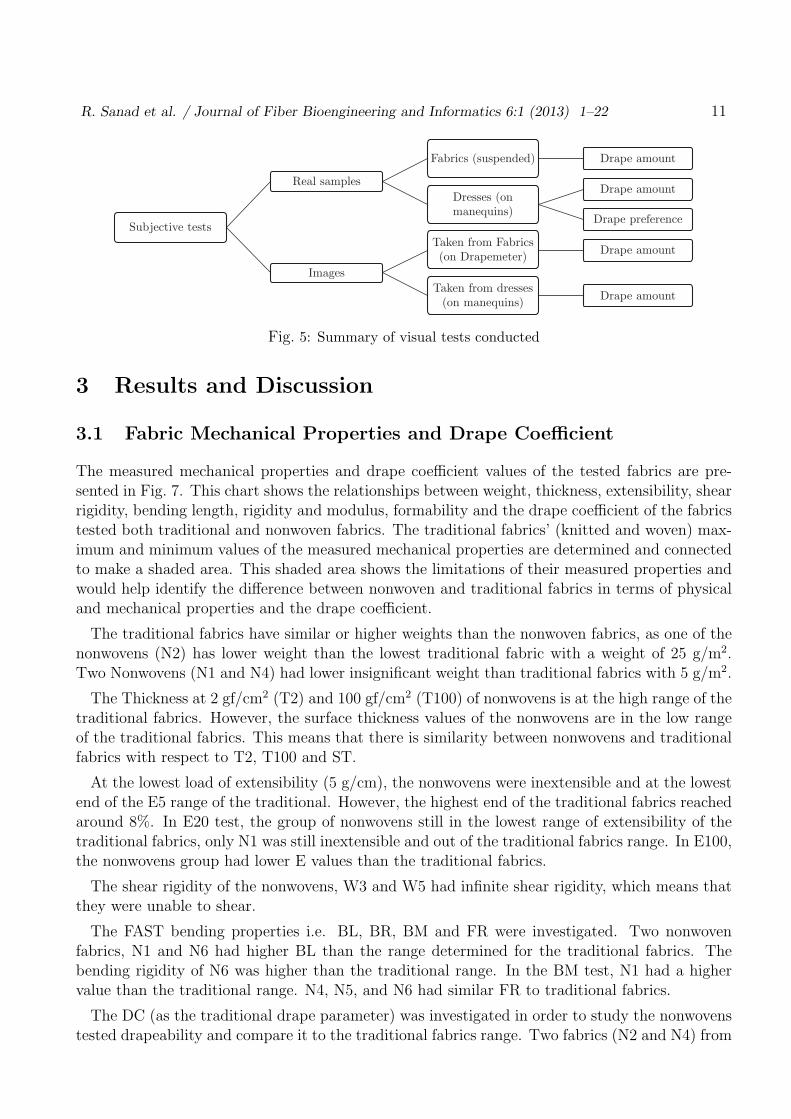
RMS, If the difference between two means of ranks wasequal or greater than this critical value (LSD), we concluded that there was sufficient evidencethat means of populations were different. A summary of visual tests carried out in this study isshown in Fig. 5.
R. Sanad et al. / Journal of Fiber Bioengineering and Informatics 6:1 (2013) 1–22 11
Subjective tests
Real samples
Fabrics (suspended) Drape amount
Dresses (onmanequins)
Drape amount
Drape preference
Images
Taken from Fabrics(on Drapemeter)
Drape amount
Taken from dresses(on manequins)
Drape amount
Fig. 5: Summary of visual tests conducted
3 Results and Discussion
3.1 Fabric Mechanical Properties and Drape Coefficient
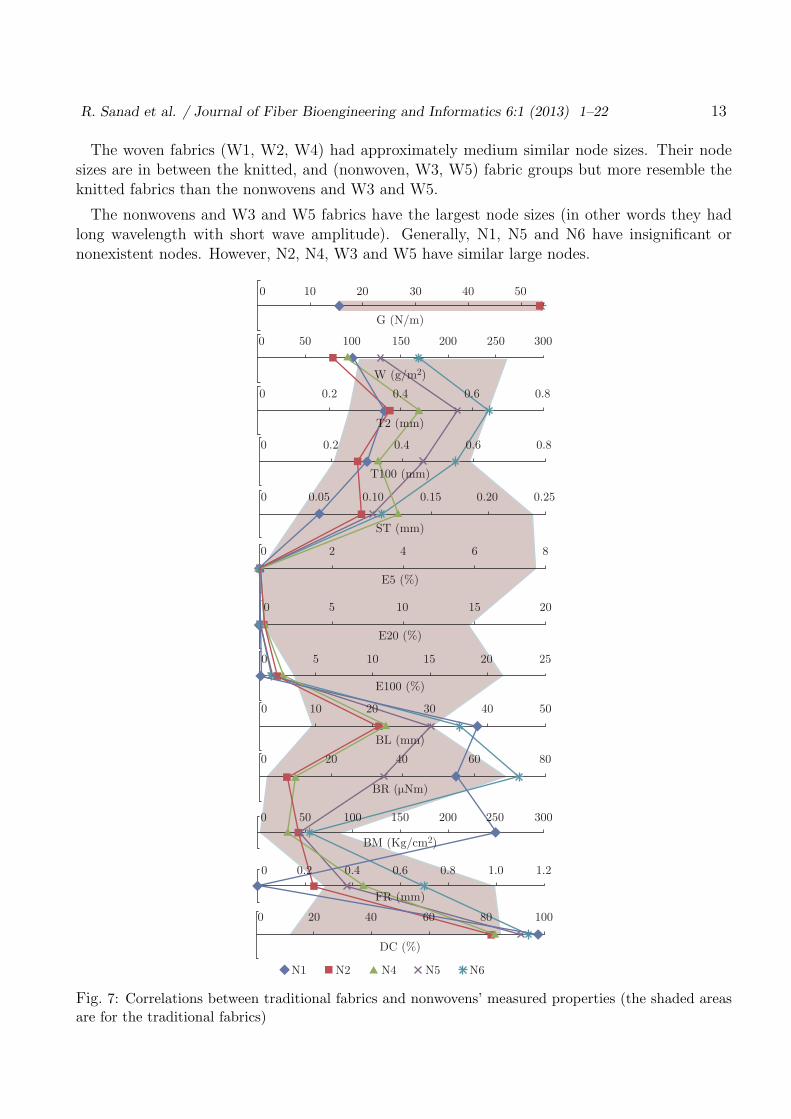
The measured mechanical properties and drape coefficient values of the tested fabrics are pre-sented in Fig. 7. This chart shows the relationships between weight, thickness, extensibility, shearrigidity, bending length, rigidity and modulus, formability and the drape coefficient of the fabricstested both traditional and nonwoven fabrics. The traditional fabrics’ (knitted and woven) max-imum and minimum values of the measured mechanical properties are determined and connectedto make a shaded area. This shaded area shows the limitations of their measured properties andwould help identify the difference between nonwoven and traditional fabrics in terms of physicaland mechanical properties and the drape coefficient.
The traditional fabrics have similar or higher weights than the nonwoven fabrics, as one of thenonwovens (N2) has lower weight than the lowest traditional fabric with a weight of 25 g/m2.Two Nonwovens (N1 and N4) had lower insignificant weight than traditional fabrics with 5 g/m2.
The Thickness at 2 gf/cm2 (T2) and 100 gf/cm2 (T100) of nonwovens is at the high range of thetraditional fabrics. However, the surface thickness values of the nonwovens are in the low rangeof the traditional fabrics. This means that there is similarity between nonwovens and traditionalfabrics with respect to T2, T100 and ST.
At the lowest load of extensibility (5 g/cm), the nonwovens were inextensible and at the lowestend of the E5 range of the traditional. However, the highest end of the traditional fabrics reachedaround 8%. In E20 test, the group of nonwovens still in the lowest range of extensibility of thetraditional fabrics, only N1 was still inextensible and out of the traditional fabrics range. In E100,the nonwovens group had lower E values than the traditional fabrics.
The shear rigidity of the nonwovens, W3 and W5 had infinite shear rigidity, which means thatthey were unable to shear.
The FAST bending properties i.e. BL, BR, BM and FR were investigated. Two nonwovenfabrics, N1 and N6 had higher BL than the range determined for the traditional fabrics. Thebending rigidity of N6 was higher than the traditional range. In the BM test, N1 had a highervalue than the traditional range. N4, N5, and N6 had similar FR to traditional fabrics.
The DC (as the traditional drape parameter) was investigated in order to study the nonwovenstested drapeability and compare it to the traditional fabrics range. Two fabrics (N2 and N4) from
12 R. Sanad et al. / Journal of Fiber Bioengineering and Informatics 6:1 (2013) 1–22
the five nonwovens tested had DCs at the high range of the DC of the traditional fabrics. Threenonwovens (N1, N5, N6) had DCs higher than the traditional fabric limitations. This means thatN2 and N4 had similar drapeability to some traditional fabrics with low drapeability.
The mechanical properties which would make the three nonwovens N1, N6 and N5 out of thetraditional fabrics’ drape limitations were investigated. N1 had W, FR, BM, BL and E100 out ofthe traditional range, N5 had only the E100 value out of the traditional range, N6 was differingin (T2, BL, BR and E100). Therefore, the increased DC would be as result of the increased BL,BR, BM, and/or the reduced FR and E100.
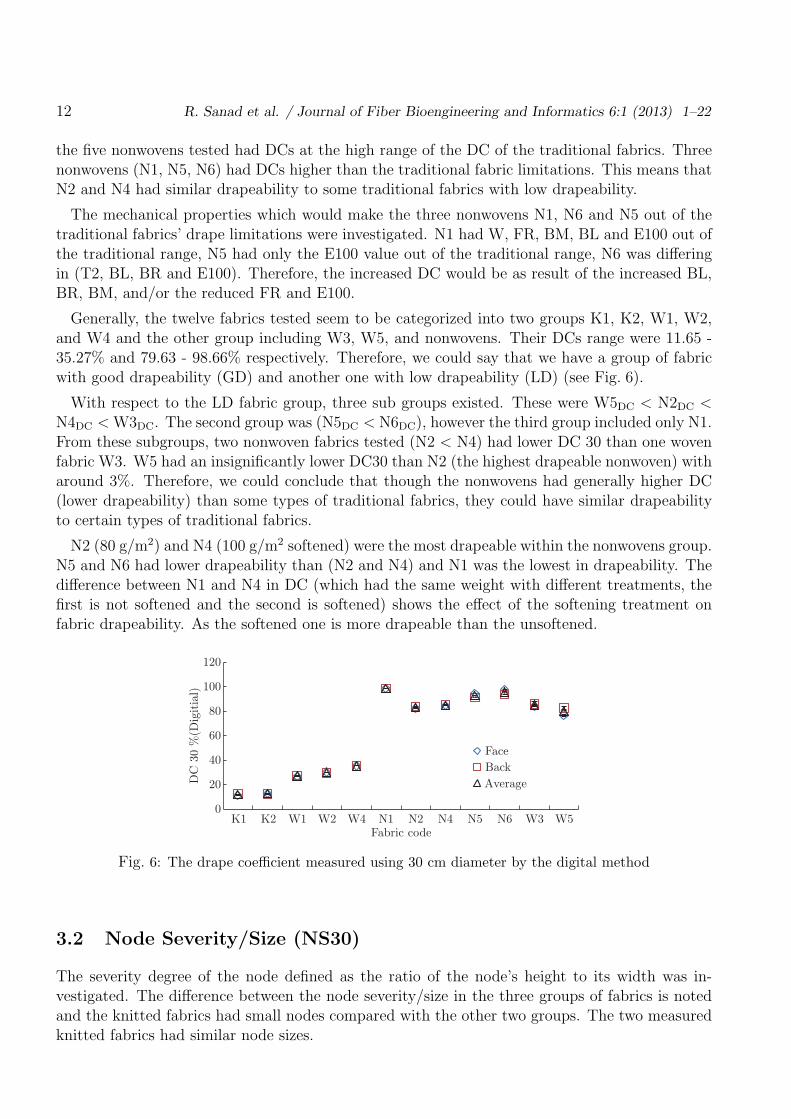
Generally, the twelve fabrics tested seem to be categorized into two groups K1, K2, W1, W2,and W4 and the other group including W3, W5, and nonwovens. Their DCs range were 11.65 -35.27% and 79.63 - 98.66% respectively. Therefore, we could say that we have a group of fabricwith good drapeability (GD) and another one with low drapeability (LD) (see Fig. 6).
With respect to the LD fabric group, three sub groups existed. These were W5DC < N2DC <N4DC < W3DC. The second group was (N5DC < N6DC), however the third group included only N1.From these subgroups, two nonwoven fabrics tested (N2 < N4) had lower DC 30 than one wovenfabric W3. W5 had an insignificantly lower DC30 than N2 (the highest drapeable nonwoven) witharound 3%. Therefore, we could conclude that though the nonwovens had generally higher DC(lower drapeability) than some types of traditional fabrics, they could have similar drapeabilityto certain types of traditional fabrics.
N2 (80 g/m2) and N4 (100 g/m2 softened) were the most drapeable within the nonwovens group.N5 and N6 had lower drapeability than (N2 and N4) and N1 was the lowest in drapeability. Thedifference between N1 and N4 in DC (which had the same weight with different treatments, thefirst is not softened and the second is softened) shows the effect of the softening treatment onfabric drapeability. As the softened one is more drapeable than the unsoftened.
0
20
40
60
80
100
120
K1 K2 W1 W2 W4 N1 N2 N4 N5 N6 W3 W5
DC
30
%(D
igit
ial)
Fabric code
Face
Back
Average
Fig. 6: The drape coefficient measured using 30 cm diameter by the digital method
3.2 Node Severity/Size (NS30)
The severity degree of the node defined as the ratio of the node’s height to its width was in-vestigated. The difference between the node severity/size in the three groups of fabrics is notedand the knitted fabrics had small nodes compared with the other two groups. The two measuredknitted fabrics had similar node sizes.
R. Sanad et al. / Journal of Fiber Bioengineering and Informatics 6:1 (2013) 1–22 13
The woven fabrics (W1, W2, W4) had approximately medium similar node sizes. Their nodesizes are in between the knitted, and (nonwoven, W3, W5) fabric groups but more resemble theknitted fabrics than the nonwovens and W3 and W5.
The nonwovens and W3 and W5 fabrics have the largest node sizes (in other words they hadlong wavelength with short wave amplitude). Generally, N1, N5 and N6 have insignificant ornonexistent nodes. However, N2, N4, W3 and W5 have similar large nodes.
0 10
0 0.2 0.4 0.6 0.8
0 0.2
0.05 0.10 0.20 0.250.150
0
0
0
0
0
0 50 100
0
0 20
N1 N2 N4 N5 N6
40 60 80 100
0.2 0.4 0.6 0.8 1.0 1.2
150 200 250 300
20 40 60 80
10 20 30 40 50
5 10 15 20 25
5 10 15 20
2 4 6 8
0.4 0.6 0.8
20 30 40 50
0 50 100 150 200 300250
G (N/m)
W (g/m2)
BM (Kg/cm2)
T2 (mm)
T100 (mm)
ST (mm)
E5 (%)
E20 (%)
E100 (%)
BL (mm)
BR (µNm)
FR (mm)
DC (%)
Fig. 7: Correlations between traditional fabrics and nonwovens’ measured properties (the shaded areasare for the traditional fabrics)
14 R. Sanad et al. / Journal of Fiber Bioengineering and Informatics 6:1 (2013) 1–22
3.3 Node Orientation (NO30)
The nodes constituting the drape profile orientation and position with regard to the lengthwiseand crosswise directions of the fabric measured were studied. The two knitted fabrics testedhad similar node orientation and distribution, the face and back drape profiles were similar also.However, smaller nodes were located in the crosswise direction than lengthwise direction.
There was similarity between the three tested fabrics (W1, W2, W4) and between their faceand back as well. The nodes were approximately regularly distributed around the periphery ofthe tested samples.
In the low drapeable fabrics group (nonwovens and W3 and W5), N2, N4, W3 and W5 includedconsiderable nodes in the lengthwise direction.
N1, N5 and N6 did not seem to generate significant nodes as N2, N4, W3 and W5 which meansthey were not considered to produce nodes but sometimes stick out in the lengthwise direction.
3.4 Selection of “Basic Drape Shape Parameters”
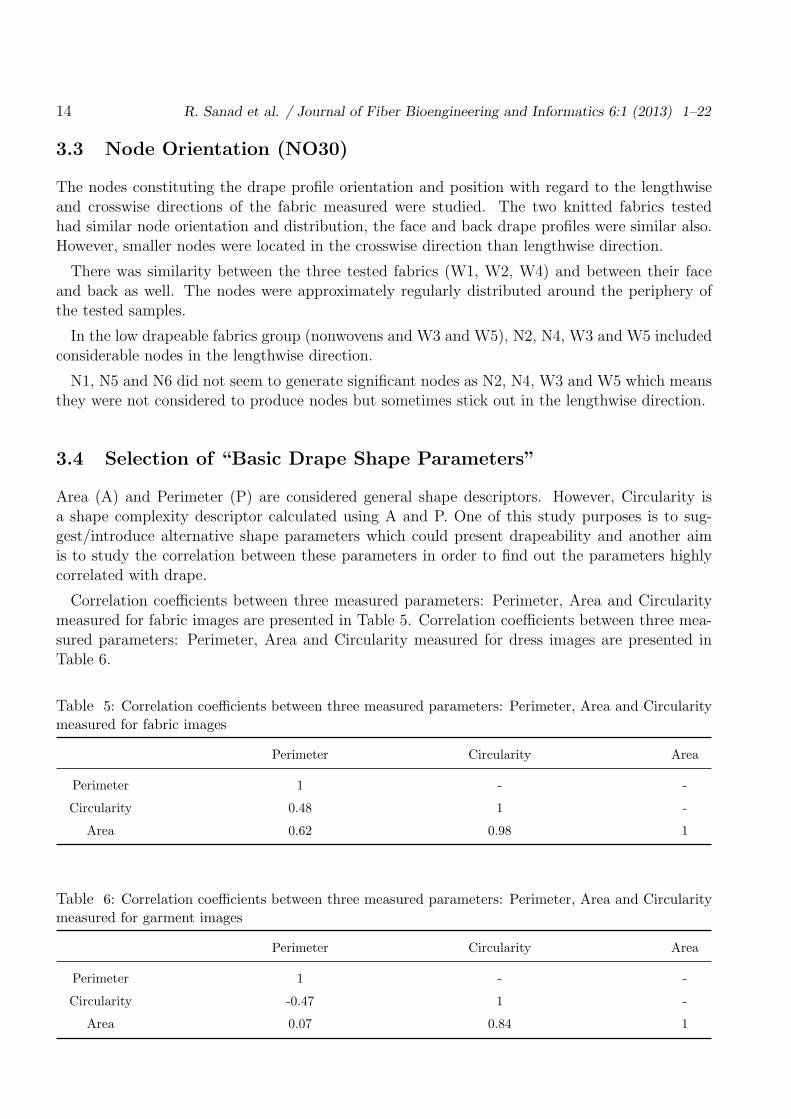
Area (A) and Perimeter (P) are considered general shape descriptors. However, Circularity isa shape complexity descriptor calculated using A and P. One of this study purposes is to sug-gest/introduce alternative shape parameters which could present drapeability and another aimis to study the correlation between these parameters in order to find out the parameters highlycorrelated with drape.
Correlation coefficients between three measured parameters: Perimeter, Area and Circularitymeasured for fabric images are presented in Table 5. Correlation coefficients between three mea-sured parameters: Perimeter, Area and Circularity measured for dress images are presented inTable 6.
Table 5: Correlation coefficients between three measured parameters: Perimeter, Area and Circularitymeasured for fabric images
Perimeter Circularity Area
Perimeter 1 - -
Circularity 0.48 1 -
Area 0.62 0.98 1
Table 6: Correlation coefficients between three measured parameters: Perimeter, Area and Circularitymeasured for garment images
Perimeter Circularity Area
Perimeter 1 - -
Circularity -0.47 1 -
Area 0.07 0.84 1
R. Sanad et al. / Journal of Fiber Bioengineering and Informatics 6:1 (2013) 1–22 15
The correlations in the above tables show that, however Circularity is calculated from A and Pit is only strongly correlated with the A (in both cases fabric and dresses images with r=0.98 and0.84 respectively). However the correlations between A and P were moderate in fabric images andno correlation in the dress images (r=0.07). The correlation between Circularity and Perimeterwas weak in both fabric and dress images.
In investigating the correlation between drape values from fabric and dress images, however, itwas expected that Circularity and Area to give similar correlations. It was found that Circularityhad r=0.91 and Area had r=0.64 (which is weaker than the first). This means that Circularityparameter is similar for fabric samples but the area was not.
3.5 Correlation between Drape Coefficient and Drape Values Mea-
sured for Fabrics on Drapemeter
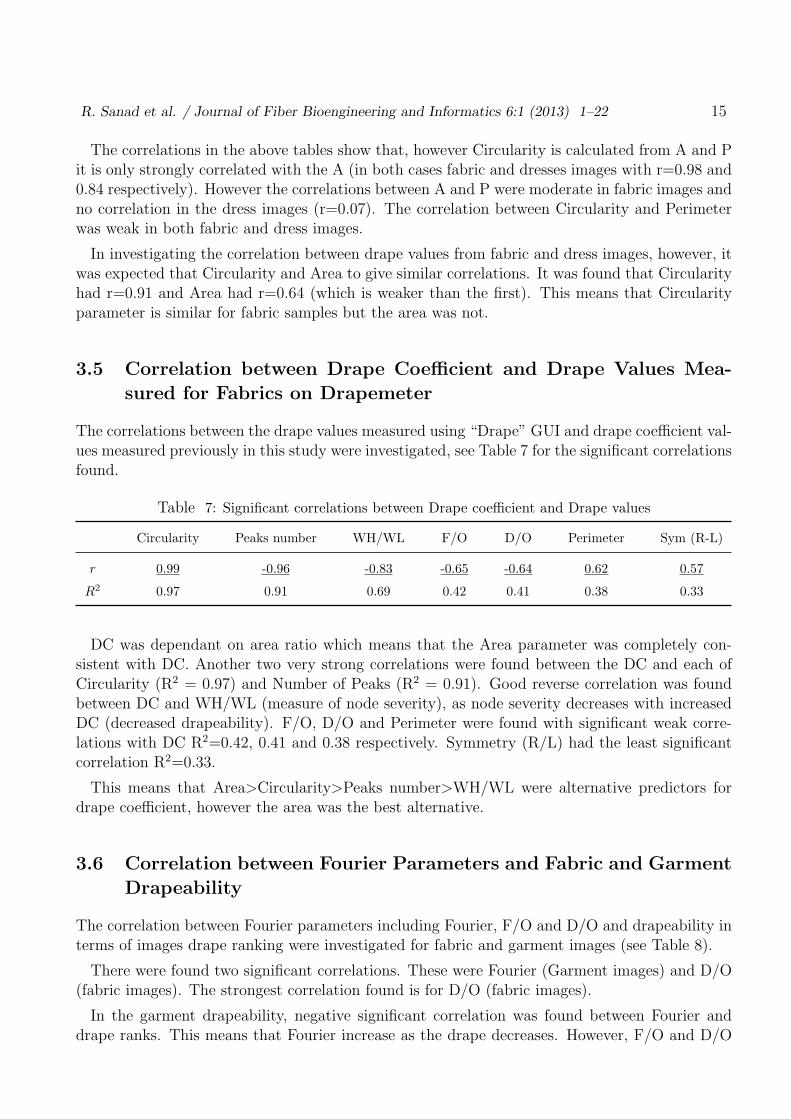
The correlations between the drape values measured using “Drape” GUI and drape coefficient val-ues measured previously in this study were investigated, see Table 7 for the significant correlationsfound.
Table 7: Significant correlations between Drape coefficient and Drape values
Circularity Peaks number WH/WL F/O D/O Perimeter Sym (R-L)
r 0.99 -0.96 -0.83 -0.65 -0.64 0.62 0.57
R2 0.97 0.91 0.69 0.42 0.41 0.38 0.33
DC was dependant on area ratio which means that the Area parameter was completely con-sistent with DC. Another two very strong correlations were found between the DC and each ofCircularity (R2 = 0.97) and Number of Peaks (R2 = 0.91). Good reverse correlation was foundbetween DC and WH/WL (measure of node severity), as node severity decreases with increasedDC (decreased drapeability). F/O, D/O and Perimeter were found with significant weak corre-lations with DC R2=0.42, 0.41 and 0.38 respectively. Symmetry (R/L) had the least significantcorrelation R2=0.33.
This means that Area>Circularity>Peaks number>WH/WL were alternative predictors fordrape coefficient, however the area was the best alternative.
3.6 Correlation between Fourier Parameters and Fabric and Garment
Drapeability
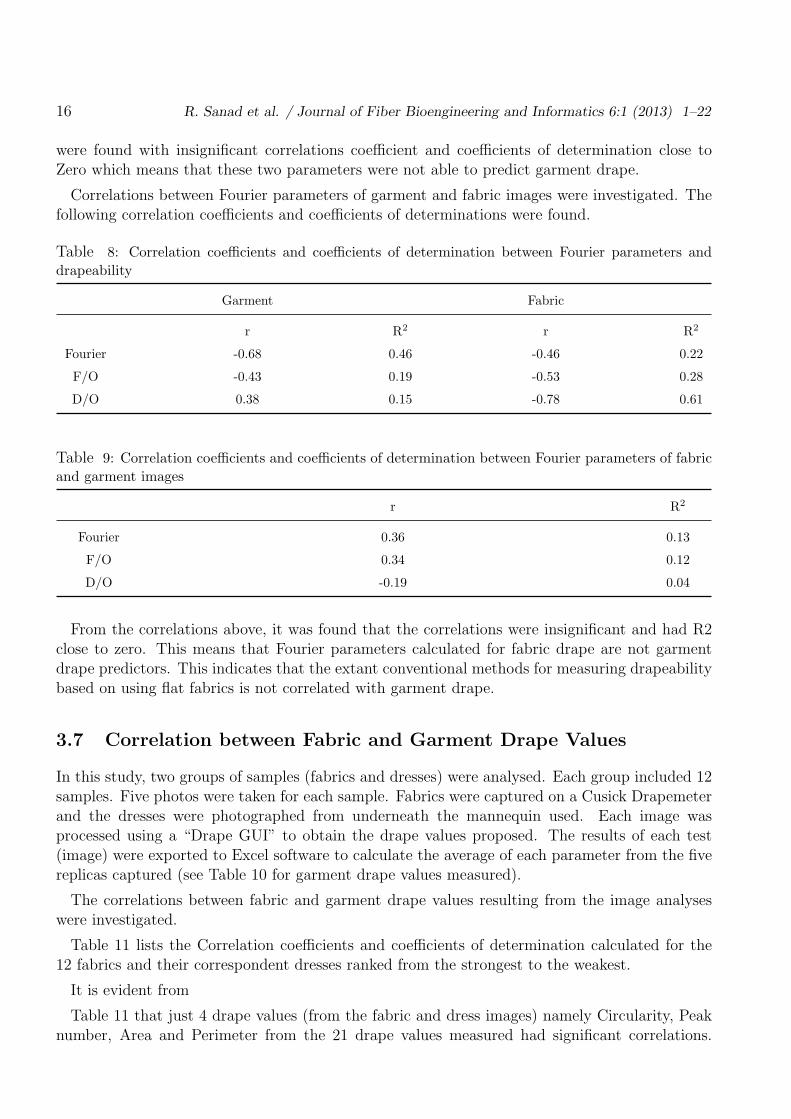
The correlation between Fourier parameters including Fourier, F/O and D/O and drapeability interms of images drape ranking were investigated for fabric and garment images (see Table 8).
There were found two significant correlations. These were Fourier (Garment images) and D/O(fabric images). The strongest correlation found is for D/O (fabric images).
In the garment drapeability, negative significant correlation was found between Fourier anddrape ranks. This means that Fourier increase as the drape decreases. However, F/O and D/O
16 R. Sanad et al. / Journal of Fiber Bioengineering and Informatics 6:1 (2013) 1–22
were found with insignificant correlations coefficient and coefficients of determination close toZero which means that these two parameters were not able to predict garment drape.
Correlations between Fourier parameters of garment and fabric images were investigated. Thefollowing correlation coefficients and coefficients of determinations were found.
Table 8: Correlation coefficients and coefficients of determination between Fourier parameters anddrapeability
Garment Fabric
r R2 r R2
Fourier -0.68 0.46 -0.46 0.22
F/O -0.43 0.19 -0.53 0.28
D/O 0.38 0.15 -0.78 0.61
Table 9: Correlation coefficients and coefficients of determination between Fourier parameters of fabricand garment images
r R2
Fourier 0.36 0.13
F/O 0.34 0.12
D/O -0.19 0.04
From the correlations above, it was found that the correlations were insignificant and had R2close to zero. This means that Fourier parameters calculated for fabric drape are not garmentdrape predictors. This indicates that the extant conventional methods for measuring drapeabilitybased on using flat fabrics is not correlated with garment drape.
3.7 Correlation between Fabric and Garment Drape Values
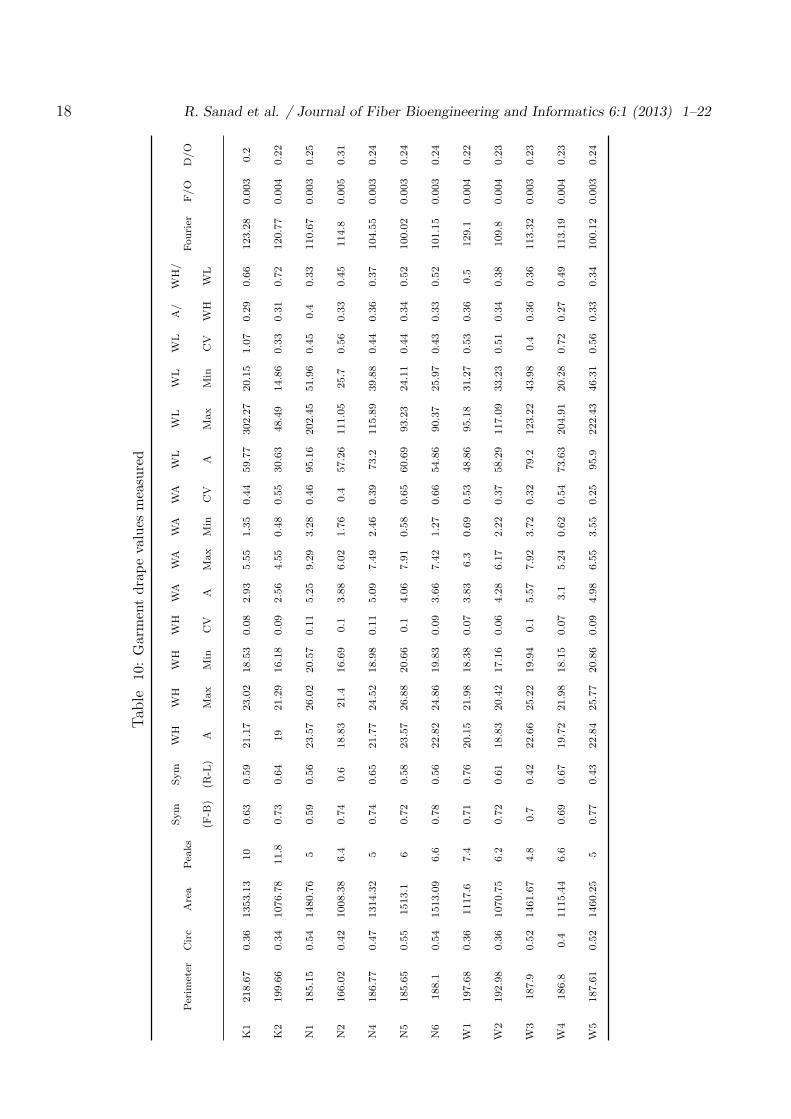
In this study, two groups of samples (fabrics and dresses) were analysed. Each group included 12samples. Five photos were taken for each sample. Fabrics were captured on a Cusick Drapemeterand the dresses were photographed from underneath the mannequin used. Each image wasprocessed using a “Drape GUI” to obtain the drape values proposed. The results of each test(image) were exported to Excel software to calculate the average of each parameter from the fivereplicas captured (see Table 10 for garment drape values measured).
The correlations between fabric and garment drape values resulting from the image analyseswere investigated.
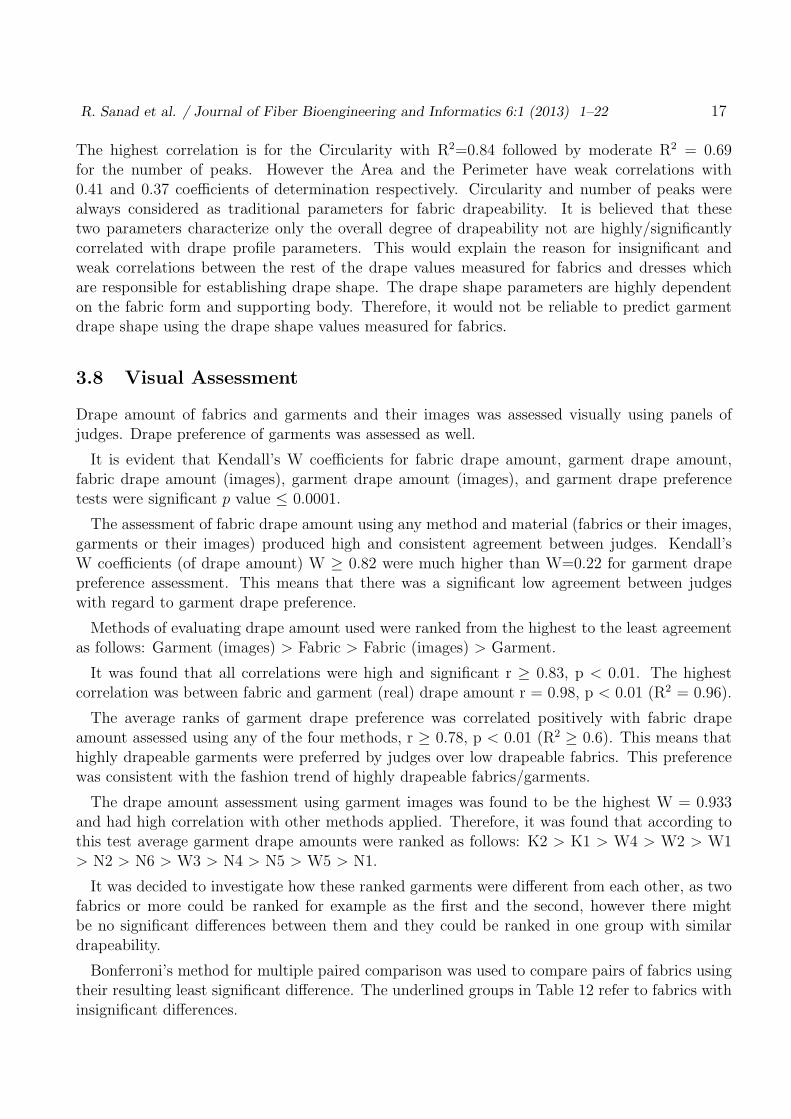
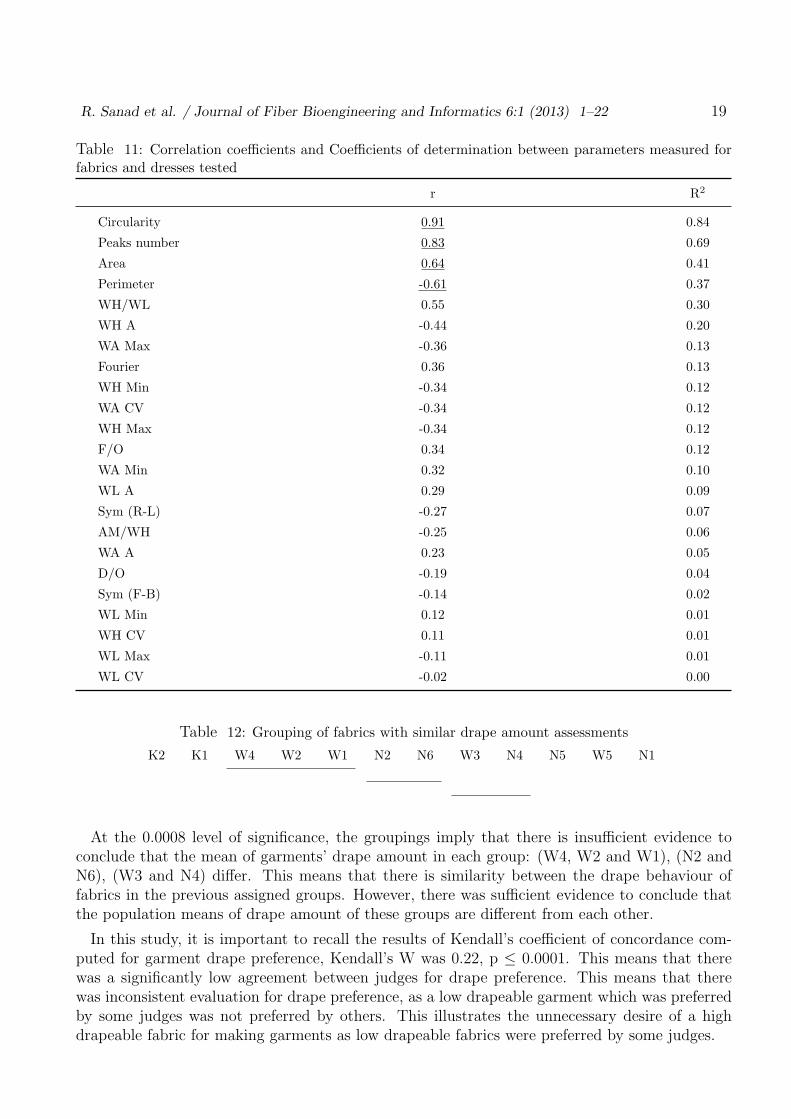
Table 11 lists the Correlation coefficients and coefficients of determination calculated for the12 fabrics and their correspondent dresses ranked from the strongest to the weakest.
It is evident from
Table 11 that just 4 drape values (from the fabric and dress images) namely Circularity, Peaknumber, Area and Perimeter from the 21 drape values measured had significant correlations.
R. Sanad et al. / Journal of Fiber Bioengineering and Informatics 6:1 (2013) 1–22 17
The highest correlation is for the Circularity with R2=0.84 followed by moderate R2 = 0.69for the number of peaks. However the Area and the Perimeter have weak correlations with0.41 and 0.37 coefficients of determination respectively. Circularity and number of peaks werealways considered as traditional parameters for fabric drapeability. It is believed that thesetwo parameters characterize only the overall degree of drapeability not are highly/significantlycorrelated with drape profile parameters. This would explain the reason for insignificant andweak correlations between the rest of the drape values measured for fabrics and dresses whichare responsible for establishing drape shape. The drape shape parameters are highly dependenton the fabric form and supporting body. Therefore, it would not be reliable to predict garmentdrape shape using the drape shape values measured for fabrics.
3.8 Visual Assessment
Drape amount of fabrics and garments and their images was assessed visually using panels ofjudges. Drape preference of garments was assessed as well.
It is evident that Kendall’s W coefficients for fabric drape amount, garment drape amount,fabric drape amount (images), garment drape amount (images), and garment drape preferencetests were significant p value ≤ 0.0001.
The assessment of fabric drape amount using any method and material (fabrics or their images,garments or their images) produced high and consistent agreement between judges. Kendall’sW coefficients (of drape amount) W ≥ 0.82 were much higher than W=0.22 for garment drapepreference assessment. This means that there was a significant low agreement between judgeswith regard to garment drape preference.
Methods of evaluating drape amount used were ranked from the highest to the least agreementas follows: Garment (images) > Fabric > Fabric (images) > Garment.
It was found that all correlations were high and significant r ≥ 0.83, p < 0.01. The highestcorrelation was between fabric and garment (real) drape amount r = 0.98, p < 0.01 (R2 = 0.96).
The average ranks of garment drape preference was correlated positively with fabric drapeamount assessed using any of the four methods, r ≥ 0.78, p < 0.01 (R2 ≥ 0.6). This means thathighly drapeable garments were preferred by judges over low drapeable fabrics. This preferencewas consistent with the fashion trend of highly drapeable fabrics/garments.
The drape amount assessment using garment images was found to be the highest W = 0.933and had high correlation with other methods applied. Therefore, it was found that according tothis test average garment drape amounts were ranked as follows: K2 > K1 > W4 > W2 > W1> N2 > N6 > W3 > N4 > N5 > W5 > N1.
It was decided to investigate how these ranked garments were different from each other, as twofabrics or more could be ranked for example as the first and the second, however there mightbe no significant differences between them and they could be ranked in one group with similardrapeability.
Bonferroni’s method for multiple paired comparison was used to compare pairs of fabrics usingtheir resulting least significant difference. The underlined groups in Table 12 refer to fabrics withinsignificant differences.
18 R. Sanad et al. / Journal of Fiber Bioengineering and Informatics 6:1 (2013) 1–22
Tab
le10
:G
arm
ent
drap
eva
lues
mea
sure
d
Per
imet
erC
irc
Are
aPea
ks
Sym
(F-B
)
Sym
(R-L
)
WH
A
WH
Max
WH
Min
WH
CV
WA A
WA
Max
WA
Min
WA
CV
WL
A
WL
Max
WL
Min
WL
CV
A/
WH
WH
/
WL
Fouri
erF/O
D/O
K1
218.6
70.3
61353.1
310
0.6
30.5
921.1
723.0
218.5
30.0
82.9
35.5
51.3
50.4
459.7
7302.2
720.1
51.0
70.2
90.6
6123.2
80.0
03
0.2
K2
199.6
60.3
41076.7
811.8
0.7
30.6
419
21.2
916.1
80.0
92.5
64.5
50.4
80.5
530.6
348.4
914.8
60.3
30.3
10.7
2120.7
70.0
04
0.2
2
N1
185.1
50.5
41480.7
65
0.5
90.5
623.5
726.0
220.5
70.1
15.2
59.2
93.2
80.4
695.1
6202.4
551.9
60.4
50.4
0.3
3110.6
70.0
03
0.2
5
N2
166.0
20.4
21008.3
86.4
0.7
40.6
18.8
321.4
16.6
90.1
3.8
86.0
21.7
60.4
57.2
6111.0
525.7
0.5
60.3
30.4
5114.8
0.0
05
0.3
1
N4
186.7
70.4
71314.3
25
0.7
40.6
521.7
724.5
218.9
80.1
15.0
97.4
92.4
60.3
973.2
115.8
939.8
80.4
40.3
60.3
7104.5
50.0
03
0.2
4
N5
185.6
50.5
51513.1
60.7
20.5
823.5
726.8
820.6
60.1
4.0
67.9
10.5
80.6
560.6
993.2
324.1
10.4
40.3
40.5
2100.0
20.0
03
0.2
4
N6
188.1
0.5
41513.0
96.6
0.7
80.5
622.8
224.8
619.8
30.0
93.6
67.4
21.2
70.6
654.8
690.3
725.9
70.4
30.3
30.5
2101.1
50.0
03
0.2
4
W1
197.6
80.3
61117.6
7.4
0.7
10.7
620.1
521.9
818.3
80.0
73.8
36.3
0.6
90.5
348.8
695.1
831.2
70.5
30.3
60.5
129.1
0.0
04
0.2
2
W2
192.9
80.3
61070.7
56.2
0.7
20.6
118.8
320.4
217.1
60.0
64.2
86.1
72.2
20.3
758.2
9117.0
933.2
30.5
10.3
40.3
8109.8
0.0
04
0.2
3
W3
187.9
0.5
21461.6
74.8
0.7
0.4
222.6
625.2
219.9
40.1
5.5
77.9
23.7
20.3
279.2
123.2
243.9
80.4
0.3
60.3
6113.3
20.0
03
0.2
3
W4
186.8
0.4
1115.4
46.6
0.6
90.6
719.7
221.9
818.1
50.0
73.1
5.2
40.6
20.5
473.6
3204.9
120.2
80.7
20.2
70.4
9113.1
90.0
04
0.2
3
W5
187.6
10.5
21460.2
55
0.7
70.4
322.8
425.7
720.8
60.0
94.9
86.5
53.5
50.2
595.9
222.4
346.3
10.5
60.3
30.3
4100.1
20.0
03
0.2
4
R. Sanad et al. / Journal of Fiber Bioengineering and Informatics 6:1 (2013) 1–22 19
Table 11: Correlation coefficients and Coefficients of determination between parameters measured forfabrics and dresses tested
r R2
Circularity 0.91 0.84
Peaks number 0.83 0.69
Area 0.64 0.41
Perimeter -0.61 0.37
WH/WL 0.55 0.30
WH A -0.44 0.20
WA Max -0.36 0.13
Fourier 0.36 0.13
WH Min -0.34 0.12
WA CV -0.34 0.12
WH Max -0.34 0.12
F/O 0.34 0.12
WA Min 0.32 0.10
WL A 0.29 0.09
Sym (R-L) -0.27 0.07
AM/WH -0.25 0.06
WA A 0.23 0.05
D/O -0.19 0.04
Sym (F-B) -0.14 0.02
WL Min 0.12 0.01
WH CV 0.11 0.01
WL Max -0.11 0.01
WL CV -0.02 0.00
Table 12: Grouping of fabrics with similar drape amount assessments
K2 K1 W4 W2 W1 N2 N6 W3 N4 N5 W5 N1
At the 0.0008 level of significance, the groupings imply that there is insufficient evidence toconclude that the mean of garments’ drape amount in each group: (W4, W2 and W1), (N2 andN6), (W3 and N4) differ. This means that there is similarity between the drape behaviour offabrics in the previous assigned groups. However, there was sufficient evidence to conclude thatthe population means of drape amount of these groups are different from each other.
In this study, it is important to recall the results of Kendall’s coefficient of concordance com-puted for garment drape preference, Kendall’s W was 0.22, p ≤ 0.0001. This means that therewas a significantly low agreement between judges for drape preference. This means that therewas inconsistent evaluation for drape preference, as a low drapeable garment which was preferredby some judges was not preferred by others. This illustrates the unnecessary desire of a highdrapeable fabric for making garments as low drapeable fabrics were preferred by some judges.
20 R. Sanad et al. / Journal of Fiber Bioengineering and Informatics 6:1 (2013) 1–22
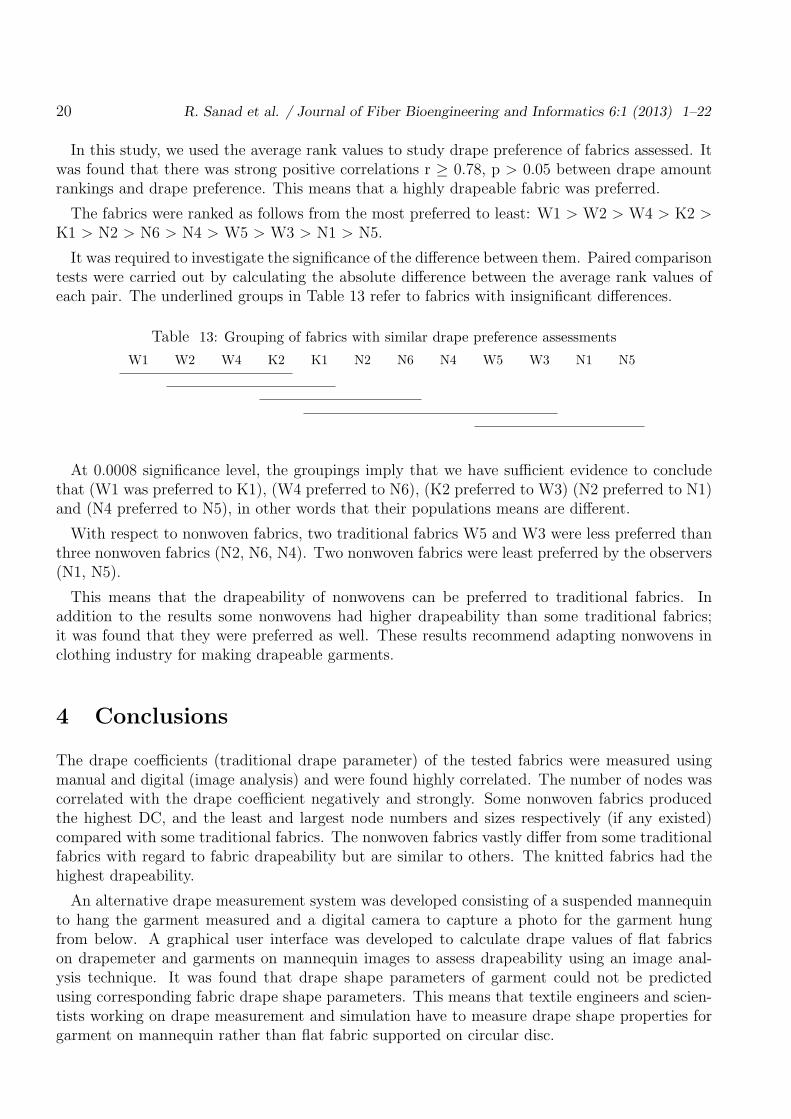
In this study, we used the average rank values to study drape preference of fabrics assessed. Itwas found that there was strong positive correlations r ≥ 0.78, p > 0.05 between drape amountrankings and drape preference. This means that a highly drapeable fabric was preferred.
The fabrics were ranked as follows from the most preferred to least: W1 > W2 > W4 > K2 >K1 > N2 > N6 > N4 > W5 > W3 > N1 > N5.
It was required to investigate the significance of the difference between them. Paired comparisontests were carried out by calculating the absolute difference between the average rank values ofeach pair. The underlined groups in Table 13 refer to fabrics with insignificant differences.
Table 13: Grouping of fabrics with similar drape preference assessments
W1 W2 W4 K2 K1 N2 N6 N4 W5 W3 N1 N5
At 0.0008 significance level, the groupings imply that we have sufficient evidence to concludethat (W1 was preferred to K1), (W4 preferred to N6), (K2 preferred to W3) (N2 preferred to N1)and (N4 preferred to N5), in other words that their populations means are different.
With respect to nonwoven fabrics, two traditional fabrics W5 and W3 were less preferred thanthree nonwoven fabrics (N2, N6, N4). Two nonwoven fabrics were least preferred by the observers(N1, N5).
This means that the drapeability of nonwovens can be preferred to traditional fabrics. Inaddition to the results some nonwovens had higher drapeability than some traditional fabrics;it was found that they were preferred as well. These results recommend adapting nonwovens inclothing industry for making drapeable garments.
4 Conclusions
The drape coefficients (traditional drape parameter) of the tested fabrics were measured usingmanual and digital (image analysis) and were found highly correlated. The number of nodes wascorrelated with the drape coefficient negatively and strongly. Some nonwoven fabrics producedthe highest DC, and the least and largest node numbers and sizes respectively (if any existed)compared with some traditional fabrics. The nonwoven fabrics vastly differ from some traditionalfabrics with regard to fabric drapeability but are similar to others. The knitted fabrics had thehighest drapeability.
An alternative drape measurement system was developed consisting of a suspended mannequinto hang the garment measured and a digital camera to capture a photo for the garment hungfrom below. A graphical user interface was developed to calculate drape values of flat fabricson drapemeter and garments on mannequin images to assess drapeability using an image anal-ysis technique. It was found that drape shape parameters of garment could not be predictedusing corresponding fabric drape shape parameters. This means that textile engineers and scien-tists working on drape measurement and simulation have to measure drape shape properties forgarment on mannequin rather than flat fabric supported on circular disc.
R. Sanad et al. / Journal of Fiber Bioengineering and Informatics 6:1 (2013) 1–22 21
The usefulness of this research is that it challenges the use of flat fabric measurements of drapeproperties. It is suggested that as fabrics in garments are never draped in this manner then weneed to seek a more suitable measurement system. An alternative has been suggested, evaluatedand though more studies are required, a considerable degree of success has been achieved.
References
[1] British Standards Institution. Method for the assessment of drape fabrics. London: Brtitish Stan-dard Instituition; 1973.
[2] Fan J, Yu W, Hunter L. Clothing appearance and fit: science and technology Cambridge: Wood-head Publishing in association with The Textile Institute; 2004.
[3] Chu CC, Cummings CL, Teixeira NA. Mechanics of Elastic Performance of Textile Materials: PartV: A Study of the Factors Affecting the Drape of Fabrics -The Development of a Drape Meter.TEXT RES J. 1950; 20(8): 539-48.
[4] Cusick GE. The dependence of fabric drape on bending and shear stifness J TEXT I T. 1965;56(11): 596-606.
[5] Cusick GE. The measurement of fabric drape. J TEXT I. 1968; 59(6): 253-60.[6] Collier BJ. Measurement of fabric drape and its relation to fabric mechanical properties and
subjective evaluation. CTRJ. 1991; 10(1): 46-52.[7] Vangheluwe L, Kiekens P. Time dependence of the drape coefficient of fabrics. INT J CLOTH SCI
TECH. 1993; 5(5): 5-8.[8] Ruckman JE, CHENG KB, Murray R. Dynamic drape measuring system. INT J CLOTH SCI
TECH. 1998; 10(6): 56.[9] Ucar N, Kalaoclu F, Bahtiyar D, Blac OE. Investigating the drape behavior of seamed knit fabrics
with image analysis. TEXT RES J. 2004; 74(2): 166-71.[10] Kenkare N, May-plumlee T. Fabric drape measurement: A modified method using digital image
processing. JTATM. 2005; 4(3 spring): 1-8.[11] Jeong YJ. A study of fabric drape behaviour with image analysis Part I: Measurement, character-
isation, and instability. J TEXT I. 1998; 89(1): 59-69.[12] Robson D, Long CC. Drape analysis using imaging techniques. CTRJ. 2000; 18(1): 1-8.[13] Matsudaira M, Yang M, Kinari T, Shintaku S. Polyester “Shingosen” fabrics characterized by
dynamic drape coefficient with swinging motion. TEXT RES J. 2002; 72(5): 410-6.[14] Behera BK, Mishra R. Objective measurement of fabric appearance using digital image processing.
J TEXT I. 2006; 97(2): 147-53.[15] Mizutani C, Amano T, Sakaguchi Y. A new apparatus for the study of fabric drape. TEXT RES
J. 2005; 75(1): 81-7.[16] Sanad R, Cassidy T, Cheung V. Fabric and Garment Drape Measurement - Part 1. Journal of
Fiber Bioengineering and Informatics. 2012; 5(4): 341-58.[17] Jeong YJ. A Study of Fabric-drape Behaviour with Image Analysis Part I: Measurement, Charac-
terisation, and Instability. J TEXT I. 1998; 89(1): 59-69.[18] British Standards Institution. Textiles. Test methods for nonwovens. Determination of drapability
including drape coefficient. London: British Standards Institution; 2008.[19] Cui F-F, Zhang X, Wang L-S Study of the Relationship between Jacket- Business Wear Fitness
and Fabric Drape. In: Y L, YP Q, XN L, JS L (eds) The 3rd International Symposium of TextileBioengineering and Informatics; May 28-30, 2010; 2010. 1299-306.
22 R. Sanad et al. / Journal of Fiber Bioengineering and Informatics 6:1 (2013) 1–22
[20] Jiang J-F, Zhong Y-Q, Wang S-Y, Li D Sketch-Based Drape and Wrinkles for Virtual Skirt. In:Y L, YP Q, XN L, JS L (eds) The 3rd International Symposium of Textile Bioengineering andInformatics; May 28-30, 2010; 2010. 1113-7.
[21] Saleh SSE-DS. Low stress mechanical properties of hydroentangled fabrics Leeds: The Universityof Leeds; 2003.
[22] Costa LdF, Jr RMC. Shape analysis and classification: Theory and practice Boca Raton: CRCPress; 2000.
[23] Haidekker MA. Advanced biomedical image analysis Chichester: Wiley; 2011.[24] Shyr TW, Wang PN, Lin JY. Subjective and objective evaluation methods to determine the peak-
trough threshold of the drape fabric node. TEXT RES J. 2009; 79(13): 1223-34.[25] Jevsnik S, Zunic-Lojen D. Drape behaviour of seamed fabrics. Fibers Polym. 2007; 8(5): 550-7.[26] Pandurangan P, Eischen J, Kenkare N, Lamar TAM. Enhancing accuracy of drape simulation. Part
II: Optimized drape simulation using industry-specific software. J TEXT I. 2008; 99(3): 219-26.[27] British Standards Institution. Textiles. Test methods for nonwovens. Determination of drapability
including drape coefficient. London: BSI; 2008.[28] Sharma KR, Behera BK, Roedel H, Schenk A. Effect of sewing and fusing of interlining on drape
behaviour of suiting fabrics. INT J CLOTH SCI TECH. 2005; 17(1-2): 75-90.[29] British standards Institution. Method for the assessment of drape fabrics. London: BSI; 1973.[30] Leaf GAV. Practical statistics for the textile industry. Part 2. Manchester: Textile Institute; 1987.