Embed Size (px)
Citation preview

1
Exuberance & Municipal Bankruptcy: A Case Study of San Bernardino, Stockton & Vallejo, CA Tracy Gordon Senior Fellow Urban Institute Tax Policy Center 2100 M Street NW Washington, DC 20037 202-261-5379 [email protected] Michael Lens Assistant Professor of Urban Planning UCLA Luskin School of Public Affairs 3250 Public Affairs Building Los Angeles, CA 90095 917-334-4516 [email protected] Paavo Monkkonen Associate Professor of Urban Planning UCLA Luskin School of Public Affairs 3250 Public Affairs Building Los Angeles, CA 90095 310-482-7733 [email protected] Larry A. Rosenthal Senior Lecturer Goldman School of Public Policy 2607 Hearst Avenue Berkeley, CA 94720 (510) 642-2062 [email protected] DRAFT May 1, 2017
2
Abstract A series of municipal bankruptcies across the United States during and after the financial crisis of 2007-2008 revealed the need for a better understanding of the many factors that shape cities’ fiscal operating environments and solvency conditions. The larger project this study is part of focuses on the role of real estate price changes in the spending and revenues of local governments, examining specifically the issue of irrational exuberance at city hall. We know that property value changes can influence revenue expectations, and ask whether perceptions about future growth conditions may increase propensity to commit to spending revenue that might not materialize. One understudied aspect of this hypothesis is the way in which local governments of various structures process information about local real estate market conditions and revenue expectations. In work completed recently, we analyzed how city councils and fiscal managers learn about real estate market conditions. We found that cities see themselves as budgeting conservatively, and that the housing boom and bust was secondary to declines in sales tax and other revenues during the recession. In this paper, we extend the inquiry to cover the bankruptcies of San Bernardino, Vallejo, and Stockton, CA. We explore these cases relying upon contemporaneous news reports and commentaries, as well as background sources providing municipal history. While exuberance may set the stage for the very extreme policy choice to seek Chapter 9 bankruptcy protection, we find that the perceptions of local administrators and lawmakers relative to economic growth and revenue expectations alone were likely not sufficient to predict, or explain, these cases. Instead, a number of political, budgetary, and financial factors must coincide in order to place leaders and managers into the kind of predicaments which place bankruptcy on the table as a rational, if unappetizing, option.
3
1. Introduction
Municipal bankruptcy is rare by design, and the Great Recession experience thankfully did not increase its incidence much. Early doomsday predictions of a wave of municipal failures nationwide happily failed to pan out. Nearly every city suffering severe fiscal challenges, and their creditors, by and large found a way to avoid Chapter 9. Cities adjusted debt, cut spending, reduced service delivery and expectations, found new revenue, utilized rainy-day resources, and negotiated refinancings. They weathered the storm, and federal stimulus and the recovery ultimately buoyed municipal balance sheets. But in a very few places – including some in California - the losses were unmanageable, the debt burden unwieldy.
This report supplements our prior submission, “The Fiscal Management of Property Wealth in Good and Bad Times: How do Local Governments in California Process Information on Real Estate Markets?” with an in-depth case study of the municipal bankruptcy in the City of San Bernardino, California [2012-2017]. We briefly compare that case to others around the state, in Vallejo [2008-2011] and Stockton [2012-2015]. Our focal interest remains the same: how did changes in regional real estate markets affect local decisionmaking? Ultimately we assert that the bankruptcy phenomenon must be viewed in broader context.
We have earlier suggested the possibility that “exuberance” during the run-up to the mortgage meltdown may have led to excessive revenue expectations, lax financial management, and even some overly risky expenditures. As we will discuss below, however, bankruptcy experience cannot be interpreted in such analytic isolation. Bankruptcy itself may be a relatively poor marker of exuberance, in point of fact. So many influences and behaviors must coincide and degenerate in order to necessitate a decision to pursue that extreme federal remedy. Moreover, the politics of that decision vary greatly. Newly seated councils may be deemed heroes when they use bankruptcy to correct the perceived misdeeds of their predecessors, while longer-serving councils rightly view the choice as the equivalent of political suicide. In the case of outright insolvency, observed in so very few instances, it is difficult to parse a home-price boom’s exuberance in the midst of other contributing factors.
The city bankrupts we address made their decisions in rather similar circumstances: rising labor and pension costs, austerity measures which failed to stem losses, missed opportunities to avert disaster, and seeking federal protection from creditors as best among a set of bad, difficult options. That said, much can be learned by looking closely at a bankruptcy like San Bernardino’s, and then contrasting its story with those of its fellow insolvents further to the north.1
2. The San Bernardino Bankruptcy, 2012-2017
San Bernardino, a city located in the sprawling county of the same name, sits about sixty-five miles west of Los Angeles. The population of about 210,000 (2010) is approximately sixty percent Latino. San Bernardino serves as the county seat in a region which witnessed substantial
1 We develop our case-study report relying mostly upon contemporaneous news reports and the expert analyses of bankruptcy commentators. We also draw upon public city financial records.

4
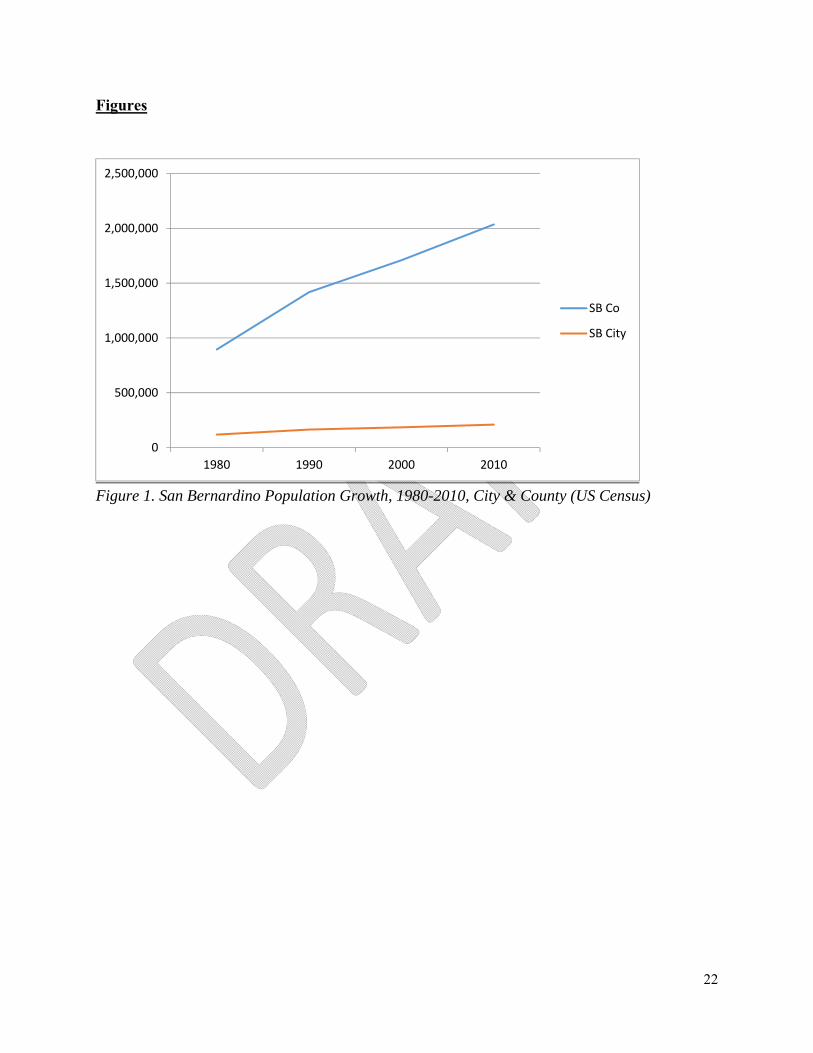
growth during the mid-2000s boom. The county grew from a population of 1.71 million in the 2000 census to some 2.04 million by 2010 (an increase of 15%).
Those who traverse the vast urban expanse of Los Angeles County, moving to the east, from its Pacific shoreline to its eastern boundary, know that arriving in San Bernardino and the Inland Empire marks the outer edge of the Southland metropolitan basin. As one continues eastward, the next major geographic division one reaches is the State of Arizona. Beyond the City of San Bernardino and its environs some small agglomerations of population remain, like Barstow, but the county’s landscape gradually turns to wide open spaces, not particularly arable, mostly scrub and desert.
San Bernardino itself is rather verdant, or at least once was. The fields where orange groves thrived in great numbers occupied the mostly dry bed of the Santa Ana River. Acres of grove-lands rose into the foothills tucked up against the San Bernardino Mountains.
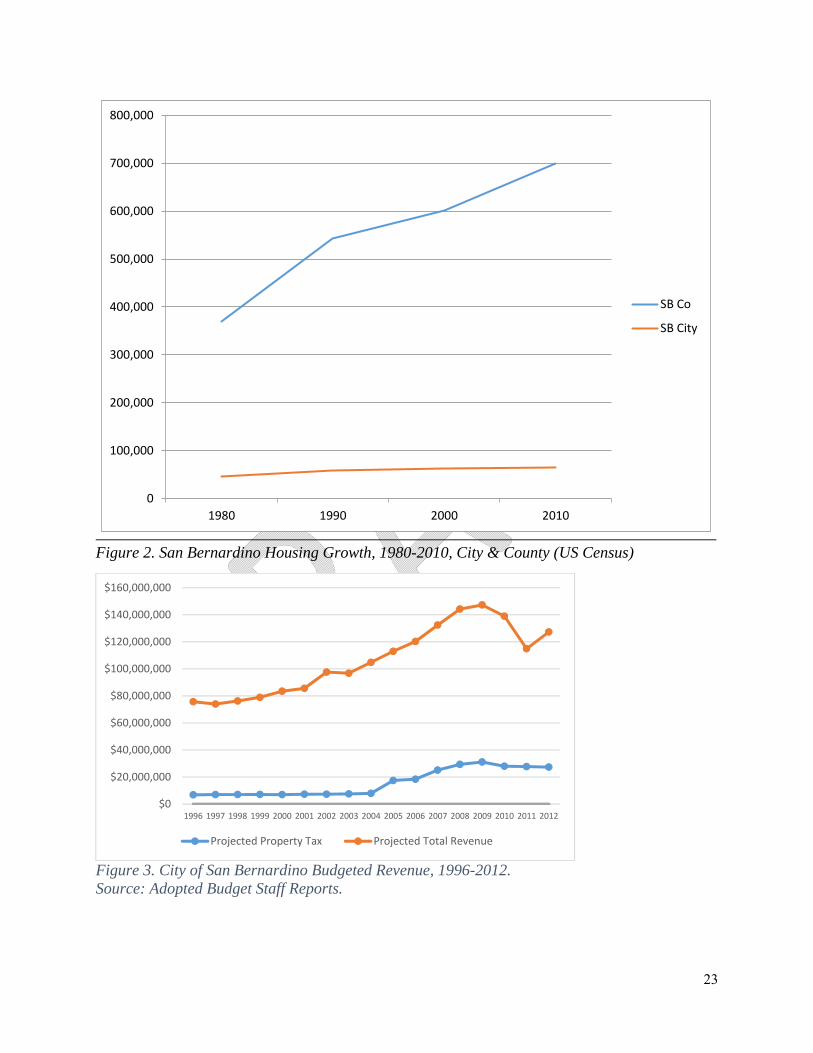
But most of those groves have given way to sprawling suburban development. The city’s growth during the 2000s loosely tracked the county’s, witnessing an eleven percent increase in its population over that same period. Figure 1 shows that comparison in terms of population, while Figure 2 shows the comparative thirty-year county-city growth in housing units (1980-2010). Overall growth in housing units countywide, driven by the suburban boom in the Southland generally and the completion of the Foothill Freeway extension (Interstate 210), nearly doubled the stock during that period. Despite its location at the far edge of the regional commuteshed, the city’s housing stock registered a lower but still quite healthy boost in its housing stock, an increase of nearly forty percent. This growth occurred despite the fact that nearly one-third of San Bernardino’s population now finds itself in poverty, and that level has steadily increased for a generation.
The longer history of the San Bernardino’s economic travails might point toward two focal events. First, Kaiser Steel’s disastrously expensive plant failure in the early 1980s, in nearby Fontana, exemplified the immense shift of global steel production to Asia (Mydans, 1994). Losses in regional employment were calamitous. Second, the US military’s 1994 closure of Norton Air Force Base, located just two miles east of San Bernardino’s central business district, was another body blow which prefigured the 2012 bankruptcy petition.
Perhaps a more strategically run city, with a soundly designed city government and conciliatory politics, may have withstood these events. San Bernardino is decidedly not one such city.
Beyond these anchors in manufacture and the armed forces, the city’s onetime status as a solid blue-collar inland city lay in its heritage for trucking and rail business. The city was known as a hub for transport from the Los Angeles industrial and import basin to the rest of the country heading east and north. The Santa Fe Depot, a national historic landmark treasured for its mission-revival architecture, was a symbol of the city’s pride as a through-stop for people and freight. But the completion of Interstate 15 (1968-1992) sidetracked much of the traffic through town, and the arrival of mini-hubs around the Southland region sopped up a lot of the city’s core transportation business.

5
Reeling from the departure of these economic mainstays, San Bernardino failed to redeploy its workers efficiently toward new industries, especially after big steel and the military pulled up stakes. The city’s geographic advantages remain, at least in theory. Its investments moving through and beyond the bankruptcy – including the ongoing conversion of Norton into the San Bernardino International Airport – have the veneer of sound strategy (Fallows, 2014).
But the very fact of the bankruptcy means most opportunities for genuine reemergence economically were fumbled, again and again. The devastating loss of economic independence and self-sufficiency frustrated the city’s longer-range prospects. Stagnating incomes, shrinking employment, political disengagement among voters (Hagen, 2014b), and rising crime and poverty (Barragan, 2014) reduced San Bernardino to a shell of its former self. It ranked as the sixteenth most dangerous city in the United States in 2004 (and eighteenth the next year). As the rest of the region was enjoying an unprecedented real estate boom, gang hostilities in San Bernardino led to some sixty homicides in 2005. Getting the streets back under control eclipsed pedestrian matters (like fiscal planning and discipline) in the public debate (Nelson and Hagen, 2012).
Tourists from around the country still flock to the location of the original McDonald’s Restaurant and its kitschy museum on E Street. But what they are greeted with when they venture elsewhere around town bears little resemblance to the place where that behemoth fast-food chain was founded.
Regional fundamentals were already suffering, and the city’s fortunes were already in a downward spiral, when the subprime mortgage crisis hit. Longtime owners in San Bernardino and neighboring cities had struggled to keep their homes as the Inland Empire’s employment growth remained sluggish. Homebuilding during the boom had focused in the near-commute cities in the eastern county, due to relatively low land prices. That and other factors made San Bernardino’s households especially susceptible to the lure of distortive, high-risk adjustable-rate purchase-money lending and refinancings. At the apex of the crisis the Inland Empire’s ranked among the highest metropolitan foreclosure rates, reaching eight percent of all owner-occupied households for 2008 (behind only Stockton and Las Vegas) (Christie, 2009).
We turn to some of the city’s fiscal realities. As in the past, our inquiry focuses essentially on the role of changing property values relative to the city’s balance sheet. In California, Proposition 13 tends to stabilize property-tax revenue expectations over time, and this feature ballasts the kinds of exuberance-driven volatility we might expect elsewhere. But in San Bernardino, where the subprime-mortgage economy’s impacts were felt so severely, the city’s projected ad valorem revenue showed some marked irregularities in the years leading up to the bankruptcy.
One way to demonstrate the perceptual shift, and perhaps San Bernardino’s inclination toward greater risk-taking fiscally, is the trend in coming-year property-tax revenues stated in adopted city budgets. The raw level of projected collections is one thing, the corresponding proportion of overall revenue quite another. As shown in Figure 3, property-based revenue consistently fell in the $6.5-to-$8.0 million range from FY96 through FY04. During that time, due to sales tax growth and other factors, budgeted property tax as a proportion of total revenue projected overall actually fell, from nine percent to just over 7.5 percent.

6
This all changed in FY05, when ad valorem revenue projections suddenly more than doubled year-over year, reaching over 15% of total budgeted revenue. Even in the middle of the foreclosure crisis and leading through the FY12 bankruptcy-year budget, the property tax budget reached an unhealthy percentage of general-fund spending authority (peaking in FY09 at more than $31 million and over twenty-one percent of total revenue). We cannot conclude that this reflects exuberance per se, or that budgeteers’ state of mind verged on excessive optimism or risk-taking. But it stands to reason that allowing the city fisc to become overly dependent on volatile sources – especially when debts from prior commitments are already onerous – may be improvident.
Figure 4 indicates that the city’s growth in home values roughly tracked that shown in the countywide sales index. Values in the city led to the market peak during the summer of 2006, and then rapidly descended toward the post-crisis trough in late 2009. Though roughly tracking county-city differences in raw-dollar terms, price levels were consistently below the countywide averages, meaning that the proportional peak-to-trough decrease in taxable value (adjusted only at time-of-sale under Proposition 13) was greater for the city. More importantly, perhaps, the plunge in value was more pronounced within San Bernardino itself, perhaps owing to the rapidly deteriorating set of civic and quality-of-life indicators.
The immediate impetus for San Bernardino’s bankruptcy filing arose from litigation against the city (Hagen, 2013a). The case involved the consolidated claims of three men shot to death by the San Bernardino police. The city had entered into a settlement with each family, and its total exposure on the agreed-upon judgment reached $1.8 million. After the city paid out about fifteen percent of the amount owed, the men’s attorney in August 2012 moved to collect the remaining $1.4 million San Bernardino had agreed to pay. But by then the victims’ families’ counsel was not the only lawyer threatening to seize the city’s assets. The city was out of cash and could not both pay the settlement amount and make payroll and other bills then due. An emergency petition to freeze all creditor actions was filed by the city under state law.
The liabilities precipitating the city’s immediate action were but symptoms of its financial predicament. Throughout the bankruptcy proceeding, the San Bernardino Public Employees Association, among other creditors and real parties in interest, described a long-running state of financial mismanagement and uninformed political leadership.
The pension disputes in San Bernardino were complicated by the role of pension fund managers and affiliated bondholders. San Bernardino does not participate in Social Security, and this fact heightens the stakes. CalPERS, the statewide administrator of numerous local pension systems and the city’s largest creditor in the bankruptcy, was a vocal opponent of the bankruptcy in its early stages, arguing against federal bankruptcy relief due to the city’s financial mismanagement and irresponsibility. And CalPERS had good reason to complain: once in bankruptcy the city took the abrupt and rather unprecedented action of canceling all payments to the plan. The arrearage for ’12-’13 alone grew to $13.5 million.
As early as 2007 the city made some changes to its internal structure; these procedural revisions were aimed at empowering city managers and weakening the day-to-day command of elected officials. Later that year San Bernardino’s management auditors had alerted city leaders to the
7
dangers of its continuing deficits in the absence of sterner governance and upgrades in its bookkeeping. Auditors observed that existing systems, even after restructuring, were far from robust enough to ensure financial sustainability (Newfarmer et al., 2007).
At the time of critical decisions concerning long-run liabilities in the mid-2000s, members of the city council were essentially uncompensated, save for a minimal stipend towards expenses and allowances for transportation. This is not that unusual in cities of similar size. But San Bernardino’s leadership had already been roundly derided as part of a dysfunctional system, denominated by one commentator as neither “strong mayor” nor “strong city manager” but instead “strong nobody” (Fallows, 2015a). They were privy to a steady drumbeat of fiscal warnings and doomsday predictions, but austerity measures which arguably might have reduced the probability of an eventual Chapter 9 bankruptcy never bore serious consideration.
Instead, the city continually hosted far more than its fair share of infighting and division (Weinberg, 2012). And the byzantine city charter guiding its descent into bankruptcy seems in retrospect to be a study in hogtying decisionmaking rather than facilitating it. Staff leads were appointed by the political body but had to report to the city manager, or vice versa. That kind of systematic indirection and entanglement takes its toll, and apparently that professional environment was an increasingly unpleasant place to work. Right at the time the city was desperate for stable, responsible leadership, it alienated more policy professionals than it could retain. From 2004 and 2014 alone, San Bernardino watched five city managers, five police chiefs, four finance directors and five public works directors come and go (Farmer, 2016).
The city’s political leadership was attacked in the media for letting residents down. The city attorney and a longtime member of the city council lost in a recall election (Rojas, 2013). Reflecting the sharp political rancor of the time, that city attorney had alleged during the runup to bankruptcy that thirteen of the city’s prior sixteen budgets had been falsified (Hagen, 2012a), a controversial claim which apparently was never proven, nor retracted (Reid, Podkul, and McNeill, 2012). Despite his popularity throughout the city, two-term-Mayor Pat Morris left office in February 2014 under the pall of the ongoing bankruptcy proceeding, replaced by political newcomer and current mayor Carey Davis.
By that time, US Bankruptcy Judge Meredith Jury ruled, over numerous creditors’ objections, that the city was legally eligible to submit its petition for bankruptcy protection. That ruling alone took up a year of the case, and was appealed to the Ninth Circuit by CalPERS. The city ultimately settled that interlocutory appeal with the pension giant, guaranteeing full repayment of its arrearages along with a $2 million penalty. It was a turning point for the bankruptcy; CalPERS’s threat to cancel the pension-plan contract in its entirety brought the city back to its senses. Later disclosures confirmed the city believed it risked across-the-board resignations from its police and fire departments if it had tried to cut pensions too drastically in the bankruptcy. Competition for experienced first-responders was intense throughout Southern California at the time, and in the end it was the city that “blinked” to end a bitter standoff.
To many observers, San Bernardino’s overall treatment of its workforce relative to retirement benefits up to and into the recession remained quite generous, despite the disquieting flow of red ink on the city’s balance sheet. Yet suggestions of sweetheart deals between unionists and local officials risked ignoring another critical ingredient in the mix, already referenced above:
8
historically high crime rates for violent and property-based offenses, as well as increases in gang activity. These harsh realities drove residents’ demands for steep public-safety investments at any cost (Barragan, 2014).
It is difficult in retrospect to point at one pivotal budget where the first-responder pension-benefits were increased inordinately. There is a case to be made that increases were sustained incrementally for nearly a decade, from 1999 through 2007 (Hagen, 2013b). What is more, there is reason to believe that city officials had been paying themselves more than their peers in similarly situated cities as well (Edwards, 2012). In actuality, management and organized labor shared a taste for the city’s undisciplined spending.
The assessment whether a locality is overconsuming fire and police services relative to what it can afford is particularly salient in San Bernardino. For generations prior to the bankruptcy, a city-charter provision had mandated that police and firefighters be paid the average of salaries in ten other like-sized cities (population from 100,000 to 250,000). Most comparison cities were in a far better position fiscally to pay those salaries, however. A citizen commission formed following the bankruptcy; one of its early recommendations was that mandatory-averaging provision for police/fire pay-grades be repealed, in favor of periodic, evenhanded collective bargaining. The unions and then the voters balked at first, but the reform eventually proceeded (Nelson and Hagen, 2016).
In retrospect, it seems that leaders backing that charter revision likely worried that the pending bankruptcy debt-adjustment plan – delivered in 2016 and finalized in early 2017 - would be rejected by the court had something not been done. Final approval of the city’s financial restructuring plan cleared the way for the city’s exit from bankrupt status and resumption of normal operations. Mayor Davis and the city council undertook a series of measures to stabilize the city’s finance and undo the political damage suffered during the long bankruptcy court proceeding.
A strong argument can be made that San Bernardino’s troubles were as much the result of governance failures as financial and economic ones. The citizens committee exploring charter changes, government restructuring, improved division management and accounting, and other measures completed its work late in the bankruptcy. It surveyed the charters of other California cities of San Bernardino’s scale and also weighed advice received from the National Civic League. The result is a new and greatly improved charter, approved in 2016, running a sleek eleven pages and installing a streamlined, traditional council-manager form of government. The city manager is now the chief administrator with full authority, reporting to the council as a whole, led by the mayor. The clerk and city attorney are now hired, not elected. And labyrinthine administrative systems which had paralyzed even the simplest decisions have largely been abandoned (Farmer, 2016).
The budgetary and fiscal strategy San Bernardino used to finally depart bankruptcy in 2017, after a nearly unprecedented four years and ten months in languishing in Chapter 9 status, paralleled strategies seen in California’s other bankruptcies. The most politically sensitive budget feature – public pensions for new and current employees – was largely sheltered from the most substantial reductions. Instead, the plan approved by the court targeted the bulk of its savings in the areas of

9
bond service and retiree health care, buttressed by tax enhancements and a delayed and gradual schedule for restoration of city services.
Prior to the bankruptcy about seventy-five percent of San Bernardino’s general fund expenditures was dedicated to the police and fire departments. As part of the grand scheme of adjustment ending the Chapter 9 proceeding, the city and its fire operations were annexed into the county’s, and city parcels were hit with a new $143 per annum tax to pay for that county service. However, the city’s property-based revenue expectations needed to be adjusted downwards, commensurately. The fire department’s workforce was transferred to the county’s retirement system without affecting benefits. (Mendel, 2016). In a sense this move in bankruptcy reduced the city’s overall financial scheme and likewise removed some of its cash-flow cushion. Property tax revenue was reduced by over one-third (about $18 million less), pursuant to the off-loading of fire operations to the county. At the same time, the city freed itself of over $30 million in fire-safety related expenditures.
The city’s plans moving through the final stages of bankruptcy during FY17 were to stabilize the quality and independence of the financial team. This latest year’s budget achieved fiscal balance, and city officials with whom we spoke generally indicated a return overall to sound practice, now more proactive than reactive. San Bernardino’s emergence from bankruptcy likewise improved its potential to attract and retain the experienced staffing in expert leadership the city needs, in financial planning, budgeting, and projections of revenue and expenditures. Throughout the recession and bankruptcy, turnover in critical roles had been quite high, not just at the top but at the intermediary management levels as well. Many observers see a direct connection between the staffing conditions inside local government and its capacity to meet complicated economic challenges and decision-making burdens.
3. Viewing San Bernardino’s, In Light Of The Stockton & Vallejo Bankruptcies
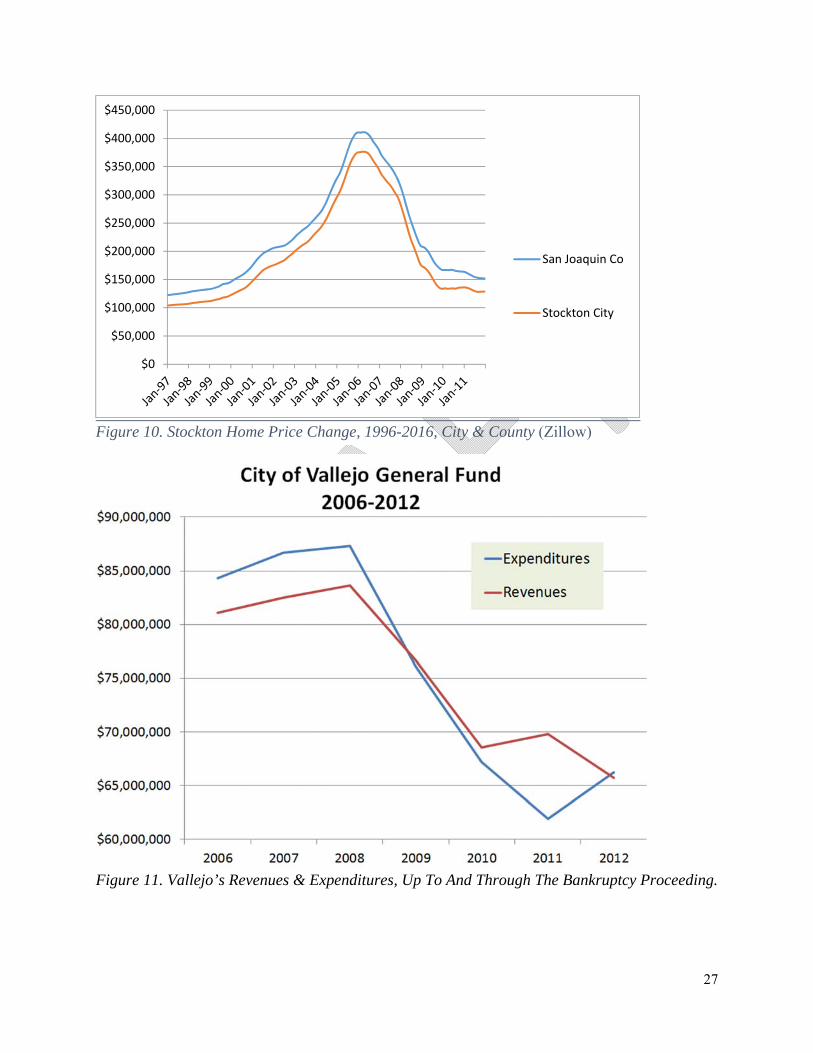
We now briefly juxtapose the story just framed with some brief detail on two other California bankruptcies, Vallejo’s and Stockton’s. Figures 5 through 10 show those two places’ population and housing unit growth relative to their county’s. In each case their more prominent share of county population, along with the lack of commute-oriented features similar to San Bernardino, drove growth in their subregions to a greater extent. For related reasons, housing price indexes trace a more similar path for each of these formerly bankrupt cities within their respective county settings. That said, a key point of distinction lies in the timing and steepness of the bottoming-out of the market. In Stockton and San Bernardino, the low-point of the trough occurred during 2009-2010, while the freefall in Vallejo home-prices took another two full years to wind down. The most immediate reason for Vallejo’s extended real estate troubles would seem to be the bankruptcy itself, which was filed into the teeth of the gathering economic crisis in 2008. Likewise remarkable the more sudden decrease in San Bernardino’s index, perhaps indicating the broader regional impacts and the accompanying shocks to the system.
While we are unable to flesh out its impacts in this report, we cannot help but wonder whether the timing of California’s elimination of redevelopment agencies (RDAs) provides an additional point of distinction here. Vallejo’s bankruptcy was essentially complete by the time the state

10
supreme court upheld Governor Jerry Brown’s dissolution of local RDAs statewide in late 2011. Thereafter, San Bernardino and Stockton could not help but feel an added measure of fiscal pressure as they contemplated their bankruptcy decisions the following summer. While RDAs kept their own books separate from their cities’ general funds, the interoperability of those accounts as a practical matter was quite a poorly kept secret wherever redevelopment finance was being practiced around the state. In the case of Stockton in particular, the run-up in home prices and property- and sales-tax revenues was followed in short order by a series of major capital-project commitments with bond issuances, including the Philomathean rehabilitation, the downtown, a major waterfront development, and renovation of the Hotel Stockton. Even if the RDA’s tax-increment revenue was what most immediately secured those bonds, the city’s credit rating would no doubt be affected if market fundamentals suddenly shifted. And it was.
Vallejo
Vallejo is a naval port city located in Solano County, one of ten counties that make up the San Francisco-Oakland-San Jose metroplex. With a current population of over 120,000, Vallejo is the Solano County seat and 50th largest of California's 481 cities. Located about thirty miles northeast of San Francisco and fifty miles southwest of Sacramento, Vallejo sits at the confluence of three major rivers - the Sacramento, the Napa, and the San Joaquin – all of which flow into the San Francisco Bay system within the city’s borders. Vallejo is a strikingly diverse racially (Raskin-Zrihen, R., 2013), and a largely middle-income and blue-collar city. Real estate values are and have been moderate, if not depressed, relative to cities elsewhere in the affluent San Francisco Bay region.
For a brief time right after California’s statehood, Vallejo served as the state’s capitol. Its well-protected deepwater inland-bayside location made it prime territory for US Navy operations. The Navy’s Mare Island port and shipyard operations provided an economic and financial anchor almost from the city’s inception. At its height during World War II the base employed more than forty thousand workers and it remained a key economic and sociocultural city asset even during the peacetime boom. However, because facilities were never satisfactorily upgraded to sustain the base’s leadership in naval manufacture and operations nationally, Mare Island landed on the base closure list in the early 1990s and was ultimately decommissioned in 1996. Many communities around the country have absorbed deep financial hits as military facilities and employment have been downsized. Like in San Bernardino after the Norton Air Force Base closure, in Vallejo the results were devastating. To provide a sense of how Vallejo arrived at that moment, and its ultimate consequences, Figure 11 traces city revenues and expenditures from 2006 through the bankruptcy, and Figure 12 depicts just how expensive legal costs associated with Chapter 9 proceedings can be in relative terms (more than $12 million in attorney fees).
When, in 2008, Vallejo became the largest city in California ever to declare Chapter 9 municipal bankruptcy, the Mare Island closure was blamed as a disastrous fiscal wound from which the city
11
never quite recovered. But bankruptcy experts and observers of the urban fiscal scene agreed there was no single cause for the calamity.2 Job loss and disinvestment from the base closure were compounded by the twin disasters of the dot-com bust and the Great Recession.
The city’s bankruptcy petition and reorganization plan cited a number of other precipitating events as well. The city likely over-borrowed to construct and modernize major facilities like its city hall, library, and police and fire stations. Prior to the doomsday budget year of 2007-2008, the city lost two major business establishments when the Walmart in town closed and the owner of the Six Flags/Marine World amusement park exercised its option to buy out the city’s ownership interest. The park’s removal from the city’s portfolio terminated the revenue-sharing arrangement that had long helped cushion the city’s bottom line. With the recession came a slump in revenues from property and sales taxes, as well as motor vehicle licensing, real estate transfers, development project fees, and other assessments.
Attempting to avert insolvency, the city reduced its workforce as drastically as it could under existing collective bargaining agreements. It decreased or eliminated nonessential services, cut hours and staffing at facilities (e.g., the senior center, the library, and parks systems), and increasingly deferred infrastructure upkeep (like street maintenance and city-fleet vehicles repair and replacement). Vallejo’s extensive mediation efforts with its police, fire, municipal staff, and managerial unions failed to forge long-term revisions in wage and benefit agreements made during better financial times.
As the fiscal year wound down in the spring of 2008, Vallejo’s city council faced financial disaster. The city’s general-fund reserves were spent down to zero, and it already had cancelled nearly all non-departmental funding. Fleet replacement for police cruisers had been reduced to levels well below the minimum needed. Street and sidewalk maintenance relied on adhesive patch-jobs rather than real repairs, and drivers, bicyclists, and even pedestrians were the ones suffering. Amenities citizens in healthy cities take for granted already had been in a state of marked decline, so the city’s fiscal-management problems struck residents as just the latest news of civic misfortune, salt was rubbed in existing wounds. The city council was informed in the spring that it would not be able to make payroll starting sometime in the summer.
In the budget proposed for 2008-2009 the earlier, severely restricted diet of expenditures became the fiscal equivalent of an all-out hunger strike. Continuing its austerity approach initiated starting once the red ink began to collect, Vallejo laid off more General Fund employees, reaching a total of 87 full-time positions eliminated. Completely zeroed out from prior years’
2 But many Vallejo observers have theories regarding the immediate drivers of its collapse. Renowned journalist and author Michael Lewis, himself a resident of nearby Berkeley, noted in the Vallejo section of his November 2011 Vanity Fair piece entitled “California and Bust” that “[e]ighty percent of the city’s budget—and the lion’s share of the claims that had thrown it into bankruptcy—were wrapped up in the pay and benefits of public-safety workers.”
12
levels were the city’s annual contribution to the county library system (it had been $403,200 annually) and the parks and recreation district ($270,500).3 Gone also were traditional community-based grants to important civic and public-service institutions: the convention bureau (which had already been cut to $67,500 from a high of $375,000), the city symphony and its annual 4th of July pops concert ($15,700), the naval history museum ($21,140), the senior center ($47,880), and the police athletic league ($13,200). The city met maintenance-of-effort levels for payments to its meals-on-wheels program ($16,800) but local hunger conditions would only worsen during the recession and the slow, sluggish recovery. Economic distress also seems to exacerbate abandoned and feral animal challenges, so despite austerity and then bankruptcy, the city somehow managed to keep up its contractual obligations to the humane society ($330,900) and the county’s animal shelter ($400,000).
The city’s budgets before and during the bankruptcy essentially zeroed out much of its community-based spending. The bottoming of these expenditures is summarized in Figure 13 drawn from published city budgets. The ruination of the social budget had predictable effects on quality of life, neighborhood morale, and the doomsday mood in the city’s civil-society organizational sector. The city’s later experimentation with “participatory budgeting” represented a push by newly resolute civic and political leaders, assisted by external process experts, to ignite a community-based restoration of the quality-of-life spending which got decimated during the bankruptcy.
Even with such draconian cuts Vallejo faced an insoluble deficit of more than $16 million for FY09. All options for closing the gap seemingly had been exhausted. Legally that negative-budget meant none of its special funds – bus system, redevelopment moneys, closed military base buyout from the federal government, or even municipal golf courses – could be tapped. While observers agree that no single financial shock drove the city to the brink it did not help the situation when, in February 2008, a number of police officers and firefighters suddenly retired. The unbudgeted pay-outs to these retirees totaled approximately $3.4 million, perhaps ballooned in part by generous techniques for calibrating accrued sick-leave and vacation in the applicable formulas.
On May 6, 2008, the city council voted unanimously to pursue Ch.9 bankruptcy protection. Its bankruptcy petition was filed in federal court in Sacramento on May 23, 2008. Its insolvency and other prerequisites were contested by creditors, but the City prevailed in the bankruptcy court on these matters and on appeal. After an exhaustive process crafting its plan reorganizing its debt
3Budget documents for recent years are maintained on the city’s website by its finance department. It is important to note that, while transfers to them had to be discontinued, Solano County (Vallejo’s library-operator) and the Greater Vallejo Recreation District enjoy their own power to collect property-based revenues. However, as the mortgage meltdown intensified and the regional and global financial crises took hold, these proceeds became strained in a fashion similar to the city’s. It is also important to consider the complexities of local school finance in Vallejo and California, but these lie considerably beyond the scope of this report.
13
and charting a path toward sustainable fiscal balance, Vallejo approved its plan and bankruptcy discharge in August 2011. The city formally emerged from bankruptcy three months later. The financial losses for creditors were formidable, as was the long-term damage done to Vallejo’s credit rating. It was considered a sad but no less substantial gain in March 2013 when Standard & Poors upgraded the city’s bond rating from an execrable C to a still lamentable CCC+ (York, 2013). One factor S&P noted as a positive for the city: its voters’ narrow approval of a new sales tax, Measure B.
Prior to emerging from bankruptcy, the city recognized continuing cash needs for operations and stabilization. In July 2011 the city council voted to place a one-cent transactions and use tax on the November 2011 local ballot. Because a city cannot offer judicial bodies firm political promises based on decisions ultimately left to the voters, this potential revenue was not included in the “Five-Year General Fund Business Plan,” presented to the bankruptcy court to evidence Vallejo’s readiness to emerge from bankruptcy. However, the city’s brief in support of the business plan’s approval offered the planned Measure B sales tax initiative to show that, amid continuing regional economic distress and sluggish revenues, the city remained on track to fulfill the vision of its stabilization plan. It is likely the court welcomed the step to enhance revenues.
The city attorney’s analysis of the new tax informed voters that revenues could be used toward “general purposes” and enumerated a variety of examples.4 “The money from this tax would be deposited into the city’s general fund and could be used for any general city purpose, including 9-1-1 response, police patrols, firefighter and paramedic services, youth and senior services, street and pothole repairs, graffiti removal, economic development, and other general city services.” Importantly, the City reserved the right to expend the new funds on any legitimate purpose, including to enhance public participation in deciding how those added revenues would be allocated. Measure B proponents, including the Mayor, argued for the proposed sales tax: “It is time for us to come together and invest in our future. If you want to rebuild Public Safety, Economic Development, Quality of Life Services and Repair our Deteriorating Infrastructure, we urge you to join us in Voting Yes on Measure B.” In a sense, they argued, the revenue would be free money; a 1% state levee was expiring, and enacting Measure B would leave the overall rate unchanged but divert the one-percent increment to the city itself, in a sense returning it from Sacramento.
4 This discussion draws upon Measure B ballot materials provided by Vallejo city staff. See also Ballotpedia’s resource page for the initiative: http://ballotpedia.org/City_of_Vallejo_Sales_Tax,_Measure_B_%28November_2011%29.

14
Stockton
Stockton’s bankruptcy has been characterized as among the largest in US history.5 Known as the central-valley epicenter of mortgage-crisis foreclosures, the city draws upon the metropolitan economies of both Sacramento and the Bay Area, and might be considered to be within the regional commute-radius of the former. An inland port located on the San Joaquin River, with access to the delta waters of the San Francisco Bay estuarine system and the Sacramento River headwaters, Stockton is first and foremost a gold-rush town. It originally found its modern commercial footing as a supply hub for mining operations throughout the nearby Sierra Nevada foothills. Into the modern era the city’s port has served as a major export-node for inland agriculture and manufacture.
The city’s descent into bankruptcy offers, for purposes of the current study, a revisiting of common themes. Stockton’s growth prospects during the dot-com boom and recovery, into the go-go mid-2000s, loomed quite bright indeed. Real estate values increased on par with the Bay Area’s and Sacramento’s, while remaining affordable for younger families in relative terms. The fundamentals of the city’s economy appeared strong and sustainable. Some observers characterize the mood of Stockton’s political officials and business leaders as “unbounded optimism” (Evans, Kosenko, and Polyakov, 2012:2), highlighting a series of ill-fated decisions grounded upon an exuberant outlook. But Stockton’s city manager, Bob Deis, in a Wall Street Journal op-ed just after the bankruptcy petition was filed, instead decried the punishing recession. Property values fell seventy percent, Deis argued, unemployment reached 22%, and household incomes struggled to recover from levels twenty percent less than the state average (Deis, 2012). Acknowledging that debt service had increase sixfold in just five years, Deis admitted the impact of excessive optimism, in terms of revenues overall: “[D]ebt had been ‘back-loaded’ on the mistaken assumption that revenues would increase over time—a risky fiscal structure, but one the financial markets blessed as they extended credit to the city.”
The San Bernardino/Vallejo backdrop anticipates this conundrum of finger-pointing. Creditors assail the borrowing decision, while the debtor-city indicts those creditors for being enablers. Stockton’s very poorly timed 2007 bond offering was intended to lower pension costs. The greatest driver in that analysis was not pension salary-benefit but, rather, the increase in projected health-care cost. But by 2012 that bond issuance was underperforming dreadfully, and the projected proportional increases in debt service over time only accelerated the city’s trip to bankruptcy court.
When it comes to the employee-benefits side of the bankruptcy blame-game, Stockton’s difficulties also illustrate an important lesson in the politics of administrative growth: it is far
5 This observation and the brief report on Stockton’s bankruptcy which follows, draws substantially upon Evans, Kosenko, and Polyakov (2012). These authors conducted a thoroughgoing review of budgets, audits, labor agreements, and the like.
15
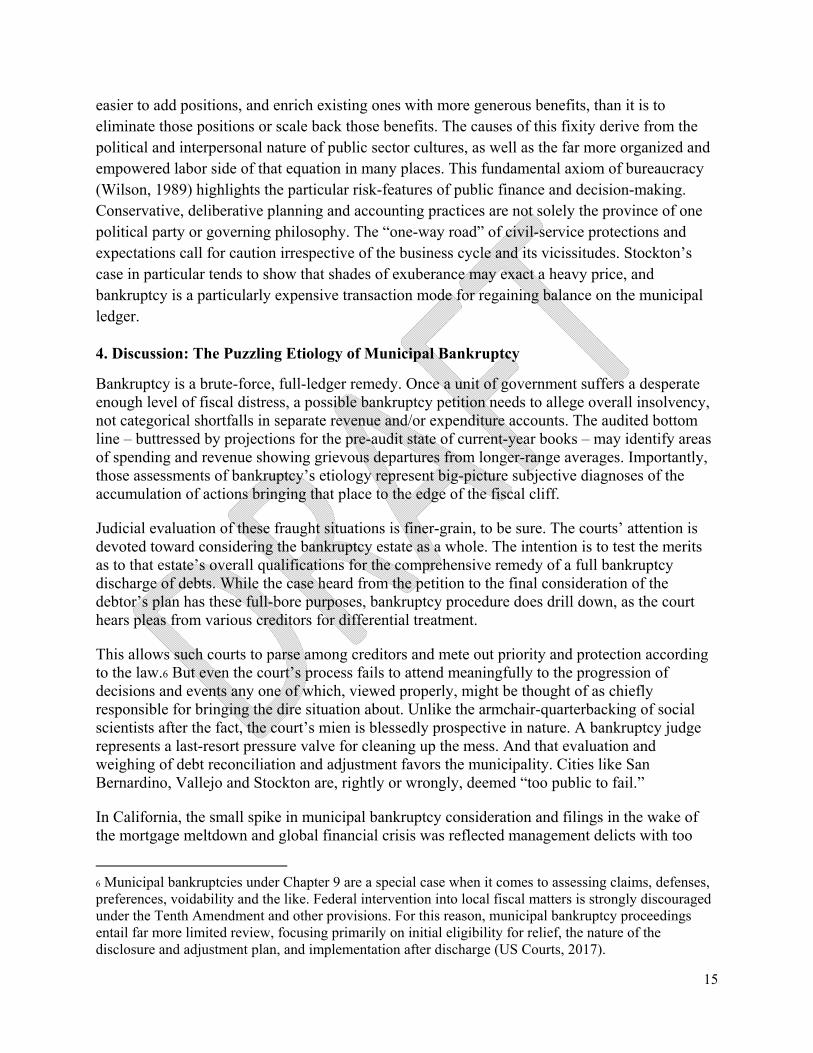
easier to add positions, and enrich existing ones with more generous benefits, than it is to eliminate those positions or scale back those benefits. The causes of this fixity derive from the political and interpersonal nature of public sector cultures, as well as the far more organized and empowered labor side of that equation in many places. This fundamental axiom of bureaucracy (Wilson, 1989) highlights the particular risk-features of public finance and decision-making. Conservative, deliberative planning and accounting practices are not solely the province of one political party or governing philosophy. The “one-way road” of civil-service protections and expectations call for caution irrespective of the business cycle and its vicissitudes. Stockton’s case in particular tends to show that shades of exuberance may exact a heavy price, and bankruptcy is a particularly expensive transaction mode for regaining balance on the municipal ledger.
4. Discussion: The Puzzling Etiology of Municipal Bankruptcy
Bankruptcy is a brute-force, full-ledger remedy. Once a unit of government suffers a desperate enough level of fiscal distress, a possible bankruptcy petition needs to allege overall insolvency, not categorical shortfalls in separate revenue and/or expenditure accounts. The audited bottom line – buttressed by projections for the pre-audit state of current-year books – may identify areas of spending and revenue showing grievous departures from longer-range averages. Importantly, those assessments of bankruptcy’s etiology represent big-picture subjective diagnoses of the accumulation of actions bringing that place to the edge of the fiscal cliff.
Judicial evaluation of these fraught situations is finer-grain, to be sure. The courts’ attention is devoted toward considering the bankruptcy estate as a whole. The intention is to test the merits as to that estate’s overall qualifications for the comprehensive remedy of a full bankruptcy discharge of debts. While the case heard from the petition to the final consideration of the debtor’s plan has these full-bore purposes, bankruptcy procedure does drill down, as the court hears pleas from various creditors for differential treatment.
This allows such courts to parse among creditors and mete out priority and protection according to the law.6 But even the court’s process fails to attend meaningfully to the progression of decisions and events any one of which, viewed properly, might be thought of as chiefly responsible for bringing the dire situation about. Unlike the armchair-quarterbacking of social scientists after the fact, the court’s mien is blessedly prospective in nature. A bankruptcy judge represents a last-resort pressure valve for cleaning up the mess. And that evaluation and weighing of debt reconciliation and adjustment favors the municipality. Cities like San Bernardino, Vallejo and Stockton are, rightly or wrongly, deemed “too public to fail.”
In California, the small spike in municipal bankruptcy consideration and filings in the wake of the mortgage meltdown and global financial crisis was reflected management delicts with too
6 Municipal bankruptcies under Chapter 9 are a special case when it comes to assessing claims, defenses, preferences, voidability and the like. Federal intervention into local fiscal matters is strongly discouraged under the Tenth Amendment and other provisions. For this reason, municipal bankruptcy proceedings entail far more limited review, focusing primarily on initial eligibility for relief, the nature of the disclosure and adjustment plan, and implementation after discharge (US Courts, 2017).
16
many culprits to count meaningfully. It is natural to try aligning the distress with the drastic fluctuations in real estate prices, through the bubble and the collapse. At the very least, the Inland Empire (San Bernardino’s region) and the urban San Joaquin Valley (Stockton’s) were hot-spots of mischief in mortgage lending prior to the downturn. These places were hit by the double whammy of unbridled speculation, followed by steep losses of property value, crippling these regional economies and frustrating their recoveries.
But as observed in Vallejo, sometimes the historical analysis should incorporate more than just the most recent events. There the causal chain likely started with the closure of the Mare Island naval facility. Among the three places we consider in this study, Vallejo is the most readily identifiable as a “company town,” overly dependent on military employment and that of supporting trades and industries. The town’s fiscal management coped with the aftermath for a generation. The wave of base closures in the early 1990s impacted Vallejo, San Bernardino and so many other sites with the ultimate economic-development puzzle: how to quickly redeploy assets and diversify industry and employment sufficiently to avert the worst possible results. It is difficult in these cases to separate 1) longer-term conditions setting the state for fiscal vulnerability, on the one hand, from 2) severe business-cycle events devastating the fisc, on the other. Direct and indirect causes cohere, as do perceptual irregularities like “unbounded optimism,” or exuberance.
Other contributing causes involve statewide conditions. California’s parochial arrangements for its localities, particularly charter cities, involve only lax laissez-faire monitoring of municipal vital signs in Sacramento. The sheer scale of the state and its governance perhaps makes this a necessary evil, and of course local self-determination has its own countervailing advantages. One must factor in the structural impediments, after Proposition 13 and other measures, which have tied the hands of local governments when it comes to new revenue sources and have required plebiscites for added taxation.7 In comparative terms, the state’s traditional support for its work force and the willingness of city financial leaders to offer favorable packages to their unionized workforce involved a kind of largesse with dire consequences once the downturn came. Whether this kind of misjudgment leads to bankruptcy is largely a question of degree – the extent of fiscal overreach, and the severity of the economic shock that follows. As mentioned above, the incidence of bankruptcy, and even the number of instances where it must seriously be considered, in the bigger picture remain extraordinarily rare.
California may also be too tolerant when it comes to the Chapter 9 bankruptcy option and how readily cities can employ it. Under section 109(c) of the US Bankruptcy Codes, the municipality seeking protection must have specific authority under state law, by statute or administrative action, to file a Chapter 9 petition. Traditionally California provided local government direct, unfettered authority to pursue federal relief.
After Vallejo’s case, however, there grew a perception that too many cities suffering during the downturn would use bankruptcy as a negotiating ploy to renegotiate labor contracts and other obligations. Public employee unions and their pension administrators worried that bankruptcy courts would be induced to approve more favorable contract terms than cities might otherwise
7 Special taxes, including many parcel-based taxes, require two-thirds supermajorities in order to proceed, and this likewise affects general obligation bonds (Coleman, 2013).

17
secure via reasoned good-faith bargaining across the table. In response, the legislature enacted AB506 in 2011. Promptly signed by Governor Schwarzenegger, the new law added a 60-day creditor-mediation requirement which otherwise might have diverted cases bound for the bankruptcy court. But municipal lobbyists succeeded in adding an alternative method for satisfying AB506’s bankruptcy-eligibility requirements: a simple declaration of “fiscal emergency.” Such declarations already served a variety of purposes in California, such as paving the way for off-year ballots for special tax increases and evasion of certain labor law requirements. San Bernardino became an early user of the fiscal-emergency path to bankruptcy eligibility (Martinez, 2012). Interestingly, in the wake of the Vallejo, Stockton and San Bernardino bankruptcies and accommodations won by public unions and pensions in those proceedings, Chapter 9 likely appears now, to city councils and city attorneys, as a less attractive option than once thought.8
Note, however, that even the AB506 cooling-off process pales in comparison to sterner state-level techniques for helping to ensure that localities avoid bankruptcy. Emergency state-level administrators and appointed receivers - in a big city like Detroit or a small one like Central Falls, Rhode Island – helped stanch the excesses of local politics and the weakness of local fiscal discipline. In neither of those cases was Chapter 9 avoided, but in those proceedings there was at least some sense that bankruptcy was a true last resort after other measures were exhausted. By contrast, the bankruptcies of San Bernardino, Vallejo, and Stockton, and the attempted proceeding in Mammoth Lakes, occurred essentially in the absence of any state-level policy intervention, separate from that of the pension-administering creditor CalPERS. California’s municipalities enjoy the breadth of their home-rule discretion, to be sure. But they might well consider trading some elements of self-determination in exchange for a more secure system of fiscal backstops to help dampen the worst effects of the business cycle.
Beyond such substantive protections, and procedural nuances, there is reason to believe that Chapter 9 bankruptcy in modern practice results most directly from mismanagement and poor accounting. These shortfalls, in this view, are then revealed most unmistakably when the regional economy hits the skids. After all, despite the grievous widespread deterioration of municipal balance sheets after the downturn, bankruptcy was averted in all but a precious few instances. In the few places where Chapter 9 is truly in play, the resulting process may provide a lively faceoff between heavy-hitting creditors – in San Bernardino, pension beneficiaries, pension funds, and the financiers investing in that space (Reid, 2014) – but it does not provide a ready test for determining which among multiple causes did the most harm.
As we have earlier described, the bankruptcy option represents a distinct policy and legal judgment, driven by idiosyncratic conditions confronting local decisionmakers. As a binary rarely observed, it serves as a relatively poor indicator of variable levels of fiscal distress across the broader economy. In turn, bankruptcy provides a low-power test of its own real causes.
A city like San Bernardino already found itself, during the accelerating real estate boom of the mid-2000s, in an evolving fiscal bind. Its major employment sources had dwindled, yet the real
8 Other states conditioning cities’ filing of Chapter 9 on specific eligibility requirements and and/or prior actions include Connecticut, Florida, Kentucky, Louisiana, Michigan, New Jersey, New York, North Carolina, Ohio, Pennsylvania, and Rhode Island (Spiotto, 2012).
18
cost of a duly trained and high-performance workforce of police and other emergency responders was increasing markedly. When signs of fiscal reluctance and austerity developed politically, pension administrators and their financial partners offered superficially attractive borrowing schemes to ease the pain and push difficult decisions into the future. A key offering of “pension bonds” was undertaken in 2005 to help stem the city’s growing CalPERS arrearages (Reid, Podkul, and McNeill, 2012).
But we exuberance researchers find it hard to ignore its effects on modes of decision-making. It is hard to discern with any confidence, but perhaps the expectation of stable property-based revenue, both residential and commercial, played some small part in the overall psychology surrounding this behavior among finance managers and elected officials during the descent towards bankruptcy. Despite the welter of forces at play, maybe unjustified optimism made city councils easier marks when the purveyors of elegant-sounding bond products came a-calling.
In California especially, fiscal management challenges pose particular risk, in nuanced ways. Local leaders consistently have to navigate the shoals of steady service demands and resistance to tax increases. The resulting tendency in too many California municipalities since Proposition 13 is to utilize non-general fund sources of liquidity. These strategies complicate processes for financial control and oversight. Whether that involves tax-increment financed bond funds prior to the elimination of redevelopment, or revenues from other activities, the challenge is not simply the altered risk portfolio but the impediments to sound bookkeeping practice. Complex transactions imperil financial management and judgment.
And as fiscal peril mounts, desperate measures grow more appealing. San Bernardino’s tactics including the robbing of segregated funds in order to meet general expenditure needs such as payroll and debt service (Hagen, 2012b). To the casual voter, onlooker, and even city council member, this juggling of resources might seem harmless. But the accretion of cross-category borrowing and repayment complicates accounting, budgeting and even auditing. San Bernardino masked its underlying shortfalls repeatedly, hoping to pay back the raided funds once its revenues recovered sufficiently. In 2012 even that technique failed, and bankruptcy proved the only alternative to avoid an avalanche of litigation by its frustrated creditors.
Our case-study cities may have comingled various funds, taken loans to and from various accounts, leveraged themselves excessively, and undertook other questionable activities. In both Stockton and San Bernardino, poor documentation and accounting irregularities likely deprived even the most responsible city leaders the information they would need to make better decisions and remedy the coming troubles more promptly. More likely, the complexity of common transactions and the sorry state of the books prevented those leaders from adequately detecting the threats (Kurtter, 2012).
With the benefit of years gone by and the perspective they bring, commentators are now emphasizing the role of governance, legally and politically, in sidestepping bankruptcy risk moving forward. Reconfiguring how decisions are made – separate from the situational wisdom of various capital expenditures, pension decisions or bond issuances – may well hold the greatest promise for bankruptcy avoidance in the future (Gillette and Skeel, 2016). Recently that has meant an increase in the quality and immediacy of fiscal monitoring at the state level (Maciag,

19
2016). Even to the most parochial of local politicians and administrators, this watchfulness may represent welcome medicine.
References
Barragan, J. 2014. “San Bernardino's Rising Homicide Rate Troubles Cops, Residents.” Los Angeles Times (July 29). Online article (http://www.latimes.com/local/lanow/la-me-ln-san-bernardino-homicides-20140729-story.html). Retrieved November 3, 2016.
Christie, L. 2009. “Foreclosures Up A Record 81% in 2008.” CNN Money (January 15). Online article (http://money.cnn.com/2009/01/15/real_estate/millions_in_foreclosure/). Retrieved March 3, 2017.f
Coleman, M. 2013. “Local Super-Majority Voting Rules and Results.” californiacityfinance.com (February 19).
Edwards, A. 2012. “Pre-Bankruptcy, San Bernardino Offered Lucrative Pay Rates to Top Managers.” San Bernardino Sun (August 18). Online article (http://www.sbsun.com/article/ZZ/20120818/NEWS/120818546). Retrieved October 17, 2016.
Evans, S., B. Kosenko, and M. Polyakov. 2012. “How Stockton Went Bust: A California City's Decade of Policies and the Financial Crisis that Followed.” Special Report (Los Altos, CA: California Common Sense). Online article (http://uscommonsense.org/pdf/12.pdf). Retrieved July 17, 2016.
Deis, B. 2012. “Opinion: A Message From The City That Went Bankrupt.” Wall Street Journal (September 27). Online article (http://www.stocktongov.com/files/WSJ_2012_9_27__A_Message_From_the_City_That_Went_Bankrupt.pdf), retrieved February 27, 2017.
Fallows, J. 2014. “Travel Chronicles, From East to West.” Online article (https://www.theatlantic.com/national/archive/2014/12/travel-chronicles-from-west-to-east/383925/). Retrieved October 4, 2016.
Fallows, J. 2015a. “'Generation Now'—What People Do, When There Seems to Be Nothing to Do.” The Atlantic (April 28). Online article (https://www.theatlantic.com/national/archive/2015/04/generation-nowwhat-people-do-when-there-seems-to-be-nothing-to-do/391571/.) Retrieved October 4, 2016.
Fallows, J. 2015b. “What It’s Like When Your City Goes Broke.” The Atlantic (May 14). Online article (https://www.theatlantic.com/national/archive/2015/05/what-its-like-when-your-city-goes-broke/393221/.) Retrieved October 3, 2016.

20
Farmer, L. 2016. “The Story Behind San Bernardino’s Long Bankruptcy.” Governing (August 25). Online article (http://www.governing.com/topics/finance/gov-story-behind-san-bernardinos-long-bankruptcy.html). Retrieved September 21, 2016.
Gillette, C.P. and D.A. Skeel, Jr. 2016. “Governance Reform and the Judicial Role in Municipal Bankruptcy.” Yale Law Journal 125(5):1150-1237 (March).
Hagen, R. 2012a. “San Bernardino Authorizes Bankruptcy Filing.” San Bernardino Sun (July 10). Online article (http://www.sbsun.com/general-news/20120710/san-bernardino-authorizes-bankruptcy-filing). Retrieved May 5, 2016.
Hagen, R. 2012b. “Finance Director: San Bernardino Borrowing from Restricted Fund.” San Bernardino Sun (July 16). Online article (http://www.sbsun.com/general-news/20120716/finance-director-san-bernardino-borrowing-from-restricted-funds). Retrieved May 5, 2016.
Hagen, R. 2013a. “San Bernardino Bankruptcy Timeline.” San Bernardino Sun (July 27). Online Article (http://www.sbsun.com/article/ZZ/20130727/NEWS/130728914). Retrieved October 3, 2016.
Hagen, R. 2013b. “Blame Game on How San Bernardino Came to File for Bankruptcy.” San Bernardino Sun (July 27). Online article (http://www.sbsun.com/article/ZZ/20130727/NEWS/130728916). Retrieved October 3, 2016.
Hagen, R. 2014. “San Bernardino’s ‘Horrible’ Voter Turnout Considered Starting Point.” San Bernardino Sun (February 5). Online article (http://www.sbsun.com/government-and-politics/20140205/san-bernardinos-horrible-voter-turnout-considered-starting-point). Retrieved September 14, 2016.
Kurtter, R. 2012. “Why Some California Cities Are Choosing Bankruptcy.” Special Comment, Report No. 144470 (August 17).
Maciag, M. 2016. “States Increase Tabs They Keep on Municipalities’ Fiscal Health.” Governing (November). Online article (http://www.governing.com/topics/finance/gov-states-municipalities-financial-monitoring.html). Retrieved February 1, 2017.
Martinez, M. 2012. “San Bernardino City Council Declares Fiscal Emergency, Votes to File Bankruptcy.” CNN (http://www.cnn.com/2012/07/19/us/california-city-bankruptcy).
Mendel, E. 2016. “Why Bankrupt San Bernardino Didn’t Cut Pensions.” Blog post (https://calpensions.com/2016/05/02/why-bankrupt-san-bernardino-didnt-cut-pensions/). Retrieved January 18, 2017.
Mydans, S. 1994. “Steel Mill Is Shadow of What It Once Was.” New York Times (September 6). Archived story (http://www.nytimes.com/1994/09/06/us/steel-mill-is-shadow-of-what-it-once-was.html). Retrieved January 12, 2017.

21
N.A. (no author). 2012. “Raiding Funds Catches Up With Cities (Editorial).” San Bernardino Sun (July 17). Online article (http://www.sbsun.com/article/ZZ/20120717/NEWS/120718439). Retrieved December 4, 2016.
Nelson, J. and Hagen, R. 2016. “San Bernardino City Council Approves New Charter, on One Condition.” San Bernardino Sun (May 16). Retrieved December 3, 2016.
Newfarmer, G.E. 2007. “City of San Bernardino Management Review.” Consultant’s contract report (March) (https://www.ci.san-bernardino.ca.us/civicax/filebank/blobdload.aspx?blobid=3780 ). Retrieved September 28, 2016.
Raskin-Zrihen, R. 2013. “Vallejo is Tops in the Nation in Ethnic Diversity.” Vallejo Times-Herald (July 11). Online article (http://www.timesheraldonline.com/ci_23639711/vallejo-is-tops-nation-ethnic-diversity). Retrieved May 4, 2013.
Reid, T. 2014. “Exclusive: Creditor to Oppose San Bernardino Bankruptcy Plan Favoring Calpers – Source.” Reuters (Dec. 18). http://www.reuters.com/article/us-usa-municipals-sanbernardino-idUSKBN0JX02Q20141219. Retrieved December 17, 2016.
Reid, T., Podkul, C., and McNeill, R. 2012. “Special Report: How A Vicious Circle Of Self-Interest Sank A California City.” Reuters (Nov. 13). http://www.reuters.com/article/us-bernardino-bankrupt-idUSBRE8AC0HP20121113. Retrieved September 29, 2016.
Rojas, R. 2013. “Voters in Bankrupt San Bernardino Recall Several Elected Officials. Los Angeles Times (http://articles.latimes.com/2013/nov/06/local/la-me-ln-city-attorney-councilwoman-recalled-san-bernardino-20131106). Retrieved December 14, 2016.
Spiotto, J.E. 2012. “Primer on Municipal Debt Adjustment (Chapter 9: The Last Resort for Financially Distressed Municipalities).” Chapman & Cutler LLP. Web document (http://blogs.reuters.com/alison-frankel/files/2013/12/chapmanandcutlerchapter9.pdf). Retrieved February 21, 2017.
US Courts. 2017. “Chapter 9 – Bankruptcy Basics.” Administrative Office of the U.S. Courts, online guidance document (http://www.uscourts.gov/services-forms/bankruptcy/bankruptcy-basics/chapter-9-bankruptcy-basics). Retrieved February 9, 2017.
Weinberg, D. 2012. “The Challenge of Governing A Bankrupt City.” Marketplace.org (October 11). Online article (https://www.marketplace.org/2012/10/11/economy/local-budgets/challenge-governing-bankrupt-city). Retrieved December 14, 2016.
Wilson, J.Q. 1989. Bureaucracy: What Governments Do and Why They Do It. New York: Basic Books.
York, J.A. 2013. “Vallejo Sees Credit Rating Rise, Still Faces Fiscal Challenges.” Vallejo Times-Herald (March 12). Online article (http://www.timesheraldonline.com/ci_22770258/vallejo-sees-credit-rating-improvement-still-faces-financial). Retrieved May 4, 2013.
22
Figures
Figure 1. San Bernardino Population Growth, 1980-2010, City & County (US Census)
0
500,000
1,000,000
1,500,000
2,000,000
2,500,000
1980 1990 2000 2010
SB Co
SB City
23
0
100,000
200,000
300,000
400,000
500,000
600,000
700,000
800,000
1980 1990 2000 2010
SB Co
SB City
Figure 2. San Bernardino Housing Growth, 1980-2010, City & County (US Census)
Figure 3. City of San Bernardino Budgeted Revenue, 1996-2012. Source: Adopted Budget Staff Reports.
$0
$20,000,000
$40,000,000
$60,000,000
$80,000,000
$100,000,000
$120,000,000
$140,000,000
$160,000,000
1996 1997 1998 1999 2000 2001 2002 2003 2004 2005 2006 2007 2008 2009 2010 2011 2012
Projected Property Tax Projected Total Revenue

24
Figure 4. San Bernardino Home Price Change, 1996-2012, City & County (Zillow)
Figure 5. Vallejo Population Growth, 1980-2010, City & County (US Census)
$0
$50,000
$100,000
$150,000
$200,000
$250,000
$300,000
$350,000
$400,000
SB Co
SB City
0
50,000
100,000
150,000
200,000
250,000
300,000
350,000
400,000
450,000
1980 1990 2000 2010
SolanoCounty
VallejoCity

25
Figure 6. Vallejo Housing Growth, 1980-2010, City & County (US Census)
Figure 7. Vallejo Home Price Change, 1996-2016, City & County (Zillow)
0
20,000
40,000
60,000
80,000
100,000
120,000
140,000
160,000
180,000
1980 1990 2000 2010
Solano Co
Vallejo City
$0
$100,000
$200,000
$300,000
$400,000
$500,000
$600,000
Solano Co
Vallejo City

26
Figure 8. Stockton Population Growth, 1980-2010, City & County (US Census)
Figure 9. Stockton Housing Growth, 1980-2010, City & County (US Census)
0
50,000
100,000
150,000
200,000
250,000
300,000
350,000
400,000
450,000
1980 1990 2000 2010
San JoaquinCounty
StocktonCity
0
50,000
100,000
150,000
200,000
250,000
1980 1990 2000 2010
San JoaquinCo
StocktonCity
27
Figure 10. Stockton Home Price Change, 1996-2016, City & County (Zillow)
Figure 11. Vallejo’s Revenues & Expenditures, Up To And Through The Bankruptcy Proceeding.
$0
$50,000
$100,000
$150,000
$200,000
$250,000
$300,000
$350,000
$400,000
$450,000
San Joaquin Co
Stockton City

28
Figure 12. The Cost of the Bankruptcy In Vallejo, Relative To Community Service Expenditures.
Figure 13. Many Of Vallejo’s Social-Budget Features, Zeroed Out In Bankruptcy.