Embed Size (px)
Citation preview
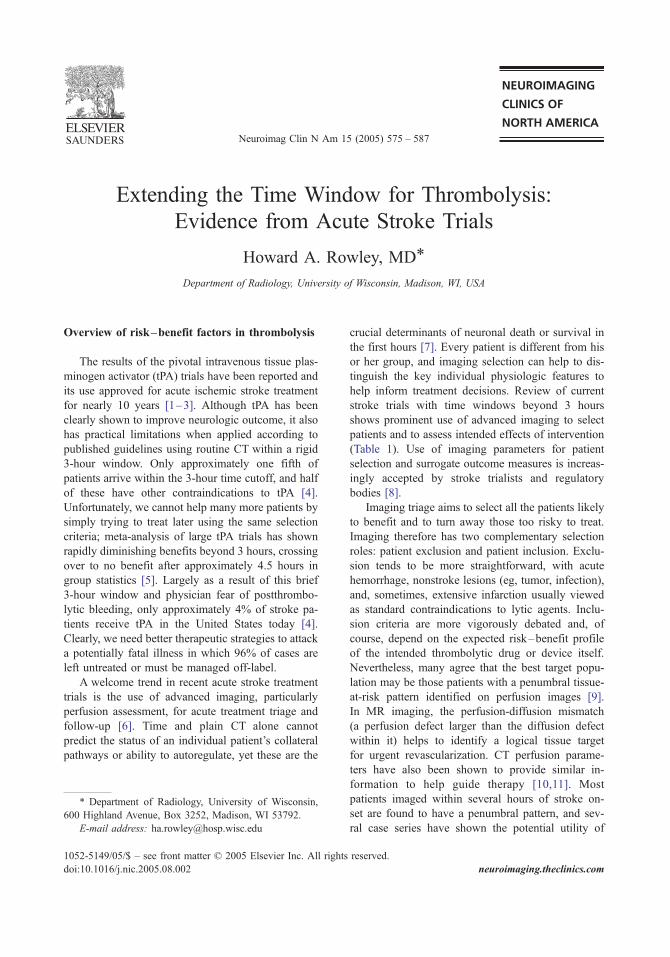
Neuroimag Clin N
Extending the Time Window for Thrombolysis:
Evidence from Acute Stroke Trials
Howard A. Rowley, MDT
Department of Radiology, University of Wisconsin, Madison, WI, USA
Overview of risk–benefit factors in thrombolysis
The results of the pivotal intravenous tissue plas-
minogen activator (tPA) trials have been reported and
its use approved for acute ischemic stroke treatment
for nearly 10 years [1–3]. Although tPA has been
clearly shown to improve neurologic outcome, it also
has practical limitations when applied according to
published guidelines using routine CT within a rigid
3-hour window. Only approximately one fifth of
patients arrive within the 3-hour time cutoff, and half
of these have other contraindications to tPA [4].
Unfortunately, we cannot help many more patients by
simply trying to treat later using the same selection
criteria; meta-analysis of large tPA trials has shown
rapidly diminishing benefits beyond 3 hours, crossing
over to no benefit after approximately 4.5 hours in
group statistics [5]. Largely as a result of this brief
3-hour window and physician fear of postthrombo-
lytic bleeding, only approximately 4% of stroke pa-
tients receive tPA in the United States today [4].
Clearly, we need better therapeutic strategies to attack
a potentially fatal illness in which 96% of cases are
left untreated or must be managed off-label.
A welcome trend in recent acute stroke treatment
trials is the use of advanced imaging, particularly
perfusion assessment, for acute treatment triage and
follow-up [6]. Time and plain CT alone cannot
predict the status of an individual patient’s collateral
pathways or ability to autoregulate, yet these are the
1052-5149/05/$ – see front matter D 2005 Elsevier Inc. All rights
doi:10.1016/j.nic.2005.08.002
T Department of Radiology, University of Wisconsin,
600 Highland Avenue, Box 3252, Madison, WI 53792.
E-mail address: [email protected]
crucial determinants of neuronal death or survival in
the first hours [7]. Every patient is different from his
or her group, and imaging selection can help to dis-
tinguish the key individual physiologic features to
help inform treatment decisions. Review of current
stroke trials with time windows beyond 3 hours
shows prominent use of advanced imaging to select
patients and to assess intended effects of intervention
(Table 1). Use of imaging parameters for patient
selection and surrogate outcome measures is increas-
ingly accepted by stroke trialists and regulatory
bodies [8].
Imaging triage aims to select all the patients likely
to benefit and to turn away those too risky to treat.
Imaging therefore has two complementary selection
roles: patient exclusion and patient inclusion. Exclu-
sion tends to be more straightforward, with acute
hemorrhage, nonstroke lesions (eg, tumor, infection),
and, sometimes, extensive infarction usually viewed
as standard contraindications to lytic agents. Inclu-
sion criteria are more vigorously debated and, of
course, depend on the expected risk–benefit profile
of the intended thrombolytic drug or device itself.
Nevertheless, many agree that the best target popu-
lation may be those patients with a penumbral tissue-
at-risk pattern identified on perfusion images [9].
In MR imaging, the perfusion-diffusion mismatch
(a perfusion defect larger than the diffusion defect
within it) helps to identify a logical tissue target
for urgent revascularization. CT perfusion parame-
ters have also been shown to provide similar in-
formation to help guide therapy [10,11]. Most
patients imaged within several hours of stroke on-
set are found to have a penumbral pattern, and sev-
ral case series have shown the potential utility of
Am 15 (2005) 575 – 587
reserved.
neuroimaging.theclinics.com
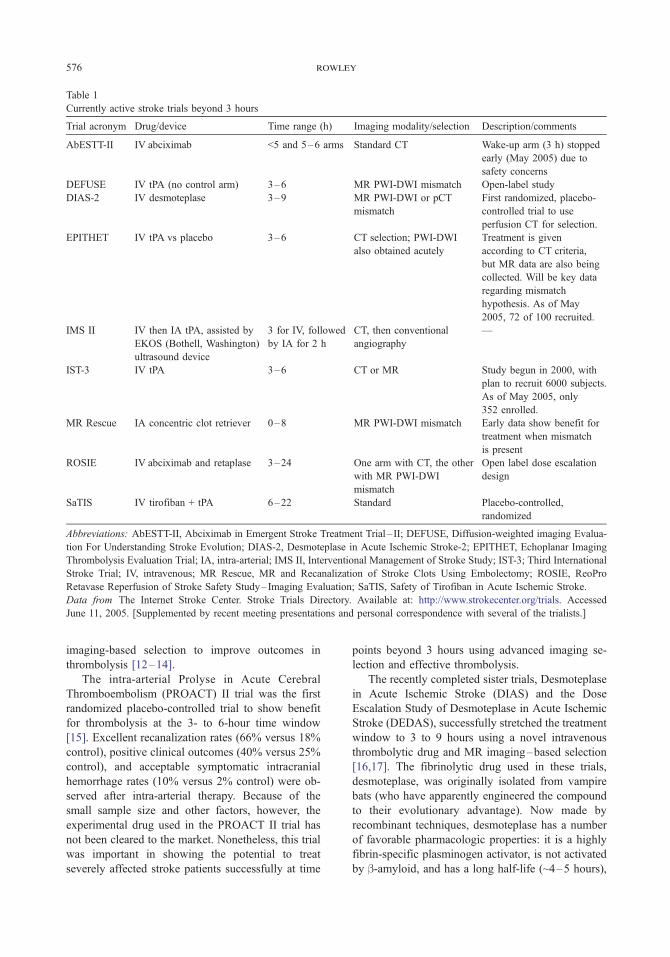
Table 1
Currently active stroke trials beyond 3 hours
Trial acronym Drug/device Time range (h) Imaging modality/selection Description/comments
AbESTT-II IV abciximab <5 and 5–6 arms Standard CT Wake-up arm (3 h) stopped
early (May 2005) due to
safety concerns
DEFUSE IV tPA (no control arm) 3–6 MR PWI-DWI mismatch Open-label study
DIAS-2 IV desmoteplase 3–9 MR PWI-DWI or pCT
mismatch
First randomized, placebo-
controlled trial to use
perfusion CT for selection.
EPITHET IV tPA vs placebo 3–6 CT selection; PWI-DWI
also obtained acutely
Treatment is given
according to CT criteria,
but MR data are also being
collected. Will be key data
regarding mismatch
hypothesis. As of May
2005, 72 of 100 recruited.
IMS II IV then IA tPA, assisted by
EKOS (Bothell, Washington)
ultrasound device
3 for IV, followed
by IA for 2 h
CT, then conventional
angiography
—
IST-3 IV tPA 3–6 CT or MR Study begun in 2000, with
plan to recruit 6000 subjects.
As of May 2005, only
352 enrolled.
MR Rescue IA concentric clot retriever 0–8 MR PWI-DWI mismatch Early data show benefit for
treatment when mismatch
is present
ROSIE IV abciximab and retaplase 3–24 One arm with CT, the other
with MR PWI-DWI
mismatch
Open label dose escalation
design
SaTIS IV tirofiban + tPA 6–22 Standard Placebo-controlled,
randomized
Abbreviations: AbESTT-II, Abciximab in Emergent Stroke Treatment Trial – II; DEFUSE, Diffusion-weighted imaging Evalua-
tion For Understanding Stroke Evolution; DIAS-2, Desmoteplase in Acute Ischemic Stroke-2; EPITHET, Echoplanar Imaging
Thrombolysis Evaluation Trial; IA, intra-arterial; IMS II, Interventional Management of Stroke Study; IST-3; Third International
Stroke Trial; IV, intravenous; MR Rescue, MR and Recanalization of Stroke Clots Using Embolectomy; ROSIE, ReoPro
Retavase Reperfusion of Stroke Safety Study– Imaging Evaluation; SaTIS, Safety of Tirofiban in Acute Ischemic Stroke.
Data from The Internet Stroke Center. Stroke Trials Directory. Available at: http://www.strokecenter.org/trials. Accessed
June 11, 2005. [Supplemented by recent meeting presentations and personal correspondence with several of the trialists.]
rowley576
imaging-based selection to improve outcomes in
thrombolysis [12–14].
The intra-arterial Prolyse in Acute Cerebral
Thromboembolism (PROACT) II trial was the first
randomized placebo-controlled trial to show benefit
for thrombolysis at the 3- to 6-hour time window
[15]. Excellent recanalization rates (66% versus 18%
control), positive clinical outcomes (40% versus 25%
control), and acceptable symptomatic intracranial
hemorrhage rates (10% versus 2% control) were ob-
served after intra-arterial therapy. Because of the
small sample size and other factors, however, the
experimental drug used in the PROACT II trial has
not been cleared to the market. Nonetheless, this trial
was important in showing the potential to treat
severely affected stroke patients successfully at time
points beyond 3 hours using advanced imaging se-
lection and effective thrombolysis.
The recently completed sister trials, Desmoteplase
in Acute Ischemic Stroke (DIAS) and the Dose
Escalation Study of Desmoteplase in Acute Ischemic
Stroke (DEDAS), successfully stretched the treatment
window to 3 to 9 hours using a novel intravenous
thrombolytic drug and MR imaging–based selection
[16,17]. The fibrinolytic drug used in these trials,
desmoteplase, was originally isolated from vampire
bats (who have apparently engineered the compound
to their evolutionary advantage). Now made by
recombinant techniques, desmoteplase has a number
of favorable pharmacologic properties: it is a highly
fibrin-specific plasminogen activator, is not activated
by b-amyloid, and has a long half-life (~4–5 hours),
extending the thrombolysis time window 577
allowing it to be given by single bolus instead of
infusion. Selection in the DIAS and DEDAS trials
was based on a perfusion-diffusion mismatch, defined
as a perfusion defect visually 20% larger than the
diffusion defect. The perfusion defect needed to be
at least 2 cm in diameter and to involve cortex. The
simplest and most sensitive perfusion metric was
used for these trials—the dynamic time course re-
flected by mean transit time (MTT) or time to peak
image (TTP) maps, or even simple visual inspection
of the raw dynamic perfusion data set. MR angiog-
raphy recanalization (Thrombolysis in Myocardial
Infarction [TIMI] scale improvement by 2 points) or
perfusion parameter improvement (MTT volume
reduction by at least 30%) was used to assess reper-
fusion. High reperfusion rates (46.7%–71.4% versus
19.2% control), positive clinical outcomes (46.7%–
60% versus 22.2% control), and low symptomatic
bleeding rates (less than 3%) were found for the
weight-adjusted dose tiers at 90- and 125-mg/kglevels in the DIAS trial. Of particular note, the
volume of the baseline diffusion lesion partially
reversed at follow-up in the 125-mg/kg group [18].
This raises the question of whether even perfusion-
diffusion–matched patients might also stand to gain
from acute reperfusion. The favorable results from
the DIAS and DEDAS trials have led to a new trial,
DIAS-2, which is scheduled to start recruiting sub-
jects in the middle of 2005 [19]. The DIAS-2 trial is
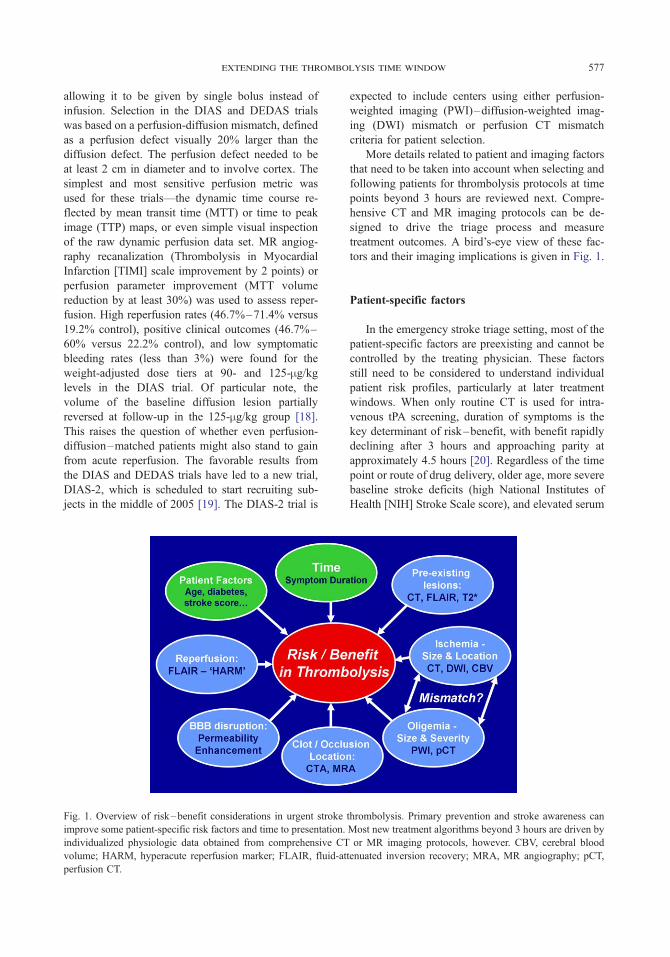
Fig. 1. Overview of risk–benefit considerations in urgent stroke
improve some patient-specific risk factors and time to presentation.
individualized physiologic data obtained from comprehensive CT
volume; HARM, hyperacute reperfusion marker; FLAIR, fluid-at
perfusion CT.
expected to include centers using either perfusion-
weighted imaging (PWI)–diffusion-weighted imag-
ing (DWI) mismatch or perfusion CT mismatch
criteria for patient selection.
More details related to patient and imaging factors
that need to be taken into account when selecting and
following patients for thrombolysis protocols at time
points beyond 3 hours are reviewed next. Compre-
hensive CT and MR imaging protocols can be de-
signed to drive the triage process and measure
treatment outcomes. A bird’s-eye view of these fac-
tors and their imaging implications is given in Fig. 1.
Patient-specific factors
In the emergency stroke triage setting, most of the
patient-specific factors are preexisting and cannot be
controlled by the treating physician. These factors
still need to be considered to understand individual
patient risk profiles, particularly at later treatment
windows. When only routine CT is used for intra-
venous tPA screening, duration of symptoms is the
key determinant of risk–benefit, with benefit rapidly
declining after 3 hours and approaching parity at
approximately 4.5 hours [20]. Regardless of the time
point or route of drug delivery, older age, more severe
baseline stroke deficits (high National Institutes of
Health [NIH] Stroke Scale score), and elevated serum
thrombolysis. Primary prevention and stroke awareness can
Most new treatment algorithms beyond 3 hours are driven by
or MR imaging protocols, however. CBV, cerebral blood
tenuated inversion recovery; MRA, MR angiography; pCT,
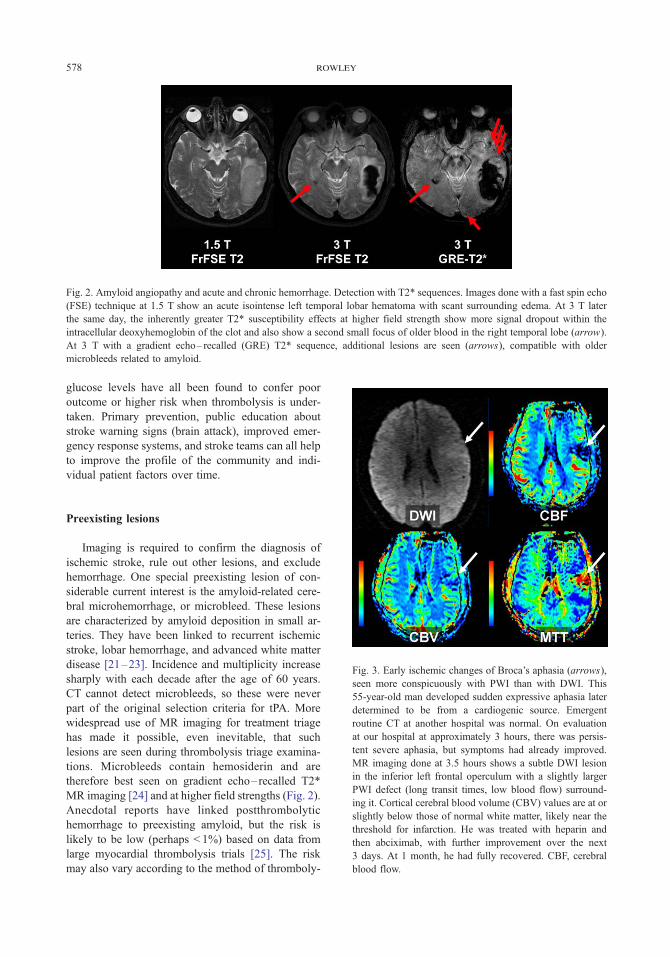
Fig. 2. Amyloid angiopathy and acute and chronic hemorrhage. Detection with T2* sequences. Images done with a fast spin echo
(FSE) technique at 1.5 T show an acute isointense left temporal lobar hematoma with scant surrounding edema. At 3 T later
the same day, the inherently greater T2* susceptibility effects at higher field strength show more signal dropout within the
intracellular deoxyhemoglobin of the clot and also show a second small focus of older blood in the right temporal lobe (arrow).
At 3 T with a gradient echo– recalled (GRE) T2* sequence, additional lesions are seen (arrows), compatible with older
microbleeds related to amyloid.
rowley578
glucose levels have all been found to confer poor
outcome or higher risk when thrombolysis is under-
taken. Primary prevention, public education about
stroke warning signs (brain attack), improved emer-
gency response systems, and stroke teams can all help
to improve the profile of the community and indi-
vidual patient factors over time.
Fig. 3. Early ischemic changes of Broca’s aphasia (arrows),
seen more conspicuously with PWI than with DWI. This
55-year-old man developed sudden expressive aphasia later
determined to be from a cardiogenic source. Emergent
routine CT at another hospital was normal. On evaluation
at our hospital at approximately 3 hours, there was persis-
tent severe aphasia, but symptoms had already improved.
MR imaging done at 3.5 hours shows a subtle DWI lesion
in the inferior left frontal operculum with a slightly larger
PWI defect (long transit times, low blood flow) surround-
ing it. Cortical cerebral blood volume (CBV) values are at or
slightly below those of normal white matter, likely near the
threshold for infarction. He was treated with heparin and
then abciximab, with further improvement over the next
3 days. At 1 month, he had fully recovered. CBF, cerebral
blood flow.
Preexisting lesions
Imaging is required to confirm the diagnosis of
ischemic stroke, rule out other lesions, and exclude
hemorrhage. One special preexisting lesion of con-
siderable current interest is the amyloid-related cere-
bral microhemorrhage, or microbleed. These lesions
are characterized by amyloid deposition in small ar-
teries. They have been linked to recurrent ischemic
stroke, lobar hemorrhage, and advanced white matter
disease [21–23]. Incidence and multiplicity increase
sharply with each decade after the age of 60 years.
CT cannot detect microbleeds, so these were never
part of the original selection criteria for tPA. More
widespread use of MR imaging for treatment triage
has made it possible, even inevitable, that such
lesions are seen during thrombolysis triage examina-
tions. Microbleeds contain hemosiderin and are
therefore best seen on gradient echo–recalled T2*
MR imaging [24] and at higher field strengths (Fig. 2).
Anecdotal reports have linked postthrombolytic
hemorrhage to preexisting amyloid, but the risk is
likely to be low (perhaps < 1%) based on data from
large myocardial thrombolysis trials [25]. The risk
may also vary according to the method of thromboly-
extending the thrombolysis time window 579
sis and the extent to which the specific lytic agent is
activated by amyloid. Whether the size, number, or
even presence of microhemorrhages should be taken
into account in screening patients for thrombolysis is
unclear. Our own approach is to inform the patients
that they may possibly be at somewhat higher risk if
they have known microbleeds, but we do not exclude
them from thrombolysis based on this factor alone.
Characteristics of the ischemic lesion
Size, location, and severity of the ischemic lesion
are the key characteristics to determine, whether by
CT or MR imaging. CT has the advantage of speed
and availability, whereas diffusion MR imaging is
more sensitive for detection of acute ischemia and
shows higher interobserver agreement (Fig. 3) [26].
On CT, acute ischemia is detected as decreased
density or decreased gray-white distinction on CT
images, CT angiography (CTA) source data, or other
enhanced CT images. On MR imaging, hyperintense
DWI signal, decreased apparent diffusion coefficient
(ADC) values, and later increased T2/T2 fluid-
attenuated inversion recovery (FLAIR) signal all in-
dicate ischemic injury (Figs. 4 and 5). These signs
likely reflect shifts of water content attributable to
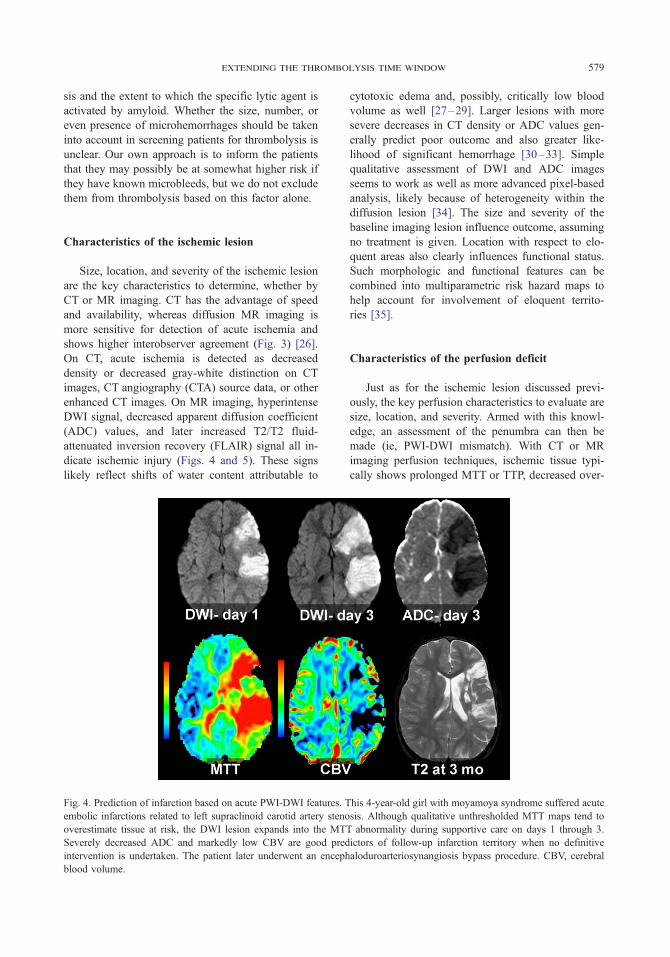
Fig. 4. Prediction of infarction based on acute PWI-DWI features. T
embolic infarctions related to left supraclinoid carotid artery steno
overestimate tissue at risk, the DWI lesion expands into the MT
Severely decreased ADC and markedly low CBV are good pred
intervention is undertaken. The patient later underwent an enceph
blood volume.
cytotoxic edema and, possibly, critically low blood
volume as well [27–29]. Larger lesions with more
severe decreases in CT density or ADC values gen-
erally predict poor outcome and also greater like-
lihood of significant hemorrhage [30–33]. Simple
qualitative assessment of DWI and ADC images
seems to work as well as more advanced pixel-based
analysis, likely because of heterogeneity within the
diffusion lesion [34]. The size and severity of the
baseline imaging lesion influence outcome, assuming
no treatment is given. Location with respect to elo-
quent areas also clearly influences functional status.
Such morphologic and functional features can be
combined into multiparametric risk hazard maps to
help account for involvement of eloquent territo-
ries [35].
Characteristics of the perfusion deficit
Just as for the ischemic lesion discussed previ-
ously, the key perfusion characteristics to evaluate are
size, location, and severity. Armed with this knowl-
edge, an assessment of the penumbra can then be
made (ie, PWI-DWI mismatch). With CT or MR
imaging perfusion techniques, ischemic tissue typi-
cally shows prolonged MTT or TTP, decreased over-
his 4-year-old girl with moyamoya syndrome suffered acute
sis. Although qualitative unthresholded MTT maps tend to
T abnormality during supportive care on days 1 through 3.
ictors of follow-up infarction territory when no definitive
aloduroarteriosynangiosis bypass procedure. CBV, cerebral
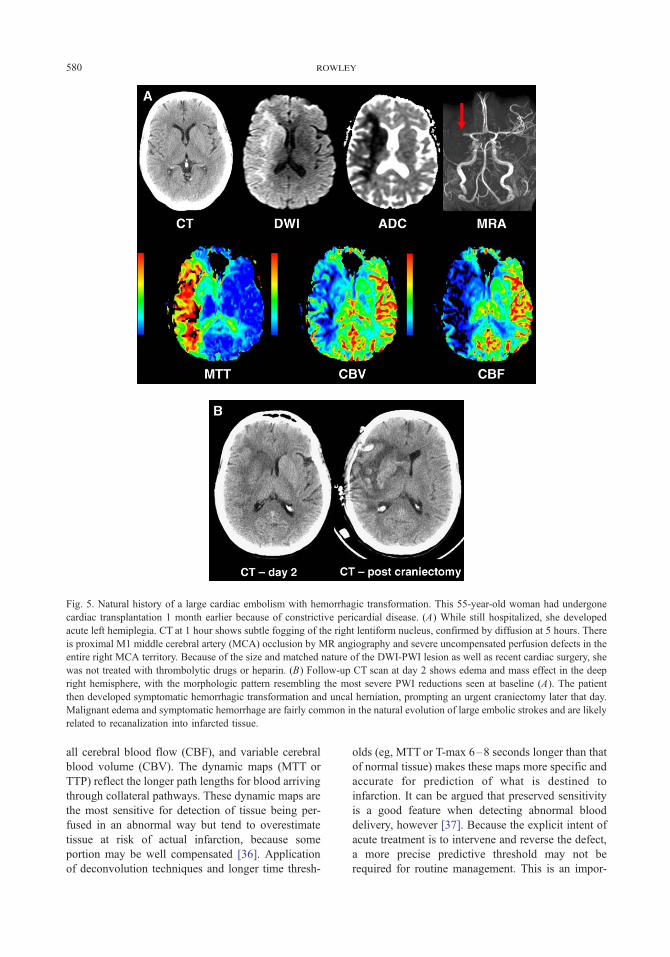
Fig. 5. Natural history of a large cardiac embolism with hemorrhagic transformation. This 55-year-old woman had undergone
cardiac transplantation 1 month earlier because of constrictive pericardial disease. (A) While still hospitalized, she developed
acute left hemiplegia. CT at 1 hour shows subtle fogging of the right lentiform nucleus, confirmed by diffusion at 5 hours. There
is proximal M1 middle cerebral artery (MCA) occlusion by MR angiography and severe uncompensated perfusion defects in the
entire right MCA territory. Because of the size and matched nature of the DWI-PWI lesion as well as recent cardiac surgery, she
was not treated with thrombolytic drugs or heparin. (B) Follow-up CT scan at day 2 shows edema and mass effect in the deep
right hemisphere, with the morphologic pattern resembling the most severe PWI reductions seen at baseline (A). The patient
then developed symptomatic hemorrhagic transformation and uncal herniation, prompting an urgent craniectomy later that day.
Malignant edema and symptomatic hemorrhage are fairly common in the natural evolution of large embolic strokes and are likely
related to recanalization into infarcted tissue.
rowley580
all cerebral blood flow (CBF), and variable cerebral
blood volume (CBV). The dynamic maps (MTT or
TTP) reflect the longer path lengths for blood arriving
through collateral pathways. These dynamic maps are
the most sensitive for detection of tissue being per-
fused in an abnormal way but tend to overestimate
tissue at risk of actual infarction, because some
portion may be well compensated [36]. Application
of deconvolution techniques and longer time thresh-
olds (eg, MTT or T-max 6–8 seconds longer than that
of normal tissue) makes these maps more specific and
accurate for prediction of what is destined to
infarction. It can be argued that preserved sensitivity
is a good feature when detecting abnormal blood
delivery, however [37]. Because the explicit intent of
acute treatment is to intervene and reverse the defect,
a more precise predictive threshold may not be
required for routine management. This is an impor-
extending the thrombolysis time window 581
tant point—many of us in the field (laudably, we
hope) debate the fine details of various dynamic
perfusion parameter maps, thresholds, choice of ar-
terial input function, and deconvolution methods, for
example, yet the simplest gross dynamic maps or
even visual inspection or raw PWI image loops were
sufficient in the DIAS and DEDAS trials to select
patients with penumbra successfully (Fig. 6). Fast and
simple methods are a good choice when they work.
The CBV gives a snapshot of autoregulatory sta-
tus. Assuming there is still proximal occlusion, the
precapillary arterioles dilate to help compensate and
preserve CBF (through the central volume principle:
CBF = CBV/MTT). Elevated CBV within an area of
prolonged MTT thus suggests preserved autoregula-
tion. Once perfusion pressure becomes insufficient to
support the elevated volume, however, the vascular
bed collapses and CBV falls precipitously. When
CBV is severely depressed, it therefore indicates
severely ischemic core tissue likely to undergo in-
farction [38]. Low CBV can predict not only poor
outcome for that tissue but higher likelihood of
hemorrhagic transformation (HT) if the tissue is reper-
fused. As a practical matter, low CBV may provide
the perfusion CT equivalent of diffusion in MR
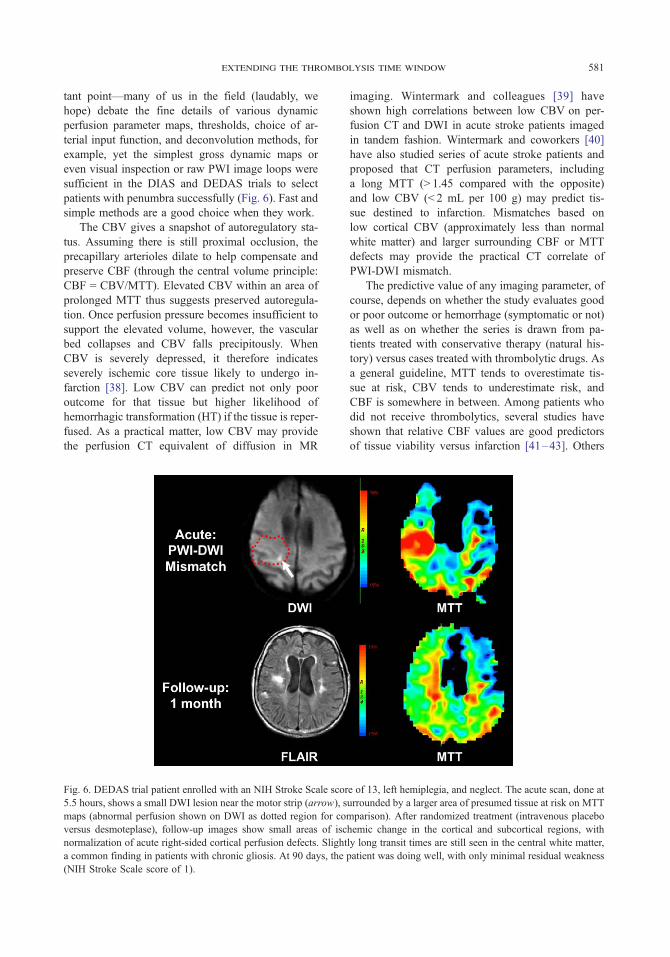
Fig. 6. DEDAS trial patient enrolled with an NIH Stroke Scale scor
5.5 hours, shows a small DWI lesion near the motor strip (arrow), s
maps (abnormal perfusion shown on DWI as dotted region for co
versus desmoteplase), follow-up images show small areas of isc
normalization of acute right-sided cortical perfusion defects. Slight
a common finding in patients with chronic gliosis. At 90 days, the
(NIH Stroke Scale score of 1).
imaging. Wintermark and colleagues [39] have
shown high correlations between low CBV on per-
fusion CT and DWI in acute stroke patients imaged
in tandem fashion. Wintermark and coworkers [40]
have also studied series of acute stroke patients and
proposed that CT perfusion parameters, including
a long MTT (> 1.45 compared with the opposite)
and low CBV (< 2 mL per 100 g) may predict tis-
sue destined to infarction. Mismatches based on
low cortical CBV (approximately less than normal
white matter) and larger surrounding CBF or MTT
defects may provide the practical CT correlate of
PWI-DWI mismatch.
The predictive value of any imaging parameter, of
course, depends on whether the study evaluates good
or poor outcome or hemorrhage (symptomatic or not)
as well as on whether the series is drawn from pa-
tients treated with conservative therapy (natural his-
tory) versus cases treated with thrombolytic drugs. As
a general guideline, MTT tends to overestimate tis-
sue at risk, CBV tends to underestimate risk, and
CBF is somewhere in between. Among patients who
did not receive thrombolytics, several studies have
shown that relative CBF values are good predictors
of tissue viability versus infarction [41–43]. Others
e of 13, left hemiplegia, and neglect. The acute scan, done at
urrounded by a larger area of presumed tissue at risk on MTT
mparison). After randomized treatment (intravenous placebo
hemic change in the cortical and subcortical regions, with
ly long transit times are still seen in the central white matter,
patient was doing well, with only minimal residual weakness
rowley582
have found that TTP prolongations of approximately
4 to 5 seconds, peak height less than 54% [44],
and more severe ADC lesions are predictors of lesion
growth or malignant edema [45].
The value of perfusion parameters needs to be
reconsidered when dealing with patients treated with
thrombolytics or other urgent revascularization. Here,
the intent is to interfere with natural history and
forestall damage; therefore, predictive models based
on conservatively treated patients do not fully apply.
The main role may be in selecting patients, with risk
prediction considered a secondary but related goal.
CT and MR imaging protocols have been used to
relate lesion volumes to successful recanalization
[46]. Series have shown perfusion parameters to be
a strong predictor of late infarct volume (TTP), ir-
reversible core (T-max), and lesion growth (low CBF)
[47–49]. These topics have been reviewed recently
in an excellent article by Butcher [50] based on
the initial 40 patients in the Echoplanar Imaging
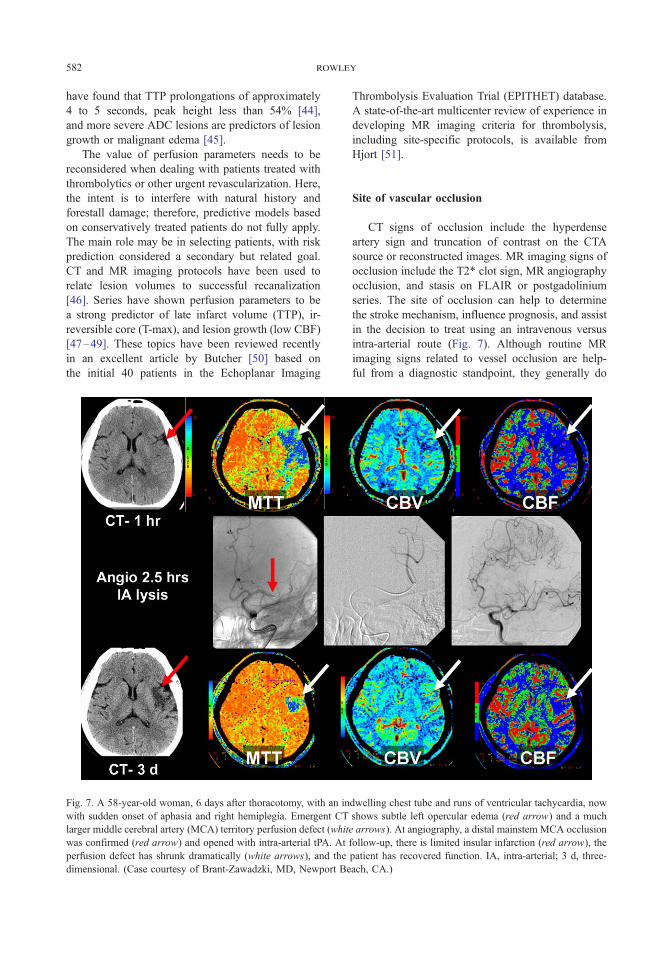
Fig. 7. A 58-year-old woman, 6 days after thoracotomy, with an in
with sudden onset of aphasia and right hemiplegia. Emergent CT
larger middle cerebral artery (MCA) territory perfusion defect (whit
was confirmed (red arrow) and opened with intra-arterial tPA. At
perfusion defect has shrunk dramatically (white arrows), and the
dimensional. (Case courtesy of Brant-Zawadzki, MD, Newport Be
Thrombolysis Evaluation Trial (EPITHET) database.
A state-of-the-art multicenter review of experience in
developing MR imaging criteria for thrombolysis,
including site-specific protocols, is available from
Hjort [51].
Site of vascular occlusion
CT signs of occlusion include the hyperdense
artery sign and truncation of contrast on the CTA
source or reconstructed images. MR imaging signs of
occlusion include the T2* clot sign, MR angiography
occlusion, and stasis on FLAIR or postgadolinium
series. The site of occlusion can help to determine
the stroke mechanism, influence prognosis, and assist
in the decision to treat using an intravenous versus
intra-arterial route (Fig. 7). Although routine MR
imaging signs related to vessel occlusion are help-
ful from a diagnostic standpoint, they generally do
dwelling chest tube and runs of ventricular tachycardia, now
shows subtle left opercular edema (red arrow) and a much
e arrows). At angiography, a distal mainstem MCA occlusion
follow-up, there is limited insular infarction (red arrow), the
patient has recovered function. IA, intra-arterial; 3 d, three-
ach, CA.)
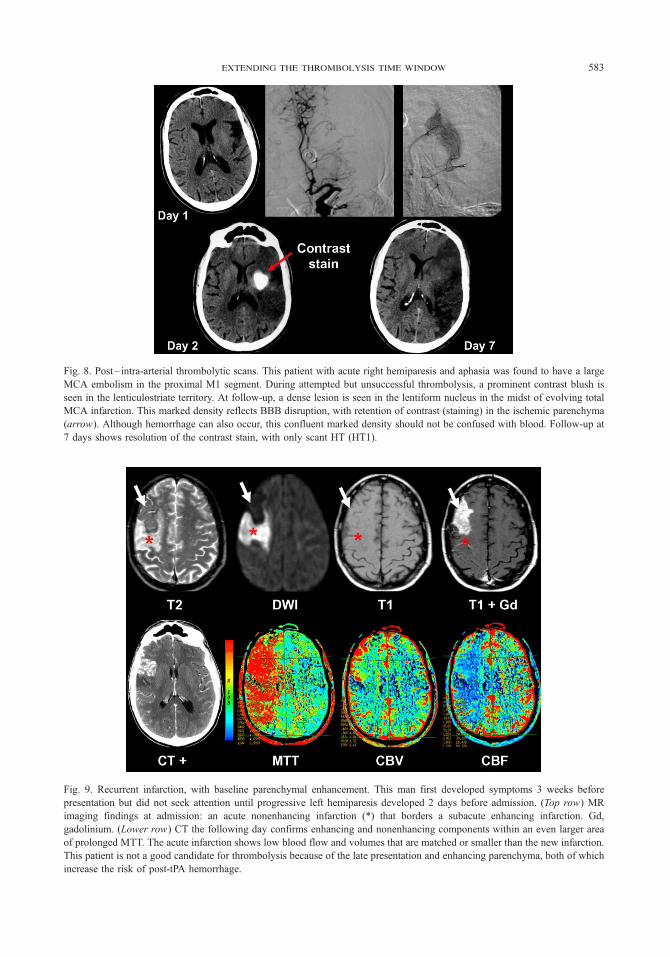
Fig. 8. Post– intra-arterial thrombolytic scans. This patient with acute right hemiparesis and aphasia was found to have a large
MCA embolism in the proximal M1 segment. During attempted but unsuccessful thrombolysis, a prominent contrast blush is
seen in the lenticulostriate territory. At follow-up, a dense lesion is seen in the lentiform nucleus in the midst of evolving total
MCA infarction. This marked density reflects BBB disruption, with retention of contrast (staining) in the ischemic parenchyma
(arrow). Although hemorrhage can also occur, this confluent marked density should not be confused with blood. Follow-up at
7 days shows resolution of the contrast stain, with only scant HT (HT1).
Fig. 9. Recurrent infarction, with baseline parenchymal enhancement. This man first developed symptoms 3 weeks before
presentation but did not seek attention until progressive left hemiparesis developed 2 days before admission. (Top row) MR
imaging findings at admission: an acute nonenhancing infarction (*) that borders a subacute enhancing infarction. Gd,
gadolinium. (Lower row) CT the following day confirms enhancing and nonenhancing components within an even larger area
of prolonged MTT. The acute infarction shows low blood flow and volumes that are matched or smaller than the new infarction.
This patient is not a good candidate for thrombolysis because of the late presentation and enhancing parenchyma, both of which
increase the risk of post-tPA hemorrhage.
extending the thrombolysis time window 583
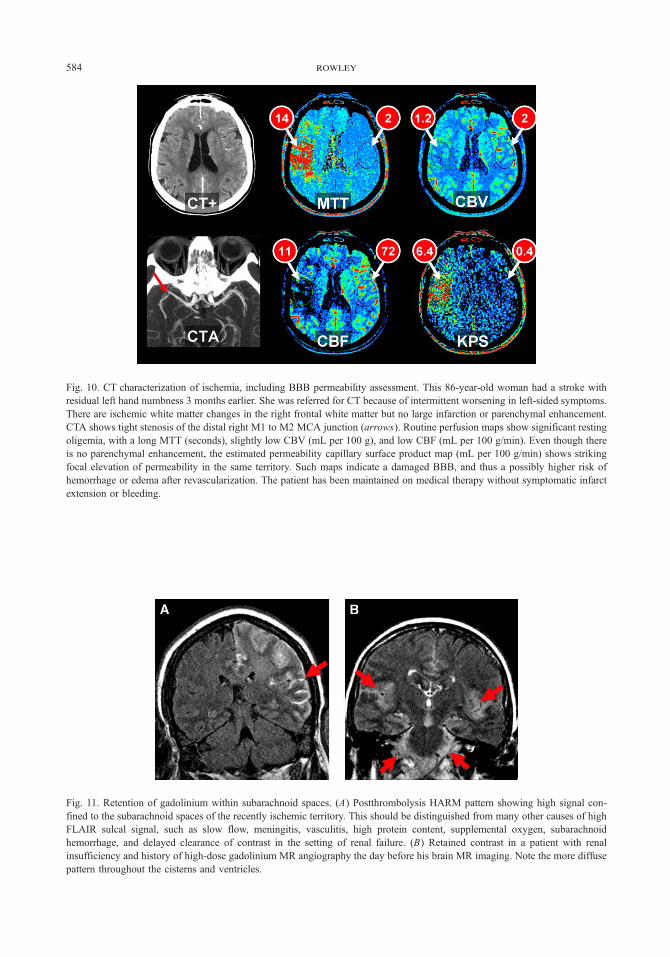
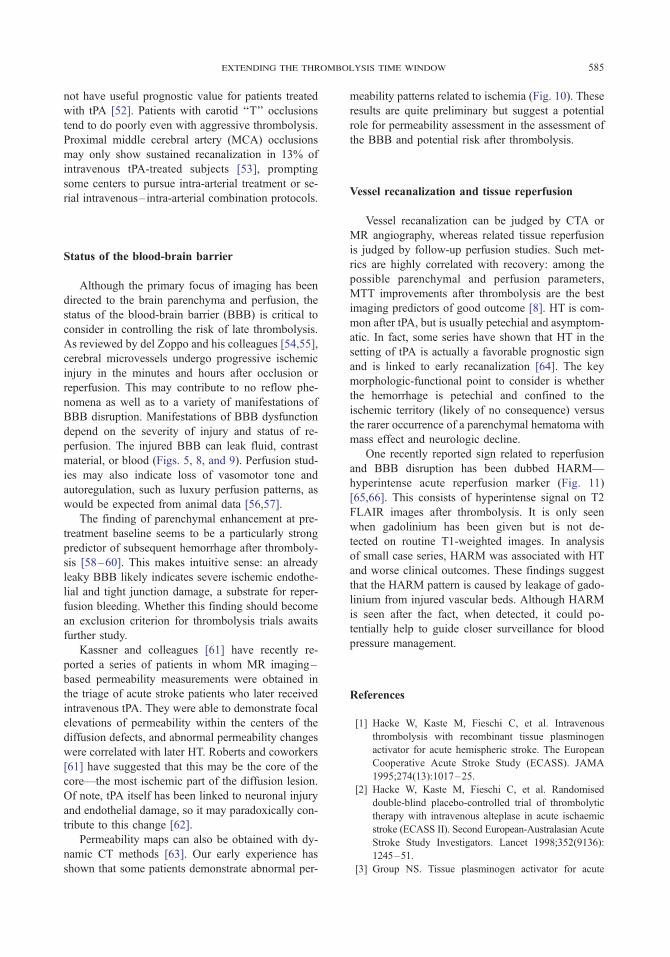
Fig. 11. Retention of gadolinium within subarachnoid spaces. (A) Postthrombolysis HARM pattern showing high signal con-
fined to the subarachnoid spaces of the recently ischemic territory. This should be distinguished from many other causes of high
FLAIR sulcal signal, such as slow flow, meningitis, vasculitis, high protein content, supplemental oxygen, subarachnoid
hemorrhage, and delayed clearance of contrast in the setting of renal failure. (B) Retained contrast in a patient with renal
insufficiency and history of high-dose gadolinium MR angiography the day before his brain MR imaging. Note the more diffuse
pattern throughout the cisterns and ventricles.
Fig. 10. CT characterization of ischemia, including BBB permeability assessment. This 86-year-old woman had a stroke with
residual left hand numbness 3 months earlier. She was referred for CT because of intermittent worsening in left-sided symptoms.
There are ischemic white matter changes in the right frontal white matter but no large infarction or parenchymal enhancement.
CTA shows tight stenosis of the distal right M1 to M2 MCA junction (arrows). Routine perfusion maps show significant resting
oligemia, with a long MTT (seconds), slightly low CBV (mL per 100 g), and low CBF (mL per 100 g/min). Even though there
is no parenchymal enhancement, the estimated permeability capillary surface product map (mL per 100 g/min) shows striking
focal elevation of permeability in the same territory. Such maps indicate a damaged BBB, and thus a possibly higher risk of
hemorrhage or edema after revascularization. The patient has been maintained on medical therapy without symptomatic infarct
extension or bleeding.
rowley584
extending the thrombolysis time window 585
not have useful prognostic value for patients treated
with tPA [52]. Patients with carotid ‘‘T’’ occlusions
tend to do poorly even with aggressive thrombolysis.
Proximal middle cerebral artery (MCA) occlusions
may only show sustained recanalization in 13% of
intravenous tPA-treated subjects [53], prompting
some centers to pursue intra-arterial treatment or se-
rial intravenous–intra-arterial combination protocols.
Status of the blood-brain barrier
Although the primary focus of imaging has been
directed to the brain parenchyma and perfusion, the
status of the blood-brain barrier (BBB) is critical to
consider in controlling the risk of late thrombolysis.
As reviewed by del Zoppo and his colleagues [54,55],
cerebral microvessels undergo progressive ischemic
injury in the minutes and hours after occlusion or
reperfusion. This may contribute to no reflow phe-
nomena as well as to a variety of manifestations of
BBB disruption. Manifestations of BBB dysfunction
depend on the severity of injury and status of re-
perfusion. The injured BBB can leak fluid, contrast
material, or blood (Figs. 5, 8, and 9). Perfusion stud-
ies may also indicate loss of vasomotor tone and
autoregulation, such as luxury perfusion patterns, as
would be expected from animal data [56,57].
The finding of parenchymal enhancement at pre-
treatment baseline seems to be a particularly strong
predictor of subsequent hemorrhage after thromboly-
sis [58–60]. This makes intuitive sense: an already
leaky BBB likely indicates severe ischemic endothe-
lial and tight junction damage, a substrate for reper-
fusion bleeding. Whether this finding should become
an exclusion criterion for thrombolysis trials awaits
further study.
Kassner and colleagues [61] have recently re-
ported a series of patients in whom MR imaging–
based permeability measurements were obtained in
the triage of acute stroke patients who later received
intravenous tPA. They were able to demonstrate focal
elevations of permeability within the centers of the
diffusion defects, and abnormal permeability changes
were correlated with later HT. Roberts and coworkers
[61] have suggested that this may be the core of the
core—the most ischemic part of the diffusion lesion.
Of note, tPA itself has been linked to neuronal injury
and endothelial damage, so it may paradoxically con-
tribute to this change [62].
Permeability maps can also be obtained with dy-
namic CT methods [63]. Our early experience has
shown that some patients demonstrate abnormal per-
meability patterns related to ischemia (Fig. 10). These
results are quite preliminary but suggest a potential
role for permeability assessment in the assessment of
the BBB and potential risk after thrombolysis.
Vessel recanalization and tissue reperfusion
Vessel recanalization can be judged by CTA or
MR angiography, whereas related tissue reperfusion
is judged by follow-up perfusion studies. Such met-
rics are highly correlated with recovery: among the
possible parenchymal and perfusion parameters,
MTT improvements after thrombolysis are the best
imaging predictors of good outcome [8]. HT is com-
mon after tPA, but is usually petechial and asymptom-
atic. In fact, some series have shown that HT in the
setting of tPA is actually a favorable prognostic sign
and is linked to early recanalization [64]. The key
morphologic-functional point to consider is whether
the hemorrhage is petechial and confined to the
ischemic territory (likely of no consequence) versus
the rarer occurrence of a parenchymal hematoma with
mass effect and neurologic decline.
One recently reported sign related to reperfusion
and BBB disruption has been dubbed HARM—
hyperintense acute reperfusion marker (Fig. 11)
[65,66]. This consists of hyperintense signal on T2
FLAIR images after thrombolysis. It is only seen
when gadolinium has been given but is not de-
tected on routine T1-weighted images. In analysis
of small case series, HARM was associated with HT
and worse clinical outcomes. These findings suggest
that the HARM pattern is caused by leakage of gado-
linium from injured vascular beds. Although HARM
is seen after the fact, when detected, it could po-
tentially help to guide closer surveillance for blood
pressure management.
References
[1] Hacke W, Kaste M, Fieschi C, et al. Intravenous
thrombolysis with recombinant tissue plasminogen
activator for acute hemispheric stroke. The European
Cooperative Acute Stroke Study (ECASS). JAMA
1995;274(13):1017–25.
[2] Hacke W, Kaste M, Fieschi C, et al. Randomised
double-blind placebo-controlled trial of thrombolytic
therapy with intravenous alteplase in acute ischaemic
stroke (ECASS II). Second European-Australasian Acute
Stroke Study Investigators. Lancet 1998;352(9136):
1245–51.
[3] Group NS. Tissue plasminogen activator for acute
rowley586
ischemic stroke. The National Institute of Neurological
Disorders and Stroke rt-PA Stroke Study Group.
N Engl J Med 1995;333(24):1581–7.
[4] Kleindorfer D, Kissela B, Schneider A, et al. Eligibility
for recombinant tissue plasminogen activator in acute
ischemic stroke: a population-based study. Stroke
2004;35(2):E27–9.
[5] Hacke W, Donnan G, Fieschi C, et al. Association of
outcome with early stroke treatment: pooled analysis of
ATLANTIS, ECASS, and NINDS rt-PA stroke trials.
Lancet 2004;363(9411):768–74.
[6] Warach S. Thrombolysis in stroke beyond three hours:
targeting patients with diffusion and perfusion MRI.
Ann Neurol 2002;51(1):11–3.
[7] Liebeskind DS. Collateral circulation. Stroke 2003;
34(9):2279–84.
[8] Chalela JA, Kang DW, Luby M, et al. Early magnetic
resonance imaging findings in patients receiving tissue
plasminogen activator predict outcome: insights into
the pathophysiology of acute stroke in the thromboly-
sis era. Ann Neurol 2004;55(1):105–12.
[9] Warach S. Measurement of the ischemic penumbra with
MRI: it’s about time. Stroke 2003;34(10):2533–4.
[10] Lev MH, Koroshetz WJ, Schwamm LH, et al. CT
or MRI for imaging patients with acute stroke: vi-
sualization of ‘‘tissue at risk’’? Stroke 2002;33(12):
2736–7.
[11] Wintermark M, Bogousslavsky J. Imaging of acute
ischemic brain injury: the return of computed tomog-
raphy. Curr Opin Neurol 2003;16(1):59–63.
[12] Parsons MW, Barber PA, Chalk J, et al. Diffusion-
and perfusion-weighted MRI response to thrombolysis
in stroke. Ann Neurol 2002;51(1):28–37.
[13] Butcher KS. Perfusion thresholds in acute stroke
thrombolysis. Stroke 2003;34:2159–64.
[14] Rother J. Effect of intravenous thrombolysis on MRI
parameters and functional outcome in acute stroke
< 6 hours. Stroke 2002;33:2438–45.
[15] Furlan A, Higashida R, Wechsler L, et al. Intra-arterial
prourokinase for acute ischemic stroke. The PROACT
II study: a randomized controlled trial. Prolyse in
Acute Cerebral Thromboembolism. JAMA 1999;
282(21):2003–11.
[16] Hacke W, Albers G, Al-Rawi Y, et al. The Desmote-
plase in Acute Ischemic Stroke Trial (DIAS): a phase II
MRI-based 9-hour window acute stroke thrombolysis
trial with intravenous desmoteplase. Stroke 2005;
36(1):66–73.
[17] Rowley H. Successful patient selection with DWPW-
MRI for IV treatment with desmoteplase at 3–9 hours:
DIAS and DEDAS trial results. Presented at the
American Society of Neuroradiology Meeting. To-
ronto, Ontario, Canada, May 21–27, 2005.
[18] Warach S. Early reperfusion related to clinical response
in DIAS: phase II, randomized, placebo-controlled
dose finding trial of IV desmoteplase 3–9 hours from
onset in patients with diffusion-perfusion mismatch.
Presented at the American Stroke Association Meeting.
San Diego, California, February 5–7, 2004.
[19] The Internet Stroke Center. Stroke Trials Directory.
Available at: http://www.strokecenter.org/trials. Accessed
June 11, 2005.
[20] Hacke W. Association of outcome with early stroke
treatment: pooled analysis of ATLANTIS, ECASS, and
NINDS rt-PA stroke trials. Lancet 2004;363:768–74.
[21] Naka H, Nomura E, Wakabayashi S, et al. Frequency
of asymptomatic microbleeds on T2*-weighted MR
images of patients with recurrent stroke: association
with combination of stroke subtypes and leukoariosis.
AJNR Am J Neuroradiol 2004;25(5):714–9.
[22] Fan YH, Zhang L, Lam WWM, et al. Cerebral micro-
bleeds as a risk factor for subsequent intracerebral hem-
orrhages among patients with acute ischemic stroke.
Stroke 2003;34(10):2459–62.
[23] Nighoghossian N, Hermier M, Adeleine P, et al. Old
microbleeds are a potential risk factor for cerebral
bleeding after ischemic stroke: a gradient-echo T2*-
weighted brain MRI study. Stroke 2002;33(3):735–42.
[24] Kidwell CS, Chalela JA, Saver JL, et al. Comparison
of MRI and CT for detection of acute intracerebral
hemorrhage. JAMA 2004;292(15):1823–30.
[25] McCarron MO, Nicoll JA. Cerebral amyloid angio-
pathy and thrombolysis related intracerebral haemor-
rhage. Lancet Neurol 2004;3:484–92.
[26] Fiebach JB, Schellinger PD, Jansen O, et al. CT and
diffusion-weighted MR imaging in randomized order.
Stroke 2002;33(9):2206–10.
[27] Zimmerman RD. Stroke wars: episode IV CT strikes
back. AJNR Am J Neuroradiol 2004;25(8):1304–9.
[28] Grond M, von Kummer R, Sobesky J, et al. Early x-ray
hypoattenuation of brain parenchyma indicates ex-
tended critical hypoperfusion in acute stroke. Stroke
2000;31(1):133–9.
[29] Dzialowski I, Weber J, Doerfler A, et al. Brain tis-
sue water uptake after middle cerebral artery occlu-
sion assessed with CT. J Neuroimaging 2004;14(1):
42–8.
[30] Tong DC, Adami A, Moseley ME, et al. Predic-
tion of hemorrhagic transformation following acute
stroke: role of diffusion- and perfusion-weighted mag-
netic resonance imaging. Arch Neurol 2001;58(4):
587–93.
[31] Oppenheim C, Grandin C, Samson Y, et al. Is there
an apparent diffusion coefficient threshold in predict-
ing tissue viability in hyperacute stroke? Stroke 2001;
32(11):2486–91.
[32] von Kummer R. Early major ischemic changes on
computed tomography should preclude use of tissue
plasminogen activator. Stroke 2003;34(3):820–1.
[33] Selim M. Predictors of hemorrhagic transformation af-
ter intravenous recombinant tissue plasminogen acti-
vator. Stroke 2002;33:2047–52.
[34] Na DG. Diffusion-weighted MR imaging in acute
ischemia: value of apparent diffusion coefficient and
signal intensity thresholds in predicting tissue at risk
and final infarct size. AJNR Am J Neuroradiol 2004;
25:1331–6.
[35] Wu O, Koroshetz WJ, Ostergaard L, et al. Predicting
extending the thrombolysis time window 587
tissue outcome in acute human cerebral ischemia using
combined diffusion- and perfusion-weighted MR imag-
ing. Stroke 2001;32(4):933–42.
[36] Rowley HA, Roberts TP. Clinical perspectives in per-
fusion: neuroradiologic applications. Top Magn Reson
Imaging 2004;15(1):28–40.
[37] Carroll TJ, Rowley HA, Haughton VM. Automatic
calculation of the arterial input function for cerebral
perfusion imaging with MR imaging. Radiology 2003;
227(2):593–600.
[38] Kucinski T, Naumann D, Knab R, et al. Tissue at risk
is overestimated in perfusion-weighted imaging: MR
imaging in acute stroke patients without vessel recana-
lization. AJNR Am J Neuroradiol 2005;26(4):815–9.
[39] Wintermark M, Reichhart M, Cuisenaire O, et al. Com-
parison of admission perfusion computed tomography
and qualitative diffusion- and perfusion-weighted mag-
netic resonance imaging in acute stroke patients. Stroke
2002;33(8):2025–31.
[40] Wintermark M, Flanders AE, Velthuis B, et al. Per-
fusion CT evaluation of cerebral vascular autoregula-
tion in a large series of acute stroke patients. Presented
at the American Society of Neuroradiology Meeting.
Toronto, Ontario, Canada, May 21–27, 2005.
[41] Parsons M. Perfusion magnetic resonance imaging
maps in hyperacute stroke. Stroke 2001;32:1581–7.
[42] Rohl L. Viability thresholds of ischemic penumbra of
hyperacute stroke defined by perfusion-weighted MRI
and apparent diffusion coefficient. Stroke 2001;32:
1140–6.
[43] Schaefer PW. Assessing tissue viability with MR
diffusion and perfusion imaging. AJNR Am J Neuro-
radiol 2003;24:436–43.
[44] Grandlin C. Which MR-derived perfusion parameters
are the best predictors of infarct growth in hyperacute
stroke? Comparative study between relative and quan-
titative measurements. Radiology 2002;223:361–70.
[45] Thomalla GJ, Kucinski T, Schoder V, et al. Predic-
tion of malignant middle cerebral artery infarction by
early perfusion- and diffusion-weighted magnetic reso-
nance imaging. Stroke 2003;34(8):1892–9.
[46] Lev MH. Utility of perfusion-weighted CT imaging in
acute middle cerebral artery stroke treated with intra-
arterial thrombolysis. Stroke 2001;32:2021–8.
[47] Hermier M. Early magnetic resonance imaging pre-
diction of arterial recanalization and late infarct volume
in acute carotid artery stroke. J Cereb Blood Flow
Metab 2003;23:240–8.
[48] Shih L. Perfusion-weighted magnetic resonance imag-
ing thresholds identifying core, irreversibly infarcted
tissue. Stroke 2003;34:1425–30.
[49] Fiehler J. Cerebral blood flow predicts lesion growth
in acute stroke patients. Stroke 2002;33:2421–5.
[50] Butcher KS. Refining the perfusion-diffusion mis-
match hypothesis. Stroke 2005;36:1153–9.
[51] Hjort N. Magnetic resonance imaging criteria for
thrombolysis in acute cerebral infarct. Stroke 2005;
36:388–97.
[52] Schellinger PD, Chalela JA, Kang DW, et al.
Diagnostic and prognostic value of early MR imaging
vessel signs in hyperacute stroke patients imaged
< 3 hours and treated with recombinant tissue plasmi-
nogen activator. AJNR Am J Neuroradiol 2005;26(3):
618–24.
[53] Alexandrov A. Ultrasound-enhanced systemic throm-
bolysis. N Engl J Med 2004;351(21):2170–8.
[54] del Zoppo GJ. Cerebral microvessel response to fo-
cal ischemia. J Cereb Blood Flow Metab 2003;23:
879–94.
[55] del Zoppo GJ, von Kummer R, Hamann GF. Ischaemic
damage of brain microvessels: inherent risks for
thrombolytic treatment in stroke. J Neurol Neurosurg
Psychiatry 1998;65(1):1–9.
[56] Cipolla MJ, Curry AB. Middle cerebral artery func-
tion after stroke: the threshold duration of reperfusion
for myogenic activity. Stroke 2002;33(8):2094–9.
[57] Cipolla MJ, Lessov N, Clark WM, et al. Postischemic
attenuation of cerebral artery reactivity is increased in
the presence of tissue plasminogen activator [editorial
comment]. Stroke 2000;31(4):940–5.
[58] Knight RA. Prediction of impending hemorrhage trans-
formation in ischemic stroke using magnetic resonance
imaging in rats. Stroke 1998;29:144–51.
[59] Neumann-Haefelin C. Prediction of hemorrhagic trans-
formation after thrombolytic therapy of clot embo-
lism. Stroke 2002;33:1392–8.
[60] Vo K. MR imaging enhancement patterns as predictors
of hemorrhagic transformation in acute ischemia
stroke. AJNR Am J Neuroradiol 2003;24:674–9.
[61] Kassner A, Roberts TP, Taylor K, et al. Prediction
of hemorrhagic transformation of acute ischemic stroke
using dynamic contrast-enhanced permeability MRI.
Presentedat the InternationalSociety forMagneticReso-
nance in Medicine Meeting. Miami Beach, Florida,
May 7–13, 2005.
[62] Liu D, Cheng T, Guo H, et al. Tissue plasminogen
activator neurovascular toxicity is controlled by acti-
vated protein C. Nat Med 2004;10(12):1379–83.
[63] Roberts HC, Roberts TP, Lee TY, et al. Dynamic,
contrast-enhanced CT of human brain tumors: quanti-
tative assessment of blood volume, blood flow, and
microvascular permeability: report of two cases. AJNR
Am J Neuroradiol 2002;23(5):828–32.
[64] Molina C. Thrombolysis-related hemorrhagic infarc-
tion. Stroke 2002;33:1551–6.
[65] Warach S. Evidence of reperfusion injury, exacerbated
by thrombolytic therapy, in human focal brain ische-
mia using a novel imaging marker of early blood-brain
barrier disruption. Stroke 2004;35:2659–61.
[66] Latour LL. Early blood-brain barrier disruption in
human focal brain ischemia. Ann Neurol 2004;56:
468–77.