Embed Size (px)
Citation preview
1
Exploration in NetHack With Secret DiscoveryJonathan Campbell and Clark Verbrugge
School of Computer Science, McGill University, Montreal, [email protected], [email protected]
Abstract—Roguelike games generally feature exploration prob-lems as a critical, yet often repetitive element of gameplay.Automated approaches, however, face challenges in terms ofoptimality, as well as due to incomplete information, such as fromthe presence of secret doors. This paper presents an algorithmicapproach to exploration of roguelike dungeon environments. Ourdesign aims to minimize exploration time, balancing coverageand discovery of secret areas with resource cost. Our algorithmis based on the concept of occupancy maps popular in robotics,adapted to encourage efficient discovery of secret access points.Through extensive experimentation on NetHack maps we showthat this technique is significantly more efficient than simplergreedy approaches. We further investigate optimized parameter-ization for the algorithm through a comprehensive data analysis.These results point towards better automation for players as wellas heuristics applicable to fully automated gameplay.
I. INTRODUCTION
Many video games place emphasis on the idea of explo-ration of the unknown. In roguelikes, a popular subset ofRole-Playing Games (RPGs), exploration of the game spaceis a key game mechanic, essential to resource acquisitionand game progress. The high level of repetition involved,however, makes automation of the exploration process useful,as an assistance in game design, for relieving player tedium inrelatively safe levels or under casual play, and to reduce controlrequirements for those operating with reduced interfaces [1].Basic forms of automated exploration are found in severalroguelikes, including the popular Dungeon Crawl Stone Soup.
Algorithmic approaches to exploration typically aim at be-ing exhaustive. Even with full information, however, ensuringcomplete coverage can result in significant inefficiency, withcoverage improvement coming at greater costs as explorationcontinues [2]. Diminishing returns are further magnified in thepresence of “secret rooms,” areas which must be intentionallysearched for at additional, non-trivial resource cost, and whichare a common feature of roguelike games. In such contexts thecomplexity is less driven by the need to be thorough, and moregiven by the need to balance the time spent exploring a spacewith respect to the amount of benefit accrued (area revealed,items collected).
In this work we present a novel algorithm for exploration ofan initially unknown environment. Our design aims to accom-modate features common to roguelike games. In particular, weaim for an efficient, balanced approach to exploration, consid-ering the cost of further exploration in relation to the potentialbenefit. We factor in the relative importance of different areas,focusing on room coverage versus full/corridor coverage, andaddress the existence of secret rooms (secret doors) as well.Our design is inspired by a variation of occupancy maps,adapted from robotics into video games [3]. In this way we
can control how the space is explored, following a probabilitygradient that flows from places of higher potential benefit.
We compare this approach with a simpler, greedy algo-rithm more typical of a basic automated strategy, applyingboth to levels from the canonical roguelike, NetHack. Thisenvironment gives us a realistic and frequently mimickedgame context, with uneven exploration potential (rooms versuscorridors), critical resource limitations (every move consumesscarce food resources), and a non-trivial, dungeon-like mapenvironment, including randomized placement and discoveryof secret doors. Compared to the greedy approach, our al-gorithm shows improvement in overall efficiency, particularlywith regard to discovery of secret areas. We enhance thisinvestigation with a deep consideration of the many differentparameterizations possible, showing the relative impact of awide variety of algorithm design choices.
Our design is intended to provide a core system useful inhigher level approaches to computing game solutions, as wellas in helping good game design. For the former we hope toreduce the burden of exploration itself as a concern in researchinto techniques that fully automate gameplay.
Specific contributions of this work include:• We heavily adapt a known variation on occupancy maps
to the task of performing efficient exploration of dungeon-like environments.
• We further extend the exploration algorithm to addressthe presence of secret doors. Locating and stochasticallyrevealing an unknown set of hidden areas adds notablecomplexity and cost to optimizing an exploration algo-rithm.
• Our design is backed by extensive experimental work,validating the approach and comparing it with a simpler,greedy design, as well as exploring the impact of thevariety of different parameterizations available in ourapproach.
This work builds on a previous short (poster) publication,wherein we described the basic exploration algorithm [4]. Herewe significantly extend that work, incorporating discovery ofsecret doors into the greedy and occupancy map algorithms,performing additional experimental comparison in that con-text, and adding a non-trivial regression analysis to betterunderstand the importance of the many individual parametersinvolved in the algorithm design.
II. RELATED WORK
Automated exploration or mapping of an environment hasbeen frequently studied in several fields, primarily includingrobotics and with respect to the problem of graph traversal,with the latter having some connections to video games.
arX
iv:1
711.
0308
7v1
[cs
.AI]
8 N
ov 2
017

2
Exploration in robotics branches into many different top-ics, with some factors being the type of environment to beexplored, amount of prior knowledge about the environment,and accuracy of robotic sensors. One frequently-discussedapproach is simultaneous localization and mapping (SLAM),where a robot must map a space while keeping precise itscurrent position inside said space. Since the environment wedeal with in this paper gives a top-down view and thusaccurate information about player position, we can avoid thisissue. Good surveys of robotic exploration algorithms, withcoverage on the SLAM issue, can be found in [5] and [6].A more general survey of robotic mapping with coverage ofexploration can be found in [7].
One algorithm popular in robotics for exploring unknownenvironments is known as occupancy mapping [8], [9]. Thisapproach, used in conjunction with a mobile robot and plan-ning algorithm, maps out an initially unknown space bymaintaining a grid of cells over the space, with each cellrepresenting the probability that the corresponding area isoccupied (by an obstacle/wall, e.g.). With this data structure,knowledge within a certain confidence margin can be estab-lished about which areas of the space are traversable, with thedata from different sensors being combined to even out sensorinaccuracies.
This sort of representation of the learned map must thenbe leveraged to decide where to move next for efficientexploration. Strategies typically involve an ordering or choiceof frontiers to visit, sometimes determined by an evaluationfunction which takes into account objectives like minimizingdistance travelled or exploring the largest amount of mapthe fastest. Yamauchi described a strategy using occupancymaps to always move towards the closest frontier in order toexplore a space [10], with a focus on how to detect frontiersin imprecise occupancy maps. Gonzalez-Banos and Latombediscussed taking into account both distance to a frontier andthe ‘utility’ of that frontier (a measure of the unexplored areapotentially visible when at that position) [11], also taking intoaccount robotic sensor issues. We use a similar cost-utilitystrategy for our evaluation function, with utility determinedby probabilities in the occupancy map, and cost by distanceto player. Julia showed that a cost-utility method for frontierevaluation explores more of the map faster than the closestfrontier approach, but in the end takes longer to explore theentire map than the latter since it must backtrack to exploreareas of low utility [5]. Further discussion and comparison ofevaluation functions can be found in [12].
The exploration problem in robotics is also related to thecoverage path planning problem, where a robot must determinea path to take that traverses the entirety of a space. Acellular decomposition of the space is used in many suchapproaches. For example, Xu et al. presented an algorithmto guarantee complete coverage of a known environment(containing obstacles) while minimizing distance travelledbased on the boustrophedon cellular decomposition method,which decomposes a space into slices [13]. See Choset [14] fora comprehensive discussion and survey of selected coverageapproaches.
There have also been formulations of exploration in the con-
text of graph traversal. An obvious correspondence exists withthe travelling salesman problem. Kalyanasundarum and Pruhsdescribe the ‘online TSP’ problem as exploring an unknownweighted graph, visiting all vertices while minimizing totalcost, and presented an algorithm to do so efficiently [15].Koenig analyzed a greedy approach to explore an unknowngraph (to always move to the closest frontier), and showed thatthe upper bound for worst-case travel distances for full mapexploration is reasonably small [16], [17]. Hsu and Hwangdemonstrate a provably complete graph-based algorithm forautonomous exploration of an indoor environment [18].
Graph traversal for exploration can also be applied to videogames. Chowdhury looked at approaches for computing atour of a fully known environment in the context of exhaus-tive exploration strategies for non-player characters in videogames [2]. Baier et al. proposed an algorithm to guide an agentthrough both known and partially known terrain in order tocatch a moving target in video games [19]. Hagelback andJohansson explored the use of potential fields to discover un-visited portions of a real-time strategy game map with the goalof creating a better computer AI for the game [20]. Our work,in contrast, focuses on uneven exploration in sparse, dungeon-like environments, where exhaustive approaches compete withcritical resource efficiency.
III. BACKGROUND
Three concepts underpin our work and will be brieflydiscussed below: the particular flavour of occupancy mapsused as the basis for our exploration algorithm; the game usedfor our research environment; and a brief elucidation on theconcept of secret rooms and their presence in video games.
Occupancy Maps in Games
Using the aforementioned occupancy maps from robotics asinspiration, Damian Isla created an algorithm geared towardssearching for a moving target in a video game context [21].The algorithm has been used in at least one game to date [3].
Like the original occupancy map, here a discrete grid ofprobabilities is maintained over a space (e.g., game map), buthere a probability represents confidence in the correspondingarea containing the target or not. A non-player character (NPC)can then use said map to determine where best to move inorder to locate a target (such as the player).
At each timestep, after the NPC moves, probabilities in thegrid will update to account for the target’s movement in thattimestep. At any timestep, the searcher (NPC) can only becompletely confident that the target is not in the cells withinits field-of-view (i.e., those cells will have a probability of0 if the target is not present there). If the target is in sight,then the NPC can simply move towards them; if not, thenprobabilities in the grid will diffuse to their neighbours, toaccount for possible target movements in the areas outsidethe searcher’s current field-of-view. Diffusion for each cell noutside the NPC’s field of view at time t is performed asfollows (assuming each cell has 4 neighbours):Pt+1 (n) = (1− λ)Pt (n) + λ
4
∑n′∈neighbours(n) Pt (n
′)where λ ∈ [0, 1] controls the amount of diffusion.
3
Our implementation of occupancy maps borrows conceptsfrom Isla’s formulation, namely the idea of diffusion, whichis repurposed for an exploration context.
NetHack
NetHack is a popular roguelike video game created in1987 and is used as the environment for our experiments.Gameplay occurs on a two-dimensional text-based grid ofsize 80x20, wherein a player can move around, collect items,fight monsters, and travel to deeper dungeon levels. To winthe game, a player must travel through all 53 levels of thedungeon, fight the high priest of Moloch and collect theAmulet of Yendor, then travel back up through all the levelswhile being pursued by the angry Wizard and finally ascendthrough the five elemental planes [22].
Levels in NetHack consist of large, rectangular rooms(around 8 on average) connected by maze-like corridors.Levels can be sparse, with many empty (non-traversable)tiles. For the most part, levels are created using a proceduralcontent generator, an advantage for conducting research inexploration since an algorithm can be tested on many differentmap configurations. At the start of each level, the player canobserve only their current room with the rest of the maphidden, and must explore to uncover more. An example ofa typical Nethack map is presented in Figure 1; other mapscan be seen in Figures 2 and 6.
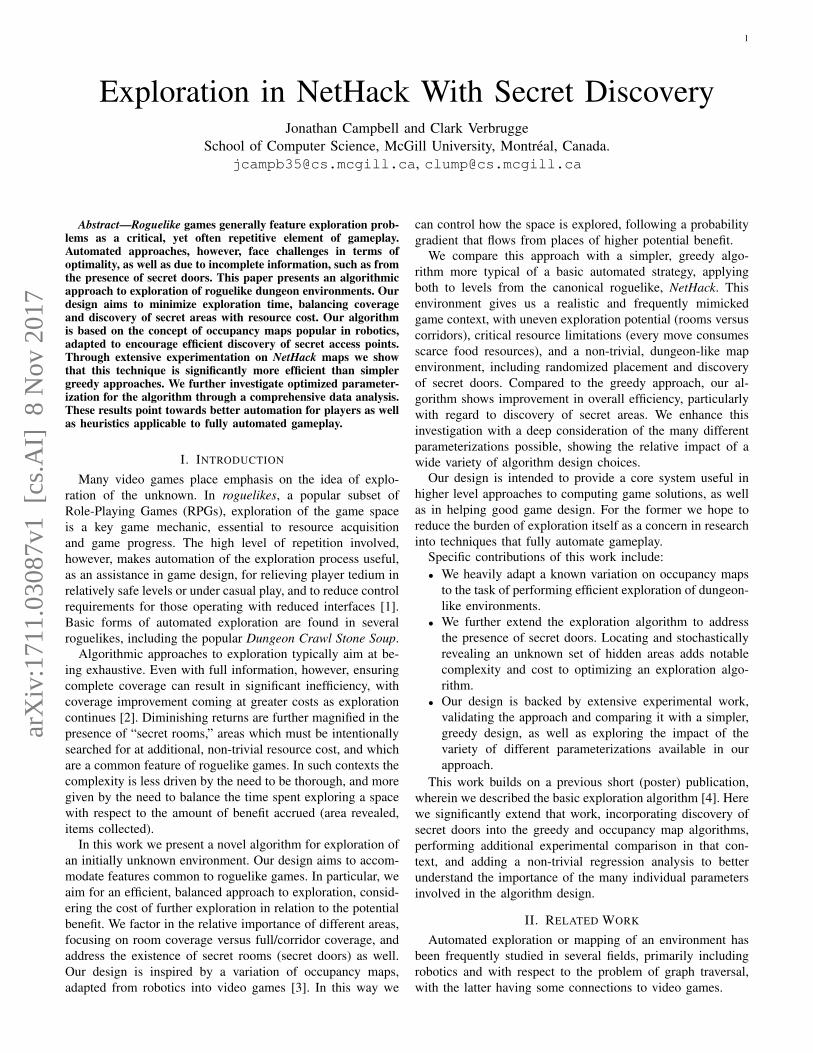
Fig. 1. A game of NetHack where the player (‘@’ character, currentlyin the bottom-left room) has explored most of the level. A typicalNetHack map is composed of corridors (‘#’) that connect rectangularrooms. Room spaces (‘.’) are surrounded by walls (‘|’ and ‘-’), andunopened doors (‘+’), which could lead to other, unvisited rooms, orcycle around to already visited ones.
Although map exploration is important, it is also exigent todo so in a minimal fashion. Movement in NetHack is turn-based (each move taking one turn), and the more turns made,the more hungry one becomes. Hunger can be satiated by food,which is randomly and sparingly placed within the rooms ofa level [23]. Most food does not regenerate after having beenpicked up on a level, so a player must move to new levels ata brisk pace to maintain food supplies. A player that does noteat for an extended period will eventually starve to death andlose the game [24].
In this context, it is critical to minimize the number ofactions taken to explore a level so that food resources are
preserved. Rooms are critical to visit since they may containfood and items that increase player survivability, as well asthe exit to the next level (needed to advance further in thegame). Conversely, the corridors that connect rooms have nointrinsic value. Some may lead to dead-ends or circle aroundto already visited rooms. Exploring all corridors of a level istypically considered a waste of valuable actions. Therefore, agood exploration strategy will minimize visitation of corridorswhile maximizing room visitation.
Secret areas
Secret areas are a popular element of game levels and moti-vate comprehensive exploration of a space. These areas are notimmediately observable by a player and must be discoveredthrough extra action on the player’s part. Secret areas can bea mechanism to reward players for thoroughly exploring anarea, sometimes containing valuable rewards [25]. In certaingenres, secret areas are irrelevant to player power but confera sense of achievement for the player clever enough to findthem. Gaydos & Squire found that hidden areas in the contextof educational games are memorable moments for playersand generate discussion amongst them [26]. Secret areas arecommon in many game genres, being perhaps most prevalentin the roguelike genre, with the prototypical roguelike games(Rogue, NetHack, et al.) all including procedurally-generatedsecret areas. Unlike the areas discussed by Gaydos & Squire,however, procedurally-generated secret areas seem to involveless excitement since the searching process becomes repetitive.
Not much work has been done in terms of algorithms tosearch for secret areas. In terms of NetHack specifically, the‘BotHack’ autonomous player (the first bot to win the game)employs a simple secret area detection strategy. If either theexit to the next level has not yet been found and/or there is alarge rectangular chunk of the level that is unexplored and hasno neighbouring frontiers, it will start searching at positionsthat face that area [27], [28].
NetHack implementation: Secret areas in NetHack are cre-ated during level generation by marking certain traversablespots of the map as hidden. Both corridors as well as doors(areas that transition between rooms and corridors) can bemarked as hidden (with a 1/8 chance for a door, and 1/100chance for a corridor) [29]. On average, there are 7 hiddenspots in a level. These hidden spots initially appear to theplayer as regular room walls (if generated as doors) or asempty spaces (if corridors) and cannot be traversed. The playercan discover and make traversable a hidden spot by movingto a square adjacent to it and using the ‘search’ action, whichconsumes one turn. The player may have to search multipletimes since revealing the secret position is stochastic.
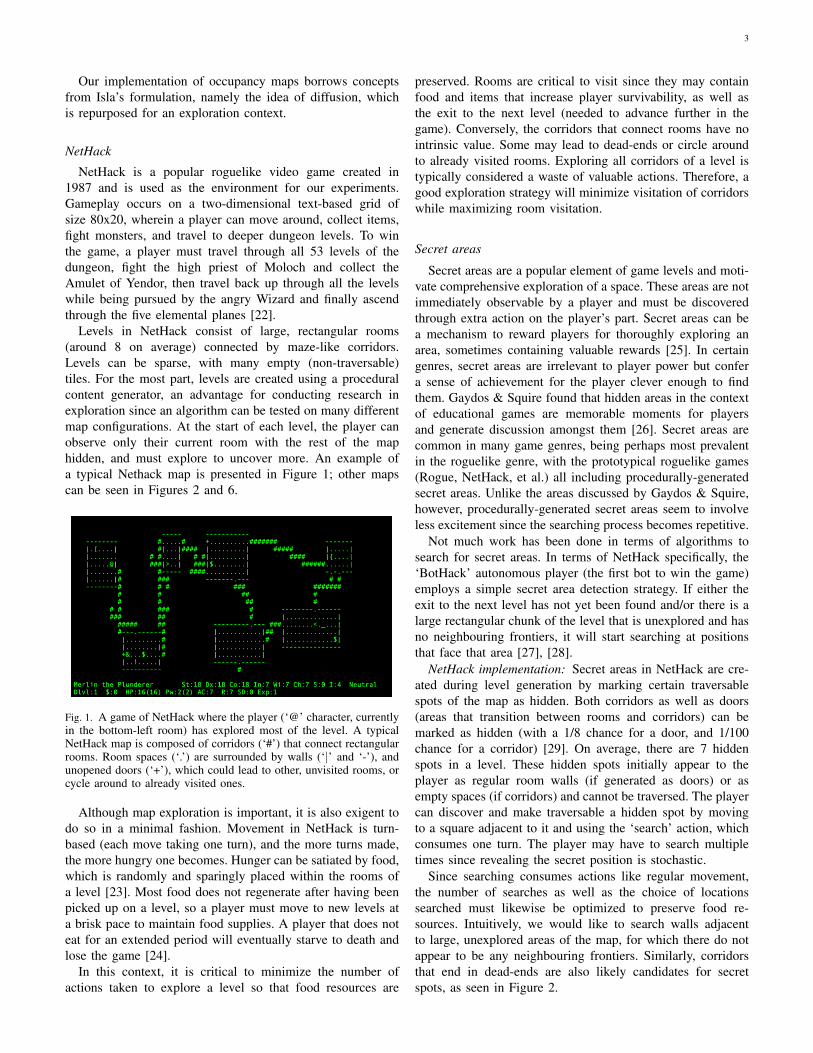
Since searching consumes actions like regular movement,the number of searches as well as the choice of locationssearched must likewise be optimized to preserve food re-sources. Intuitively, we would like to search walls adjacentto large, unexplored areas of the map, for which there do notappear to be any neighbouring frontiers. Similarly, corridorsthat end in dead-ends are also likely candidates for secretspots, as seen in Figure 2.
4
Fig. 2. A NetHack map with the player having visited all non-secretpositions. The vast majority of the map is still hidden, likely dueto the presence of a secret corridor immediately above the player’scurrent position.
With the NetHack method of secret spot generation in mind,it becomes clear that it is not a good idea to attempt to discoverevery single hidden spot on a map. Some secret doors orcorridors may lead to nowhere at all, or perhaps lead to anothersecret door which opens into a room that the player has alreadyvisited. Depending on the map configuration, the player maybe able to easily spot such an occurrence and avoid wastingtime searching in those areas. There is also a tradeoff betweenfinding all disconnected rooms in a map and conserving turns;if there is only a small area of the map that seems to contain ahidden area, then spending a large effort trying to find it maynot be worthwhile.
IV. EXPLORATION APPROACH
Below we detail the basic exploration algorithm involvingoccupancy maps, and contrast it with a simpler, greedy ap-proach as well as an approximately optimal solution. Key toour algorithm is the idea of limiting exploration to a subsetof interesting space in order to minimize exploration time, bytaking into account frontier utility and distance. We begin bydiscussing the modified NetHack environment in which thealgorithms will run, followed by an outline of each algorithmwith and without support for detecting secret areas. Resultsand discussion close the chapter with an emphasis on analysisof algorithm parameters.
Environment
A modified version of the base NetHack game is used totest our exploration algorithms. Mechanics that might alter ex-periment results were removed, including monsters, starvation,weight limitations, locked doors, and certain dungeon featuresthat introduce an irregular field of view. In addition, a switchto enable or disable generation of secret doors and corridorswas added.
The maps used in testing are those generated by NetHack forthe first level of the game. The same level generation algorithmis used throughout a large part of the game, so using mapsfrom only the first level does not limit generality. Later levelscan contain special, fixed structures, but there is no inherentobstacle to running our algorithm on these structures; we are
just mainly interested in applying exploration to the generallevel design (basic room/corridor structure).
The algorithms below use the NetHack player field of view.When a player enters a room in NetHack, they are able toimmediately perceive the entire room shape, size, and exits(doors). In corridors, knowledge is revealed about only theimmediate neighbours to the player’s position. Our algorithmswill gain the same information as the player in these cases.We do not however support ‘peaking’ into rooms, where aplayer can perceive a portion of a room by being parallel toand within a certain distance of one of its doors.
Greedy algorithm
A greedy algorithm is used as baseline for our experiments,which simply always moves to the frontier closest to theplayer. This type of approach is often formalized as a graphexploration problem, where we start at a vertex v, learnthe vertices adjacent to v, move to the closest unvisitedvertex (using the shortest path) and repeat [16]. The algorithmterminates when no frontiers are left. We also take into accountthe particularities of the NetHack field of view as describedabove (when we enter a room, all positions in the room areset to visited, and its exits are added to the frontier list).
Note that this formulation will by nature uncover everytraversable space on the map, both rooms and corridors alike.
Approximately optimal algorithm
For a lower bound on the number of moves needed to visitall rooms on a NetHack map, we present an approximatelyoptimal algorithm. We call the algorithm ‘optimal’ since itwill be given the full map and so can plan the best route totake for room visitation. It is only approximate since it willseek to visit the center of each room, while a faster versioncould move from room exit to room exit, avoiding the centerand thus saving a couple of moves per each room on a map.
To run this algorithm, we construct a complete graph whereeach vertex represents the centroid of a room on the currentNetHack map, and edges between room centroids representthe shortest distance between them in map units (calculatedusing A*). We then pass this graph to a travelling salesmanproblem solver, along with the player’s starting room. In orderto prevent the TSP solver from returning to initial centroid atend, we add two ‘dummy’ vertices, one with a connection toevery other vertex at cost of 0, and the other connected tothe starting room and other dummy vertex with cost of 0, assuggested by [30].
This solution will guarantee exploration of all rooms, butnot necessarily all corridors (similar to the occupancy mapalgorithm, below). It is thus a lower-bound to said algorithm,but of course cannot explore intrinsically since it must knowthe full map in advance.
Note that this problem is similar to the shortest Hamiltonianpath problem, which attempts to find a path that visits eachvertex on a map, but requires that each vertex only be visitedonce which may not be possible in many maps.
5
Occupancy maps
With any exploration strategy, there are two key parts: theinternal representation of the space to be explored, and howsaid representation is used in planning where to move next.Both components of our strategy will be described below, inaddition to a detailed look at how diffusion, a concept fromDamian Isla’s algorithm for searching for a moving target, isused as the engine that drives planning.
The main goal of the algorithm is to optimize explorationtime by prioritizing visitation of areas most likely conferbenefit (rooms) while minimizing time spent in unhelpfulareas (corridors). The combination of an occupancy mapas representation with a frontier list and frontier evaluationfunction will allow for an identification of which frontiers aremore likely to lead to helpful areas. As mentioned earlier, onlythe rooms (and not corridors) of a NetHack level contain food(necessary for survival) and other useful items, so minimizingcorridor visitation (by ignoring certain frontiers) does not haveany drawback with regard to food/item collection.
A key parameter of the algorithm is the probability thresholdvalue. The threshold value controls in a general sense the cut-off for exploration in areas of lower benefit; a higher value willmark more frontiers as unhelpful and thus focus explorationon areas of higher benefit (giving a tradeoff between time andamount explored). This threshold can be fixed at the start of thealgorithm, or in another formulation, it could vary dependingon the percentage of map uncovered (ignoring more frontiersas more of the map gets uncovered).
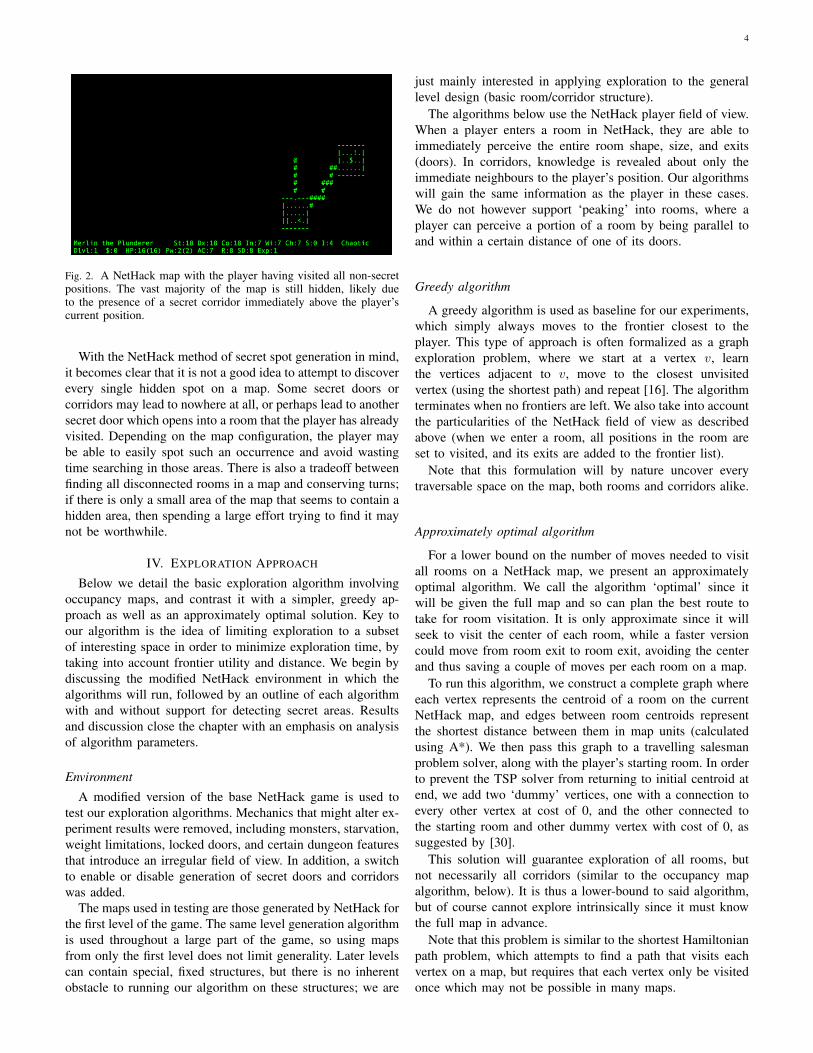
Fig. 3. Visualization of an occupancy map corresponding to theNetHack level of Figure 1. Lighter areas are more likely to contain anundiscovered room. The player is shown as a blue circle, and currenttarget frontier shown as blue triangle. Other frontiers are shown asgreen triangles, while red triangles represent frontiers that will notbe visited due to being in areas of low probability. Components withneighbouring frontiers are highlighted in a criss-cross pattern, whilecomponents without nearby frontiers are not marked.
Representation: To represent the map of a NetHack levelwe use something akin to an occupancy map, which will storeinformation about the map as in robotics. However, there are afew key differences, since our goal is to have a data structurethat helps us determine general areas that are beneficial tovisit (i.e., locations of as yet undiscovered rooms in a NetHackmap), not just locations of obstacles (walls).
In robotics, an occupancy map is used to mark areas thatcontain obstacles; here we use it to mark visited (open) areas.
Each cell of the occupancy map contains a probability, like inrobotics, but instead of representing a combination of sensorreadings, here it is rather an estimate of how likely thatcell/area is to contain an unexplored room. Thus, a cell prob-ability of zero means there is no chance an unexplored roomcan be found in that cell; we thus assign zero probability toany already visited room/corridor cell. Specifically, wheneverwe observe a room/corridor, we add its coordinate(s) to ourmemory; at each timestep, we set the probability of eachcoordinate cell in our memory to 0 in the occupancy map.(These cell probabilities must be reset at each timestep sincethe diffusion step we run may alter them, as detailed below.)After setting a cell to 0 for the first time, we also re-normalizeall other cells in the grid to ensure the total probability sumsto 1.
Figure 3 gives a visualization of a sample occupancy map,with darker areas corresponding to lower probabilities (e.g.,visited rooms/diffused areas).
Diffusion: Diffusion of probabilities is a central conceptin Isla’s algorithm, as mentioned earlier, and we here adaptit for two purposes: to elicit a gradient of probability thatflows from visited areas into unknown areas, in order to bettermeasure the utility of frontiers, as well as to separate theoccupancy map into distinct components of high probability.We leave explanation of the latter purpose for a later section,here discussing the former, as well as describing how andwhen to run diffusion.
Diffusion affects the utility of a frontier. By dispersingthe zero probability of visited rooms into surrounding ar-eas, frontiers close to low probability areas can more easilybe identified and ignored during exploration. This effect isdesirable since these frontiers likely do not lead to as yetundiscovered rooms. These low utility frontiers are shown asred triangles in the occupancy map of Figure 3. In particular, afrontier is ignored when all of its neighbours have probabilitybelow the threshold value. For a more forgiving measure,the neighbours of neighbours could also be checked – orneighbours up to n distance away.
An example of how this diffusion is advantageous can beseen in the NetHack map of Figure 1. At the top of the map,there is a room in the centre that has an unopened door inits top-left corner. A few spaces past this wall, there are someobserved corridors. When the occupancy map algorithm is run,the low probabilities from the visited corridors and room willdiffuse towards each other, lowering the utility of the doorfrontier. This behaviour is desirable since there is no need tovisit a door which has no chance to lead to an undiscoveredroom.
Diffusion is run at each timestep by imparting each cellwith a fragment of the probabilities of its neighbouring cells,as given in the diffusion formula in section III. For extradiffusion, we also diffuse inward from the borders of theoccupancy map. Specifically, when updating cells that lie onthe borders, we treat their out-of-bounds neighbours as havinga fixed low probability. Diffusing in this manner tends toincrease separation of components of high probability (sincerooms/corridors rarely extend to the edge of the map). Moreimportantly, it lessens the utility of frontiers that lie near the

6
t val ← = k, 0 ≥ k ≥ 1 (prob. threshold value)vary t ← True/False (whether to vary prob. threshold)while true do
prob threshold = calculate threshold(t val, vary t)frontiers = get useful frontiers(prob threshold, radius)components = get components(prob threshold, frontiers)
if frontiers = ∅ or components = ∅ thenstop
end ifbest frontier = get best frontier(frontiers, components,prob threshold)player.move to(best frontier)
end while
Fig. 4. Planning overview
components = ∅for each cell in occupancy map do
if cell ≥ prob threshold and cell /∈ components thencomponent = dfs(cell, prob thres., min neighbours)if component.has adjacent frontiers() and|component| ≥ min room size then
components.add(component)end if
end ifend for
Fig. 5. Getting connected components using DFS
borders, which are in fact most likely dead-ends.Diffusion is only run at each timestep that a new part
of the map (room/corridor) is observed. By diffusing onlyat these times, probabilities in the occupancy map will notchange while we are travelling to a frontier through exploredspace (and neither will the length of distance travelled havean effect). Probabilities will diffuse at the rate that map spacesare uncovered, and stop when the map is completely known.
This scheduling is the opposite of the diffusion in Isla’salgorithm, which diffused when the search target was notobserved to account for possible movements of the target. Inour case, however, the ‘targets’ (unexplored rooms) are fixed.
Planning: With this representation in place, we now use theinformation it contains to select the most promising frontier tovisit, while (as previously stated) ignoring frontiers that lie inareas of low probability. To do so, we need a global view ofthe areas of high utility in the map, in the form of collectionsof adjacent cells of high probability, or components. There aretwo basic parts to the process: identifying these components,and then evaluating them to find the most useful one. Firstwe describe reasons for dealing with components instead offrontiers directly.
At any given time, there could be many frontiers: unvisiteddoors in rooms, unvisited spots in corridors, etc. Since wewant to move to frontiers that have the highest probabilityof leading to an unvisited room, the utility of visiting anyparticular frontier should be in some way based on the amountof adjacent cells of high probability in the occupancy map.
For each of these collections of cells, or components, therecould be multiple adjacent frontiers, perhaps right next toeach other, or bordering disparate sides of the component.To make computation easier and better elucidate differencesin value between frontiers, we first determine these generalcomponents, evaluate them (based on utility and distance),then pick the frontier closest to the best component, insteadof dealing with frontiers directly.
Components are retrieved by running a depth-first search(DFS) on the occupancy map, traversing any cell that hasa probability value above the threshold. To further increaseseparation of components, we do not visit cells that have lessthan a certain number of traversable neighbours, which helpsto deal with narrow alleys of high probability cells that couldotherwise connect two disparate components.
Some components are ignored due to small size or absenceof neighbouring frontiers. If a component is smaller than theminimum size of a NetHack room, it is impossible for a roomto be there. Likewise, if a component has no neighbouringfrontiers, it cannot contain a room since there is no accesspoint (unless secret doors/corridors are enabled, as discussedlater). Pseudocode for finding the components in the occu-pancy map is shown in Figure 5.
The visualization of a sample occupancy map in Figure 3gives an idea of this process, with three components high-lighted in different colours using a criss-cross pattern. Each ofthe three are cut off from the others because the neighbouringrooms have diffused towards the edges of the map (and theborder has diffused towards them). Meanwhile, the unmarkedcomponent in the upper-right is ignored since it has noneighbouring frontiers.
The list of remaining components are then passed throughan evaluation function to determine which one best maxi-mizes a combination of utility and distance values. Utilityis calculated by summing the probabilities of all cells in thecomponent. (The sum is then normalized by dividing by thesum of all probabilities in the map.) To determine distance toplayer, the component is first matched to the closest frontier onthe open frontiers list (by calculating the Manhattan distancefrom each frontier to the closest cell in the component).Distance from component to player is then calculated as:d (frontier, player) + d (frontier, closest component cell) withthe first half calculated using A*, and the second half usingManhattan distance (since that part of the path goes throughunknown space). This distance is then normalized by dividingby the sum of the distances for all frontiers for the spe-cific component under evaluation. With the normalized utilityand distance values, we pick the component that maximizesnorm prob+α∗(1−norm dist), where α controls the balanceof the two criteria.
Once the best component is determined, the algorithmmoves to the frontier matched to that component. On arrival,it will learn new information about the game map, update theoccupancy map, and run diffusion. Components will then bere-evaluated and a new frontier chosen. Exploration terminateswhen no interesting frontiers remain. Pseudocode for the mainplanning loop of the exploration approach is presented inFigure 4.
7
Greedy algorithm for secret rooms
A trivial adaptation can be made to the basic greedyalgorithm in order to support searching for secret areas.When entering a room, before proceeding to the next frontier,each wall of the room is searched for secret doors for acertain number of turns. Searches are also performed in dead-end corridors. If a secret door/corridor is discovered uponsearching, it is added to the frontier list as usual. Explorationends when no frontiers or remaining search targets remain.
For efficiency, searching for doors in a room is done byfirst choosing the unsearched wall closest to the player, thenselecting a spot next to the wall that is adjacent to the mostwalls still needing to be searched (since searching can beperformed diagonally).
Note that this approach will not be capable of finding allsecret corridors in a level, since they may (rarely) appearin regular (not dead-end) corridors. However, searching allcorridors would be too strenuous for this edge case. Thebelow occupancy map approach also ignores these rare secretcorridors.
Occupancy maps for secret rooms
The occupancy map algorithm has a natural extension tosupport the discovery of secret door and corridor spots. In theoriginal case, components of high probability in the occupancymap with no neighbouring frontiers would be ignored, buthere, these components are precisely those that we would liketo investigate for potential hidden rooms. Below we detail theadjustments necessary for this extension.
The first modification relates to the component evaluationfunction. Since these ‘hidden’ components have by definitionno bordering frontiers, the distance from player to frontier andfrontier to component used in the evaluation must be adjusted.Instead of using a frontier to calculate distance, we will choosea particular room wall or dead-end corridor adjacent to thehidden component, and calculate distance using that.
The selection of such a room wall or dead-end corridorfor a hidden component requires its own evaluation function.This function will likewise consider both utility and distance.Utility is given by the number of searches already performedat that spot. Distance is taken as the length from the spot to theplayer plus the length from the spot to the closest componentcell. Distance to player is calculated using A*, and distance toclosest cell by Manhattan distance. Walls whose distance fromthe component exceed a certain maximum will be ignored.Both distance and search count are normalized, the former bydividing by the sum of distances for all walls, and the latterby dividing by the sum of search counts for all walls. We thenpick the spot that minimizes norm count+σ∗norm dist, whereσ is the parameter that controls the balance of the two criteria.(The value is minimized in order to penalize larger distanceand higher search counts.)
The selected wall/corridor spot is used in place of a frontierin component evaluation which proceeds as described earlier.If after evaluation a hidden component is selected, then wewill move to the closest traversable spot adjacent to thecomponent’s associated wall/corridor spot. In case of ties in
closest distance, the spot adjacent to the most walls will bechosen to break the tie, since searches performed at a positionwill search all adjacent spots (including diagonally).
When the player reaches the search location, the algorithmwill use the search action for a certain number of turns (aparameterized value), before re-evaluating all components andpotentially choosing a new target. If a secret door or corridorspot is discovered while searching, it is added to the openfrontier list and its probability in the occupancy map is resetto the default value. (Diffusion is then run throughout the mapsince new information has been revealed.)
It is possible for a hidden component to not contain a secretarea. Thus, if a wall or dead-end corridor surpasses a certainnumber of searches (a parameterized value) with no hiddenspots being revealed, it will no longer be considered as a viablesearch target.
Exploration terminates when there no components are left,or only hidden components remain and none have searchablewalls below the maximum search parameter.
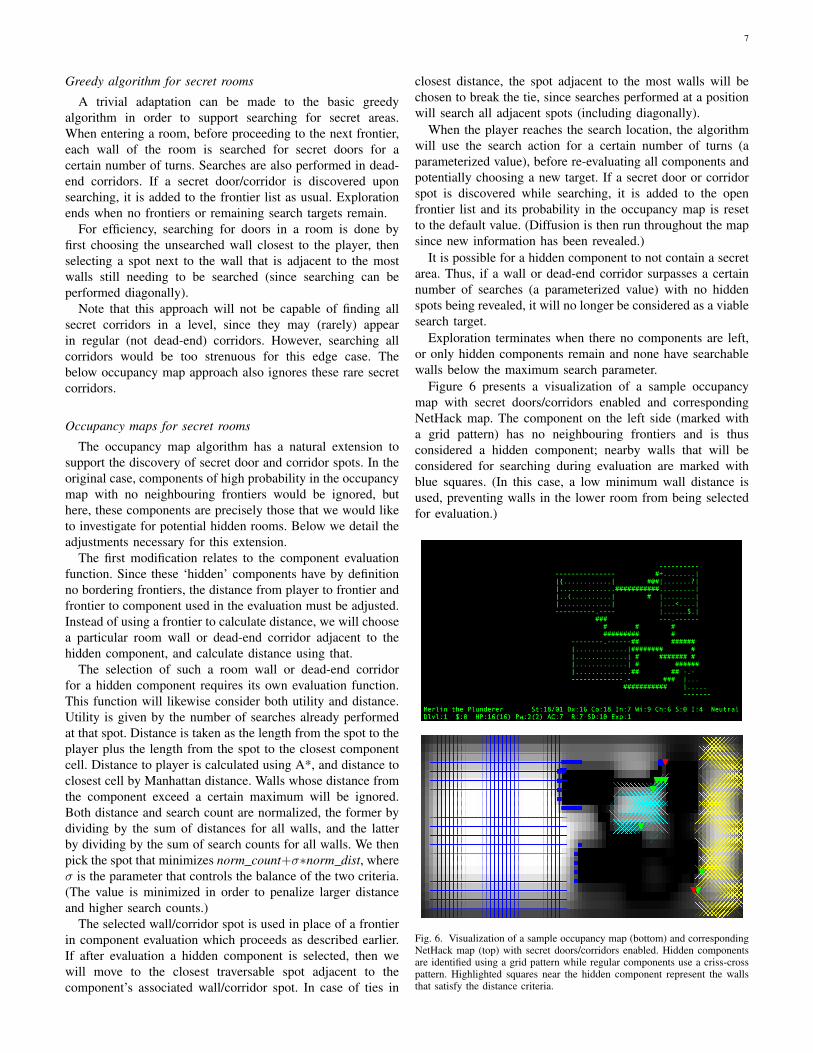
Figure 6 presents a visualization of a sample occupancymap with secret doors/corridors enabled and correspondingNetHack map. The component on the left side (marked witha grid pattern) has no neighbouring frontiers and is thusconsidered a hidden component; nearby walls that will beconsidered for searching during evaluation are marked withblue squares. (In this case, a low minimum wall distance isused, preventing walls in the lower room from being selectedfor evaluation.)
Fig. 6. Visualization of a sample occupancy map (bottom) and correspondingNetHack map (top) with secret doors/corridors enabled. Hidden componentsare identified using a grid pattern while regular components use a criss-crosspattern. Highlighted squares near the hidden component represent the wallsthat satisfy the distance criteria.
8
V. EXPERIMENTAL RESULTS
Results will be shown below for the greedy and occupancymap algorithms as a function of the exhaustive nature of theirsearching, followed by results for the algorithms that cansearch for secret areas. We will look first at the metrics tobe used for comparison of the algorithms.
Exploration metrics
To evaluate the presented exploration strategies, we use asmetrics the average number of actions per game (lower isbetter) as well as average percentage of rooms explored, takenover a number of test runs on randomized NetHack maps. Aswill be seen below, the presented algorithms tend to do quitewell on these metrics. Thus, to get a more fine-grained view ofmap exploration which penalizes non-exhaustive exploration,we also use a third metric which we call the ‘exhaustive’metric. This metric counts only the runs that explored allrooms on a map, with runs that did not counted as zero.We do not use amount of food collected as a metric sincefood is usually uniformly randomly distributed amongst maprooms, and so is highly correlated with the percentage ofrooms explored.
For algorithms that support detection of secret areas, twofurther metrics are used: the average percentage of secret doorsand corridors found, and the average percentage of ‘secretrooms’ found. Neither of these metrics are ideal, however, andit is important to understand limitations in evaluating secretroom discovery.
The average percentage of secret doors/corridors found isproblematic since it does not correlate well with actual benefit– only a handful of secret spots will lead to undiscoveredrooms and so be worth searching for. Further, it is biasedtowards the greedy algorithm, since that algorithm will searchall walls, and so have a higher chance to discover more secretdoors than the occupancy map algorithm, which will onlysearch areas selected by its evaluation function.
The average percentage of ‘secret rooms’ found is alsoproblematic, due to the ambiguous classification of secretrooms. One of the possible ways to define secret rooms in theNetHack context is to classify them as any room not directlyreachable from the player’s initial position in the level. In thiscase, the metric would be dependent on the individual levelconfiguration: a map could exist such that the player actuallystarts in a ‘secret’ room, separated from the rest of the mapby a hidden door, and the algorithm would only have to findthat spot in order to get a full score for this metric.
Further, while almost all maps tend to contain secret doorsor corridors, only approximately half of all maps containsecret rooms as defined above (in the other half, any secretdoors/corridors that exist lead nowhere useful). This discrep-ancy also skews the secret room metric since maps containingno secret rooms will still get a full score using that metric.
Exhaustive approaches
Figure 7 presents results for the exhaustive explorationapproaches (those that explore all rooms on a map). Each result
Approx. opt.
Greedy
Occ. maps
0 100 200 300 400
292
324
122
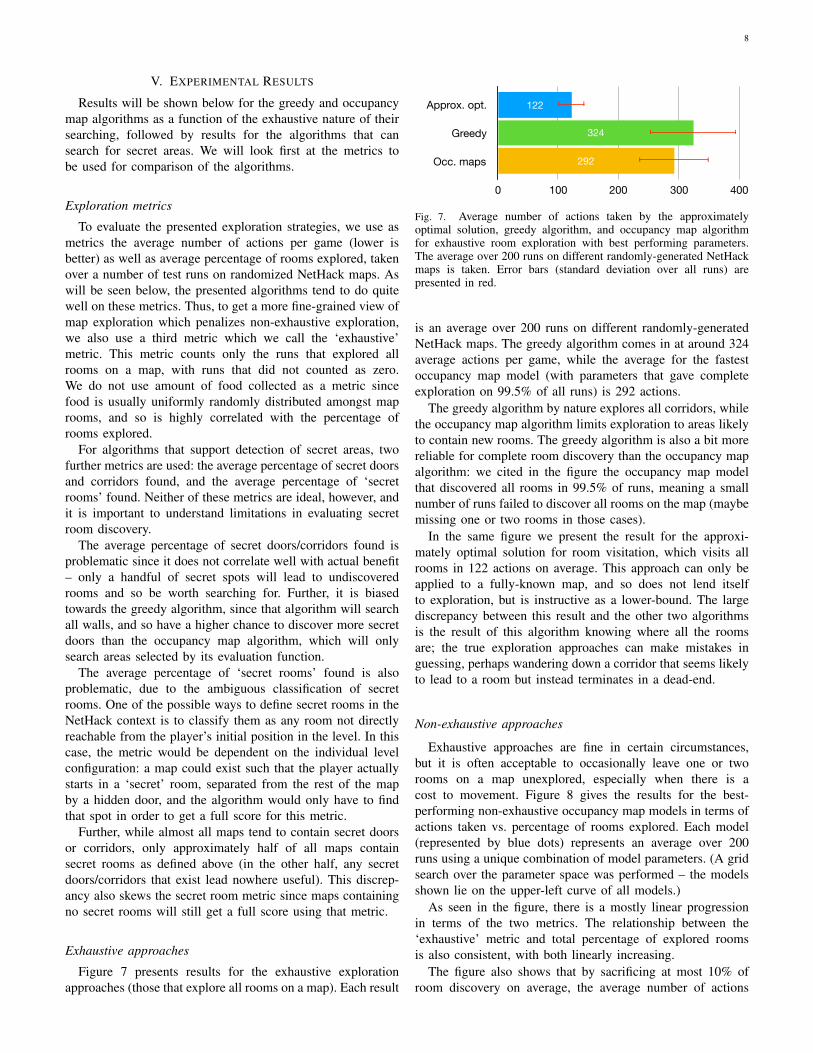
Fig. 7. Average number of actions taken by the approximatelyoptimal solution, greedy algorithm, and occupancy map algorithmfor exhaustive room exploration with best performing parameters.The average over 200 runs on different randomly-generated NetHackmaps is taken. Error bars (standard deviation over all runs) arepresented in red.
is an average over 200 runs on different randomly-generatedNetHack maps. The greedy algorithm comes in at around 324average actions per game, while the average for the fastestoccupancy map model (with parameters that gave completeexploration on 99.5% of all runs) is 292 actions.
The greedy algorithm by nature explores all corridors, whilethe occupancy map algorithm limits exploration to areas likelyto contain new rooms. The greedy algorithm is also a bit morereliable for complete room discovery than the occupancy mapalgorithm: we cited in the figure the occupancy map modelthat discovered all rooms in 99.5% of runs, meaning a smallnumber of runs failed to discover all rooms on the map (maybemissing one or two rooms in those cases).
In the same figure we present the result for the approxi-mately optimal solution for room visitation, which visits allrooms in 122 actions on average. This approach can only beapplied to a fully-known map, and so does not lend itselfto exploration, but is instructive as a lower-bound. The largediscrepancy between this result and the other two algorithmsis the result of this algorithm knowing where all the roomsare; the true exploration approaches can make mistakes inguessing, perhaps wandering down a corridor that seems likelyto lead to a room but instead terminates in a dead-end.
Non-exhaustive approaches
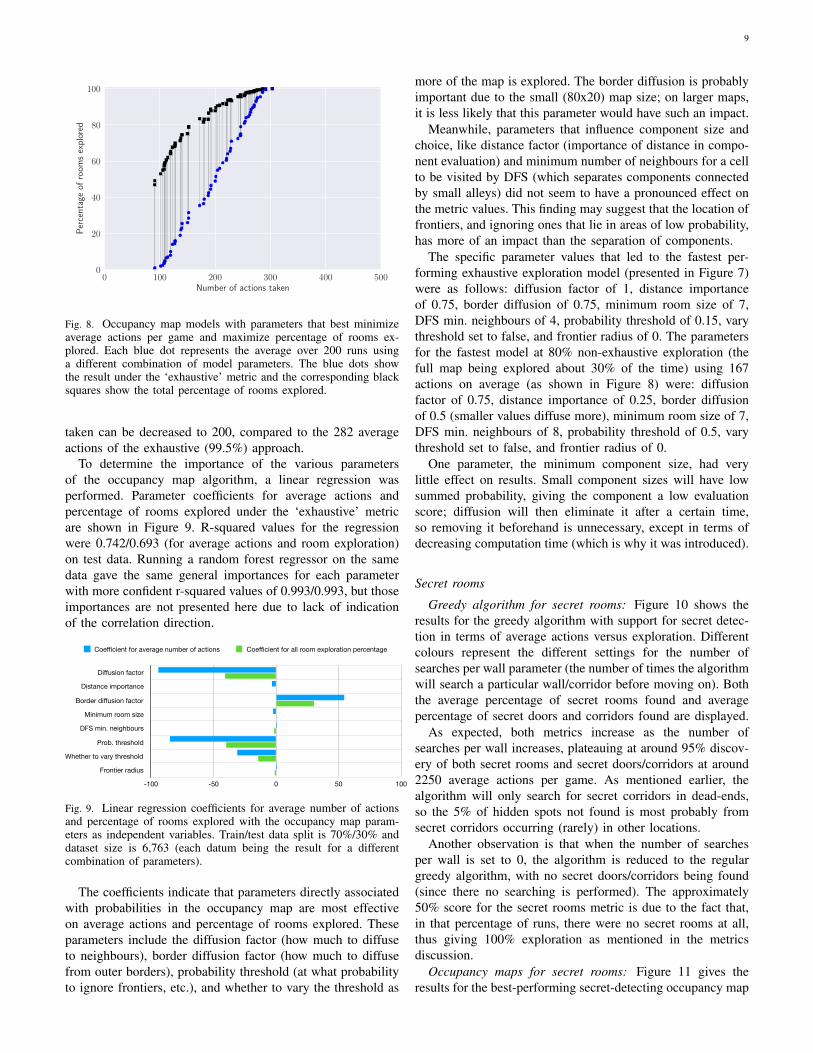
Exhaustive approaches are fine in certain circumstances,but it is often acceptable to occasionally leave one or tworooms on a map unexplored, especially when there is acost to movement. Figure 8 gives the results for the best-performing non-exhaustive occupancy map models in terms ofactions taken vs. percentage of rooms explored. Each model(represented by blue dots) represents an average over 200runs using a unique combination of model parameters. (A gridsearch over the parameter space was performed – the modelsshown lie on the upper-left curve of all models.)
As seen in the figure, there is a mostly linear progressionin terms of the two metrics. The relationship between the‘exhaustive’ metric and total percentage of explored roomsis also consistent, with both linearly increasing.
The figure also shows that by sacrificing at most 10% ofroom discovery on average, the average number of actions
9
0 100 200 300 400 500Number of actions taken
0
20
40
60
80
100P
erce
ntag
eof
room
sex
plor
ed
Fig. 8. Occupancy map models with parameters that best minimizeaverage actions per game and maximize percentage of rooms ex-plored. Each blue dot represents the average over 200 runs usinga different combination of model parameters. The blue dots showthe result under the ‘exhaustive’ metric and the corresponding blacksquares show the total percentage of rooms explored.
taken can be decreased to 200, compared to the 282 averageactions of the exhaustive (99.5%) approach.
To determine the importance of the various parametersof the occupancy map algorithm, a linear regression wasperformed. Parameter coefficients for average actions andpercentage of rooms explored under the ‘exhaustive’ metricare shown in Figure 9. R-squared values for the regressionwere 0.742/0.693 (for average actions and room exploration)on test data. Running a random forest regressor on the samedata gave the same general importances for each parameterwith more confident r-squared values of 0.993/0.993, but thoseimportances are not presented here due to lack of indicationof the correlation direction.
Diffusion factor
Distance importance
Border diffusion factor
Minimum room size
DFS min. neighbours
Prob. threshold
Whether to vary threshold
Frontier radius
-100 -50 0 50 100
Coefficient for average number of actions Coefficient for all room exploration percentage
Fig. 9. Linear regression coefficients for average number of actionsand percentage of rooms explored with the occupancy map param-eters as independent variables. Train/test data split is 70%/30% anddataset size is 6,763 (each datum being the result for a differentcombination of parameters).
The coefficients indicate that parameters directly associatedwith probabilities in the occupancy map are most effectiveon average actions and percentage of rooms explored. Theseparameters include the diffusion factor (how much to diffuseto neighbours), border diffusion factor (how much to diffusefrom outer borders), probability threshold (at what probabilityto ignore frontiers, etc.), and whether to vary the threshold as
more of the map is explored. The border diffusion is probablyimportant due to the small (80x20) map size; on larger maps,it is less likely that this parameter would have such an impact.
Meanwhile, parameters that influence component size andchoice, like distance factor (importance of distance in compo-nent evaluation) and minimum number of neighbours for a cellto be visited by DFS (which separates components connectedby small alleys) did not seem to have a pronounced effect onthe metric values. This finding may suggest that the location offrontiers, and ignoring ones that lie in areas of low probability,has more of an impact than the separation of components.
The specific parameter values that led to the fastest per-forming exhaustive exploration model (presented in Figure 7)were as follows: diffusion factor of 1, distance importanceof 0.75, border diffusion of 0.75, minimum room size of 7,DFS min. neighbours of 4, probability threshold of 0.15, varythreshold set to false, and frontier radius of 0. The parametersfor the fastest model at 80% non-exhaustive exploration (thefull map being explored about 30% of the time) using 167actions on average (as shown in Figure 8) were: diffusionfactor of 0.75, distance importance of 0.25, border diffusionof 0.5 (smaller values diffuse more), minimum room size of 7,DFS min. neighbours of 8, probability threshold of 0.5, varythreshold set to false, and frontier radius of 0.
One parameter, the minimum component size, had verylittle effect on results. Small component sizes will have lowsummed probability, giving the component a low evaluationscore; diffusion will then eliminate it after a certain time,so removing it beforehand is unnecessary, except in terms ofdecreasing computation time (which is why it was introduced).
Secret rooms
Greedy algorithm for secret rooms: Figure 10 shows theresults for the greedy algorithm with support for secret detec-tion in terms of average actions versus exploration. Differentcolours represent the different settings for the number ofsearches per wall parameter (the number of times the algorithmwill search a particular wall/corridor before moving on). Boththe average percentage of secret rooms found and averagepercentage of secret doors and corridors found are displayed.
As expected, both metrics increase as the number ofsearches per wall increases, plateauing at around 95% discov-ery of both secret rooms and secret doors/corridors at around2250 average actions per game. As mentioned earlier, thealgorithm will only search for secret corridors in dead-ends,so the 5% of hidden spots not found is most probably fromsecret corridors occurring (rarely) in other locations.
Another observation is that when the number of searchesper wall is set to 0, the algorithm is reduced to the regulargreedy algorithm, with no secret doors/corridors being found(since there no searching is performed). The approximately50% score for the secret rooms metric is due to the fact that,in that percentage of runs, there were no secret rooms at all,thus giving 100% exploration as mentioned in the metricsdiscussion.
Occupancy maps for secret rooms: Figure 11 gives theresults for the best-performing secret-detecting occupancy map
10
0 500 1000 1500 2000 2500 3000Number of actions taken
0
20
40
60
80
100P
erce
ntag
eof
room
sex
plor
ed
nspw = 00
nspw = 01
nspw = 05
nspw = 10
nspw = 15
nspw = 20
nspw = 25
nspw = 30
Fig. 10. Greedy algorithm with support for secret door/corridor detec-tion with varying values for number of searches per wall parameter(‘nspw’). The average percentage of secret rooms found is representedby diamonds while average percentage of secret doors/corridors foundis represented by stars.
0 500 1000 1500 2000 2500 3000Number of actions taken
0
20
40
60
80
100
Per
cent
age
ofro
oms
expl
ored
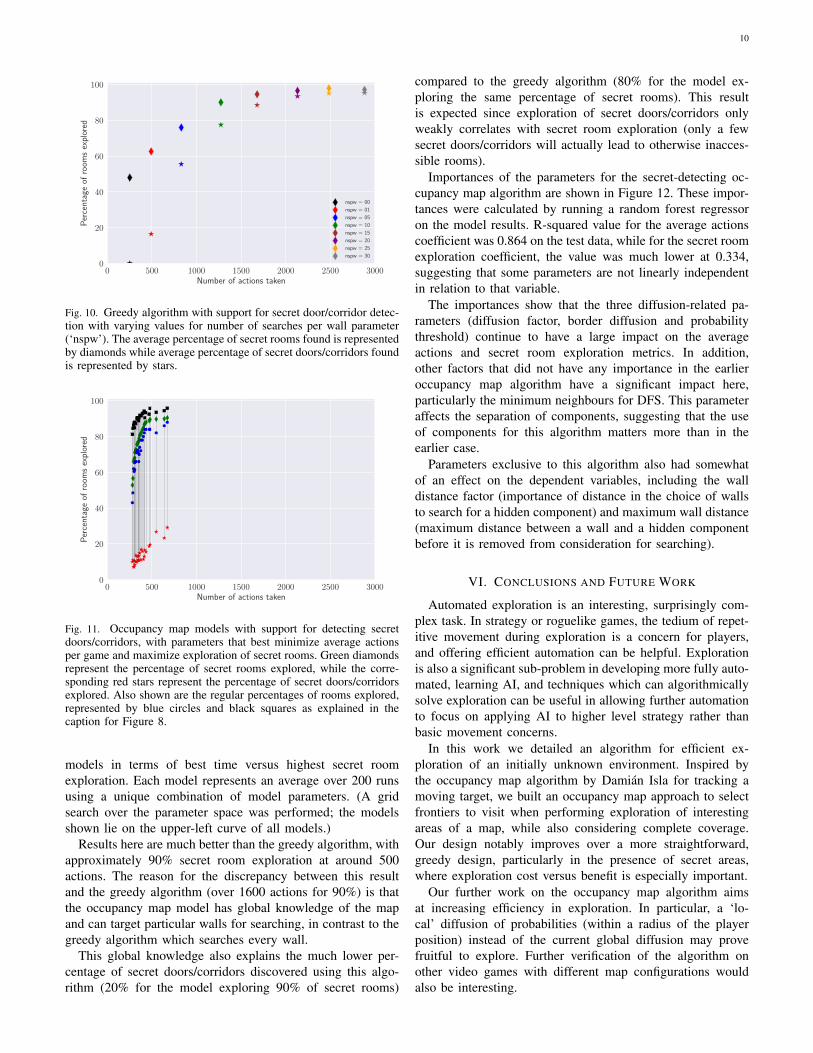
Fig. 11. Occupancy map models with support for detecting secretdoors/corridors, with parameters that best minimize average actionsper game and maximize exploration of secret rooms. Green diamondsrepresent the percentage of secret rooms explored, while the corre-sponding red stars represent the percentage of secret doors/corridorsexplored. Also shown are the regular percentages of rooms explored,represented by blue circles and black squares as explained in thecaption for Figure 8.
models in terms of best time versus highest secret roomexploration. Each model represents an average over 200 runsusing a unique combination of model parameters. (A gridsearch over the parameter space was performed; the modelsshown lie on the upper-left curve of all models.)
Results here are much better than the greedy algorithm, withapproximately 90% secret room exploration at around 500actions. The reason for the discrepancy between this resultand the greedy algorithm (over 1600 actions for 90%) is thatthe occupancy map model has global knowledge of the mapand can target particular walls for searching, in contrast to thegreedy algorithm which searches every wall.
This global knowledge also explains the much lower per-centage of secret doors/corridors discovered using this algo-rithm (20% for the model exploring 90% of secret rooms)
compared to the greedy algorithm (80% for the model ex-ploring the same percentage of secret rooms). This resultis expected since exploration of secret doors/corridors onlyweakly correlates with secret room exploration (only a fewsecret doors/corridors will actually lead to otherwise inacces-sible rooms).
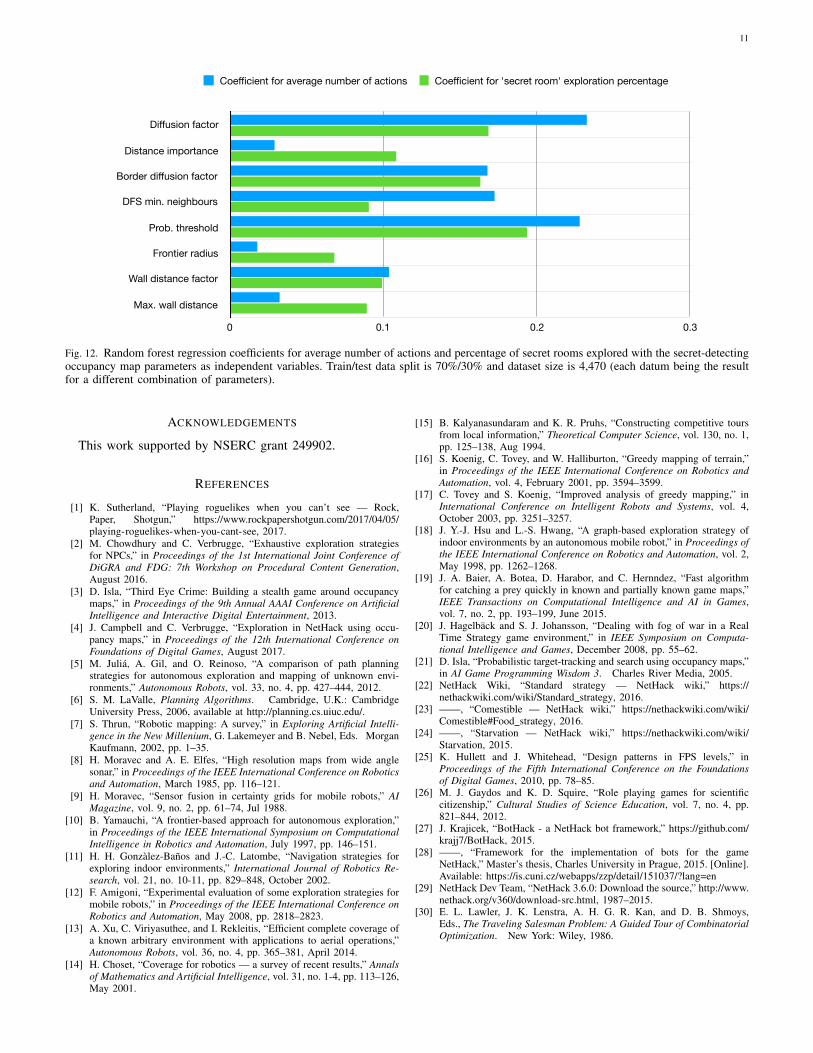
Importances of the parameters for the secret-detecting oc-cupancy map algorithm are shown in Figure 12. These impor-tances were calculated by running a random forest regressoron the model results. R-squared value for the average actionscoefficient was 0.864 on the test data, while for the secret roomexploration coefficient, the value was much lower at 0.334,suggesting that some parameters are not linearly independentin relation to that variable.
The importances show that the three diffusion-related pa-rameters (diffusion factor, border diffusion and probabilitythreshold) continue to have a large impact on the averageactions and secret room exploration metrics. In addition,other factors that did not have any importance in the earlieroccupancy map algorithm have a significant impact here,particularly the minimum neighbours for DFS. This parameteraffects the separation of components, suggesting that the useof components for this algorithm matters more than in theearlier case.
Parameters exclusive to this algorithm also had somewhatof an effect on the dependent variables, including the walldistance factor (importance of distance in the choice of wallsto search for a hidden component) and maximum wall distance(maximum distance between a wall and a hidden componentbefore it is removed from consideration for searching).
VI. CONCLUSIONS AND FUTURE WORK
Automated exploration is an interesting, surprisingly com-plex task. In strategy or roguelike games, the tedium of repet-itive movement during exploration is a concern for players,and offering efficient automation can be helpful. Explorationis also a significant sub-problem in developing more fully auto-mated, learning AI, and techniques which can algorithmicallysolve exploration can be useful in allowing further automationto focus on applying AI to higher level strategy rather thanbasic movement concerns.
In this work we detailed an algorithm for efficient ex-ploration of an initially unknown environment. Inspired bythe occupancy map algorithm by Damian Isla for tracking amoving target, we built an occupancy map approach to selectfrontiers to visit when performing exploration of interestingareas of a map, while also considering complete coverage.Our design notably improves over a more straightforward,greedy design, particularly in the presence of secret areas,where exploration cost versus benefit is especially important.
Our further work on the occupancy map algorithm aimsat increasing efficiency in exploration. In particular, a ‘lo-cal’ diffusion of probabilities (within a radius of the playerposition) instead of the current global diffusion may provefruitful to explore. Further verification of the algorithm onother video games with different map configurations wouldalso be interesting.
11
Diffusion factor
Distance importance
Border diffusion factor
DFS min. neighbours
Prob. threshold
Frontier radius
Wall distance factor
Max. wall distance
0 0.1 0.2 0.3
Coefficient for average number of actions Coefficient for 'secret room' exploration percentage
Fig. 12. Random forest regression coefficients for average number of actions and percentage of secret rooms explored with the secret-detectingoccupancy map parameters as independent variables. Train/test data split is 70%/30% and dataset size is 4,470 (each datum being the resultfor a different combination of parameters).
ACKNOWLEDGEMENTS
This work supported by NSERC grant 249902.
REFERENCES
[1] K. Sutherland, “Playing roguelikes when you can’t see — Rock,Paper, Shotgun,” https://www.rockpapershotgun.com/2017/04/05/playing-roguelikes-when-you-cant-see, 2017.
[2] M. Chowdhury and C. Verbrugge, “Exhaustive exploration strategiesfor NPCs,” in Proceedings of the 1st International Joint Conference ofDiGRA and FDG: 7th Workshop on Procedural Content Generation,August 2016.
[3] D. Isla, “Third Eye Crime: Building a stealth game around occupancymaps,” in Proceedings of the 9th Annual AAAI Conference on ArtificialIntelligence and Interactive Digital Entertainment, 2013.
[4] J. Campbell and C. Verbrugge, “Exploration in NetHack using occu-pancy maps,” in Proceedings of the 12th International Conference onFoundations of Digital Games, August 2017.
[5] M. Julia, A. Gil, and O. Reinoso, “A comparison of path planningstrategies for autonomous exploration and mapping of unknown envi-ronments,” Autonomous Robots, vol. 33, no. 4, pp. 427–444, 2012.
[6] S. M. LaValle, Planning Algorithms. Cambridge, U.K.: CambridgeUniversity Press, 2006, available at http://planning.cs.uiuc.edu/.
[7] S. Thrun, “Robotic mapping: A survey,” in Exploring Artificial Intelli-gence in the New Millenium, G. Lakemeyer and B. Nebel, Eds. MorganKaufmann, 2002, pp. 1–35.
[8] H. Moravec and A. E. Elfes, “High resolution maps from wide anglesonar,” in Proceedings of the IEEE International Conference on Roboticsand Automation, March 1985, pp. 116–121.
[9] H. Moravec, “Sensor fusion in certainty grids for mobile robots,” AIMagazine, vol. 9, no. 2, pp. 61–74, Jul 1988.
[10] B. Yamauchi, “A frontier-based approach for autonomous exploration,”in Proceedings of the IEEE International Symposium on ComputationalIntelligence in Robotics and Automation, July 1997, pp. 146–151.
[11] H. H. Gonzalez-Banos and J.-C. Latombe, “Navigation strategies forexploring indoor environments,” International Journal of Robotics Re-search, vol. 21, no. 10-11, pp. 829–848, October 2002.
[12] F. Amigoni, “Experimental evaluation of some exploration strategies formobile robots,” in Proceedings of the IEEE International Conference onRobotics and Automation, May 2008, pp. 2818–2823.
[13] A. Xu, C. Viriyasuthee, and I. Rekleitis, “Efficient complete coverage ofa known arbitrary environment with applications to aerial operations,”Autonomous Robots, vol. 36, no. 4, pp. 365–381, April 2014.
[14] H. Choset, “Coverage for robotics — a survey of recent results,” Annalsof Mathematics and Artificial Intelligence, vol. 31, no. 1-4, pp. 113–126,May 2001.
[15] B. Kalyanasundaram and K. R. Pruhs, “Constructing competitive toursfrom local information,” Theoretical Computer Science, vol. 130, no. 1,pp. 125–138, Aug 1994.
[16] S. Koenig, C. Tovey, and W. Halliburton, “Greedy mapping of terrain,”in Proceedings of the IEEE International Conference on Robotics andAutomation, vol. 4, February 2001, pp. 3594–3599.
[17] C. Tovey and S. Koenig, “Improved analysis of greedy mapping,” inInternational Conference on Intelligent Robots and Systems, vol. 4,October 2003, pp. 3251–3257.
[18] J. Y.-J. Hsu and L.-S. Hwang, “A graph-based exploration strategy ofindoor environments by an autonomous mobile robot,” in Proceedings ofthe IEEE International Conference on Robotics and Automation, vol. 2,May 1998, pp. 1262–1268.
[19] J. A. Baier, A. Botea, D. Harabor, and C. Hernndez, “Fast algorithmfor catching a prey quickly in known and partially known game maps,”IEEE Transactions on Computational Intelligence and AI in Games,vol. 7, no. 2, pp. 193–199, June 2015.
[20] J. Hagelback and S. J. Johansson, “Dealing with fog of war in a RealTime Strategy game environment,” in IEEE Symposium on Computa-tional Intelligence and Games, December 2008, pp. 55–62.
[21] D. Isla, “Probabilistic target-tracking and search using occupancy maps,”in AI Game Programming Wisdom 3. Charles River Media, 2005.
[22] NetHack Wiki, “Standard strategy — NetHack wiki,” https://nethackwiki.com/wiki/Standard strategy, 2016.
[23] ——, “Comestible — NetHack wiki,” https://nethackwiki.com/wiki/Comestible#Food strategy, 2016.
[24] ——, “Starvation — NetHack wiki,” https://nethackwiki.com/wiki/Starvation, 2015.
[25] K. Hullett and J. Whitehead, “Design patterns in FPS levels,” inProceedings of the Fifth International Conference on the Foundationsof Digital Games, 2010, pp. 78–85.
[26] M. J. Gaydos and K. D. Squire, “Role playing games for scientificcitizenship,” Cultural Studies of Science Education, vol. 7, no. 4, pp.821–844, 2012.
[27] J. Krajicek, “BotHack - a NetHack bot framework,” https://github.com/krajj7/BotHack, 2015.
[28] ——, “Framework for the implementation of bots for the gameNetHack,” Master’s thesis, Charles University in Prague, 2015. [Online].Available: https://is.cuni.cz/webapps/zzp/detail/151037/?lang=en
[29] NetHack Dev Team, “NetHack 3.6.0: Download the source,” http://www.nethack.org/v360/download-src.html, 1987–2015.
[30] E. L. Lawler, J. K. Lenstra, A. H. G. R. Kan, and D. B. Shmoys,Eds., The Traveling Salesman Problem: A Guided Tour of CombinatorialOptimization. New York: Wiley, 1986.

![The NetHack Learning Environmenttowards testing systematic generalization of RL methods [e.g., 39, 38, 60, 18]. Here, the environment observation is generated programmatically in every](https://img.dokumen.tips/doc/110x75/5fda8a70032a7b2b7d180c81/the-nethack-learning-environment-towards-testing-systematic-generalization-of-rl.jpg)