Embed Size (px)
Citation preview
Exploiting Spatio-Temporal Correlations withMultiple 3D Convolutional Neural Networks for
Citywide Vehicle Flow PredictionCen Chen1, Kenli Li1,* Sin G. Teo2, Guizi Chen2, Xiaofeng Zou1, Xulei Yang2,
Ramaseshan C. Vijay2, Jiashi Feng3 and Zeng Zeng2,4,*
1College of Information Science and Engineering, Hunan University, China{chencen, lkl, zouxiaofeng}@hnu.edu.cn
2Institute for Infocomm Research, Singapore{teosg, chengz, yang xulei, vijay, zengz}@i2r.a-star.edu.sg
3 National University of Singapore, Singapore, [email protected] School of Shipping and Naval Architecture, Chongqing Jiaotong University, China
Abstract—Predicting vehicle flows is of great importance totraffic management and public safety in smart cities, and verychallenging as it is affected by many complex factors, such asspatio-temporal dependencies with external factors (e.g., holi-days, events and weather). Recently, deep learning has shownremarkable performance on traditional challenging tasks, suchas image classification, due to its powerful feature learningcapabilities. Some works have utilized LSTMs to connect thehigh-level layers of 2D convolutional neural networks (CNNs)to learn the spatio-temporal features, and have shown betterperformance as compared to many classical methods in trafficprediction. However, these works only build temporal connectionson the high-level features at the top layer while leaving thespatio-temporal correlations in the low-level layers not fullyexploited. In this paper, we propose to apply 3D CNNs tolearn the spatio-temporal correlation features jointly from low-level to high-level layers for traffic data. We also design anend-to-end structure, named as MST3D, especially for vehicleflow prediction. MST3D can learn spatial and multiple temporaldependencies jointly by multiple 3D CNNs, combine the learnedfeatures with external factors and assign different weights todifferent branches dynamically. To the best of our knowledge, itis the first framework that utilizes 3D CNNs for traffic prediction.Experiments on two vehicle flow datasets Beijing and New YorkCity have demonstrated that the proposed framework, MST3D,outperforms the state-of-the-art methods.
Index Terms—3D CNNs, spatio-temporal dependencies, trafficprediction, vehicle flow prediction.
I. INTRODUCTION
Traffic prediction is of great importance to the trafficmanagement, public safety, and environmental pollution [1].Vehicle flow prediction is one of vital activities in trafficprediction [2]. The latest report from the United Nations [3]
*They are corresponding authors of this paper.The research was partially funded by the National Key R&D Program
of China (Grant No.2018YFB1003401), the National Outstanding YouthScience Program of National Natural Science Foundation of China (GrantNo. 61625202), the International (Regional) Cooperation and ExchangeProgram of National Natural Science Foundation of China (Grant No.61661146006, 61860206011), the National Natural Science Foundation ofChina (Grant No.61602350), the Singapore-China NRF-NSFC Grant (GrantNo. NRF2016NRF-NSFC001-111).
states that more than 55% of the world’s population now livesin city areas in 2017. Many researchers attempt to use machinelearning techniques to predict traffic flows so as to avoid trafficcongestion situations in cities. A city first can be dividedinto many small regions. The inflow and outflow of a regionare the number of vehicles that have entered the region andthe number of vehicles that have left the region, respectively.Predicting the traffic condition in every region of a city canbe basically affected by three categories of important factorsas follows.
Factor 1: Spatial dependencies. The inflow of one region(i.e., ri) of a city can be affected by outflows of its nearby anddistant regions. The nearby regions are the neighbors whichare either adjacent or near to the border of the region ri andthe distant regions otherwise. In a similar way, the outflow ofthat region ri can affect other regions of the city. Besides, itis affected by its own inflow of the region ri.
Factor 2: Multiple temporal dependencies. The inflow andoutflow of the region ri of the city are affected by short,middle, and long term intervals. For example, the trafficcongestion of the region ri occurring at 6 pm will affect theregion’s traffic condition at the following hour, i.e., 7 pm.For example, rush hour pattern repeats every 24 hours on theworkdays.
Factor 3: External factors. The inflow and outflow of theregion ri can be directly affected by external factors such asvehicle accidents, road maintenance, weather conditions, andother special events.
Many existing machine learning techniques have been usedin traffic prediction, e.g., k-nearest neighbours (KNN) [4],and support vector machines (SVM) [5]. The fast develop-ment of neural networks in recent years, especially in deeplearning techniques, provides flexibility and generalizabilityto perform prediction on large multi-dimensional data (e.g,image and video recognition, and bioinformatics). CNN is
893
2018 IEEE International Conference on Data Mining
978-1-5386-9159-5/18/$31.00 ©2018 IEEEDOI 10.1109/ICDM.2018.00107
one of the most commonly-used neural networks for trafficprediction problems. Many studies use two dimensional CNN(2D CNN) and LSTM [6]–[9] to capture spatio-temporalfeature of traffic data. The models of the methods only connecttemporal features at the high level of spatial features, while notconnecting temporal features at low-level of spatial features.In this regards, the temporal correlations of the low-levelspatial features cannot be fully exploited. Therefore, somediscriminative features cannot be extracted so as to improvethe traffic prediction accuracy.
To overcome the limitations, we propose a novel spatio-temporal correlation based multiple 3D CNNs architecture(MST3D) in this work. The proposed MST3D builds a trafficprediction model considering all the three categories of fac-tors as discussed above. To the best of our knowledge, ourproposed MST3D is the first time that 3D CNNs are appliedin the traffic prediction problem and our proposed MST3Dcan capture both low-level and high-level layers of spatio-temporal features jointly. In this paper, our contributions aresummarized in the following.
• We propose to utilize novel spatio-temporal correlationbased 3D convolutional neural networks (3D CNNs)to learn the spatio-temporal features jointly for trafficprediction. The spatio-temporal correlation features canbe extracted and learned simultaneously for traffic datafrom low-level to high-level layers.
• We design a neural network framework, named asMST3D, based on multiple 3D CNNs for vehicle flowprediction, considering spatial and multiple temporal de-pendencies with external factors. The MST3D can com-bine the output features of the multiple 3D CNNs withexternal factors, assigning different weights to differentbranches dynamically. The inflow and outflow of vehiclescan be jointly predicted in our framework
• We evaluate our approach using Beijing taxi and NYCbike datasets. The results demonstrate the advantages ofour proposed MST3D over other state-of-the-art methodsin the literature.
II. RELATED WORK
In recent years, many researchers have used different trafficprediction approaches to solve traffic prediction problemsoccurred in many cities. Classical statistical methods can con-struct different linear or non-linear models to predict the trafficflow, such as Markov chain [10], Bayesian networks [11], andAuto-regressive Integrated Moving Average (ARIMA) [12]–[14], are constructed to solve time-series traffic predictionproblems. These models can give better correlations on thesuccessive time sequences of traffic variables. However, theystill cannot capture most of important spatial and temporalfeatures in the traffic network. However, it is hard for theclassical statistical methods to discover the non-linear spatialand temporal relations of traffic networks..
Unlike the classical statistical methods, ANNs can easilycapture the non-linear spatial and temporal relations amongthe spatiotemporal data. Hence, ANNs are widely applied
in different fields such as speech recognition [15], computervision [16], and many more. Another neural network, CNN,can extract the spatial dependencies of the traffic networksby converting the dynamic traffic data into images [17]. But,these neural networks can only capture spatial or temporalinformation or correlation of the traffic flow data respectively.To overcome the limitation, some combinations of both RNNand CNN networks [6], [9], [18]–[20] have been proposedto learn spatial and temporal dependencies. Yu et al. [8]proposed a deep LSTM model and mixture deep LSTMmodel using the normal traffic hours and the incident trafficperiod, respectively. Yao et al. [9] proposed a multi-viewspatio-temporal network that combines local CNN, LSTM andsemantic network to predict short-time traffic condition.
III. PROBLEM DEFINITION AND ANALYSIS
A. Citywide Traffic Prediction Problem
In this section, we shall first define the citywide trafficprediction problem and the corresponding notations as follows.
Definition 1 (Citywide Region): Following the previousstudies [6], [17], [20], [21], we divide a city into an I×J gridmap based on the longitude and latitude where a grid denotesa region. The regions in the grid map could be defined as non-overlapping pairs (i, j) where i and j mean the region is inthe ith row and the jth column of the grid map.
Definition 2 (Citywide Vehicle Flow): Following the pre-vious studies [6], [20], let P be a collection of trajectories att time interval. For a grid (i, j) that lies at the i row and thej column, the inflow and outflow of the vehicles at the timeinterval t are defined as Equ. 1 and Equ. 2, respectively.
xin,i,jt =
∑Tr∈P
|{λ > 1|gλ−1 /∈ (i, j) ∧ gλ ∈ (i, j)}| (1)
xout,i,jt =
∑Tr∈P
|{λ ≥ 1|gλ ∈ (i, j) ∧ gλ+1 /∈ (i, j)}| (2)
where Tr : g1 → g2 →, ...,→ g|Tr| is a trajectory in P , andgλ is the geospatial coordination; gλ ∈ (i, j) means the pointgλ lies within grid (i, j), and vice versa.
Problem 1 (Citywide Vehicle Flow Prediction): Givena set of observed historical citywide vehicle flow data withtime span T = 1, 2, ..., t− 1. The problem of vehicle flowprediction aims to predict the inflow and outflow at the nexttime interval t of the whole grid map of the city.
B. Limitations of 2D CNN based Methods for Traffic Predic-tion
As discussed in Section I, we need to consider the spatialand temporal dependencies jointly in traffic prediction. Wedemonstrate that 3D CNN is well suited for spatio-temporalcorrelation feature learning compared with the 2D CNN andother 2D CNN based methods (e.g., 2D CNN plus LSTM).
In 2D CNN, two dimensions of features can be learnedowing to 2D convolution and 2D pooling operations. Manyresearchers have made efforts to utilize 2D CNN to learn the
Time
Space
Space
Time
(a)
Space-X
Time
(b)
Space-YSpace-X
Space-Y
CNNs
...
Learning spatial features
LSTM
...
Learning temporal features
CNNs LSTMTime
Prediction
(c)
Space-X
Space-Y
...
CNNs
...
Learning spatial features
Learning temporal features
CNNsTime
Prediction
Space-X
Space-Y
...
(d)
Tanh
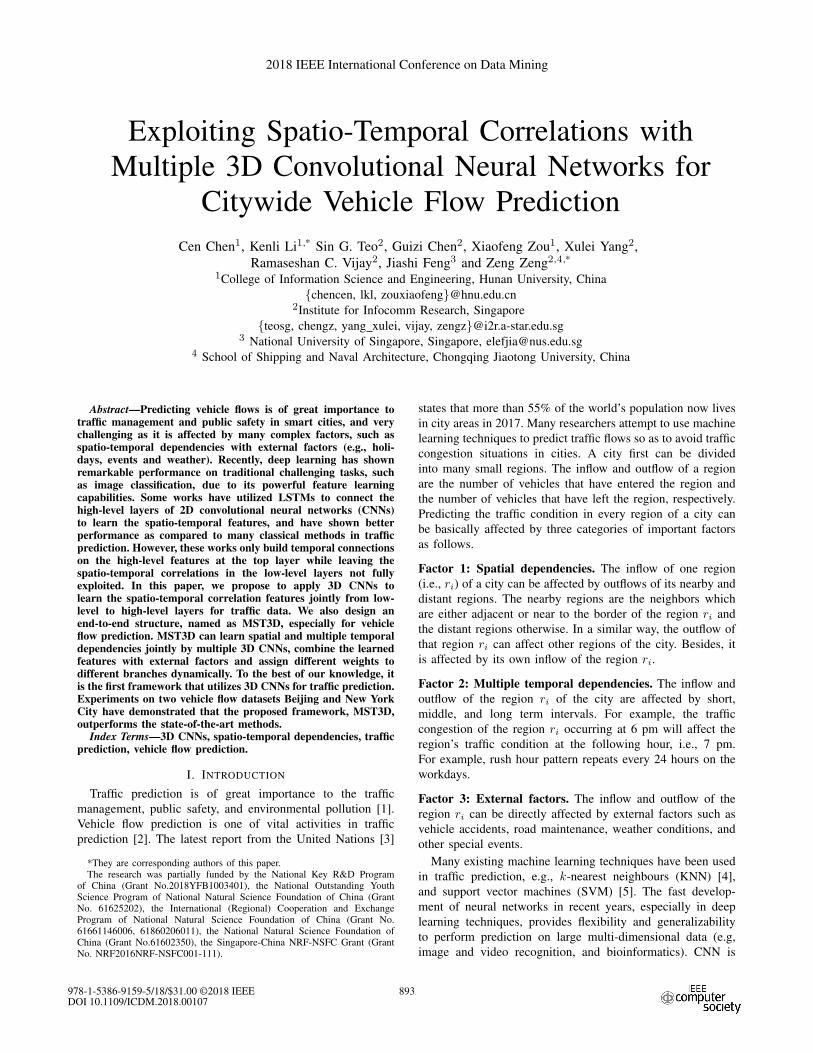
Fig. 1: Limitations of 2D CNN based methods; (a) Model spatio-temporal dependencies in a 2D image; (b) Utilize RGBchannels to construct the time dimension; (c) Combine 2D CNN with LSTM or RNN; (d) Utilize 2D CNN for a slice of imagealong the time dimension and then aggregate them together by a Tanh function.
spatio-temporal correlation features. Generally, these workscan be divided into four catalogs. (1) Treat a dimension ofa 2D image as space and another dimension as time [17] asshown in Figure 1(a). However, the two-dimension of spatialdependency are flattened into one dimension and some actualinformation in the spatial dimension is lost. (2) Another way toadapt 2D CNN to support spatio-temporal feature learning isto replace the RGB channels with slices of the time. However,2D convolution applied on multiple images (treating them asdifferent channels) also results in an image. Hence, it alsoloses temporal information of the input signal right after everyconvolution operation. (3) Some works utilize 2D CNN withLSTM or RNN [9], [19] as shown in Figure 1(c). 2D CNNcaptures the near- and far-side spatial dependencies and subse-quently the long-term temporal feature is learned by LSTMs.Therefore, the integrated networks inherit the advantages of2D CNNs and LSTMs neural networks. This category ofapproaches, however, only build temporal connections on thehigh-level features at the top layer while the correlations in thelow-level spatial features cannot be fully exploited. (4) Someworks utilize 2D CNN to learn the spatial feature for a slice ofimage in time dimension and then aggregate them together bya Tanh function [6]. However, similar to the third method, thetemporal dependency of the low-level spatial features cannotbe learned.
C. Learning Spatio-temporal Features with 3D CNN
Compared to 2D CNN, 3D CNN has the ability to model3-dimension information owing to 3D convolution and 3Dpooling operations. If we model the traffic data into 3Dvolumes with spatial and temporal dimensions, 3D CNNcould preserve the temporal dependencies of the volumetricdata resulting in an output volume [22]. Moreover, adoptingthe same kernel sharing across space and time dimensions,the model could take full advantage of spatial and temporaldependencies.
In view of the definite advantage of 3D CNN to learnspatial and temporal features, an architecture of 3D CNNsis proposed by stacking the convolution layers, pooling layersand fully connection layers. 3D feature volumes are learnedfrom low-level to high-level by stacking the convolution layers,and it employs different spatio-temporal kernels followed bythe non-linear activation functions. In the layer of pooling,the produced feature volumes can be subsampled with max-
3DCNNs3DCNNs3DCNNs
Weighted feature volumn fusion
Fully connected layer Loss
Feature embedding
External factors
Feature flatten and fusion
Multiple 3D CNNsExternal branch
Volumes of weekly period
Volumes of daily period
Volumes of closeness
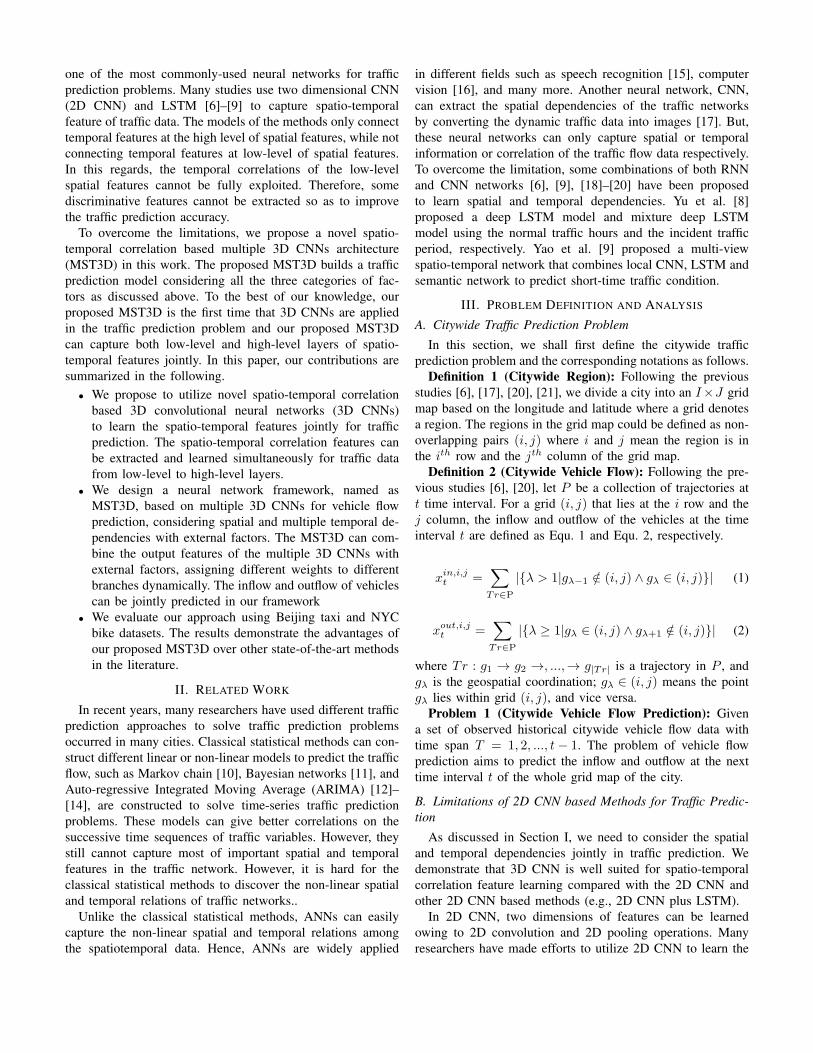
Fig. 2: Architecture of MST3D.
pooling operation in order to reduce variance and computationcomplexity and extract low level features from the cubicneighborhood [22].
IV. PROPOSED MST3D FRAMEWORK
This section describes the details of our proposed MST3Dframework to predict citywide vehicle flow as depicted inFigure 2. Utilizing MST3D consists of 3 steps: modeling,training and testing.
The spatial and multiple temporal correlation features oftraffic data can be learned in MST3D using 3D convolutionlayers and pooling layers. Multiple temporal dependenciescontain the closeness dependency and different periodic (e.g.,daily, weekly and monthly) dependencies. A single 3D CNNbranch is normally to learn the spatial information and a singletype of temporal dependency together. In the external branch,we need to manually extract some features from externaldatasets that provide weather conditions, event informationand other external information. Then, we feed the extractedfeatures into a two-layer fully-connected neural network. As aresult, spatio-temporal features and external features are fusedtogether. Lastly, we apply a fully-connected neural networkthat calculates the cross-entropy loss.
A. Modeling
We first describe how to model citywide inflow/outflowtraffic situation with spatio-temporal correlation based 3Dvolumes. Then we analyse the influence of multiple temporaldependencies in traffic prediction and present the process ofmodeling multiple temporal dependencies in our methodology.
1) Modeling Spatio-temporal Correlation with 3D Volumes:Given a city that is partitioned into I × J grid map, atthe t time interval, the traffic status can be represented bya tensor Xt ∈ Ri×j×k, where k denotes the number oftraffic variables. The generated tensor can be regarded as aspecial multi-channel image with i pixels height, j pixelswidth and k channels of each pixel. This multi-channel imagecaptures the spatial information of citywide traffic conditions.Specifically, the multi-channel image can capture the spatio-temporal correlation information of citywide vehicle inflowand outflow by setting k = 2. In the next contents, we setk = 2 for convenient.
In case of given h time segments, the inflow/outflow ofthese time segments can be denotes as a tensor V ∈ Rh×i×j×2
This tensor can be regarded as a 3D volume with as a sizeof h× i× j × 2, where h is the number of frames (images).This 3D volume captures the spatio-temporal information ofcitywide traffic conditions for a slice of time segments.
Formally, the multi-channel image for citywide vehicle flowand the 3D volume for a certain time of citywide vehicle floware defined in Definition 4 and 5 separately:
Definition 4 (Multi-channel Images for Citywide VehicleFlow): At the time segment t, inflow and outflow in all I ×Jregions can be denoted as a multi-channel image Xt ∈ Ri×j×2
where (Xt)0 and (Xt)1 denotes the inflow matrix and outflowmatrix, respectively.
Definition 5 (3D Volumes for a Certain Time of CitywideVehicle Flow): Given h time segments, all the multi-channelimages in these time segments can be denoted as a 3D volumeV ∈ Rh×i×j×2.
2) Modeling Multiple Temporal Dependencies: From theabove cases, it is clearly shown that the temporal dependenciesand correlation have significant impacts on the traffic state,such as close time, daily periodicity and weekly periodicityregardless of the degrees of influences which are not com-pletely the same. We consider the temporal dependency ofcloseness and periods.
For the closeness 3D volumes, a few 2 channel im-ages of intervals in the recent time are used to modeltemporal closeness dependency. Let a recent fragment be[Xt−lc , Xt−(lc−1), ..., Xt−1]. This closeness is dependent se-quence that can be constructed as a 3D volume, Vc ∈Rlc×i×j×2.
In a similar way, we also can construct the periods volumes.We take the daily period as an example. Suppose that ld istime intervals from the period fragment, and d is the periodspan. Therefore, the daily period of a dependent sequenceis [Xt−ld×d, Xt−(ld−1)×d, ..., Xt−1]. This sequence can beconstructed as a 3D volume Vd ∈ Rld×i×j×2. Generally, ourproposed framework can support other user-defined periods(e.g., monthly, seasonally).
B. Multiple 3D CNNs
The spatio-temporal correlation based 3D volumes con-structed in the modeling phase is then fed into our proposedMST3D. Each branch of 3D CNNs targets for a type of
temporal dependency. For example, the closeness 3D volumesare fed into the closeness branch, and the daily branch takesthe daily 3D volumes as inputs.
We take the closeness branch to describe how to learn thespatio-temporal features simultaneously. The equation of 3Dconvolutional operation is as follows:
uβij(x, y, z) =
∑m,n,l
V β−1i (x−m, y − n, z − l)W β
ij(m,n, l),
(3)where W β
ij is the 3D kernel in the βth layer convolving overthe 3D feature volume hβ−1
i , W βij(m,n, l) is the element-wise
weight in the 3D convolution kernel.Thus, the equation of the 3D feature volume for the close-
ness branch in βth layer is:
V βj = f(
∑i
uβij + bβj ), (4)
where f is an activation function, b is a bias term connectingthe feature maps of adjacent layers.
As discussed in Section IV-A, all the regions are affected bymultiple temporal dependencies. The degrees of influence onthe regions may be different. Inspired by the observations, wepropose a novel parametric-tensor-based fusion method thatcan fuse closeness, daily and weekly branches, similar to themethod in [6]. The equation of fusion method is as follows,
Vfusion = Wc ⊗ Vc +Wd ⊗ Vd +Ww ⊗ Vw (5)
where Vfusion denotes the fused features; ⊗ is Hadamardproduct (i.e., element-wise multiplication for tensors);Vc, Vd, Vw are the feature volumes extracted by closeness,daily and weekly branches respectively; Wc,Wd,Ww are thelearnable parameters that adjust the degrees affected by dif-ferent branches.
Then, the fused features Vfusion is flattened into a vectornamed as Vmc. Vmc is the output of the multiple 3D CNNs.
C. External Branch
Many complex external factors, such as weather conditionsand special events, have great influence on the citywide trafficsituation. In this paper, we mainly focus on the weathercondition, holiday event, and metadata (i.e., day of the week,weekday and weekend). We stack two fully-connected layersupon Et, i.e., the first layer can be viewed as an embeddinglayer for each sub-factor followed by an activation, and thesecond layer is to map low to high dimensions as Vext thathave the same shape with Vmc which is generated by multipleCNNs.
We then directly merge the output of the multiple CNNswith that of the external components. The fused output V̂ ofthe multiple CNNs and the external components is defined inEqu. 6:
V̂ = Vmc + Vext (6)
.Finally, the fused output V̂ is connected with a fully-
connected layer using Tanh function.
V. EXPERIMENT
A. Experiment Settings
We configure a Linux server with configurations as follows:8 Intel(R) Xeon(R) CPU E5-2680 v4 @ 2.40GHZ; 256GBRAM; 4 NVIDIA P100 GPUs. Two large real-world datasets,i.e., New York City (NYC) and BeiJing (BJ) datasets, are usedin the experiment. NYCBike: The bike trip data is collectedfrom NYC Bike system in 2014 from Apr. 1st to Sept. 30th.We choose the data in the last 10 days as the testing data,while others as the training data. For the external information,holidays are provided in the dataset. BJTaxi: This is the taxitrajectoriy data in Beijing that has 4 time periods: 1st Jul. 2013- 30th Otc. 2013, 1st Mar. 2014 - 30th Jun. 2014, 1st Mar.2015 - 30th Jun. 2015, 1st Nov. 2015 - 10th Apr. 2016. Thelast four weeks are selected as the testing data, and othersas the training data. External information includes holidays,weather conditions and temperature.
B. Implementation Details
Data Preprocessing. For the NYCBike dataset, we split thewhole city into 8×16 regions. The length of each time segmentis set to 1 hour. For the BJTaxi dataset, we split the whole cityinto 32× 32 regions. The length of each time segment is setto 30 minutes. We apply Min-Max normalization to converttraffic values by [0, 1] scale. After the prediction step, we de-normalize the prediction values.
Parameters. The python libraries, the Tensorflow (version1.2.1) and the Keras (version 2.1.6) are used to build ourmodels. The inflow and outflow are fixed as 2 channels inthe generated volumes. The lengths of closeness, daily andweekly on NYCBike are set to 4, 4, and 4, respectively. Asthe time segment in BJTaxi is set to half an hour, the lengthsof closeness, daily and weekly are set to 6, 4, and 4.
For the NYCBike dataset, we apply two 3D convolutionallayers as the sizes of our 3D volumes are small (i.e., 4×8×16in all the branches). The kernel sizes in all the branches areset to (2, 3, 3). The number of 3D convolutional filters of thefirst layer is 32, and of that the second layer is 64. For theBJTaxi dataset, three 3D convolutional layers are applied onall the multiple CNNs. One of the main reasons is that thespatial dimensions are 32 × 32 which is bigger than that ofthe NYCBike dataset. The number of 3D convolutional filterson three 3D convolutional layers are set to 32, 64 and 64,respectively.
In our experiment, we choose Rooted Mean Square Error(RMSE) and Mean Average Percentage Error (MAPE) as theevaluation metrics, which are the same metrics used in [9],[20], [21]. In the calculation of MAPE value, the sampleswith flow values that are less than 10 are ignored, which is acommon practice used in the traffic prediction [9], [20].
C. Methods in Traffic Prediction
We compare our model with the following three categoriesof spatio-temporal prediction methods. (1) HA: Historicalaverage predicts traffic (HA) for a given region basing on the
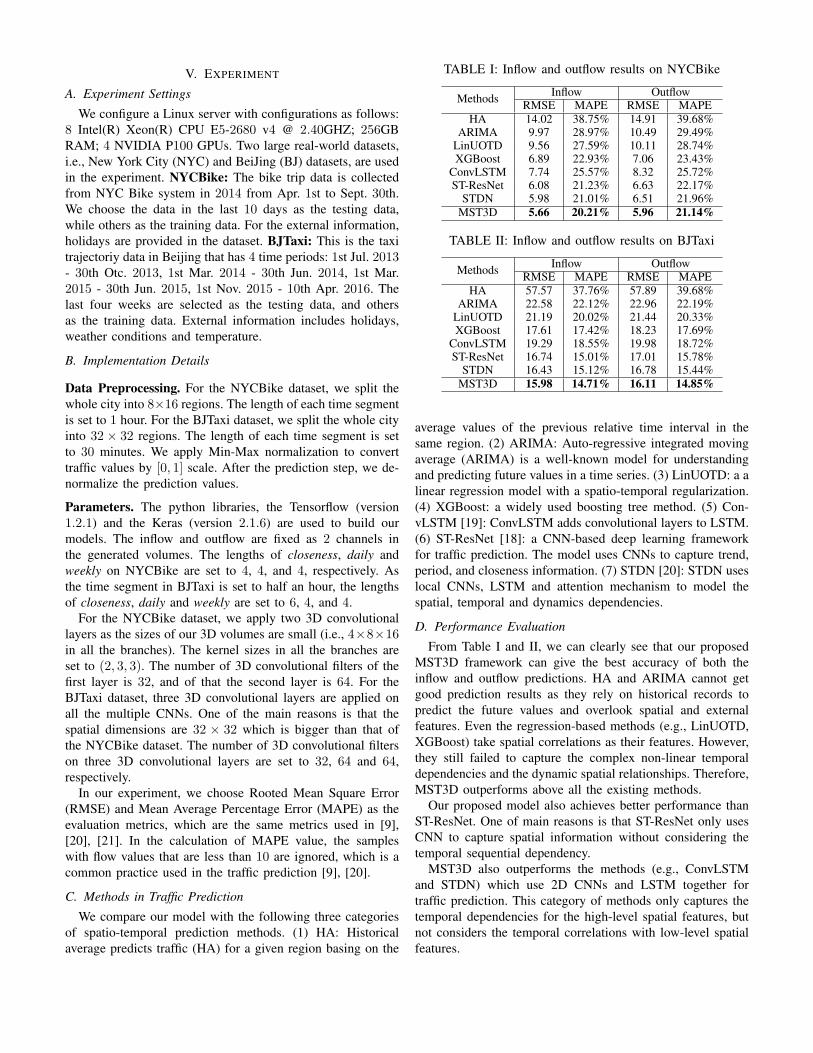
TABLE I: Inflow and outflow results on NYCBike
Methods Inflow OutflowRMSE MAPE RMSE MAPE
HA 14.02 38.75% 14.91 39.68%ARIMA 9.97 28.97% 10.49 29.49%
LinUOTD 9.56 27.59% 10.11 28.74%XGBoost 6.89 22.93% 7.06 23.43%
ConvLSTM 7.74 25.57% 8.32 25.72%ST-ResNet 6.08 21.23% 6.63 22.17%
STDN 5.98 21.01% 6.51 21.96%MST3D 5.66 20.21% 5.96 21.14%
TABLE II: Inflow and outflow results on BJTaxi
Methods Inflow OutflowRMSE MAPE RMSE MAPE
HA 57.57 37.76% 57.89 39.68%ARIMA 22.58 22.12% 22.96 22.19%
LinUOTD 21.19 20.02% 21.44 20.33%XGBoost 17.61 17.42% 18.23 17.69%
ConvLSTM 19.29 18.55% 19.98 18.72%ST-ResNet 16.74 15.01% 17.01 15.78%
STDN 16.43 15.12% 16.78 15.44%MST3D 15.98 14.71% 16.11 14.85%
average values of the previous relative time interval in thesame region. (2) ARIMA: Auto-regressive integrated movingaverage (ARIMA) is a well-known model for understandingand predicting future values in a time series. (3) LinUOTD: a alinear regression model with a spatio-temporal regularization.(4) XGBoost: a widely used boosting tree method. (5) Con-vLSTM [19]: ConvLSTM adds convolutional layers to LSTM.(6) ST-ResNet [18]: a CNN-based deep learning frameworkfor traffic prediction. The model uses CNNs to capture trend,period, and closeness information. (7) STDN [20]: STDN useslocal CNNs, LSTM and attention mechanism to model thespatial, temporal and dynamics dependencies.
D. Performance Evaluation
From Table I and II, we can clearly see that our proposedMST3D framework can give the best accuracy of both theinflow and outflow predictions. HA and ARIMA cannot getgood prediction results as they rely on historical records topredict the future values and overlook spatial and externalfeatures. Even the regression-based methods (e.g., LinUOTD,XGBoost) take spatial correlations as their features. However,they still failed to capture the complex non-linear temporaldependencies and the dynamic spatial relationships. Therefore,MST3D outperforms above all the existing methods.
Our proposed model also achieves better performance thanST-ResNet. One of main reasons is that ST-ResNet only usesCNN to capture spatial information without considering thetemporal sequential dependency.
MST3D also outperforms the methods (e.g., ConvLSTMand STDN) which use 2D CNNs and LSTM together fortraffic prediction. This category of methods only captures thetemporal dependencies for the high-level spatial features, butnot considers the temporal correlations with low-level spatialfeatures.
MST3D-C MST3D-CD MST3D-CDW MST3D5.5
5.6
5.7
5.8
5.9
6.0
6.1
6.2
RM
SE
Inflow Outflow
MST3D-C MST3D-CD MST3D-CDW MST3D20.0
20.2
20.4
20.6
20.8
21.0
21.2
21.4
21.6
21.8
22.0
MA
PE
(%)
Inflow Outflow
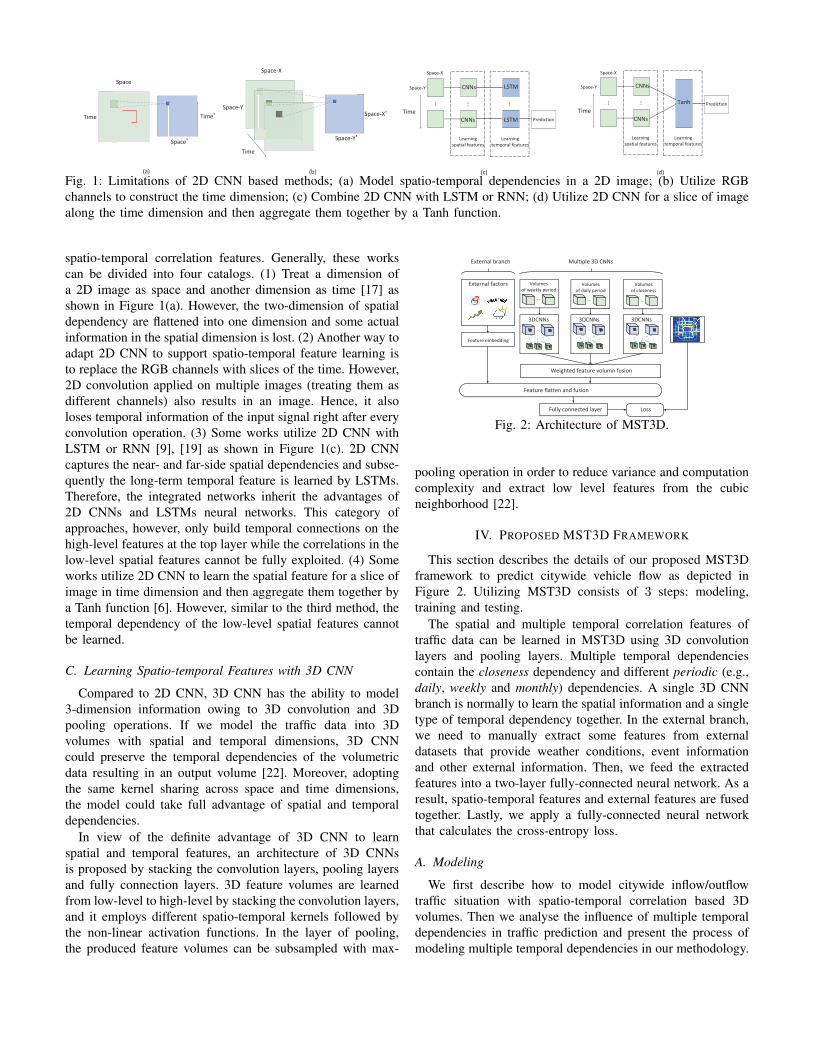
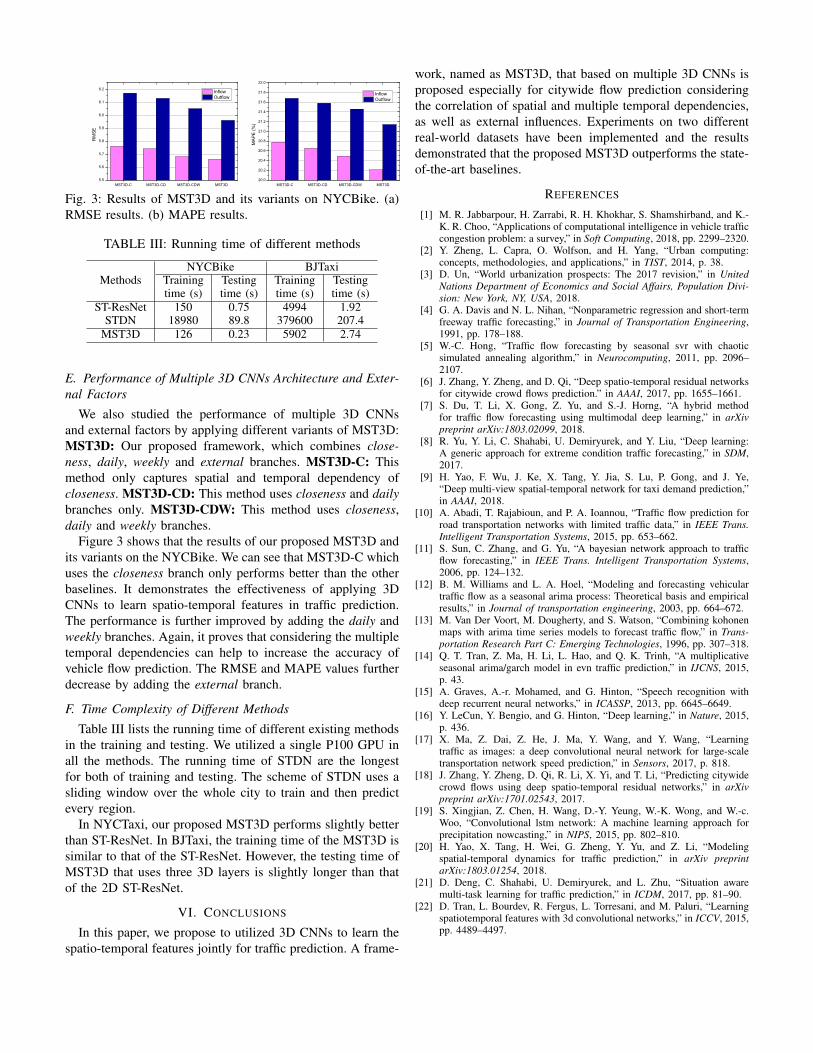
Fig. 3: Results of MST3D and its variants on NYCBike. (a)RMSE results. (b) MAPE results.
TABLE III: Running time of different methods
MethodsNYCBike BJTaxi
Training Testing Training Testingtime (s) time (s) time (s) time (s)
ST-ResNet 150 0.75 4994 1.92STDN 18980 89.8 379600 207.4
MST3D 126 0.23 5902 2.74
E. Performance of Multiple 3D CNNs Architecture and Exter-nal Factors
We also studied the performance of multiple 3D CNNsand external factors by applying different variants of MST3D:MST3D: Our proposed framework, which combines close-ness, daily, weekly and external branches. MST3D-C: Thismethod only captures spatial and temporal dependency ofcloseness. MST3D-CD: This method uses closeness and dailybranches only. MST3D-CDW: This method uses closeness,daily and weekly branches.
Figure 3 shows that the results of our proposed MST3D andits variants on the NYCBike. We can see that MST3D-C whichuses the closeness branch only performs better than the otherbaselines. It demonstrates the effectiveness of applying 3DCNNs to learn spatio-temporal features in traffic prediction.The performance is further improved by adding the daily andweekly branches. Again, it proves that considering the multipletemporal dependencies can help to increase the accuracy ofvehicle flow prediction. The RMSE and MAPE values furtherdecrease by adding the external branch.
F. Time Complexity of Different Methods
Table III lists the running time of different existing methodsin the training and testing. We utilized a single P100 GPU inall the methods. The running time of STDN are the longestfor both of training and testing. The scheme of STDN uses asliding window over the whole city to train and then predictevery region.
In NYCTaxi, our proposed MST3D performs slightly betterthan ST-ResNet. In BJTaxi, the training time of the MST3D issimilar to that of the ST-ResNet. However, the testing time ofMST3D that uses three 3D layers is slightly longer than thatof the 2D ST-ResNet.
VI. CONCLUSIONS
In this paper, we propose to utilized 3D CNNs to learn thespatio-temporal features jointly for traffic prediction. A frame-
work, named as MST3D, that based on multiple 3D CNNs isproposed especially for citywide flow prediction consideringthe correlation of spatial and multiple temporal dependencies,as well as external influences. Experiments on two differentreal-world datasets have been implemented and the resultsdemonstrated that the proposed MST3D outperforms the state-of-the-art baselines.
REFERENCES
[1] M. R. Jabbarpour, H. Zarrabi, R. H. Khokhar, S. Shamshirband, and K.-K. R. Choo, “Applications of computational intelligence in vehicle trafficcongestion problem: a survey,” in Soft Computing, 2018, pp. 2299–2320.
[2] Y. Zheng, L. Capra, O. Wolfson, and H. Yang, “Urban computing:concepts, methodologies, and applications,” in TIST, 2014, p. 38.
[3] D. Un, “World urbanization prospects: The 2017 revision,” in UnitedNations Department of Economics and Social Affairs, Population Divi-sion: New York, NY, USA, 2018.
[4] G. A. Davis and N. L. Nihan, “Nonparametric regression and short-termfreeway traffic forecasting,” in Journal of Transportation Engineering,1991, pp. 178–188.
[5] W.-C. Hong, “Traffic flow forecasting by seasonal svr with chaoticsimulated annealing algorithm,” in Neurocomputing, 2011, pp. 2096–2107.
[6] J. Zhang, Y. Zheng, and D. Qi, “Deep spatio-temporal residual networksfor citywide crowd flows prediction.” in AAAI, 2017, pp. 1655–1661.
[7] S. Du, T. Li, X. Gong, Z. Yu, and S.-J. Horng, “A hybrid methodfor traffic flow forecasting using multimodal deep learning,” in arXivpreprint arXiv:1803.02099, 2018.
[8] R. Yu, Y. Li, C. Shahabi, U. Demiryurek, and Y. Liu, “Deep learning:A generic approach for extreme condition traffic forecasting,” in SDM,2017.
[9] H. Yao, F. Wu, J. Ke, X. Tang, Y. Jia, S. Lu, P. Gong, and J. Ye,“Deep multi-view spatial-temporal network for taxi demand prediction,”in AAAI, 2018.
[10] A. Abadi, T. Rajabioun, and P. A. Ioannou, “Traffic flow prediction forroad transportation networks with limited traffic data,” in IEEE Trans.Intelligent Transportation Systems, 2015, pp. 653–662.
[11] S. Sun, C. Zhang, and G. Yu, “A bayesian network approach to trafficflow forecasting,” in IEEE Trans. Intelligent Transportation Systems,2006, pp. 124–132.
[12] B. M. Williams and L. A. Hoel, “Modeling and forecasting vehiculartraffic flow as a seasonal arima process: Theoretical basis and empiricalresults,” in Journal of transportation engineering, 2003, pp. 664–672.
[13] M. Van Der Voort, M. Dougherty, and S. Watson, “Combining kohonenmaps with arima time series models to forecast traffic flow,” in Trans-portation Research Part C: Emerging Technologies, 1996, pp. 307–318.
[14] Q. T. Tran, Z. Ma, H. Li, L. Hao, and Q. K. Trinh, “A multiplicativeseasonal arima/garch model in evn traffic prediction,” in IJCNS, 2015,p. 43.
[15] A. Graves, A.-r. Mohamed, and G. Hinton, “Speech recognition withdeep recurrent neural networks,” in ICASSP, 2013, pp. 6645–6649.
[16] Y. LeCun, Y. Bengio, and G. Hinton, “Deep learning,” in Nature, 2015,p. 436.
[17] X. Ma, Z. Dai, Z. He, J. Ma, Y. Wang, and Y. Wang, “Learningtraffic as images: a deep convolutional neural network for large-scaletransportation network speed prediction,” in Sensors, 2017, p. 818.
[18] J. Zhang, Y. Zheng, D. Qi, R. Li, X. Yi, and T. Li, “Predicting citywidecrowd flows using deep spatio-temporal residual networks,” in arXivpreprint arXiv:1701.02543, 2017.
[19] S. Xingjian, Z. Chen, H. Wang, D.-Y. Yeung, W.-K. Wong, and W.-c.Woo, “Convolutional lstm network: A machine learning approach forprecipitation nowcasting,” in NIPS, 2015, pp. 802–810.
[20] H. Yao, X. Tang, H. Wei, G. Zheng, Y. Yu, and Z. Li, “Modelingspatial-temporal dynamics for traffic prediction,” in arXiv preprintarXiv:1803.01254, 2018.
[21] D. Deng, C. Shahabi, U. Demiryurek, and L. Zhu, “Situation awaremulti-task learning for traffic prediction,” in ICDM, 2017, pp. 81–90.
[22] D. Tran, L. Bourdev, R. Fergus, L. Torresani, and M. Paluri, “Learningspatiotemporal features with 3d convolutional networks,” in ICCV, 2015,pp. 4489–4497.


