Embed Size (px)
Citation preview
Proceedings of Acoustics 2013 – Victor Harbor 17–20 November 2013, Victor Harbor, Australia
Experimental results of a 1D passive magnetic springapproaching quasi-zero stiffness and using active
skyhook damping
Will Robertson, Ben Cazzolato, and Anthony ZanderSchool of Mechanical Engineering, The University of Adelaide, Australia
ABSTRACT
The use of permanent magnets has been investigated in recent years to provide load bearing forces for vibration isola-tion. Using two pairs of magnets in both repulsion and attraction, it is possible to generate a force-displacement charac-teristic that has an inflection point at zero stiffness, known as the quasi-zero stiffness location. Since vibration isolationperformance is known to improve with lower resonance frequencies and therefore isolator stiffnesses, the quasi-zerostiffness location is considered the point at which vibration isolation is best achieved. However, since this location isonly marginally stable, for passive operation it is only possible in practice for the equilibrium position of the system toasymptotically approach the quasi-zero stiffness point. The proximity to this point that can be achieved depends on theloads to be borne and the amplitude of vibration to be isolated. In previous works, this particular magnetic system hasseen theoretical treatment. A prototype of the magnetic system will be presented that uses magnet pairs mounted on arigid lever arm to constrain their motion to a single degree of freedom. Experimental results are presented that demon-strate the quasi-zero stiffness behaviour of the practical system. Finally, a novel electromagnetic actuator is incorporatedinto the design to attenuate the resonance peak via active skyhook damping using accelerometer measurements. Thelimits of this feedback are shown to be caused by the filter poles of the accelerometers used to measure the vibration.
INTRODUCTIONVibration isolation of sensitive equipment involves mountingwith as low a stiffness as possible to reduce the resonancefrequency of the system. Several approaches have been sug-gested for adding negative stiffness elements in series with avibration mount in order to reduce the resonance frequencywhile maintaining its load-bearing ability, including flexiblemembers (Tarnai 2003; Cella et al. 2005; Lee, Goverdovskiy,and Temnikov 2007), ‘buckling’ springs (Molyneux 1957; Al-abuzhev et al. 1989; Carrella, Brennan, and Waters 2007; Car-rella et al. 2009), and attracting pairs of magnets (Carrella et al.2008; Robertson et al. 2009; Robertson et al. 2006; Robertson,Cazzolato, and Zander 2007; Zhu et al. 2011).
While in theory such systems are refered to as having ‘quasi–zero stiffness’, this term is slightly misleading as the positionof dynamic zero stiffness is only marginally stable and thesystem cannot stably operate at this point. Linear control sys-tems can be used to stabilise such a system, but the additionaldynamics of the controller will have their own influence onthe propagated vibration disturbance. For stable operation, thenominal operating position of the system must be chosen suffi-ciently far away such that the maximum excursion from equi-librium remains within the stability region (Robertson et al.2009). In this case, the system will have a non-zero but smallpositive stiffness; further improvement to the vibration isola-tion properties of the system can be achieved using standardactive vibration feedback control.
This paper documents a set of experiments that were conceivedto demonstrate these ideas. A single degree of freedom sys-tem was designed using one pair of magnets in repulsion forload bearing and one pair in attraction for stiffness reduction(Fig. 1). The system was tuned to achieve a minimal resonancefrequency and active vibration isolation used to improve thetransmissibility for vibration isolation.
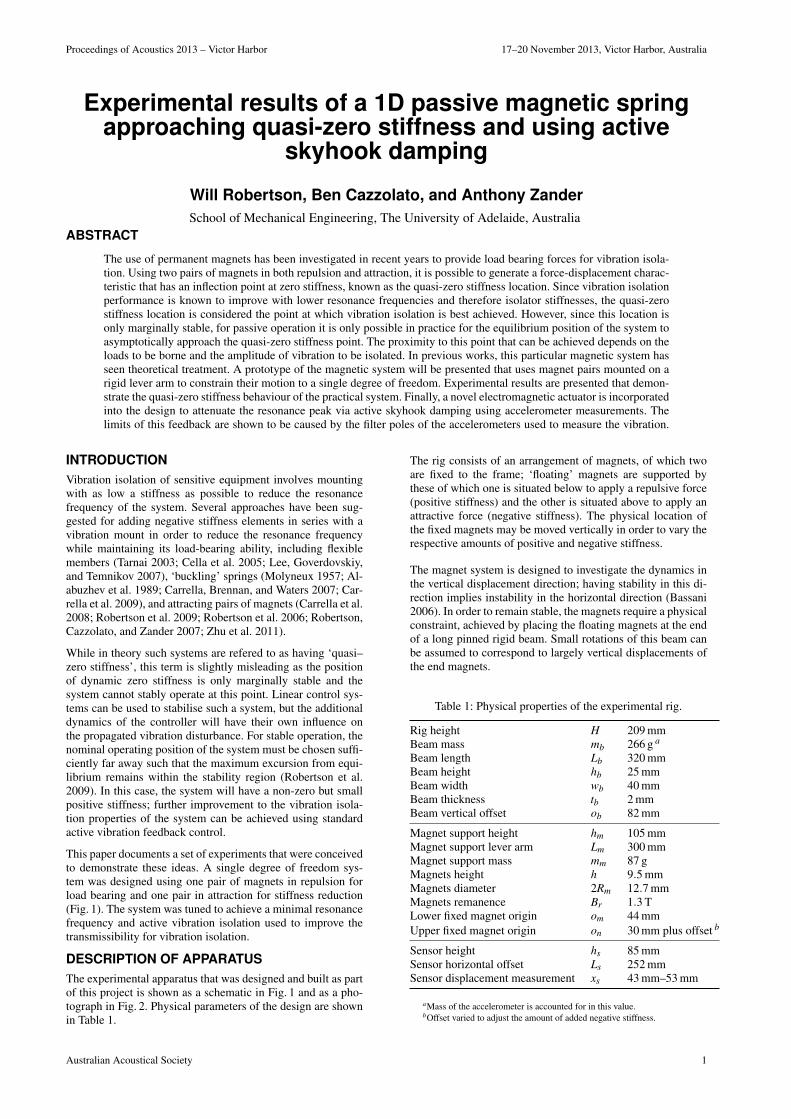
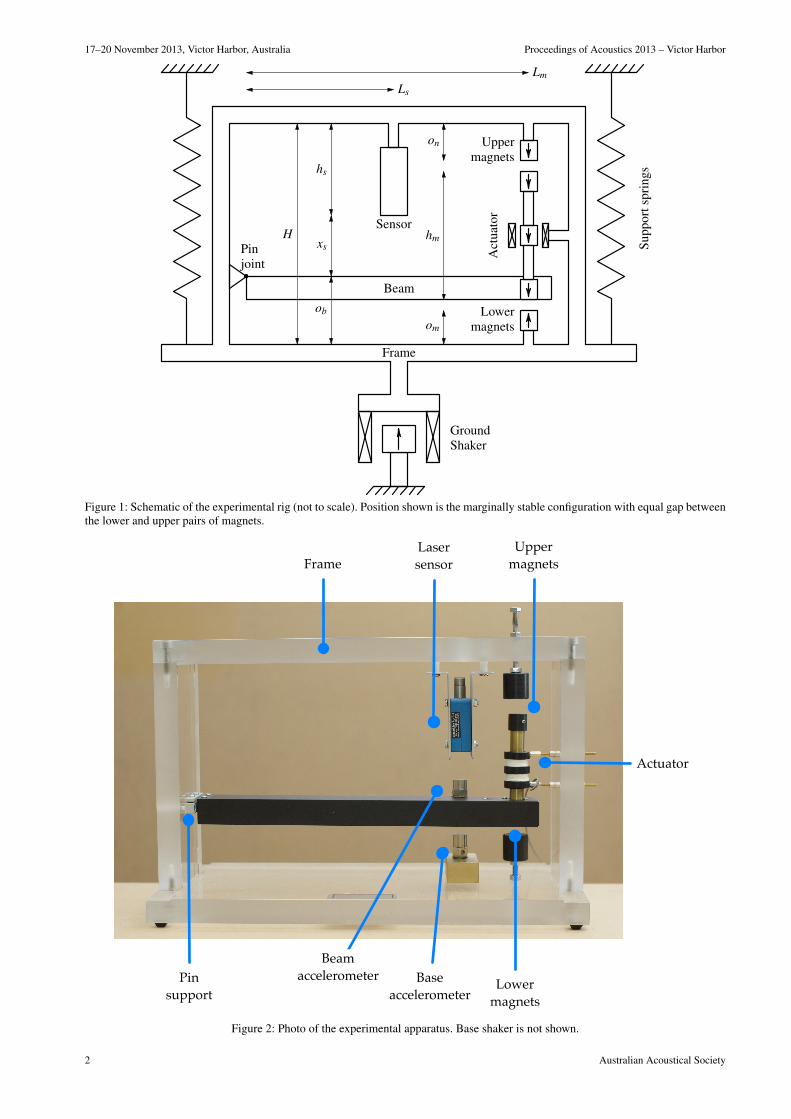
DESCRIPTION OF APPARATUSThe experimental apparatus that was designed and built as partof this project is shown as a schematic in Fig. 1 and as a pho-tograph in Fig. 2. Physical parameters of the design are shownin Table 1.
The rig consists of an arrangement of magnets, of which twoare fixed to the frame; ‘floating’ magnets are supported bythese of which one is situated below to apply a repulsive force(positive stiffness) and the other is situated above to apply anattractive force (negative stiffness). The physical location ofthe fixed magnets may be moved vertically in order to vary therespective amounts of positive and negative stiffness.
The magnet system is designed to investigate the dynamics inthe vertical displacement direction; having stability in this di-rection implies instability in the horizontal direction (Bassani2006). In order to remain stable, the magnets require a physicalconstraint, achieved by placing the floating magnets at the endof a long pinned rigid beam. Small rotations of this beam canbe assumed to correspond to largely vertical displacements ofthe end magnets.
Table 1: Physical properties of the experimental rig.
Rig height H 209 mmBeam mass mb 266 g a
Beam length Lb 320 mmBeam height hb 25 mmBeam width wb 40 mmBeam thickness tb 2 mmBeam vertical offset ob 82 mm
Magnet support height hm 105 mmMagnet support lever arm Lm 300 mmMagnet support mass mm 87 gMagnets height h 9.5 mmMagnets diameter 2Rm 12.7 mmMagnets remanence Br 1.3 TLower fixed magnet origin om 44 mmUpper fixed magnet origin on 30 mm plus offset b
Sensor height hs 85 mmSensor horizontal offset Ls 252 mmSensor displacement measurement xs 43 mm–53 mm
aMass of the accelerometer is accounted for in this value.bOffset varied to adjust the amount of added negative stiffness.
Australian Acoustical Society 1
17–20 November 2013, Victor Harbor, Australia Proceedings of Acoustics 2013 – Victor Harbor
GroundShaker
Supp
orts
prin
gs
Pinjoint
Beam
Frame
H
Lm
Ls
Sensorxs
hs
ob
om
on
Lowermagnets
Uppermagnets
hm
Act
uato
rFigure 1: Schematic of the experimental rig (not to scale). Position shown is the marginally stable configuration with equal gap betweenthe lower and upper pairs of magnets.
Uppermagnets
Lowermagnets
Pinsupport
Lasersensor
Baseaccelerometer
Beamaccelerometer
Actuator
Frame
Figure 2: Photo of the experimental apparatus. Base shaker is not shown.
2 Australian Acoustical Society

Proceedings of Acoustics 2013 – Victor Harbor 17–20 November 2013, Victor Harbor, Australia
The beam itself was chosen as a hollow rectangular section inorder to minimise weight and maximise stiffness; it is assumedto be a rigid body for the purposes of these experiments (espe-cially at the low vibrational frequencies under investigation).
The pin support was constructed by clamping the beam to athin piece of flexible plastic which was clamped to the frame.The use of a flexural element was chosen to avoid static frictionthat would be present in a bearing or hinge joint. The stiffnessof this plastic can be assumed to be negligible as it played nopart in the load bearing of the beam.
Electromagnetic actuator
A dual-coil electromagnetic arrangement was custom-built forthe actuator for the experimental apparatus. A schematic ofthe dual-coil system is shown in Fig. 3 with parameters in Ta-ble 2. The coil was designed to have an impedance of 8 Ω, fromwhich the outer radius of the coil was calculated given a cer-tain wire diameter and resistance (Robertson, Cazzolato, andZander 2012).
Rmrc
Rc
hc hcG
hFigure 3: Schematic of the dual-coil electromagnet built for theexperimental apparatus. (Not to scale.)
Table 2: Dual-coil electromagnet parameters.
Magnet radius Rm 6.4 mmMagnet height h 9.5 mm
Coil height hc 7 mmCoil inner radius rc 10 mmCoil outer radius Rc 10.7 mmCoil gap G 7 mmTurns (approx.) 105
Former inner radius 14.2 mm
The dimensions of the coil were chosen to ensure sufficientforce over the displacement range expected from the system.The force imparted by the coil remains within 10% of maxi-mum over a displacement range of around ±2 mm, which isacceptable for the purposes of the design.
Displacement and acceleration sensors
The sensor purchased for the experimental apparatus was aWenglor 05 MGV 80 opto-electronic sensor, which uses a laserto measure distance over a range of 10 mm.
For the beam, a Brüel and Kjær 4367 accelerometer was usedto measure the ‘output’ signal; for the base, a 4332 accelerom-eter measured the ‘input’ signal of the system. The accelerom-eters were used with Brüel and Kjær 2635 charge amplifiersset to appropriate gain values for the input signals. The signalswere low-pass filtered at 50 Hz to avoid aliasing effects usinga Krohn-Hite Model 3362 digital filter (using a 4-pole Butter-worth filter).
For open loop measurements, these accelerometers were usedto measure acceleration directly; for closed loop control, thecharge amplifier was used to integrate the measured signals toestimate the velocities. The high-pass filter in the charge ampli-fiers used a 0.1 Hz cut-on frequency when measuring acceler-ation and 1 Hz for velocity. The higher frequency is necessaryfor velocity to avoid drift due to accumulation of errors in theintegrator circuit.
Translational effects of the rotating beam
Three moving magnets were required in the system: one at themain end of the motional beam to be repelled for positive stiff-ness by the fixed lower magnet; a second to be used with elec-tromagnetic coil for control forces; and the third to be attractedfor negative stiffness by the fixed upper magnet.
The beam added a horizontal constraint to the system for sta-bility. As the beam rotates, the magnets move predominantlyin the vertical direction; there is still some horizontal motion,however, and the area restricted by the electromagnetic coil re-quires attention to ensure that there is no contact between themoving magnet and the fixed coil. However, the smaller the airgap between the coil and the magnet, and thus the smaller theinner radius of the coil, the greater the forces imparted by thecoil on the magnet, so the smaller the tolerance the better.
The actual clearance between the outer radius of the brass cylin-der holding the magnets and the inner radius of the coil formerwas 0.35 mm. This tolerance was judged to be small enoughto allow a surrounding coil without having a significantly di-minished force characteristic from the air gap required to avoidcontact. It should be noted that this tolerance caused a degreeof inconvenience since the attachment and positioning of thecoil required careful alignment in order to allow free move-ment of the cylinder holding the magnets.
EXPERIMENTAL RESULTS
A number of measurements were performed using the exper-imental apparatus; in the sections following, measured datais presented for: magnet gap versus beam displacement; openloop frequency responses for a range of magnet gaps; and, ve-locity feedback in a single configuration.
Static displacement measurements
The upper magnet’s position was varied until the limit of stabil-ity was reached. The lower fixed magnet was kept fixed, whichmeans that the position of quasi–zero stiffness was changing;with counter-threaded mounts for the upper and lower mag-nets, they could be adjusted in parallel to achieve a fixed quasi–zero stiffness location.
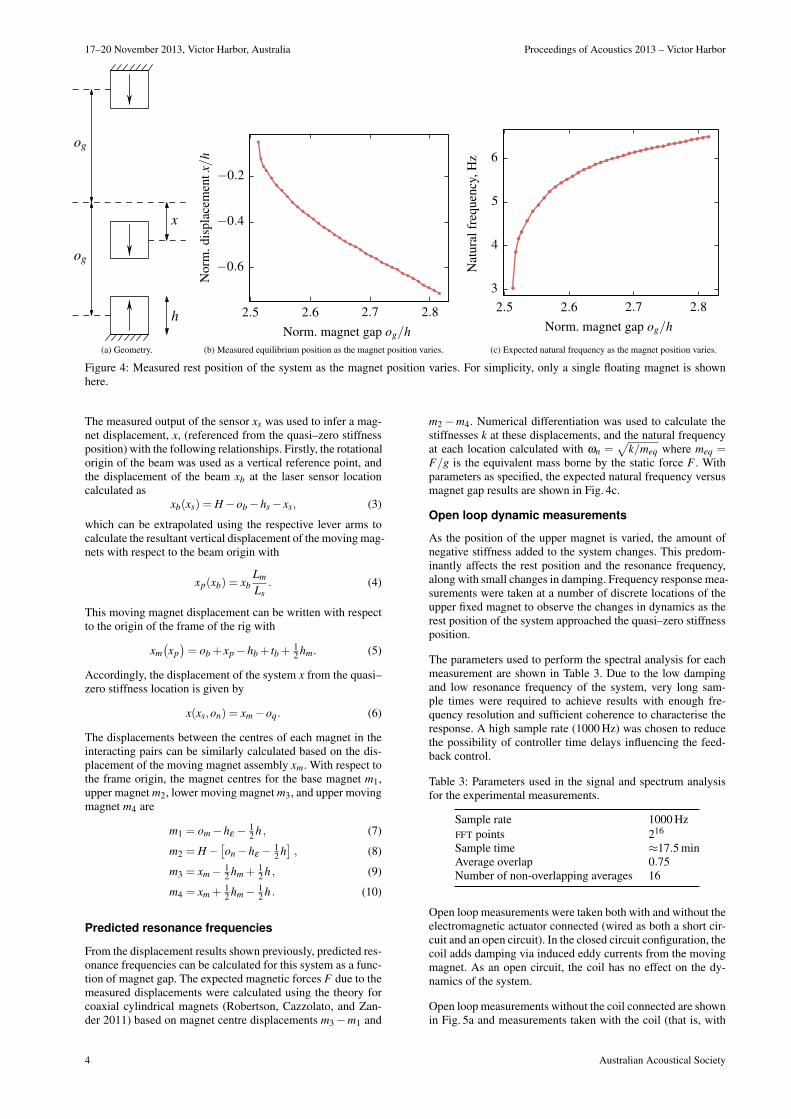
As the upper magnet placement was lowered, the rest positionof the beam moved closer to the quasi–zero stiffness position(as more force was supported by the upper magnet). This rela-tionship is shown in Fig. 4b. The normalised magnet gap g isused in the following sections to represent the varied config-uration of the spring in the experiments, defined as g = og/h,where og is the magnet gap at quasi–zero stiffness and h is theheight of the magnets. From the geometry of the rig, the posi-tion of the upper magnet was used to calculate the gap betweenthe magnets at quasi–zero stiffness:
og(on) =12[H−om−on−hm
]+h−hε , (1)
where geometrical properties are described in Table 1 and hε =2.5mm is an extra clearance to account for space taken upby the thicknesses of the magnet mounting. The height of thequasi–zero stiffness location itself, oq, is given by
oq(on) =12[H−om +on
]. (2)
Australian Acoustical Society 3
17–20 November 2013, Victor Harbor, Australia Proceedings of Acoustics 2013 – Victor Harbor
x
h
og
og
(a) Geometry.
Norm
.dis
pla
cem
ent
x/h
Norm. magnet gap og/h
2.5 2.6 2.7 2.8
−0.6
−0.4
−0.2
(b) Measured equilibrium position as the magnet position varies.
Nat
ural
freq
uenc
y,H
z
Norm. magnet gap og/h2.5 2.6 2.7 2.8
3
4
5
6
(c) Expected natural frequency as the magnet position varies.
Figure 4: Measured rest position of the system as the magnet position varies. For simplicity, only a single floating magnet is shownhere.
The measured output of the sensor xs was used to infer a mag-net displacement, x, (referenced from the quasi–zero stiffnessposition) with the following relationships. Firstly, the rotationalorigin of the beam was used as a vertical reference point, andthe displacement of the beam xb at the laser sensor locationcalculated as
xb(xs) = H−ob−hs− xs, (3)
which can be extrapolated using the respective lever arms tocalculate the resultant vertical displacement of the moving mag-nets with respect to the beam origin with
xp(xb) = xbLm
Ls. (4)
This moving magnet displacement can be written with respectto the origin of the frame of the rig with
xm(xp)= ob + xp−hb + tb + 1
2 hm. (5)
Accordingly, the displacement of the system x from the quasi–zero stiffness location is given by
x(xs,on) = xm−oq. (6)
The displacements between the centres of each magnet in theinteracting pairs can be similarly calculated based on the dis-placement of the moving magnet assembly xm. With respect tothe frame origin, the magnet centres for the base magnet m1,upper magnet m2, lower moving magnet m3, and upper movingmagnet m4 are
m1 = om−hε − 12 h , (7)
m2 = H−[on−hε − 1
2 h], (8)
m3 = xm− 12 hm + 1
2 h , (9)
m4 = xm + 12 hm− 1
2 h . (10)
Predicted resonance frequencies
From the displacement results shown previously, predicted res-onance frequencies can be calculated for this system as a func-tion of magnet gap. The expected magnetic forces F due to themeasured displacements were calculated using the theory forcoaxial cylindrical magnets (Robertson, Cazzolato, and Zan-der 2011) based on magnet centre displacements m3−m1 and
m2−m4. Numerical differentiation was used to calculate thestiffnesses k at these displacements, and the natural frequencyat each location calculated with ωn =
√k/meq where meq =
F/g is the equivalent mass borne by the static force F . Withparameters as specified, the expected natural frequency versusmagnet gap results are shown in Fig. 4c.
Open loop dynamic measurements
As the position of the upper magnet is varied, the amount ofnegative stiffness added to the system changes. This predom-inantly affects the rest position and the resonance frequency,along with small changes in damping. Frequency response mea-surements were taken at a number of discrete locations of theupper fixed magnet to observe the changes in dynamics as therest position of the system approached the quasi–zero stiffnessposition.
The parameters used to perform the spectral analysis for eachmeasurement are shown in Table 3. Due to the low dampingand low resonance frequency of the system, very long sam-ple times were required to achieve results with enough fre-quency resolution and sufficient coherence to characterise theresponse. A high sample rate (1000 Hz) was chosen to reducethe possibility of controller time delays influencing the feed-back control.
Table 3: Parameters used in the signal and spectrum analysisfor the experimental measurements.
Sample rate 1000 HzFFT points 216
Sample time ≈17.5 minAverage overlap 0.75Number of non-overlapping averages 16
Open loop measurements were taken both with and without theelectromagnetic actuator connected (wired as both a short cir-cuit and an open circuit). In the closed circuit configuration, thecoil adds damping via induced eddy currents from the movingmagnet. As an open circuit, the coil has no effect on the dy-namics of the system.
Open loop measurements without the coil connected are shownin Fig. 5a and measurements taken with the coil (that is, with
4 Australian Acoustical Society

Proceedings of Acoustics 2013 – Victor Harbor 17–20 November 2013, Victor Harbor, Australia
Tran
smis
sibi
lity
Frequency, Hz1 3 5 7 9 11
100
102
(a) Open circuit coil; no additional damping is added to the system.
Norm. gap g
2.522.532.542.552.572.582.61
Tran
smis
sibi
lity
Frequency, Hz1 3 5 7 9 11
100
102
(b) Closed circuit coil. The coil adds damping to the system, which can be seen by the reductionin height of the resonant peaks in comparison to Fig. 5a.
Figure 5: Open loop measurements with the electromagnetic coil connected in an open and closed circuit as a function of normalisedgap g.
added damping) are shown in Fig. 5b. For both of these results,the transmissibility T shown is the transfer function betweenthe accelerometer measurements of the base and magnet-supportedbeam:1
T =Pmb
Pbb, (11)
where Pmm is the power spectral density of the accelerometermeasurements at the moving magnet, Pbb is the power spectraldensity of the accelerometer measurements of the base, andPmb is the cross power spectral density of the two.
Analysis of the open loop data
From the measurements shown in the previous section, datafitting of the frequency response functions was used to ex-tract a linear model of the system in each configuration. Whilemore sophisticated techniques are possible (Chen, Liu, and Lai2009), fitting the data to a known exact frequency responsefunction yielded acceptable results in this case since the linearmodel is relatively simple.
The model used to fit the data was a single degree of freedomvibration isolation system in terms of the natural frequency,ωn =
√k/m, and damping ratio ζ = b/(2
√km):
T (iω) =2iζ ωωn +ω2
n−ω2 +2iζ ωωn +ω2
n, (12)
where ω is the frequency at which to calculate the transmis-sibility T (iω). The data was fit2 to Eq. (12) between 1
2 ωn ≤ω ≤ 2ωn, with well-fit transmissibility around the resonancepeak at each measurement taken. Due to the influence of un-modelled dynamics in the system, the model starts to deviatefrom the measured data at higher frequencies. The natural fre-quencies and damping ratios calculated from this curve fittingare shown in Fig. 6. Comparing the results with the coil circuitopen and closed, the resonance frequencies remained constantbut the damping ratios changed. With the actuator connected,movement of the actuator magnet caused eddy currents to beinduced in the coil, adding damping to the system.
The curve of the measured resonance frequencies (Fig. 6a) fol-lows the same trend as the predicted natural frequencies (re-drawn from Fig. 4c). However, their magnitudes are not well
1Calculated with Matlab’s tfestimate command.2Using Matlab’s fminsearch.
Res
onan
cefr
eque
ncy,
Hz
Norm. magnet gap g
Measured
Predicted
2.52 2.54 2.56 2.58 2.60
2
4
6
(a) Model-derived resonance frequencies shown with predicted values.
Dam
ping
ratio
ζ
Norm. magnet gap g
Open
Closed
2.52 2.54 2.56 2.58 2.6
0.01
0.02
0.03
0.04
0.05
0.06
(b) Model-derived damping ratios.
Figure 6: Analysed results from fitting the open loop measure-ments to the isolator model of Eq. (12).
Australian Acoustical Society 5
17–20 November 2013, Victor Harbor, Australia Proceedings of Acoustics 2013 – Victor Harbor
matched. As the system approaches the quasi–zero stiffnessposition, even small changes in alignment and physical toler-ances have significant effects on the calculated instability re-gion; as seen in the low end of the quasi-static measurements,Fig. 4c, a fraction of a millimetre change in the position of thetop magnet can change the natural frequency by 25%. Associa-tively, with larger magnet gaps the discrepancy becomes lower.Therefore, the discrepancy seen between theoretical and mea-sured results should be expected.
The resonance frequency of the system was unaffected by thepresence of the electromagnetic coil (which can also be ob-served by comparing Figs 5a and 5b) but the damping was in-creased significantly when the coil circuit was closed.
Observed nonlinear behaviour
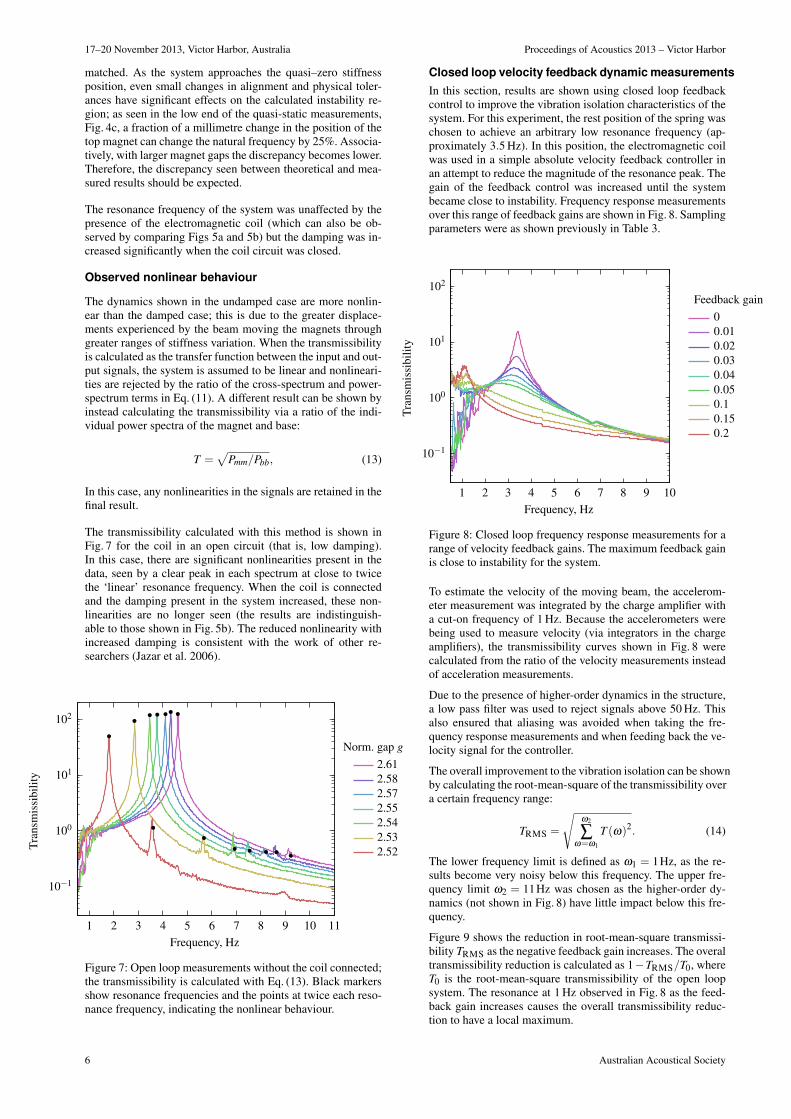
The dynamics shown in the undamped case are more nonlin-ear than the damped case; this is due to the greater displace-ments experienced by the beam moving the magnets throughgreater ranges of stiffness variation. When the transmissibilityis calculated as the transfer function between the input and out-put signals, the system is assumed to be linear and nonlineari-ties are rejected by the ratio of the cross-spectrum and power-spectrum terms in Eq. (11). A different result can be shown byinstead calculating the transmissibility via a ratio of the indi-vidual power spectra of the magnet and base:
T =√
Pmm/Pbb, (13)
In this case, any nonlinearities in the signals are retained in thefinal result.
The transmissibility calculated with this method is shown inFig. 7 for the coil in an open circuit (that is, low damping).In this case, there are significant nonlinearities present in thedata, seen by a clear peak in each spectrum at close to twicethe ‘linear’ resonance frequency. When the coil is connectedand the damping present in the system increased, these non-linearities are no longer seen (the results are indistinguish-able to those shown in Fig. 5b). The reduced nonlinearity withincreased damping is consistent with the work of other re-searchers (Jazar et al. 2006).
Norm. gap g
2.522.532.542.552.572.582.61
Tran
smis
sibi
lity
Frequency, Hz1 2 3 4 5 6 7 8 9 10 11
10−1
100
101
102
Figure 7: Open loop measurements without the coil connected;the transmissibility is calculated with Eq. (13). Black markersshow resonance frequencies and the points at twice each reso-nance frequency, indicating the nonlinear behaviour.
Closed loop velocity feedback dynamic measurementsIn this section, results are shown using closed loop feedbackcontrol to improve the vibration isolation characteristics of thesystem. For this experiment, the rest position of the spring waschosen to achieve an arbitrary low resonance frequency (ap-proximately 3.5 Hz). In this position, the electromagnetic coilwas used in a simple absolute velocity feedback controller inan attempt to reduce the magnitude of the resonance peak. Thegain of the feedback control was increased until the systembecame close to instability. Frequency response measurementsover this range of feedback gains are shown in Fig. 8. Samplingparameters were as shown previously in Table 3.
Feedback gain
0.20.150.10.050.040.030.020.010
Tran
smis
sibi
lity
Frequency, Hz1 2 3 4 5 6 7 8 9 10
10−1
100
101
102
Figure 8: Closed loop frequency response measurements for arange of velocity feedback gains. The maximum feedback gainis close to instability for the system.
To estimate the velocity of the moving beam, the accelerom-eter measurement was integrated by the charge amplifier witha cut-on frequency of 1 Hz. Because the accelerometers werebeing used to measure velocity (via integrators in the chargeamplifiers), the transmissibility curves shown in Fig. 8 werecalculated from the ratio of the velocity measurements insteadof acceleration measurements.
Due to the presence of higher-order dynamics in the structure,a low pass filter was used to reject signals above 50 Hz. Thisalso ensured that aliasing was avoided when taking the fre-quency response measurements and when feeding back the ve-locity signal for the controller.
The overall improvement to the vibration isolation can be shownby calculating the root-mean-square of the transmissibility overa certain frequency range:
TRMS =
√ω2
∑ω=ω1
T (ω)2. (14)
The lower frequency limit is defined as ω1 = 1Hz, as the re-sults become very noisy below this frequency. The upper fre-quency limit ω2 = 11Hz was chosen as the higher-order dy-namics (not shown in Fig. 8) have little impact below this fre-quency.
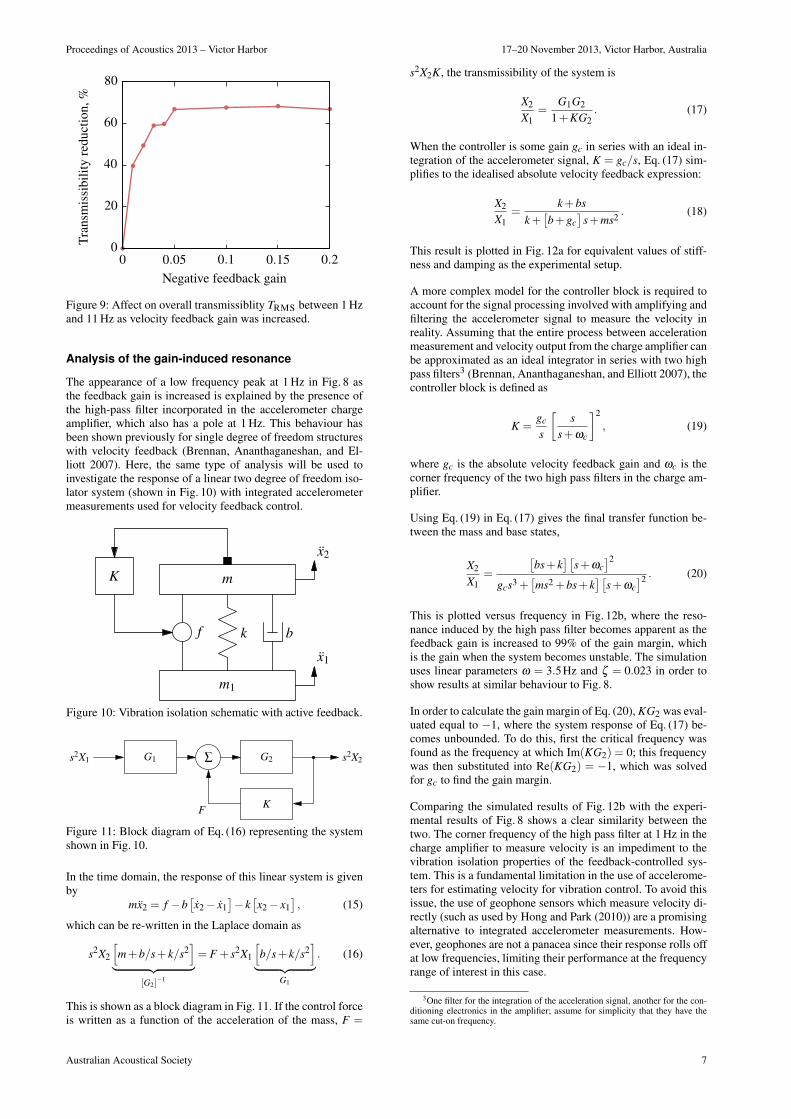
Figure 9 shows the reduction in root-mean-square transmissi-bility TRMS as the negative feedback gain increases. The overaltransmissibility reduction is calculated as 1−TRMS/T0, whereT0 is the root-mean-square transmissibility of the open loopsystem. The resonance at 1 Hz observed in Fig. 8 as the feed-back gain increases causes the overall transmissibility reduc-tion to have a local maximum.
6 Australian Acoustical Society
Proceedings of Acoustics 2013 – Victor Harbor 17–20 November 2013, Victor Harbor, Australia
Tran
smis
sibi
lity
redu
ctio
n,%
Negative feedback gain0 0.05 0.1 0.15 0.2
0
20
40
60
80
Figure 9: Affect on overall transmissiblity TRMS between 1 Hzand 11 Hz as velocity feedback gain was increased.
Analysis of the gain-induced resonance
The appearance of a low frequency peak at 1 Hz in Fig. 8 asthe feedback gain is increased is explained by the presence ofthe high-pass filter incorporated in the accelerometer chargeamplifier, which also has a pole at 1 Hz. This behaviour hasbeen shown previously for single degree of freedom structureswith velocity feedback (Brennan, Ananthaganeshan, and El-liott 2007). Here, the same type of analysis will be used toinvestigate the response of a linear two degree of freedom iso-lator system (shown in Fig. 10) with integrated accelerometermeasurements used for velocity feedback control.
m1
x1
k b
m
x2
K
f
Figure 10: Vibration isolation schematic with active feedback.
G1 G2∑
K
s2X1 s2X2
F
Figure 11: Block diagram of Eq. (16) representing the systemshown in Fig. 10.
In the time domain, the response of this linear system is givenby
mx2 = f −b[x2− x1
]− k[x2− x1
], (15)
which can be re-written in the Laplace domain as
s2X2
[m+b/s+ k/s2
]︸ ︷︷ ︸
[G2]−1
= F + s2X1
[b/s+ k/s2
]︸ ︷︷ ︸
G1
. (16)
This is shown as a block diagram in Fig. 11. If the control forceis written as a function of the acceleration of the mass, F =
s2X2K, the transmissibility of the system is
X2
X1=
G1G2
1+KG2. (17)
When the controller is some gain gc in series with an ideal in-tegration of the accelerometer signal, K = gc/s, Eq. (17) sim-plifies to the idealised absolute velocity feedback expression:
X2
X1=
k+bsk+[b+gc
]s+ms2 . (18)
This result is plotted in Fig. 12a for equivalent values of stiff-ness and damping as the experimental setup.
A more complex model for the controller block is required toaccount for the signal processing involved with amplifying andfiltering the accelerometer signal to measure the velocity inreality. Assuming that the entire process between accelerationmeasurement and velocity output from the charge amplifier canbe approximated as an ideal integrator in series with two highpass filters3 (Brennan, Ananthaganeshan, and Elliott 2007), thecontroller block is defined as
K =gc
s
[s
s+ωc
]2, (19)
where gc is the absolute velocity feedback gain and ωc is thecorner frequency of the two high pass filters in the charge am-plifier.
Using Eq. (19) in Eq. (17) gives the final transfer function be-tween the mass and base states,
X2
X1=
[bs+ k
][s+ωc
]2gcs3 +
[ms2 +bs+ k
][s+ωc
]2 . (20)
This is plotted versus frequency in Fig. 12b, where the reso-nance induced by the high pass filter becomes apparent as thefeedback gain is increased to 99% of the gain margin, whichis the gain when the system becomes unstable. The simulationuses linear parameters ω = 3.5Hz and ζ = 0.023 in order toshow results at similar behaviour to Fig. 8.
In order to calculate the gain margin of Eq. (20), KG2 was eval-uated equal to −1, where the system response of Eq. (17) be-comes unbounded. To do this, first the critical frequency wasfound as the frequency at which Im(KG2) = 0; this frequencywas then substituted into Re(KG2) = −1, which was solvedfor gc to find the gain margin.
Comparing the simulated results of Fig. 12b with the experi-mental results of Fig. 8 shows a clear similarity between thetwo. The corner frequency of the high pass filter at 1 Hz in thecharge amplifier to measure velocity is an impediment to thevibration isolation properties of the feedback-controlled sys-tem. This is a fundamental limitation in the use of accelerome-ters for estimating velocity for vibration control. To avoid thisissue, the use of geophone sensors which measure velocity di-rectly (such as used by Hong and Park (2010)) are a promisingalternative to integrated accelerometer measurements. How-ever, geophones are not a panacea since their response rolls offat low frequencies, limiting their performance at the frequencyrange of interest in this case.
3One filter for the integration of the acceleration signal, another for the con-ditioning electronics in the amplifier; assume for simplicity that they have thesame cut-on frequency.
Australian Acoustical Society 7
17–20 November 2013, Victor Harbor, Australia Proceedings of Acoustics 2013 – Victor Harbor
Frequency, Hz
Tra
nsm
issi
bil
ity
Increasing
gain
100 101
10−1
100
101
10−2
102
(a) Ideal velocity signal.
Frequency, Hz
Tra
nsm
issi
bil
ity
Increasing
gain
100 101
10−1
100
101
10−2
102
(b) Integrated accelerometer feedback with a second order high passfilter.
Figure 12: Closed loop simulation with gains0,5,10,20,50,99 percent of the gain margin in Fig. 12b.
CONCLUSION
In this paper, the experimental results have been presented froma magnetic system designed to demonstrate the ability of vari-able stiffness through position changes of the load-bearing mag-nets. As the system was brought closer to quasi–zero stiffness,the resonance frequency reduced until the operating point be-came too close to the position of marginal stability where evenslight disturbances would yield instability. The minimum reso-nance frequency that could be achieved passively with this sys-tem was around 2 Hz. A lower resonance frequency than thiscould potentially be achieved with larger magnets with largerequilibrium magnet gaps, which would result in a larger phys-ical region of stable operation near the quasi–zero stiffness po-sition.
Without feedback control and without the actuator coil con-nected, the system showed very small damping ratios of around0.005; these were dependent on the distance between the mag-nets at equilibrium. Connecting the non-contact electromag-netic actuator increased this damping ratio to around 0.03–0.04due to eddy currents induced in the coils from the permanentmagnet.
Dynamically, the system showed transmissibilities which couldbe modelled well by standard single degree of freedom models.With the very low damping of the open loop system, superhar-monics were clearly visible in the variance gain but the reso-nance peaks remained linear-like. Once the actuator was con-nected, the additional eddy current damping suppressed thesenonlinearities.
Absolute velocity feedback control was successful in reducingthe transmissibility peaks, but as the gain was increased theadditional poles added by the integration filters caused an ad-ditional lower frequency peak to appear as the closed loop sys-tem approached the gain margin. At best, the resonance peakwas reduced by over an order of magnitude and the root meansquare transmissibility was reduced by around 65%.
REFERENCES
Alabuzhev, P. et al. (1989). Vibration Protecting and Measuring Sys-tems with Quasi-Zero Stiffness. Ed. by E. Rivin. Applications ofVibration. Hemisphere Publishing Corporation. ISBN: 0-89116-811-7.
Bassani, R. (Aug. 2006). “Earnshaw (1805—1888) and Passive Mag-netic Levitation”. Meccanica 41.4, pp. 375–389. DOI: 10.1007/s11012-005-4503-x.
Brennan, M. J., K. A. Ananthaganeshan, and S. J. Elliott (July 2007).“Instabilities due to instrumentation phase-lead and phase-lag inthe feedback control of a simple vibrating system”. Journal ofSound and Vibration 304.3–5, pp. 466–478. DOI: 10.1016/j.jsv.2007.01.046.
Carrella, A., M. J. Brennan, and T. P. Waters (Apr. 2007). “Static anal-ysis of a passive vibration isolator with quasi-zero-stiffness char-acteristic”. Journal of Sound and Vibration 301.3–5, pp. 678–689.DOI: 10.1016/j.jsv.2006.10.011.
Carrella, A. et al. (2008). “On the design of a high-static-low-dynamicstiffness isolator using linear mechanical springs and magnets”.Journal of Sound and Vibration 315.3, pp. 712–720. DOI: 10 .1016/j.jsv.2008.01.046.
Carrella, A. et al. (May 2009). “On the force transmissibility of a vi-bration isolator with quasi-zero-stiffness”. Journal of Sound andVibration 322.4–5, pp. 707–717. DOI: 10.1016/j.jsv.2008.11.034.
Cella, G. et al. (2005). “Monolithic geometric anti-spring blades”. Nu-clear Instruments and Methods in Physics Research Section A: Ac-celerators, Spectrometers, Detectors and Associated Equipment540.2-3, pp. 502–519. DOI: 10.1016/j.nima.2004.10.042.
Chen, S.-L., J.-J. Liu, and H.-C. Lai (2009). “Wavelet analysis foridentification of damping ratios and natural frequencies”. Journalof Sound and Vibration 323.1-2, pp. 130–147. ISSN: 0022-460X.DOI: 10.1016/j.jsv.2009.01.029.
Hong, J. and K. Park (2010). “Design and control of six degree-of-freedom active vibration isolation table”. Review of Scientific In-struments 81.3. DOI: 10.1063/1.3298605.
Jazar, G. N. et al. (2006). “Frequency Response and Jump Avoidancein a Nonlinear Passive Engine Mount”. Journal of Vibration andControl 12, pp. 1205–1237. DOI: 10.1177/1077546306068059.
Lee, C.-M., V. N. Goverdovskiy, and A. I. Temnikov (May 2007).“Design of springs with "negative" stiffness to improve vehicledriver vibration isolation”. Journal of Sound and Vibration 302.4–5, pp. 865–874. DOI: 10.1016/j.jsv.2006.12.024.
Molyneux, W. G. (1957). Supports for vibration isolation. ARC/CP-322. Aeronautical Research Council, Great Britain. URL: http://nsdl.org/resource/2200/20061003060308472T.
Robertson, W., B. Cazzolato, and A. Zander (July 2007). “Nonlinearcontrol of a one axis magnetic spring”. Proceedings of the 14thInternational Congress on Sound and Vibration. Cairns, Australia.ISBN: 978 0 7334 2516 5. URL: http://hdl.handle.net/2440/44996.
— (2011). “A simplified force equation for coaxial cylindrical mag-nets and thin coils”. IEEE Transactions on Magnetics 47.8, pp. 2045–2049. DOI: 10.1109/TMAG.2011.2129524.
— (2012). “Axial force between a thick coil and a cylindrical per-manent magnet: optimising the geometry of an electromagneticactuator”. IEEE Transactions on Magnets 48.9. DOI: 10.1109/TMAG.2012.2194789.
Robertson, W. et al. (2006). “Zero-stiffness magnetic springs for ac-tive vibration isolation”. Proceedings of the Sixth InternationalSymposium on Active Noise and Vibration Control. URL: http://hdl.handle.net/2440/35429.
Robertson, W. S. et al. (2009). “Theoretical design parameters for aquasi-zero stiffness magnetic spring for vibration isolation”. Jour-nal of Sound and Vibration 326.1–2, pp. 88–103. DOI: 10.1016/j.jsv.2009.04.015.
Tarnai, T. (Mar. 2003). “Zero stiffness elastic structures”. InternationalJournal of Mechanical Sciences 45.3, pp. 425–431. DOI: 10.1016/S0020-7403(03)00063-8.
Zhu, T. et al. (2011). “The development of a 6 degree of freedom quasi-zero stiffness maglev vibration isolator with adaptive-passive loadsupport”. 15th International Conference on Mechatronics Tech-nology. URL: http://hdl.handle.net/2440/72548.
8 Australian Acoustical Society


![Experimental and Numerical Optimization of Magnetic ... · passive. Passive suction cups do not use an energy supply to attach to the surface. In [7] a legged wall climbing robot](https://img.dokumen.tips/doc/110x75/5eda7a95b3745412b571697d/experimental-and-numerical-optimization-of-magnetic-passive-passive-suction.jpg)