Embed Size (px)
Citation preview
For more information,
[email protected] or 617-253-7054 please visit our website at http://ebusiness.mit.edu
or contact the Center directly at
A research and education initiative at the MITSloan School of Management
Experimental Markets for Product Concepts
Paper 149
Nicholas T. Chan Ely Dahan Andrew W. Lo Tomaso Poggio
July 2001
Experimental Markets forProduct Concepts
Nicholas T. Chan, Ely Dahan, Andrew W. Loand Tomaso Poggio
AI Memo 2001-013 July 2001CBCL Memo 200
© 2 0 0 1 m a s s a c h u s e t t s i n s t i t u t e o f t e c h n o l o g y, c a m b r i d g e , m a 0 2 1 3 9 u s a — w w w. a i . m i t . e d u
m a s s a c h u s e t t s i n s t i t u t e o f t e c h n o l o g y — a r t i f i c i a l i n t e l l i g e n c e l a b o r a t o r y
Abstract
Market prices are well known to efficiently collect and aggregate diverse information re-garding the value of commodities and assets. The role of markets has been particularlysuitable to pricing financial securities. This article provides an alternative application ofthe pricing mechanism to marketing research - using pseudo-securities markets to measurepreferences over new product concepts. Surveys, focus groups, concept tests and conjointstudies are methods traditionally used to measure individual and aggregate preferences.Unfortunately, these methods can be biased, costly and time-consuming to conduct. Thepresent research is motivated by the desire to efficiently measure preferences and more ac-curately predict new product success, based on the efficiency and incentive-compatibilityof security trading markets. The article describes a novel market research method, pro-vides insight into why the method should work, and compares the results of several tradingexperiments against other methodologies such as concept testing and conjoint analysis.
This report describes research done within the Center for Biological and Computational Learning in the Departmentof Brain and Cognitive Sciences and in the Artificial Intelligence Laboratory at the Massachusetts Institute of Technology.This research was sponsored by grants from: Office of Naval Research under contract No. N00014-93-1-3085, Office ofNaval Research (DARPA) under contract No. N00014-00-1-0907, National Science Foundation (ITR) under contract No.IIS-0085836, National Science Foundation (KDI) under contract No. DMS-9872936, and National Science Foundationunder contract No. IIS-9800032 This research was partially funded by the Center for e-Business (MIT). Additional sup-port was provided by: Central Research Institute of Electric Power Industry, Eastman Kodak Company, DaimlerChryslerAG, Compaq, Honda R&D Co., Ltd., Komatsu Ltd., Merrill-Lynch, NEC Fund, Nippon Telegraph & Telephone, SiemensCorporate Research, Inc., and The Whitaker Foundation.
1 Introduction
Markets are well-known as an efficient tool to collect and aggregate diverse information regarding
the value of commodities and assets. They have been particularly successful in the domain of finan-
cial assets. This paper presents a study of markets through both simulations with artificial agents and
experiments with human subjects. Specifically, we explore an alternative application of the market
mechanism to marketing research—using markets to collect consumer preferences on virtual product
concepts. This application of markets is motivated by the desire to seek alternative reliable and ac-
curate means to collect consumer preferences, and the belief that markets are efficient in aggregating
information.
This paper presents the results of three market experiments in which participants express their
preferences on some new product concepts by trading virtual securities. The preferences collected are
compared and studied together with results derived from a separate study of the same problem using a
survey method. We find that results across different market experiments are consistent with each other,
and in addition, highly correlated with those from the independent survey method. To gain a better
understanding how markets work in this particular application, we relate our market experiments with
some classic examples from the experimental economics literature. Lastly we propose some conjectures
on issues including how equilibrium prices are related to individual participants’ preferences, how
participants gather and process information, and what possible trading strategies are.
The essence of the markets for product concepts centers around the establishment of virtual stock
markets that trade virtual securities, each associated with an underlying product or service. These prod-
ucts or services could be a concept or prototype under evaluation or an existing product that anchors the
market to the real world. Upon entering a concept market, each participant receives an initial portfolio
of cash (virtual or real) and virtual stocks. Participants are also provided with detailed information on
the products (stocks) that includes specifications, images, and multimedia illustrations. The objective
of the market game is to maximize the value of the portfolio, evaluated at the market closing price. If
participants play with real money, they will have the opportunity to profit from trading and bear the
risk of losing money. The financial stakes in the game provide incentives to reveal true preferences,
1
process information and conduct research. If fictitious money is used, prizes can be awarded according
to individuals’ performance. One can also reward all participants just for their service.
As in financial markets, the prices of the stocks are determined by the demand and supply in the
market, which depend on the participants’ evaluation of their own and others’ preferences of the un-
derlying products. Thus at the market equilibrium, prices should reflect all participants’ aggregate
preference of the products. Traders make trading decisions just as they would in a financial stock mar-
ket: they assess the values of the stocks, sell the overvalued and buy the undervalued. Traders buy and
sell virtual stocks, essentially voting on the worth of the products. In this way, a stock’s price becomes
a convenient index of a product’s consumer value.
Surveys, polls, and focus groups are the traditional methods to collect such information. Concept
markets can serve as an alternative means to the same tasks or as a compliment to other methods. There
are multiple reasons why the market mechanism can add value to the collection of diverse consumer
preferences:
� Accuracy: Market participants have more incentives to trade according to the best of their knowl-
edge because of their financial stakes in the market. The market can also capture, continuously,
the ever changing “consumer impulse” for all participants who can express their opinions mul-
tiple times during the course of the market. Furthermore markets allow for dynamic movement
of a virtual product’s worth or price along a slide scale, rather than attempting to collect yes/no
survey answers when consumer’s real sentiment lies somewhere in between.
� Learning and Interaction: A concept market participant is not only evaluating on behalf of him-
self or herself, but also considering the opinion of the public at large. Furthermore, participants
can observe others’ valuations of the virtual products and adjust their own dynamically in the
market environment. Learning is an important element in these markets.
� Scalability: Unlike surveys, markets are intrinsically highly scalable. In fact, the efficiency of
the market, and therefore the quality of data collected, improves with the number of participants.
� Ambiguous and Intangible Attributes: The market method is particularly useful over survey meth-
2

ods when a product cannot be naturally described or represented by a set of attributes (for exam-
ple, a movie script). Market participants would evaluate the concepts directly and market prices
would effectively reflect the overall viability of the concepts.
However, we also recognize limitations of the market method. Unlike typical marketing research tech-
niques, in which information is collected from individuals and aggregated in subsequent analysis, the
market method focuses on aggregate beliefs and preferences and neglects those of individuals’. Virtual
concepts markets are vulnerable to price manipulations and speculative bubbles because the values of
virtual securities hinge on the aggregate beliefs, which are endogenously determined within the same
market. Traders may form false beliefs that could cause prices to deviate from their fundamentals. For
these reasons, the market method must be applied with cautions and consistency of the results must be
checked.
The rest of the paper is organized as follows. Section 2 provides the background for survey mar-
kets, which includes an overview of similar opinion-collecting markets on the web, a description of a
concept testing project that this study is based on, and relevant research in experimental economics.
Section 3 presents the designs of the securities and markets. Section 4 provides conjectures on how
the survey markets work by considering an equilibrium model and simulations with artificial agents.
Lastly, section 5 presents results from three market experiments.
2 Background
2.1 Opinion-collecting Electronic Markets
The application of the market mechanism is not restricted to the pricing of assets in financial markets.
Different non-financial markets have been established for opinion polling, forecasts and predictions.
The Iowa Electronic Markets (IEM)1 from the University of Iowa is one of the pioneers of non-financial
markets in the polling of opinions (Forsythe, Nelson, Neumann & Wright (1993)). The IEM was
founded for research and educational purposes. Trading profits from the market provide incentives1The Iowa Electronic Markets http://www.biz.uiowa.edu/iem/
3
for traders to collect and process information of relevant future events. The IEM features real-money
futures markets in which contract payoffs depend on the outcome of future political and economic
events. Examples of these markets are the U.S. Presidential Election Market and the Computer Industry
Returns Markets. In the U.S. Presidential Election Vote Share Market, for example, the contract RepVS
would pay $1�00 times the vote share (percentage of popular vote) received by the Republican Party
nominee, George W. Bush, in the November 2000 election. Traders at IEM invest their own funds,
buy and sell listed contracts according their own judgment of the likelihood of the underlying events,
which is equivalent to the values of the corresponding contracts. On the election day, the contract
RepVS (Bush) was liquidated at $0�497 while the contract DemVS (the Democratic Party nominee,
Al Gore) was liquidated at $0�499, indicating that the overall market ”thought” that Bush and Gore
would receive 49�7% and 49�9% of the popular votes respectively.2 IEM predicted the voting results,
in terms of popular votes, of the past two Presidential elections within two-tenths of a percentage point,
outperforming most national polls.3 The Gallup Poll’s predictions, for example, deviated from election
results by 1�9% and 5�7% for the Democratic candidates in years 1992 and 1996 respectively.4
With a similar idea, the Hollywood Stock Exchange or HSX5 establishes virtual markets trading
movie stocks and star bonds. Each share of a movie stock pays a percentage of a particular movie’s
U.S. box office total; a star bond is priced based on a movie star’s performance at the box office of his
or her recently released movies. Prices of these stocks and bonds are determined by the demand and
supply in the market, which in turn depend on players’ consensus. Players trade with fictitious money
called “Hollywood dollar.” Market prices serve as predictions on earnings of movies and consensus
of movie stars’ popularity. Box office forecast is an invaluable service to film makers and Hollywood
marketers. But traditional marketing research techniques have been found notoriously inaccurate and
unreliable.6 HSX markets provide an alternative means of obtaining such forecasts in an arbitrarily
large scale inexpensively.2Bush and Gore received 47�87% and 48�38% of the popular vote respectively.3Business Week, 11/11/96.4http://www.gallup.com/Election2000/historicalsummary.htm5The Hollywood Stock Exchange http://www.hsx.com6Wall Street Journal July 21, 2000. Box Office Muddle: How Will Films Fare From Week to Week.
4

2.2 Virtual Concept Testing
Our virtual markets are set up to collect consumer preferences to facilitate product concept testing,
a critical step in new product development. Concept testing is a procedure to narrow down multiple
design concepts to the ”optimal” design according to the responses collected from potential users of
the product or service being studied. Dahan & Srinivansan (2000) presents a methodology that con-
ducts product concept testing over the Internet using virtual prototypes in place of real, physical ones.
The authors consider the World Wide Web as an attractive environment for conducting marketing re-
search because of its interactive nature, instantaneous access to respondents, and availability of new
technologies to deliver rich multimedia contents. The authors claim that the use of virtual product re-
duces costs in new product development so that a larger number of concepts can be explored. In their
Internet-based approach, virtual prototypes are presented in the form of visual static illustrations and
animations, plus a virtual shopping experience. Through an interactive Web page, respondents are able
to rank different products by specifying the prices they are willing pay for individual products. After
data are collected from respondents, conjoint analysis is conducted to obtain market share predictions
of the concept products. Conjoint analysis is a technique used to decompose respondents’ preference
on individual attributes of a product based on their overall preferences. Green & Wind (1981) provides
a tutorial of the technique. The goal of the study is to choose the best design of a bicycle bump among
nine concept products and two commercially available products. The authors find that the virtual pro-
totype tests produce market share predictions that closely resemble to those given by tests in which real
physical prototypes are used.
Following this successful use of virtual prototypes, we adopt the virtual illustrations and animations
from Dahan & Srinivansan (2000) to study the same problem. But instead of conducting surveys, virtual
markets are set up.
2.3 Rational Expectation Models and Experimental Markets
Our trading experiments are closely related to the literatures in rational expectations model and ex-
perimental markets. A typical rational expectations (RE) model (Grossman & Stiglitz (1980)) studies
5
a market of agents with diverse information. Under certain conditions, the competitive equilibrium
prices will reveal all relevant information. The most important criterion for convergence is that agents
condition their beliefs on market information. In particular, agents make inferences from market infor-
mation about other agents’ private information. The RE model has received considerable attention in
the study of experimental markets. Studies of the informational efficiency of a market relative to the
RE benchmark fall into two categories: information dissemination between fully informed agents (”in-
siders”) and uninformed agents, and information aggregation among many partially informed agents.
Plott & Sunder (1982), Plott & Sunder (1988), Forsythe, Palfrey & Plot (1982) and O’Brien & Sri-
vastava (1991) show that both information aggregation and dissemination occur successfully—markets
attain the rational expectations equilibrium—in various experimental markets with human subjects.
Our trading experiments share some common characteristics with experimental markets. Both in-
formation aggregation and dissemination can offer explanations on the underlying activities in our
virtual markets. One possible scenario is that there may be traders who possess superior information
about the products or have high confidence on their beliefs. These can be considered as “insiders.” On
the other hand, traders who have little knowledge or opinion of the products can be regarded as the “un-
informed.” The interaction between the insider and uninformed constitutes a scenario of information
dissemination. What is intriguing about this scenario is that even with the presence of traders, who may
ignore the underlying product information and only focus on market information, the market could still
converge to efficient prices that reflect all the relevant information or beliefs. Another possibility is
that individual traders form their own beliefs about the products, and realize that market prices would
depend on the aggregate beliefs. This is similar to the information aggregation scenario where traders
are partially informed.
However, there are also significant differences between our product concept markets and those
in the experimental markets literature. In a typical experimental market, subjects’ preferences and
their information set are fixed and assigned by the researchers. Therefore, even before trading begins,
theoretical equilibrium prices can be calculated. In contrast, in concept market experiments, neither
subjects’ preferences nor their information sets are known. In fact, these are what experiments aim to
6
discover.
3 Design of Markets and Securities
The market method is applied to the same product concept testing problem presented in Dahan & Srini-
vansan (2000). Three trading experiments were conducted to predict the market share of nine concept
bike pumps. A market is set up with eleven securities—nine concept products and two commercially
available products—corresponding to the eleven bike pumps in Dahan & Srinivansan (2000). Each of
the securities is the stock of the virtual company that manufactures and sells a particular pump as its
only product. These pump-manufacturing companies will go public, and their initial public offering
(IPO) prices are to be determined in our virtual market. All companies will offer the same number of
shares of common stock to the public. The objective of the game is to maximize the value of one’s
portfolio at market close. The value of a portfolio is calculated as the sum of the cash and total worth of
the stocks, which are valued at the market closing prices. Participants should strive to maximize their
profits by trading the stocks using their personal valuation of the companies, as well as any information
they can observe from the trading dynamics. Fictitious money was used in the markets, but we rewarded
top players with prizes. This provides the participants an incentive to perform in the experiments. It
is assumed that all the eleven companies have identical production cost structures, manufacturing ca-
pacity, distribution channels, financial structures, management expertise and all other factors that may
affect their profitability. In other words, all factors other than the quality and desirability of the pumps
can be ignored in valuing the stocks.
The eleven bike pump companies are Cyclone, AirStik, Soliboc, Gearhead, Silver Bullet, TRS,
Gecko, Epic, Skitzo, RimGripper and 2wister. To anchor the value of the fictitious currency, one of
the eleven securities—Cyclone—has its price fixed at $10 and is not traded. Cyclone is served as a
reference price or numeraire security. For example, if a trader thinks that the company TRS is worth
twice as much as Cyclone, he or she would pay up to $20 for one share of TRS. The stocks of the ten
freely traded companies may be priced at any level, depending on the demand and supply in the market.
7

A typical trading experiments is conducted in the following way. Detailed product information for
the bike pumps are given in the form of static illustrations and animations (see Figure 1), as in Dahan
& Srinivansan (2000). These visual depictions show participants the appearance of the pumps as well
as how they work. In addition, each bike pump is rated in terms of four attributes: the speed with
which a pump inflates a tire, compactness, the ease of operation and durability. The participants are
presented with a single Web page with the visual depictions and profiles of the bike pumps, trading
instructions, and the objective of the trading game. They have ten minutes to study the material before
trading begins.
All participants are provided with an identical portfolio that consists of $10�000 of cash and 100
shares for each of the securities. No borrowing or short-selling is allowed in the market. At the end of
the experiments, we reward the top three players with highest portfolio values with Amazon.com gift
certificates of $50, $30 and $20 respectively. Participants first log in with self-chosen user-names and
passwords (see Figure 2a), then trade the securities through a graphical user interface (see Figure 2b).
Market information available to the traders includes the last transaction price and size, current bid/ask
prices and sizes, and a historical price and volume chart for each security. A trader can submit either a
limit or market order to trade, or cancel an outstanding order that has not been executed. The markets
are typical double auction markets with no market-makers. A transaction occurs when a market or
limit order matches with a limit order on the opposite side of the market. All prices are specified in
one-sixteenth of a dollar.
4 Possible Trading Strategies
Our market experiments serve to aggregate diverse preferences or beliefs from all participants. One’s
belief may consist of three independent elements:
� Product information — This is what a participant knows about the underlying products. All
participants are provided with the same facts and specifications of the products, but they may
have obtained extra product information from their personal experience outside the experiments.
8

(a)
(b)
Figure 1: The profiles of the eleven bike pumps.
9

(a)
(b)
Figure 2: Login and trading interface.
10
� A participant’s personal preference — This is what surveys and polls try to collect. Although the
aggregate preferences of the whole market is the object of interest, one’s personal view should
contribute to his or her trading decisions.
� A participant’s assessment of others’ preferences — A participant would form an assessment of
what others think so as to make profitable trading decisions.
How are beliefs or preferences aggregated in these markets with virtual securities? Not only should
the traders form their own assessment of the stocks, but they should also infer the stocks’ potential
market value from the market. In a typical market in experimental economics, both the preferences
of the traders and the state of nature (for example, probability distribution of a security payoff) are
known to the researchers (Plott & Sunder (1982); Plott & Sunder (1988); Forsythe & Lundholm (1990);
O’Brien & Srivastava (1991)). Traders are assigned with preferences that specify securities payoffs in
various possible states. The theoretical equilibrium (rational expectations equilibrium) prices can be
derived given full information of the markets. The main focus of these experiments is whether and
under what conditions rational expectations equilibria can be attained in double auction markets. Some
attempts have been made to understand the convergence of prices and how learning occurs in the market
as a whole. But it is unclear how individual human traders learn and react to the market. Attempts to
model the trading strategies of individual traders from the market data may be overly ambitious. Here
we try to shed some light on some possible strategies.
The objective of the trading game is to predict the final prices of the securities. A trader may form an
assessment of the fair values of the securities before trading starts. This opinion may take into account
her own preference on the underlying products, and perhaps more importantly what she perceives as
the preferences of the whole group. The trader may then make trading decisions based on her belief:
she buys undervalued stocks and sells over-valued ones. During the course of the market, the trader
may either maintain her valuations or update her beliefs in real time conditioning on her observation of
the market dynamics. Learning is taking place if the latter approach is taken. But learning is a rather
complex process because one’s expectations of prices affect prices, prices are used to infer others’
assessments, and the inference of others’ assessments in turn affects both prices and expectations of
11
prices.
Some traders may take a dramatically different approach by largely ignoring all fundamental infor-
mation about the underlying products but focusing on market information only. These traders play the
roles of speculators or market-makers who try to gain from the market by taking advantage of price
volatility, providing liquidity or looking for arbitrage opportunities. Their presence may introduce
mixed effects to the market. While they could enhance liquidity on one hand, they may also introduce
speculative bubbles and excess volatility into the market.
Appendix A provides an example of how such a market works with a theoretical equilibirum model
in which agents aggregate diverse beliefs within a group. The illustration is continued in Appendix B
with simulations of artificial agents.
5 Experimental Results and Comparison with Survey Study
Three trading experiments were conducted from September 1999 to April 2000. Subjects in the trad-
ing experiments are MBA students from MIT Sloan School of Management.7 Experiments 1 and 2
were conducted at a centralized location, the Sloan school trading laboratory. These two experiments
were not timed—we closed the market when trading activities died down. They lasted 10 and 18 min-
utes. Experiment 3, on the other hand, was conducted over the Internet—participants joined the market
remotely from arbitrary locations. The market was open for trading for one hour, during which par-
ticipants might enter or leave the market as they wished. The longer trading time was aimed to offer
more flexibility to the participants and investigate whether time constraints affect the trading activities
of a market. There are 18 to 27 participants in each of the experiments. Table 1 describes the details of
the experiments. Experiment 3 has the highest volume (in share and trade) despite a small number of
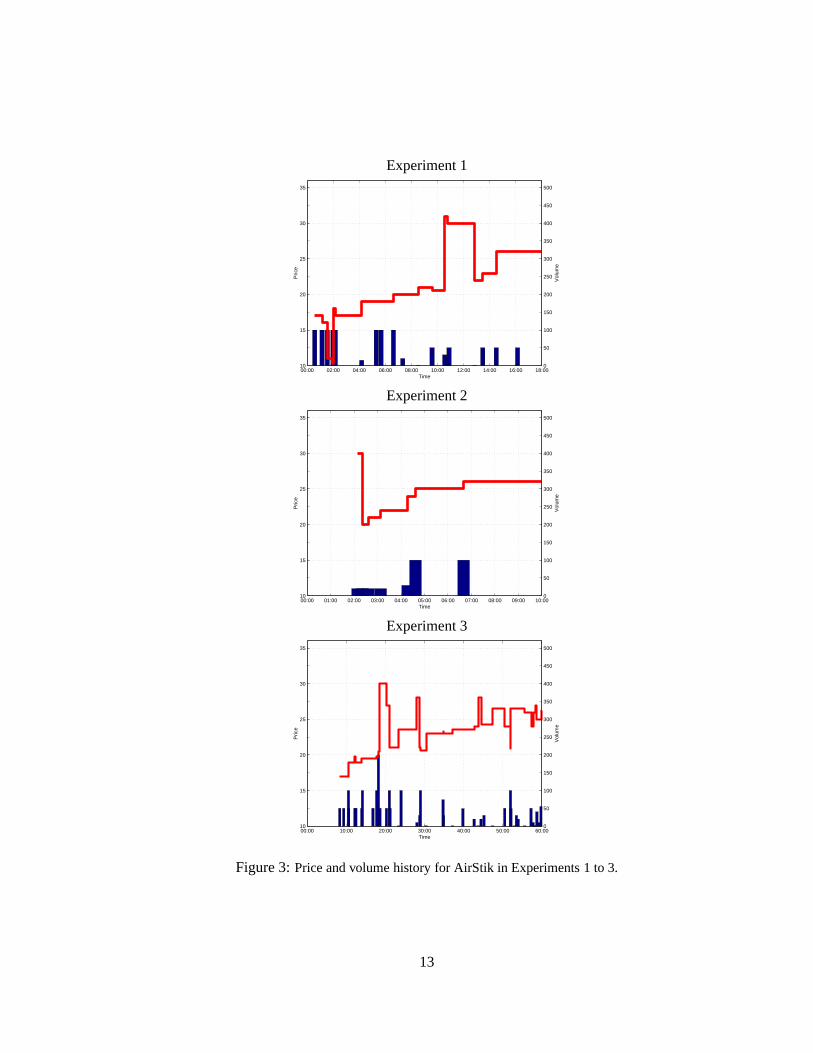
participants. This seems to suggest that a longer duration does generate more trading interest. Figure 3
presents the sample price and volume history of a virtual stock—AirStik—in Experiments 1 to 3. The
prices close around $25 in the three experiments.7Three groups of students were recruited from Prof. Ely Dahan’s class 15.828 New Product Development in fall 1999
and Prof. Andrew W. Lo’s class 15.433 Investment in Spring 2000.
12
Experiment 1
0
50
100
150
200
250
300
350
400
450
500
Vol
ume
Pric
e
Time00:00 02:00 04:00 06:00 08:00 10:00 12:00 14:00 16:00 18:0010
15
20
25
30
35
Experiment 2
0
50
100
150
200
250
300
350
400
450
500
Vol
ume
Pric
e
Time00:00 01:00 02:00 03:00 04:00 05:00 06:00 07:00 08:00 09:00 10:0010
15
20
25
30
35
Experiment 3
0
50
100
150
200
250
300
350
400
450
500
Vol
ume
Pric
e
Time00:00 10:00 20:00 30:00 40:00 50:00 60:0010
15
20
25
30
35
Figure 3: Price and volume history for AirStik in Experiments 1 to 3.
13
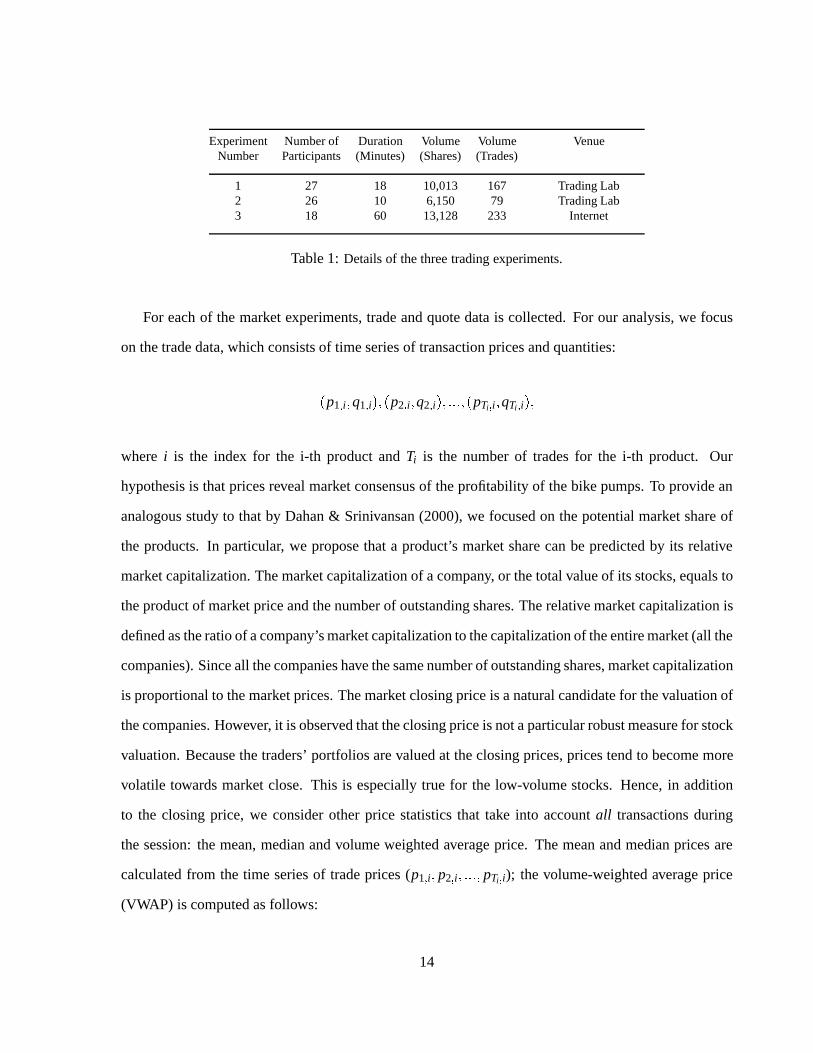
Experiment Number of Duration Volume Volume VenueNumber Participants (Minutes) (Shares) (Trades)
1 27 18 10,013 167 Trading Lab2 26 10 6,150 79 Trading Lab3 18 60 13,128 233 Internet
Table 1: Details of the three trading experiments.
For each of the market experiments, trade and quote data is collected. For our analysis, we focus
on the trade data, which consists of time series of transaction prices and quantities:
�p1�i�q1�i���p2�i�q2�i�� �����pTi�i�qTi�i��
where i is the index for the i-th product and Ti is the number of trades for the i-th product. Our
hypothesis is that prices reveal market consensus of the profitability of the bike pumps. To provide an
analogous study to that by Dahan & Srinivansan (2000), we focused on the potential market share of
the products. In particular, we propose that a product’s market share can be predicted by its relative
market capitalization. The market capitalization of a company, or the total value of its stocks, equals to
the product of market price and the number of outstanding shares. The relative market capitalization is
defined as the ratio of a company’s market capitalization to the capitalization of the entire market (all the
companies). Since all the companies have the same number of outstanding shares, market capitalization
is proportional to the market prices. The market closing price is a natural candidate for the valuation of
the companies. However, it is observed that the closing price is not a particular robust measure for stock
valuation. Because the traders’ portfolios are valued at the closing prices, prices tend to become more
volatile towards market close. This is especially true for the low-volume stocks. Hence, in addition
to the closing price, we consider other price statistics that take into account all transactions during
the session: the mean, median and volume weighted average price. The mean and median prices are
calculated from the time series of trade prices (p1�i� p2�i� ���� pTi�i); the volume-weighted average price
(VWAP) is computed as follows:
14
VWAPi �∑Ti
t�1 pt�iqt�i
∑Tit�1 qt�i
�
The mean price is sensitive to outliers—a small number of transactions that occur at extreme prices.
Both mean and median prices ignore the volume in a transaction and treat all transactions equally.
Volume can be regarded as a measure of the amount of information in a transaction. A trade with
higher volume is generally more informative than one with lower volume. In our concept markets,
volume is also related to how confident the traders are at the corresponding transaction price. VWAP
effectively summarizes the prices by considering the amount of information and confidence behind the
trades. In practice, VWAP has been a widely accepted benchmark price in financial markets. It is a
commonly used metric for the evaluation of trade executions.
Now given a price statistic spi , which can be the closing, mean, median or volume weighted average
prices, we can compute predicted market share as the relative market capitalization.
MSi �sp
i n
∑Nj�1 sp
j n�
spi
∑Nj�1 sp
j
�
where N is the number of securities in the market and n is the total number of shares for a security.
Among the four price statistics, we expect the median price and VWAP to be particularly robust against
potential price volatility. To relate these metrics to those in the computer simulations, it is important
to point out that the mean price in Appendix B is equivalent to the VWAP because all transactions are
restricted one share.
To verify the validity of the market method, we ask two questions: (1) whether the results from
the market method are consistent across different experiments, and (2) how close the results from the
markets are to those from the independent survey study. We focus on the market share predictions
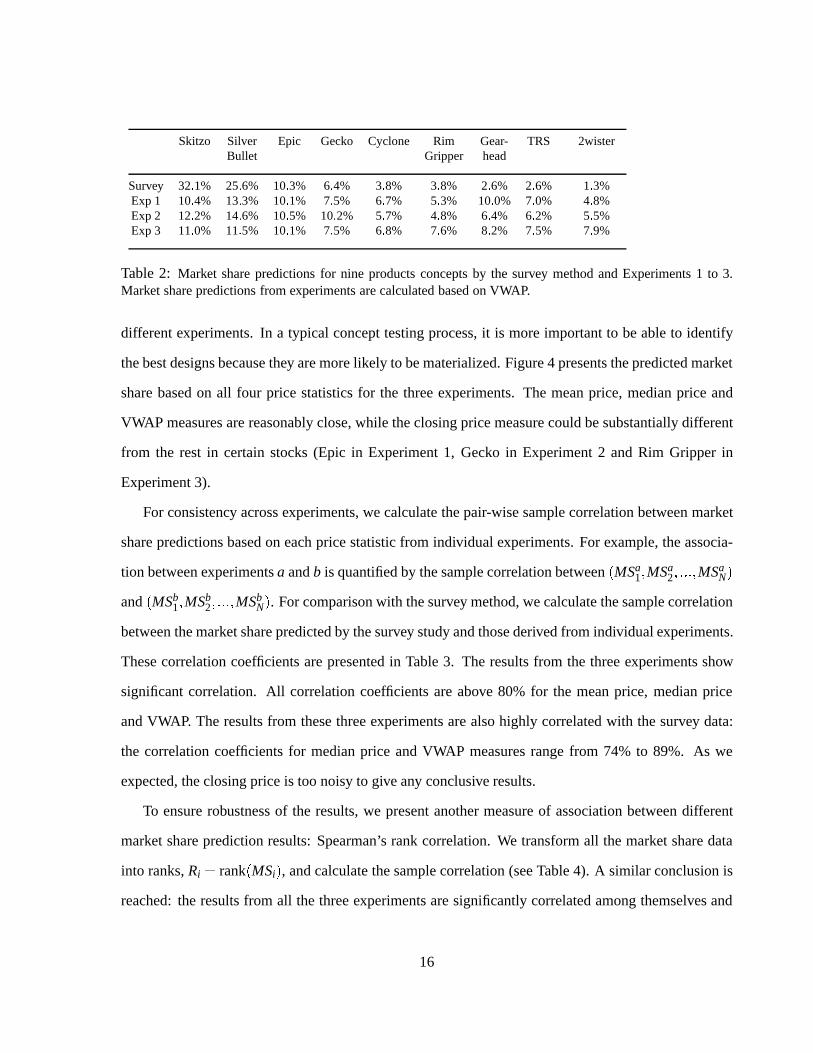
derived from the four types of price statistics and those from the survey. Table 2 presents the predicted
market share based on VWAP for the three experiments. We find that the top three products (Skitzo,
Silver Bullet and Epic), in terms of predicted market share, are the same in the three experiments, as
well as from the survey study. Furthermore, the rankings among the three are exactly the same across
15
Skitzo Silver Epic Gecko Cyclone Rim Gear- TRS 2wisterBullet Gripper head
Survey 32�1% 25�6% 10�3% 6�4% 3�8% 3�8% 2�6% 2�6% 1�3%Exp 1 10�4% 13�3% 10�1% 7�5% 6�7% 5�3% 10�0% 7�0% 4�8%Exp 2 12�2% 14�6% 10�5% 10�2% 5�7% 4�8% 6�4% 6�2% 5�5%Exp 3 11�0% 11�5% 10�1% 7�5% 6�8% 7�6% 8�2% 7�5% 7�9%
Table 2: Market share predictions for nine products concepts by the survey method and Experiments 1 to 3.Market share predictions from experiments are calculated based on VWAP.
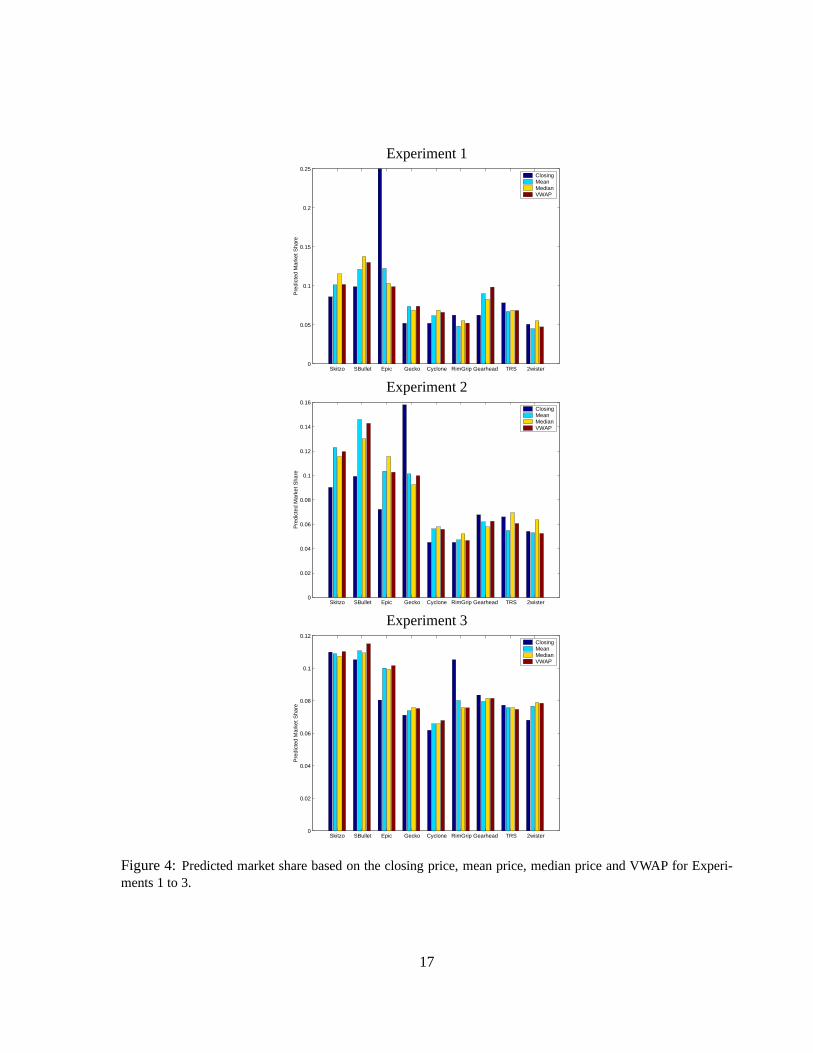
different experiments. In a typical concept testing process, it is more important to be able to identify
the best designs because they are more likely to be materialized. Figure 4 presents the predicted market
share based on all four price statistics for the three experiments. The mean price, median price and
VWAP measures are reasonably close, while the closing price measure could be substantially different
from the rest in certain stocks (Epic in Experiment 1, Gecko in Experiment 2 and Rim Gripper in
Experiment 3).
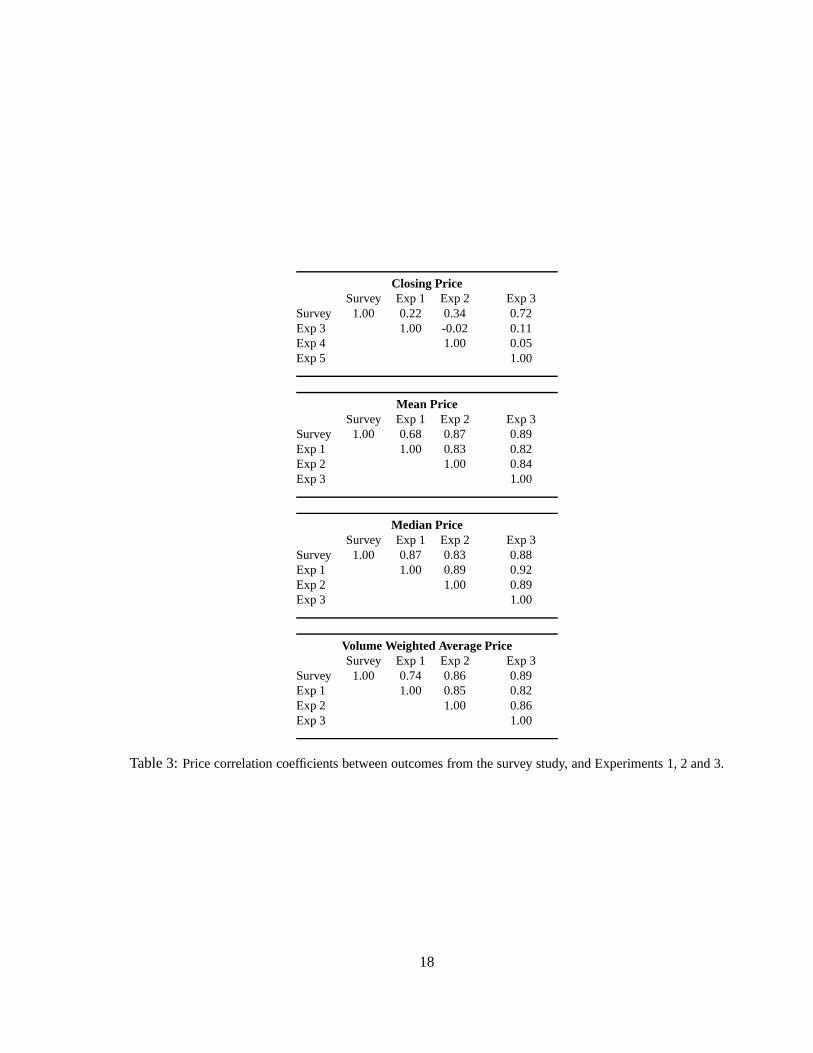
For consistency across experiments, we calculate the pair-wise sample correlation between market
share predictions based on each price statistic from individual experiments. For example, the associa-
tion between experiments a and b is quantified by the sample correlation between �MSa1�MSa
2� ����MSaN�
and �MSb1�MSb
2� ����MSbN�. For comparison with the survey method, we calculate the sample correlation
between the market share predicted by the survey study and those derived from individual experiments.
These correlation coefficients are presented in Table 3. The results from the three experiments show
significant correlation. All correlation coefficients are above 80% for the mean price, median price
and VWAP. The results from these three experiments are also highly correlated with the survey data:
the correlation coefficients for median price and VWAP measures range from 74% to 89%. As we
expected, the closing price is too noisy to give any conclusive results.
To ensure robustness of the results, we present another measure of association between different
market share prediction results: Spearman’s rank correlation. We transform all the market share data
into ranks, Ri � rank�MSi�, and calculate the sample correlation (see Table 4). A similar conclusion is
reached: the results from all the three experiments are significantly correlated among themselves and
16
Experiment 1
Skitzo SBullet Epic Gecko Cyclone RimGrip Gearhead TRS 2wister0
0.05
0.1
0.15
0.2
0.25
Pre
dict
ed M
arke
t Sha
re
ClosingMean Median VWAP
Experiment 2
Skitzo SBullet Epic Gecko Cyclone RimGrip Gearhead TRS 2wister0
0.02
0.04
0.06
0.08
0.1
0.12
0.14
0.16
Pre
dict
ed M
arke
t Sha
re
ClosingMean Median VWAP
Experiment 3
Skitzo SBullet Epic Gecko Cyclone RimGrip Gearhead TRS 2wister0
0.02
0.04
0.06
0.08
0.1
0.12
Pre
dict
ed M
arke
t Sha
re
ClosingMean Median VWAP
Figure 4: Predicted market share based on the closing price, mean price, median price and VWAP for Experi-ments 1 to 3.
17
Closing PriceSurvey Exp 1 Exp 2 Exp 3
Survey 1.00 0.22 0.34 0.72Exp 3 1.00 -0.02 0.11Exp 4 1.00 0.05Exp 5 1.00
Mean PriceSurvey Exp 1 Exp 2 Exp 3
Survey 1.00 0.68 0.87 0.89Exp 1 1.00 0.83 0.82Exp 2 1.00 0.84Exp 3 1.00
Median PriceSurvey Exp 1 Exp 2 Exp 3
Survey 1.00 0.87 0.83 0.88Exp 1 1.00 0.89 0.92Exp 2 1.00 0.89Exp 3 1.00
Volume Weighted Average PriceSurvey Exp 1 Exp 2 Exp 3
Survey 1.00 0.74 0.86 0.89Exp 1 1.00 0.85 0.82Exp 2 1.00 0.86Exp 3 1.00
Table 3: Price correlation coefficients between outcomes from the survey study, and Experiments 1, 2 and 3.
18
Closing PriceSurvey Exp 1 Exp 2 Exp 3
Survey 1.00 0.66 0.63 0.58Exp 1 1.00 0.42 0.68Exp 2 1.00 0.34Exp 3 1.00
Mean PriceSurvey Exp 1 Exp 2 Exp 3
Survey 1.00 0.73 0.82 0.60Exp 1 1.00 0.90 0.62Exp 2 1.00 0.55Exp 3 1.00
Median PriceSurvey Exp 1 Exp 2 Exp 3
Survey 1.00 0.75 0.71 0.55Exp 1 1.00 0.78 0.78Exp 2 1.00 0.73Exp 3 1.00
Volume Weighted Average PriceSurvey Exp 1 Exp 2 Exp 3
Survey 1.00 0.78 0.78 0.58Exp 1 1.00 0.97 0.72Exp 2 1.00 0.68Exp 3 1.00
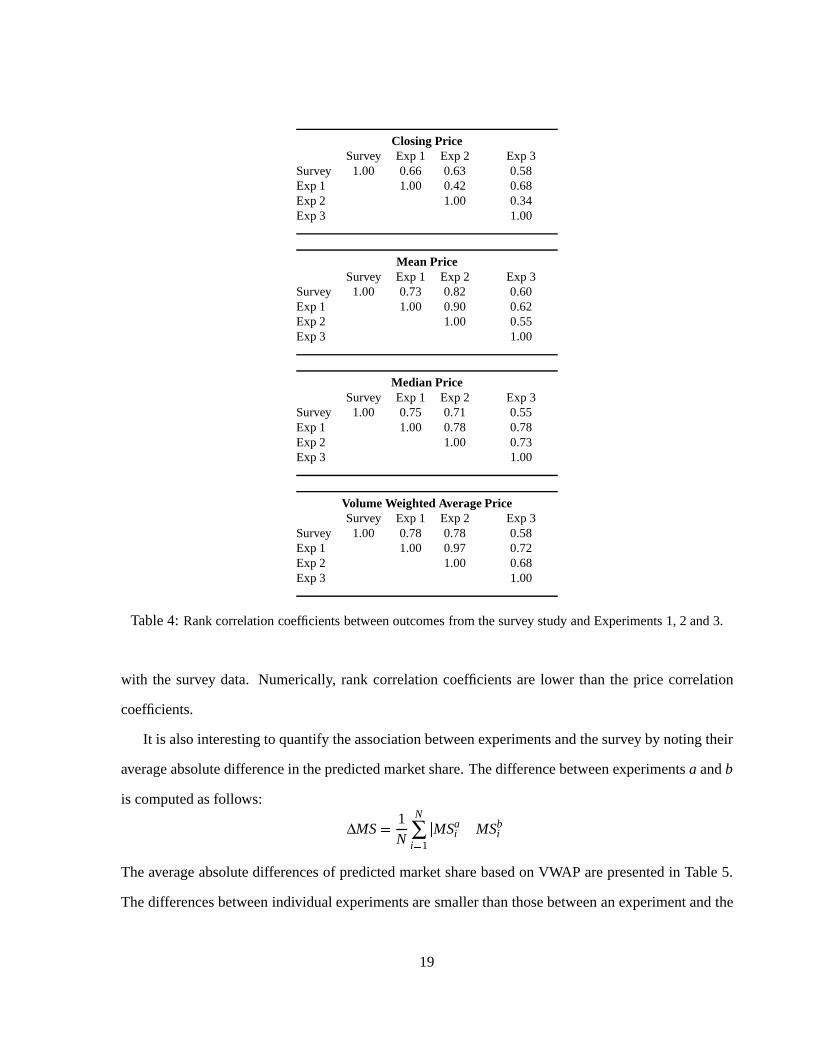
Table 4: Rank correlation coefficients between outcomes from the survey study and Experiments 1, 2 and 3.
with the survey data. Numerically, rank correlation coefficients are lower than the price correlation
coefficients.
It is also interesting to quantify the association between experiments and the survey by noting their
average absolute difference in the predicted market share. The difference between experiments a and b
is computed as follows:
∆MS�1N
N
∑i�1
�MSai �MSb
i �
The average absolute differences of predicted market share based on VWAP are presented in Table 5.
The differences between individual experiments are smaller than those between an experiment and the
19

Exp 1 Exp 2 Exp 3Survey 6�1% 5�5% 6�8%Exp 2 1�3% 1�4%Exp 3 1�8%
Table 5: Average absolute difference in predicted market share between an experiment and the survey, andbetween two experiments.
survey study.
The results from our experiments show a remarkable agreement with those from the survey study
despite many fundamental differences between the two methods. These differences include the differ-
ences in the data collection mechanism (a virtual security market versus a virtual shopping experience),
the modeling of the predicted market share (the use of relative market capitalization of the virtual se-
curities versus conjoint analysis), the questions asked (what you prefer versus what the group prefers),
and lastly the subject population (MIT students versus Stanford students).
6 Conclusions
In this paper we study a novel application of the market mechanism: the use of market to aggregate
diverse consumer preferences. The idea is tested on a product concept testing study that aims to predict
potential market share for some product prototypes. The results from three market experiments show
high consistency among themselves and significant correlation with an independent survey study. Fur-
thermore, an equilibrium model and two computer simulations are presented to provide some insights
into how such a virtual market may successfully aggregate the desired information.
Keynes (1958) wrote about the similarities between stock selection and a beauty contest:
“... professional investment may be likened to those newspaper competitions in which the
competitors have to pick out the six prettiest faces from a hundred photographs, the prize
being awarded to the competitor whose choice most nearly corresponds to the average
preferences of the competitor as a whole ...”
20
The analogy is perhaps more accurate for describing what happens in the stock market in the short
run. After all, stock prices depend not only on investors’ subjective beliefs or expectations, but also on
other objective information such as companies earning potential and valuations of assets. On the other
hand, the trading experiments presented in this paper are precisely “beauty contests,” since values of
the virtual securities are derived endogenously from the expectations of the market participants, which
are largely subjective. To improve the reliability of these virtual markets, one may need to anchor
the values of the securities to some objective fundamental variables of the corresponding products. To
predict future market shares, for example, one could link security values with the realized market shares
of the corresponding products.
A A Theoretical Market Equilibrium
In this section, we attempt to provide an example of an equilibrium for a market that aggregates diverse
beliefs of a group of agents. Consider a portfolio selection problem faced by an agent in a two-period
economy with one risk-free and one risky security. The risk-free security yields no return. It serves as
a numeraire security with price equal to 1. The payoff of the risky security depends on the state of the
economy in period two. Let us consider the risk-free security as cash and the risky security as a stock.
There are two possible states of the economy, a bad state and a good state. The stock pays 1 and 0 in
the good state and bad state respectively. The futures contracts traded in the Iowa Electronic Market are
examples of such a security.8 All agents in the economy have identical preferences and are provided
with identical initial endowment. This is a typical portfolio selection problem in which agents choose
the optimal allocation of cash and stock in period one in order to maximize their expected utility in
period two. The essence of the problem is that they may have different beliefs about what will happen
in period two.
Specifically, there are N agents in the economy, all possess an initial endowment of w unit of cash
in period 1. Agent i believes that the probability of the good state is θi and that of the bad state is 1�θi.8For example, the Republican President contract will pay $1 if the Republican nominee is elected president.
21
It must choose xi, the number of shares of the risky asset to own. The stock is traded in the market with
a price p. The agent’s budget constraint implies that it holds �w� pxi� unit of cash. Consequently its
period-two wealth is w̃i � �w� pxi�� p̃xi, where p̃ is the period-two price for the risky security, which
equals to 1 in the good state and 0 in the bad state. The agent maximizes its expected period-two utility
subject to xi, according to their beliefs:
maxxi
E�U�w̃�� �
maxxi
θiU��w� pxi�� xi���1�θi�U�w� pxi� �
Now assume that all agents have a log utility function: U�w� � log�w�. The demand of agent i can be
derived from the first order condition of its optimization problem:
θi1� p
w� xi�1� p���1�θi�
�pw� xi p
� 0�
xi �w�θi� p�p�1� p�
�
Agents may hold a long or short position in the risky security, i.e. xi may be positive or negative. At
equilibrium, the total demand in the market must be equal to zero. The market price in period one is
derived by imposing this market clearing condition:
N
∑i�1
xi � 0 �
p� �1N
N
∑i�1
θi �
With this particular set-up of the problem, the market price is the average of individuals’ beliefs. Note
that other equilibria may result under different assumptions. Pennock & Wellman (1997) studies a
similar problem with agents that have a negative exponential utility function, U�w� � �e�cw, where c
22
is the risk aversion coefficient. In its one-security case, the equilibrium price is found to be
p�∏N
i�1 θc�
ii
∏Ni�1 θc�
ii �∏N
i�1�1�θi�c�
i
�
where c�
i is a function of an agent’s risk aversion coefficient.
B Simulations with Artificial Agents
The equilibrium model presented in Appendix A exemplifies how a market equilibrium can be derived
from individual beliefs. However, questions about how such equilibria are attained remain unanswered.
Characterizations of the learning dynamics in an experimental market are typically very challenging.
To gain some insights on the price dynamics and agent trading strategies, we turn to computer simula-
tions. Similar to the presentation of the equilibrium model in Appendix A, we aim to demonstrate one
possibility of how a market can successfully aggregate diverse beliefs, but not to offer an explanation
for the observations from our market experiments.
One way to specify an agent’s behavior is to directly model its demand given the market price.
Suppose the belief of agent i can be characterized by a “fair” price, ri. For example, in the two-security
economy in Appendix A, for a risk-neutral agent9, the expected price given its belief can be considered
as a fair price to the agent:
ri � E�p̃�θi� � θi�1���1�θi��0� � θi �
Given the fair price and market price, p, one can construct a linear demand function,
xi�p� � βi�ri� p��
where βi is the price elasticity controlling the sensitivity of demand to price deviation from the fair9A risk-neutral agent has a utility function U�w� � w.
23

value. With this linear demand function, an agent would buy or sell βi shares of the security for each
unit of the price difference, �ri� p�. Assuming all agents follow this linear demand function, imposing
the market clearing condition, the equilibrium price is the average of all fair prices:
N
∑i�1
xi � 0 �
p� �1N
N
∑i�1
ri � (1)
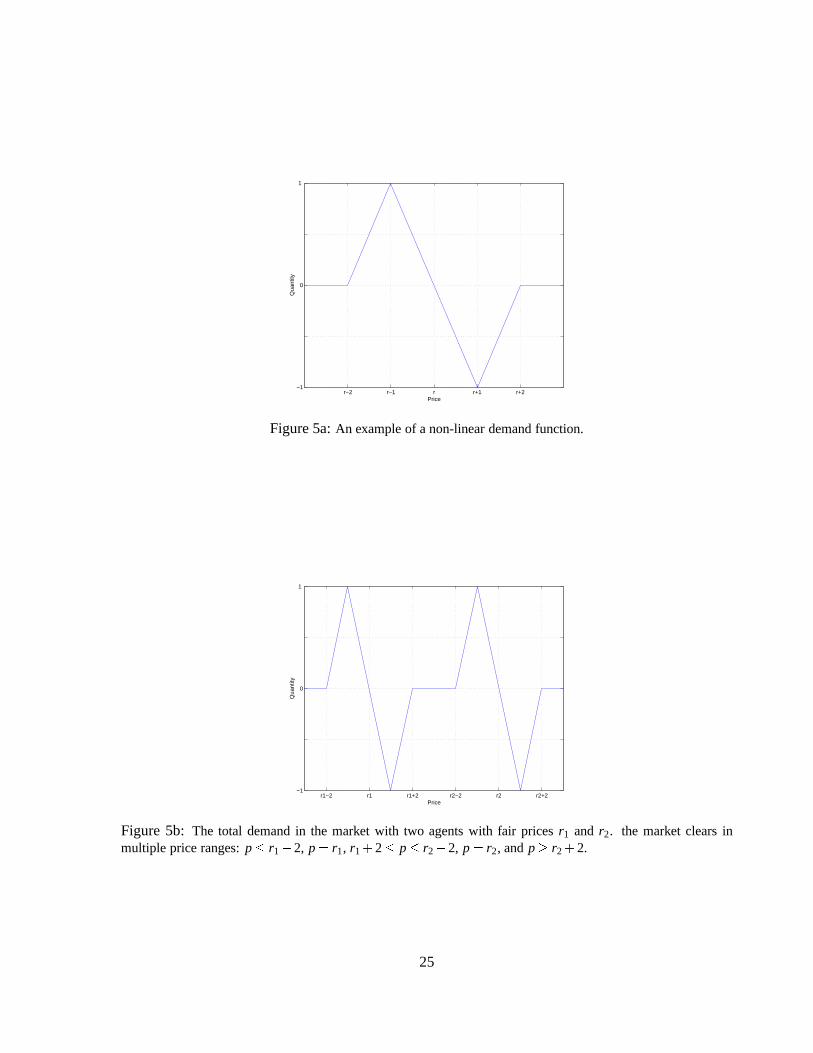
Depending on the form of the demand function, some other equilibria may exist. Figure 5a shows
an example of a piece-wise linear demand function that describes the short term demand of a agent.
The upward-sloping portions of the curve seem to defy the law of demand. The rationale behind such
a demand function is that when the market price is within a certain range from the agent’s fair price
(r� 1 � p � r� 1), it buys if the market price is lower than its fair price and sells otherwise; when
the market price deviates too much from its fair price, the agent may lose faith in its belief and begin
to close its position: selling on decreasing price (r� 2 � p � r� 1) and buying on increasing price
(r�1 � p� r�2). Given such a piece-wise demand function, multiple equilibrium prices may result.
Consider the total demand from two agents with fair prices r1 and r2. As shown in Figure 5b, the market
clears in multiple price ranges: p� r1�2, p � r1, r1�2� p � r2�2, p � r2, and p � r2�2.
Consider a simulated market in which there is one single security in the market. Each artificial
agent forms a belief about the fair price (ri) of the security at the beginning of a market, then follows
a linear demand xi�p� � βi�ri� p�. Following from Equation 1, we consider the equilibrium price
p� � 1N ∑N
i�1 ri as the benchmark price for a market with N artificial agents with fair prices ri’s.
We further impose that an agent trades only one share in one transaction. From its demand function,
one can derive that the agent would buy one share when p � ri� 1�βi and sell one share when p �
ri�1�βi. Equivalently, one can consider the prices bi � ri�1�βi and ai � ri �1�βi as the agent’s bid
and ask prices respectively. All agents submit orders according to the procedure described in Table 6,
given their bid and ask prices. All agents are provided with an equal amount of cash. No borrowing is
permitted so the total demand for the stock is bounded. The trading mechanism is a simplified double-
24
r−2 r−1 r r+1 r+2−1
0
1
Price
Qua
ntity
Figure 5a: An example of a non-linear demand function.
r1−2 r1 r1+2 r2−2 r2 r2+2−1
0
1
Price
Qua
ntity
Figure 5b: The total demand in the market with two agents with fair prices r1 and r2. the market clears inmultiple price ranges: p� r1�2, p� r1, r1�2� p� r2�2, p� r2, and p� r2�2.
25

Scenario Action
existing bid, existing askbi � a buy at marketai � b sell at marketbi � b post a bid bi
ai � a post an ask ai
no bid, existing askbi � a buy at marketai � a post a bid bi
otherwise post a bid bi and an ask ai
existing bid, no askai � b sell at marketbi � b post an ask ai
otherwise post a bid bi and an ask bi
no bid, no askall cases post a bid bi and an ask ai
Table 6: The order submission algorithm of the trading agents, where ai � ri� 1�βi denotes the ask price byagent i, bi � ri�1�βi the bid price by agent i, a the best ask price and b the best bid price in the market.
auction market. Agents can submit a bid and/or an ask, or accept a posted bid or ask. If there is an
existing bid for the stock, any subsequent bid must be higher than the current bid. Similarly, on the sell
side, a subsequent ask must be lower than the current ask. A transaction occurs when an existing bid or
ask is accepted (a market order matches with a limit order).
The computer simulations feature two types of agents. One firmly believes in their beliefs and
maintains them throughout the course of the market. Let us call these static agents. The other (adaptive
agents) attempts to update their beliefs by making observations of the market. We consider a simple
heuristic with which the adaptive agents “learn” from the consensus of the population. In particular, it
updates its fair price using the observed market price p:
ri� ri �αi�p� ri� �
where αi is the learning rate of the agent, dictating how rapidly belief updates take place. The rationale
behind this updating rule is that if a large number of transactions occur at price p, ri will converge to
26
the market price p. If p is the population average price, this update rule will eventually make all fair
prices converge to the population mean.
Do prices fully reflect all available information—individuals’ diverse beliefs on the values of the
securities? In all simulations, we focus on the efficiency of the market in terms of whether or how close
the price converges to the benchmark equilibrium as described in Equation 1. The role and impact of
learning are the other issues that we are interested in.
To quantify the performance of the markets, we focus on three statistics of the price: the mean
price, median price and closing price. Given a price statistic spt for trial t, we compute its average price
deviation from the benchmark equilibrium price in T trials of a market:
∆sp �1T
T
∑t�1
�spt �
1N
∑Ni�1ri� �
In addition, we study the standard deviation of agents’ beliefs or fair prices at the end of the market
session. This variable measures how much disagreement exists among all agents.
We conduct two computer simulations, each consisting of a series of markets. Each market is
characterized by parameters such as the composition of the agents (static versus adaptive) and the
learning rate of the agent population. We run each market 1000 times or epochs to get average measures
of the market performance. A typical epoch of a simulated market consists of 2000 trading intervals.
At each trading interval, an agent is chosen randomly from the population to submit an order. Before
the beginning of a market, all agents are provided with 5 units of cash and 10 shares of stock. Agents’
beliefs are assigned in the form of a fair price ri. The fair prices ri’s are drawn randomly from a uniform
�0� 1� distribution. The following describes the details of the simulations.
� Simulation 1: In this simulation, we study the effect of the learning rate on the performance of a
market. There are 20 adaptive learning agents, each with an identical learning rate, in all markets.
Each market differs by the learning rate of the agent population.
� Simulation 2: Markets in this simulation are characterized by the composition of the agent
population. There are 20 static agents and 0 adaptive agent in market 1, 19 static agents and 1
27

adaptive agent in market 2 and so on. Eventually in market 21, there are 0 static agent and 20
adaptive agents. All adaptive agents have a learning rate of 0�01. By varying the composition
of agents, we investigate the performance of the market with populations that have heterogenous
learning capabilities.
Figure 6a shows typical realizations of four markets in Simulation 1, with the learning rate α equal
to 0.00, 0.01, 0.05 and 0.10 respectively. One can observe that market price converges to the neigh-
borhood of the equilibrium price for small learning rates. If the agents learn too fast, the market may
converge to an arbitrary price, as in the case when α � 0�1. As expected, the speed of convergence is
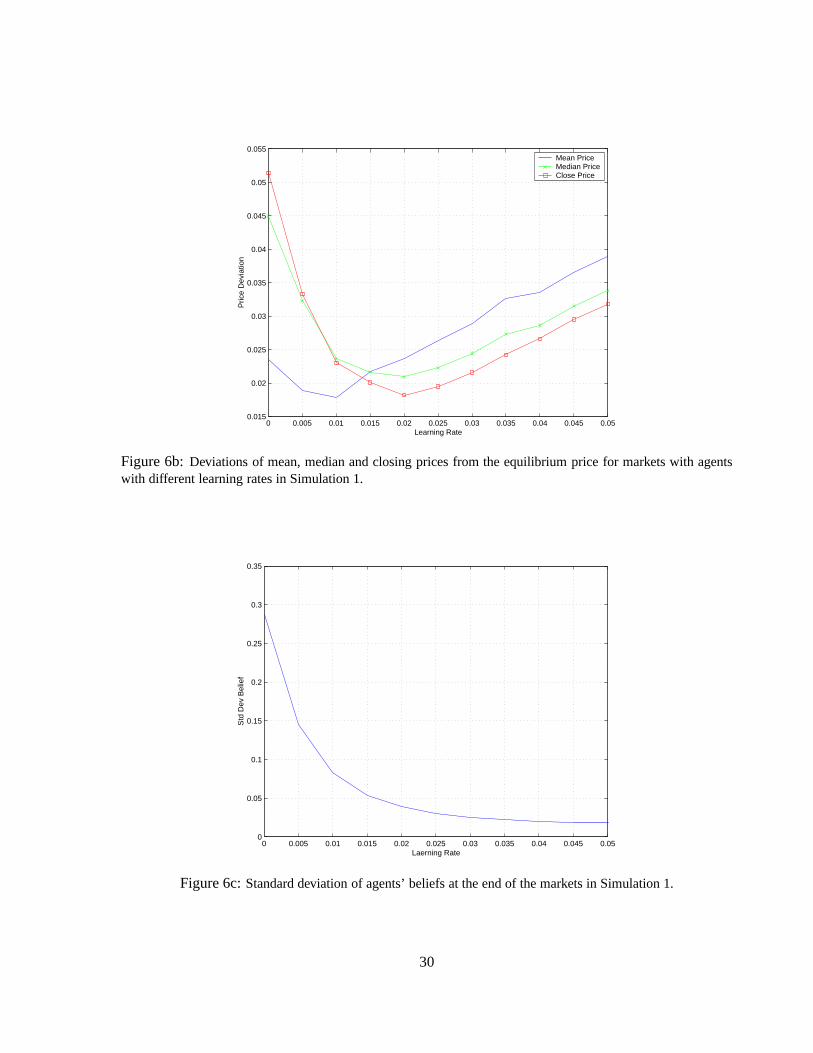
proportional to the learning rate. Figure 6b shows the price deviations from the equilibrium price for
the mean, median and closing price in markets with different α’s. Measured by the mean price, markets
with low α values (�0�005�0�015�) converge close to the equilibrium price. At higher learning rates, the
median and close prices give relatively smaller price deviations. When there is no learning or when
learning is slow, the mean price is a more robust measure for the consensus of the market. As α keeps
increasing, convergence in the markets deteriorates on all three measures, implying that if the agents
adapt to market consensus too rapidly, the overall market would diverge from the equilibrium. Another
evidence of learning in the markets is shown in Figure 6c. The standard deviation of the agents’ be-
liefs decreases with the learning rate, indicating that the difference in agents’ beliefs diminishes as they
approach a market consensus.
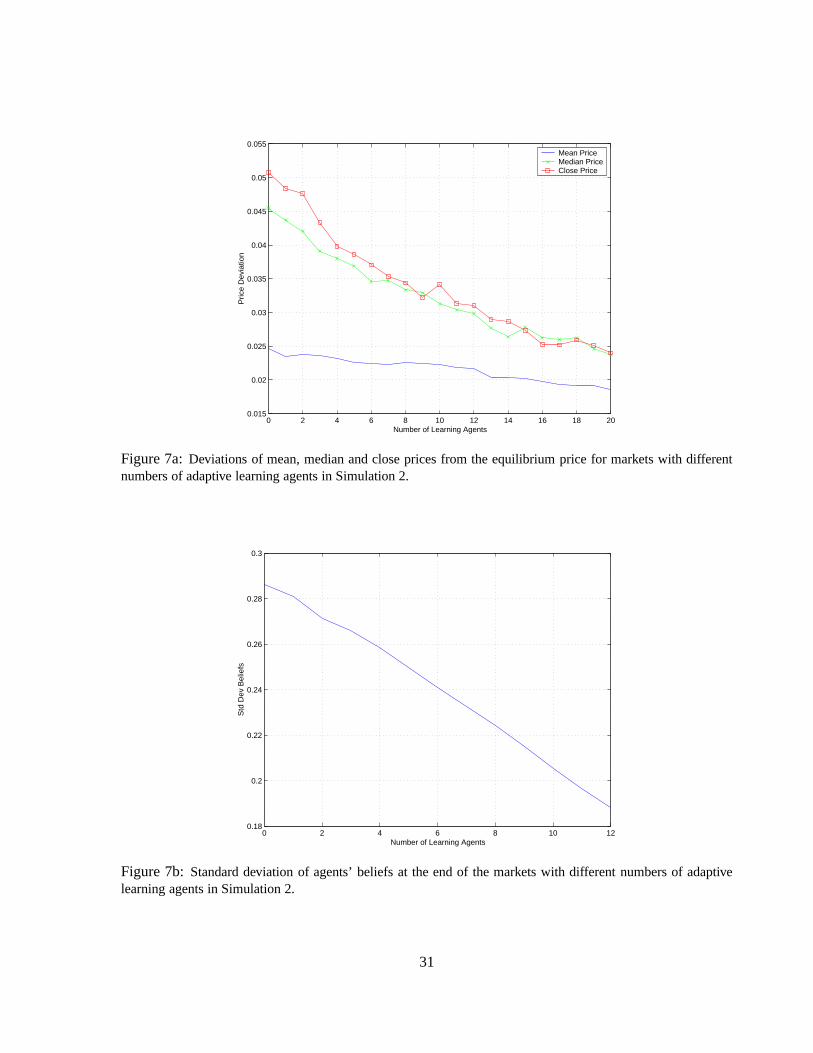
Results from Simulation 2 show that the market efficiency improves with an increasing number of
adaptive agents, given an appropriate learning rate (α � 0�01 in this case). Furthermore, the mean price
is much more robust in measuring market consensus than the median and closing prices for markets
with a heterogeneous agent population (see Figures 7a and 7b).
The study of agent simulations provides some insights into how a market aggregates diverse beliefs.
The implications of these simulations are as follows: (1) learning in a market facilitates its convergence
to the market consensus; (2) when learning occurs too rapidly, market price may diverge from the
market consensus; (3) mean price is a more robust measure of the market consensus and the closing
price does not always converge to an equilibrium price. However, one has to be cautious about the
28

α� 0�00 α� 0�01
250 500 7500
0.1
0.2
0.3
0.4
0.5
0.6
0.7
0.8
0.9
1
Time
Pric
e
Price Trade Consensus
250 500 7500
0.1
0.2
0.3
0.4
0.5
0.6
0.7
0.8
0.9
1
Time
Pric
e
Price Trade Consensus
α� 0�05 α� 0�10
250 500 7500
0.1
0.2
0.3
0.4
0.5
0.6
0.7
0.8
0.9
1
Time
Pric
e
Price Trade Consensus
250 500 7500
0.1
0.2
0.3
0.4
0.5
0.6
0.7
0.8
0.9
1
Time
Pric
e
Price Trade Consensus
Figure 6a: Typical realizations of markets in Simulation 1 with the learning rate α� 0�00� 0�01� 0�05� 0�1.
29
0 0.005 0.01 0.015 0.02 0.025 0.03 0.035 0.04 0.045 0.050.015
0.02
0.025
0.03
0.035
0.04
0.045
0.05
0.055
Learning Rate
Pric
e D
evia
tion
Mean Price Median PriceClose Price
Figure 6b: Deviations of mean, median and closing prices from the equilibrium price for markets with agentswith different learning rates in Simulation 1.
0 0.005 0.01 0.015 0.02 0.025 0.03 0.035 0.04 0.045 0.050
0.05
0.1
0.15
0.2
0.25
0.3
0.35
Laerning Rate
Std
Dev
Bel
ief
Figure 6c: Standard deviation of agents’ beliefs at the end of the markets in Simulation 1.
30
0 2 4 6 8 10 12 14 16 18 200.015
0.02
0.025
0.03
0.035
0.04
0.045
0.05
0.055
Number of Learning Agents
Pric
e D
evia
tion
Mean Price Median PriceClose Price
Figure 7a: Deviations of mean, median and close prices from the equilibrium price for markets with differentnumbers of adaptive learning agents in Simulation 2.
0 2 4 6 8 10 120.18
0.2
0.22
0.24
0.26
0.28
0.3
Number of Learning Agents
Std
Dev
Bel
iefs
Figure 7b: Standard deviation of agents’ beliefs at the end of the markets with different numbers of adaptivelearning agents in Simulation 2.
31

limitation of such studies. Significant assumptions have to be made about the form of beliefs, the
functional form of demand functions, the trading strategies, and the updating of beliefs. For example, a
demand function may not necessarily be in a simple linear form, and there may exist multiple equilibria
in a single market; or agents may not always update their beliefs using a constant learning rate.
References
Dahan, E. & Srinivansan, V. (2000), ‘The predictive power of internet-based product concept testing
using depiction and animation’, Journal of Product Innovation Management 17(2), 99–109.
Forsythe, R. & Lundholm, R. (1990), ‘Information aggregation in an experimental market’, Economet-
rica 58, 309–47.
Forsythe, R., Nelson, F., Neumann, G. & Wright, J. (1993), ‘The iowa presidential stock market: A
field experiment’, Research in Experimental Economics pp. 1–43.
Forsythe, R., Palfrey, T. R. & Plot, C. R. (1982), ‘Asset valuation in an experimental market’, Econo-
metrica 50, 537–567.
Green, P. E. & Wind, Y. (1981), New way to measure consumers’ judgement, in Y. Wind, V. Mahajan
& R. N. Cardozo, eds, ‘New-product forecasting’, D.C. Heath and Company, Lexington, MA,
pp. 89–108.
Grossman, S. J. & Stiglitz, J. E. (1980), ‘On the impossibility of informationally efficient markets’,
American Economic Review 70(3), 393–408.
Keynes, J. M. (1958), The General Theory of Employment, Interest and Money, Harcourt Brace.
O’Brien, J. & Srivastava, S. (1991), ‘Dynamic stock markets with multiple assets’, Journal of Finance
46, 1811–38.
32

Pennock, D. M. & Wellman, M. P. (1997), Representing aggregate belief through the competitive equi-
librium of a security market, in ‘Proceedings of the Thirteenth Conference on Uncertainty in
Artificial Intelligence’, pp. 392–400.
Plott, C. R. & Sunder, S. (1982), ‘Efficiency of experimental security markets with insider information:
An application of rational-expectations models.’, Journal of Political Economy 90, 663–98.
Plott, C. R. & Sunder, S. (1988), ‘Rational expectations and the aggregation of diverse information in
laboratory security markets’, Econometrica 56, 1085–1118.
33