Embed Size (px)
Citation preview
Habilitation Thesis
EXPERIMENTAL AND NUMERICAL
FLOW INVESTIGATIONS
IN HYDRAULIC MACHINES
Sebastian MUNTEAN, PhD
Senior Researcher
Romanian Academy – Timişoara Branch
Center of Advanced Research in Engineering Sciences
Hydrodynamics, Cavitation and Magnetic Liquid Division
Hydrodynamics and Cavitation Laboratory
2017

Habilitation thesis Sebastian Muntean, PhD
2/161
In memoriam Prof. Dr. Eng. Doc. Dr.H.C. Ioan M. Anton,
member of the Romanian Academy (1924 - 2011)

Habilitation thesis Sebastian Muntean, PhD
3/161
Table of content: (a) ABSTRACT .................................................................................................................................................. 5
(a) REZUMAT ................................................................................................................................................... 7
(b) ACHIEVEMENTS AND DEVELOPMENT PLANS .................................................................................. 9
(b-i) Scientific, professional and academic achievements .................................................................................. 9
i.1. Introduction .............................................................................................................................................. 9
i.2 Scientific achievements ............................................................................................................................. 9
i.3 Professional and academic achievements ................................................................................................ 32
(b-ii) Scientific developments .......................................................................................................................... 44
ii.1 Hydraulic turbines .................................................................................................................................. 44
ii.1.1 Introduction ..................................................................................................................................... 44
ii.1.2 Old Francis turbine runner available in the hydropower plant (HPP) ............................................. 44
ii.1.3 Francis turbine units operation during 10 years .............................................................................. 45
ii.1.4 Technical problems in turbine operation ......................................................................................... 47
ii.1.5 In situ experimental investigations .................................................................................................. 48
ii.1.6 Numerical investigations of the flow in Francis turbine prototype ................................................. 52
ii.1.7 Numerical results of the fluid flow in Francis turbine prototype .................................................... 56
ii.1.8 Cavitating flows in Francis turbine runner ...................................................................................... 60
ii.1.9 New solutions for Francis turbine runner ........................................................................................ 63
ii.1.10 Scenarios for refurbishment a Francis turbine............................................................................... 66
ii.1.11 Optimization of the swirling flow at the inlet of a Francis turbine draft tube ............................... 68
ii.2 Swirling flows ........................................................................................................................................ 89
ii.2.1 Introduction ..................................................................................................................................... 89
ii.2.2 Relevance to industrial sector.......................................................................................................... 89
ii.2.3 Assessment parameters ................................................................................................................... 89
ii.2.4 Flow physics .................................................................................................................................... 89
ii.2.5 Timisoara swirl test case ................................................................................................................. 89
ii.2.6 Numerical flow simulation .............................................................................................................. 98
ii.2.7 Numerical results. Validation against experimental data .............................................................. 102
ii.2.8 Influence of the adverse pressure gradient on swirling flow ......................................................... 104
ii.2.9 Vortex rope dynamics ................................................................................................................... 109
ii.2.10 Magneto-rheological break (MRB) flow control ........................................................................ 110
Habilitation thesis Sebastian Muntean, PhD
4/161
ii.2.11 Experimental investigation of the decelerated swirling flows without and with heel elbows ..... 113
ii.3 Hydraulic pumps .................................................................................................................................. 117
ii.3.1 Introduction ................................................................................................................................... 117
ii.3.2 The pumped storage test case ........................................................................................................ 117
ii.3.3 Operation of the pumped storage units .......................................................................................... 119
ii.3.4 Technical problems in pumped storage units ................................................................................ 120
ii.3.5 Numerical flow analysis in the storage pump ............................................................................... 120
ii.3.6 Hydrodynamic design of the new impeller ................................................................................... 125
ii.3.7 Experimental investigation of the new impeller ............................................................................ 129
ii.3.8 Numerical investigation of the flow field in the suction elbow .................................................... 140
ii.3.9 Numerical results against experimental LDV measurements ....................................................... 141
ii.3.10 Hydrodynamic field analysis on the annular cross section z=0.05 m ......................................... 143
ii.3.11 Hydrodynamic field analysis in three-dimensional geometry of the section elbow .................... 144
(b-iii) Scientific, professional and academic plans ......................................................................................... 147
iii.1 Scientific plan...................................................................................................................................... 147
iii.2 Professional plan ................................................................................................................................. 149
iii.3 Academic plan ..................................................................................................................................... 151
(c) REFERENCES ......................................................................................................................................... 153
Habilitation thesis Sebastian Muntean, PhD
5/161
(a) ABSTRACT
The habilitation thesis summarizes my research activity after public defending the PhD Thesis at Politehnica University of Timişoara and received the confirmation no. 4189/29.07.2002 from Ministry of Education and Research. The scientific, professional and academic achievements included in the habilitation thesis cover the period from 2003 to 2017.
I am full time senior researcher (1st degree since 2008; 2nd degree during 2002 – 2008) at Hydrodynamics and Cavitation Laboratory from Romanian Academy – Timisoara Branch, Center of Advanced Research in Engineering Sciences, Hydrodynamics, Cavitation and Magnetic Liquid Division. Also, I am associate senior researcher at Numerical Simulation and Parallel Computing Laboratory from Politehnica University of Timişoara, National Center for Engineering of Systems with Complex Fluids since 2002.
My research activity is definitely application driven, with a constant focus on relating the problems in design, analysis and optimization of the turbomachines and the hydraulic systems associated to hydro power stations and pumping stations. Two main fields associated to hydrodynamic of the turbines and pumps are covered in my research. My research is focused on the influence of geometrical and kinematical parameters on the efficiency, cavitation and dynamic characteristics. Several numerical investigations of the flow have been performed to Francis and Kaplan turbines in order to assess its characteristics. Also, the numerical investigations of the fluid flow have been applied to the large storage pumps in order to assess its performances.
Two additional research fields have been developed to support main topics. The first additional research topic corresponds to the mathematical models, numerical algorithms and computational fluid dynamics. This topic has supported my numerical investigations in order to understand the hydrodynamic phenomena associated to the turbomachines. The second additional research topic is associated to the swirling flows and the flow control techniques to mitigate the self-induce instabilities and its effects. These phenomena occur in hydraulic turbines operated far from the best efficiency point, and it hinders the turbine normal operation through severe pressure fluctuations leading to vibrations, damage of the bearings, blade rupture and power swing. An experimental test rig with a swirl generator was designed and manufactured by our group to explore the unsteady phenomena encounter in the hydraulic turbines as well as to investigate several innovative control techniques (e.g. axial water jet, flow feedback, pulsating jet, adjustable diaphragm, and magneto-rheological speed control) to mitigate its effects.
A synopsis view of my publications in the field of the habilitation thesis covering 2003 - 2017 is quantified in 63 journal papers (21 ISI, 12 BDI and 30 other journals), 79 proceeding papers (31 ISI and 48 international conferences), 3 patents, 3 books, 7 chapters and 9 proceedings as editor. These results were supported by 4 programs of the Hydrodynamics and Cavitation Laboratory from Hydrodynamics, Cavitation and Liquid Magnetic Division, Center for Advanced Research in Engineering Sciences, Romanian Academy – Timisoara Branch, 16 projects (14 national and 2 international) and 20 contracts with industrial partners (17 national and 3 international) during 2003 – 2017.
I have developed a special connection with several industrial partners (e.g. Hidroelectrica SA - Romanian Hydropower Company and it subsidiary), UCMR SA and HydroEnginering SA Resita and AQUATIM SA Timişoara (Regional Water Supplier). I have been manager or partner responsible in several projects with industrial partners who have investigated the problems arising from the operation of hydraulic machines. Also, I want to highlight two events with industrial partners organized as chairmain of the organizing committee that have debated the issues raised by them.
Habilitation thesis Sebastian Muntean, PhD
6/161
It is well known that each hydropower/pumping plant is unique. I have visited more than 40 hydraulic machinery laboratories and hydropower/pumping plants all around the world. I have organized the training course entitled “Numerical Methods in Fluid Dynamics and FLUENT applications” at Politehnica University of Timisoara with 40 participants. I have contributed as member of the scientific committee of 4 international conferences while as member of the organizing committee at 13 conferences/symposiums/workshops and I have been chairman of the one IAHR workshop, respectively. I have contributed as reviewer at 11 journals. I have participated to 14 events (8 symposia: IAHR2016, Grenoble, France; IAHR2014, Montreal, Canada; IAHR2012, Beijing, China, IAHR2010, Timisoara, Romania; IAHR2008, Foz do Iguaçu, Brassil; IAHR2006, Yokohama, Japan; IAHR2004, Stockholm, Sweden; IAHR2002, Lausanne, Switzerland; and 6 workgroups: IAHRWG2017, Porto, Portugal; IAHRWG2015, Ljubljana, Slovenia; IAHRWG2013, Lausanne, Switzerland; IAHRWG2011, Belgrade, Republic of Serbia; IAHRWG2009, Brno, Czech Republic; IAHRWG2007, Timisoara, Romania) organized by International Association on Hydraulic Research (IAHR), Section: Hydraulic Machinery and Systems and more than 10 other international conferences (MDA2016, Porto, Portugal; WREC2015, Bucharest, Romania; ViennaHydro2014, Vienna, Austria; CIEM2011, Bucharest, Romania; CMFF’09, Budapest, Hungary; CIEM2009, Bucharest, Romania; ISFMFE2008, Beijing, China; HME2008, Timisoara, Romania; CIEM2007, Bucharest, Romania; CMFF’06 and CMFF’03, Budapest, Hungary).
I have consolidated and extended my knowledge in field of research management and administration participating to 10 training courses organized by European Association of Research Managers and Administrators (EARMA).
I have worked with several students to prepare their diploma theses (10), dissertation theses (5) and doctoral theses (more than 10) in which they designed different parts of the turbomachines (turbine or pump) and/or they perform in-depth numerical and/or experimental flow investigations. I have supported 4 students at Batchelor level to develop their own research and to present their results at Student Technical Days. I have been appointed of 20 times as member of the PhD committee (19 in Romania and 1 in Sweden).
My teaching career has started in 2016, when I joined as associate professor at the Hydraulic Machinery group from Mechanical Machinery, Equipment and Transport Department, Mechanical Faculty, Politehnica University of Timişoara. My teaching activities are focused on hydraulic turbines course, hydropower plants and pumping stations course which are part in the curriculum in mechanical engineering at Bachelor and master levels, respectively.
I would like to emphasize my membership to Timişoara School on Hydraulic Machines and Cavitation founded by Prof. Aurel Bărglăzan, member of the Romanian Academy and promoted at national and international levels by Prof. Ioan M. Anton, member of the Romanian Academy. I was formed in this school and I continued to develop its research directions together with my colleagues based on what we inherited. My future scientific plan is directly connected with the requirements imposed by the energy market. As a result, the following research topics would be further investigated to support the operation of the hydraulic turbomachines (turbines and pumps) in the energy maket and to extend its lifetime. Also, the investigations would be extended to the large pumps installed in the wastewater systems and flood protection systems.
Habilitation thesis Sebastian Muntean, PhD
7/161
(a) REZUMAT
Teza de abilitare sintetizează activitatea mea de cercetare după susţinerea publică a tezei de doctorat la Universitatea Politehnica Timişoara şi primirea confirmării nr. 4189/29.07.2002 de la Ministerul Educaţiei şi Cercetării. Realizările ştiintifice, profesionale şi academic incluse în teza de abilitare acoperă perioada 2003 -- 2017.
In prezent sunt cercetător principal (gradul 1 din 2008; gradul 2 in perioada 2002-2008) cu normă întreagă în cadrul Laboratorului de Hidrodinamică şi Cavitaţie de la Academia Română – Filiala Timişoara, Centrul de Cercetări Tehnice Fundamentale şi Avansate, Secţia de Hidrodinamică, Cavitaţie şi Lichide Magnetice. În acelaşi timp, sunt cercetător principal asociat în cadrul Laboratorului de Simulare Numerică şi Calcul Paralel de la Universitatea Politehnica Timişoara, Centrul de Cercetări pentru Ingineria Sistemelor cu Fluide Complexe din 2002.
Activitatea mea de cercetare este in mod clar definită de aplicaţii, cu o focalizare constanta asupra problemelor de proiectare, analiză şi optimizare a turbomaşinilor si şistemelor hidraulice din centralele hidroelectrice şi staţiile de pompare. În cerecetările mele am abordat două direcţii principale corespunzatoare hidrodinamicii turbinelor şi pompelor hidraulice. Cercetările sunt focalizate pe influenţa parametrilor geometrici şi cinematici asupra caracteristicilor energetice, cavitaţionale şi dinamice ale turbomaşinilor. Am realizat investigaţii numerice a curgerii in turbine Francis şi Kaplan pentru a evalua performantelor acestora pentru a găsi soluţii la problemele sesizate în exploatare. De asemenea, am realizat investigaţii numerice a curgerii în pompelor de mare capacitate pentru a le evalua performantele şi a gasi soluţii care să crească timpul de viaţă şi să reducă costurile de exploatare şi întreţinere.
Am dezvoltat două directii de cercetare suplimentare care să susţină direcţiile principale menţionate mai sus. Prima direcţie de cercetare include modele matematice, algoritmi numerici şi simularea numerica a curgerii fluidelor. Această direcţie mi-a sprijinit investigatiile numerice pentru a aprofunda fenomenele hidrodinamice din turbomaşini. A doua direcţie de cercetare este asociată curgeriilor cu vârtej şi tehnicilor de control a curgeriilor pentru limitarea instabilitaţiilor autoinduse şi a efectelor acestora. Aceste fenomene apar în turbine hidraulice care funcţionează departe de punctul de randament maxim şi împiedică funcţionarea normală a turbinei prin fluctuaţii puternice de presiune care duc la vibraţii, deteriorarea lagărelor, ruperea paletelor rotorice şi pulsaţii la putere. Un stand experimental cu generator de vartej a fost proiectat si realizat de grupul nostru pentru a explora fenomenele nestaţionare din turbinele hidraulice precum şi pentru a investiga mai multe tehnici de control inovative (de exemplu: jet axial de apă, curgere cu feedback, jet pulsant, diafragmă reglabilă şi control magneto-reologic al turaţiei) care să diminueze efectele.
O privire sintetică asupra publicaţiilor în domeniul tezei de abilitare în perioada 2003 – 2017 este cuantificată in 63 articole de jurnale (21 ISI, 12 BDI si 30 alte journale), 79 articole în volume ale conferinţelor (31 ISI si 48 internationale), 3 cereri de brevete (din care 1 acordat), 3 cărţi, 7 capitole şi 9 volume ca editor. Aceste rezultate au fost realizate in cadrul celor 4 programe ale Laboratorului de Hidrodinamică şi Cavitaţie din cadrul Secţiei de Hidrodinamică, Cavitaţie şi Lichide Magnetice, Centrul de Cercetări Tehnice Fundamentale şi Avansate, Academia Română – Filiala Timişoara, 16 proiecte (14 naţionale şi 2 internaţionale) si 20 contracte cu parteneri industriali (17 naţionale şi 3 internaţionale) derulate în perioada 2003 – 2017 în tematica tezei de abilitare.
O relatie specială am dezvoltat-o cu mai multi parteneri industriali (de exemplu Hidroelectrica SA si sucursalele ei, UCMR SA şi HydroEnginering SA Reşiţa şi AQUATIM SA Timişoara). Am fost
Habilitation thesis Sebastian Muntean, PhD
8/161
director şi responsabil al echipei de la Academia Română – Filiala Timişoara în cadrul mai multor proiecte cu parteneri industriali care au investigat problemele apărute în exploatarea maşinilor şi echipamentelor hidraulice. De asemenea, doresc sa evidentiez cele doua evenimente cu parteneri industriali organizate în calitate de preşedinte al comitetului local care au dezbătut problemele ridicate de aceştia.
Este bine cunoscut faptul că fiecare centrală hidroelectrică şi staţie de pompare este unică. Am vizitat mai mult de 40 laboratorare de masini hidraulice, centrale hidroelectrice şi staţii de pompare din întreaga lume pentru a întelege mai bine problemele şi condiţiile apărute în exploatarea lor. Am contribuit ca membru al comitetului ştiinţific la 4 conferinţe internaţionale în timp ce în calitate de membru al comitetului de organizare am conttibuit la 13 conferinţe/simpozioane/workshop-uri şi am fost presedinte al comitetului de organizare al unui workshop organizat sub egida IAHR. Am desfăşurat activităţi de evaluare şi recenzie pentru 11 jurnale. Am participat la 14 evenimente (8 simpozioane: IAHR2016, Grenoble, Franţa; IAHR2014, Montreal, Canada; IAHR2012, Beijing, China, IAHR2010, Timişoara, Romania; IAHR2008, Foz do Iguaçu, Brazilia; IAHR2006, Yokohama, Japonia; IAHR2004, Stockholm, Suedia; IAHR2002, Lausanne, Elveţia; and 6 workgroup-uri: IAHRWG2017, Porto, Portugalia; IAHRWG2015, Ljubljana, Slovenia; IAHRWG2013, Lausanne, Elveţia; IAHRWG2011, Belgrad, Serbia; IAHRWG2009, Brno, Republica Cehă; IAHRWG2007, Timişoara, Romania) organizate sub egida International Association on Hydraulic Research (IAHR), Secţiunea: Maşini Hidraulice şi Sisteme şi încă 10 alte conferinţe internaţionale (ViennaHydro2016, Viena, Austria; MDA2016, Porto, Portugalia; WREC2015, Bucureşti, Romania; ViennaHydro2014, Viena, Austria; CIEM2011, Bucureşti, Romania; CMFF’09, Budapesta, Ungaria; CIEM2009, Bucureşti, Romania; ISFMFE2008, Beijing, China; HME2008, Timişoara, Romania; CIEM2007, Bucureşti, Romania; CMFF’06 şi CMFF’03, Budapesta, Ungaria).
Mi-am consolidat şi extins cunoştintele în domeniul managementului şi administrării cercetării participând la 10 cursuri de instruire organizate de European Association of Research Managers and Administrators (EARMA).
Am organizat cursul intitulat “Metode numerice în dinamica fluidelor şi aplicaţii FLUENT” la Universitatea Politehnica Timişoara cu 40 de participanti majoritatea fiind doctoranzi şi tineri cercetători. Am lucrat cu mai mulţi studenţi să-şi pregătească lucrările de diplomă (10), tezele de dizertaţie (5) şi tezele de doctorat (mai mult de 10) în care au proiectat diferite părţi ale turbomaşinilor (turbine sau pompe) şi/sau au realizat investigaţii numerice şi/sau experimentale detaliate ale curgerii. Am sprijinit 4 studenţi să-şi dezvolte propriile cercetări şi să-şi prezinte rezultatele la Zilele Tehnice Studenteşti. Am fost numit membru în 20 comisii de doctorat (19 in România şi 1 în Suedia).
Cariera didactică am inceput-o în 2016, cand m-am alăturat ca profesor asociat grupului de Maşini Hidraulice din Departamentul de Maşini Mecanice, Echipamente şi Transporturi de la Facultatea de Mecanică, Universitatea Politehnica Timişoara. Activităţile mele didactice sunt focalizate pe cursurile de turbine hidraulice şi centrale hidroelectrice respectiv staţii de pompare care sunt parte în curricula de inginerie mecanică pentru studenţii de la nivelul Batchelor şi master.
Doresc să evidenţiez apatenenţa mea la Şcoala Timişoreană de Maşini Hidraulice şi Cavitaţie infiinţată de Acad. Aurel Bărglăzan şi promovată la nivel naţional şi international de Acad. Ioan M. Anton. Am fost format în această şcoală şi continui să dezvolt direcţiile ei de cercetare împreună cu colegii mei bazându-ne pe ce am moştenit. Planul meu ştiintific este conectat în mod direct cu cerinţele impuse de piaţa de energie. Ca urmare, cercetările mele vor investiga funcţionarea turbomaşinilor hidraulice (turbine şi pompe) în piaţa de energie pentru a extinde timpul lor de viaţa. De asemenea, investigatiile vor fi extinse la pompele de mare capacitate instalate în sistemele de apă uzată şi protecţie la inundaţii.

Habilitation thesis Sebastian Muntean, PhD
9/161
(b) ACHIEVEMENTS AND DEVELOPMENT PLANS
(b-i) Scientific, professional and academic achievements i.1. Introduction
The habilitation thesis summarizes my research activity after defending my PhD Thesis at Politehnica University of Timişoara and received the confirmation no. 4189/29.07.2002 from Ministry of Education and Research.
It should be noted that the activity of the candidate in the field of hydraulic machines (more than 22 years of research in this field), from the beginning of October 1994, until the defending of PhD Thesis (March 2002), and after awarding the PhD thesis, is in line with the fields of research of Timişoara School on Hydraulic Machines. It may be underlined that my research activity is enrolled in the long tradition of the Timişoara School on Hydraulic Machines and Cavitation – more than 70 years of activity – founded by Prof. Aurel Bărglăzan, member of the Romanian Academy and promoted at national and international level by Prof. Ioan M. Anton, member of the Romanian Academy.
The scientific, professional and academic achievements included in this habilitation thesis cover the period from 2003 (when I defended my PhD thesis) to 2017. i.2 Scientific achievements
The research activities and achievements presented in my habilitation these have been developed in two main topics covering more than 15 years (from April 2002 to 2017). My first research topic is associated to hydraulic turbines and hydropower plants, which extends the topic of my PhD thesis entitled “Numerical Methods for the Analysis of the Three-Dimensional Flow in Francis Turbine Runners” defended in April 2002 under supervision of Prof. I.M. Anton, member of the Romanian Academy. The next main topic is associated to the large hydraulic pumps and pumping power plants starting since 2005. My research activity is definitely application driven, with a constant focus on relating the problems in design, analysis and optimization of turbomachines and the hydraulic systems associated to hydro power stations and pumping stations.
(I) In turbine hydrodynamics, I focused on the influence of geometrical and kinematical parameters on the efficiency, cavitation and dynamic characteristics. The numerical investigations of the flow were applied to Francis and Kaplan turbines in order to assess its efficiency, cavitation and dynamic characteristics. The mixing interface algorithm developed in my PhD thesis was applied for three-dimensional turbulent flow computation in the domains corresponding to prototype turbines. I have contributed to experimental and numerical investigations performed on several hydraulic units installed in hydropower plants (HPP) from Romania equipped with Francis turbines (Brădişor HPP, Munteni HPP, Stejaru HPP, Turnu-Ruieni HPP, Râul Mare – Retezat HPP and Motru HPP) and Kaplan turbines (Portile de Fier I HPP, Drăgăşani HPP, Zăvideni HPP, Zerveşti HPP, Turnu HPP). I have been performed several numerical investigations about swirling flow in the upstream hydraulic passage (including spiral casing, stay vanes, guide vanes) of the Kaplan and Francis turbines in order to analyze the velocity distribution at the runner inlet. Next, I have extended the analysis to the swirling flow delivered by the runner outlet and ingested by the draft tube. I have designed two new geometrical solutions (one together with Prof. E. Goede from Stuttgart University) for Francis turbine runner available to Brădişor HPP. The energetical, cavitational and dynamic characteristics of new solutions were compared against to the geometrical solution available in hydropower plant
Habilitation thesis Sebastian Muntean, PhD
10/161
considering several scenarios in operation. All these investigations were done in order to select the most appropriate technical solutions for refurbishment the hydraulic turbines available in Brădişor HPP. Also, I have developed numerical methodologies for analysis and flow optimization in two Francis models (e.g. GAMM and FLINDT). For instance, one methodology is dedicated to optimize the hydraulic torque on the guide vane blade developed together with Prof. R. Susan-Resiga and Prof. I. Anton, member of the Romanian Academy and other methodology being dedicated to optimization of the swirling flow delivered by the runner and ingested by the draft tube developed together with Prof. R. Susan-Resiga and Dr. T. Ciocan. The results in this field obtained until 2007 have been included in the “Numerical Analysis of the Flow in Francis Turbines” book published by Orizonturi Universitare Publishing House; The research on cavitation successfully addressed fundamental aspects such as cavitation inception, cavitation behavior of hydraulic machinery, as well as designing and testing solutions to improve the cavitational in hydraulic turbines and pumps. Using an inverse method, the new impeller and new inducer are designed and tested to improve the cavitational behavior of pumps and turbines.
(II) In pump hydrodynamics, I focused my investigations on the influence of geometrical configurations on the efficiency, cavitation and dynamic characteristics. The numerical investigations of the flow were applied to large storage pumps in order to assess its efficiency, cavitation and dynamic characteristics. I have conducted several numerical investigations performed on units installed in several storage power plants (SPP) from Romania equipped with single and double flux impellers (Jidoaia SPP, Petrimanu SPP, Lotru-Aval/Balindru HPP, and Gâlceag SPP). I have contributed to the experimental and numerical investigations performed on a impeller model (1:5.7) corresponding to the storage pump prototype installed in Jidoaia SPP. I have contributed to design an axial rotor in order to improve cavitational characteristics of the impeller model. The numerical investigations were used to analyze the hydrodynamic phenomena associated to real hydraulic machines in order to propose new solutions for their refurbishment/rehabilitation. I have developed a new test rig installed at Politehnica University of Timisoara dedicated to deep hydrodynamic investigations in hydraulic pumps together with Prof. L.E. Anton and Prof. A. Baya. Also, I have designed a new impeller for storage pump prototype installed in Jidoaia SPP together with Dr. G. Gînga. I have been involved in the manufacturing and testing the new impeller model installed on the test rig at Politehnica University of Timisoara;
Other two additional research fields have been developed to support main topics. The first additional research topic corresponds to the mathematical models, numerical algorithms and computational fluid dynamics. This topic has supported my numerical investigations performed in order to understand the hydrodynamic phenomena associated to the flow in hydraulic machines. This research field was successively developed in connection with the hardware and software infrastructure installed at Parallel Computing and Numerical Simulation Laboratory from National Research Center for Engineering with Complex Fluids, Politehnica University of Timisoara along to two decades. The parallel computing is an important ingredient in my numerical investigations since 2003. My developments in this field are based on the knowledge accumulated during my participation to the international course entitled “Computation in Sciences Methods and Algorithms on Supercomputing for Engineering (COSMASE): Grid Generation and Parallel Computing” organized at École Polytechnique Fédérale de Lausanne (EPFL), Lausanne, Switzerland during September 23 – 27, 1996 as well as the courses: “Object Oriented Programming” - 1st semester 1999 by
Habilitation thesis Sebastian Muntean, PhD
11/161
Prof. V. Stoicu-Tivadar; “Data Structures and Programming Techniques” - 1st semester 1997 and “Advanced Data Structures and Programming Techniques” - 2nd semester 1998 by Prof. V. Cretu; “C/C++ Programming” - 1st semester 1996 and “Data Structures and Parallel Computing Architectures” - 1st semester 1996 by Prof. P. Eles from Computer Science Department from Computer and Automation Faculty, Politehnica University of Timisoara and “Numerical Methods in Fluid Mechanics” - 1st semester 1996 by Prof. V. Stan from Mathematical Faculty, West University of Timisoara, respectively. My achievements on this topic are enumerated below:
(III) I have developed and tested several numerical algorithms for fluid flow computation. Firstly, the algorithms for single phase flows were developed and applied to quantify the hydraulic machines performances. The hydrodynamics of hydrofoils and hydrofoil cascades received a particular attention in my developments. The basic mathematical models for theoretical hydrodynamics were developed together with Prof. R. Susan-Resiga and validated against experimental data for different applications (hydrofoil cascades corresponding to turbine and pumps). These theoretical developments are embedded by in-house code called CASCADExpert being used for computing the flows (incompressible inviscid and irotational) and for designing the hydrofoil cascades, respectively. The numerical algorithms were developed and applied to the hydrofoil cascades, aimed at improving and optimizing the design techniques. Several algorithms were developed together with T. Frunza for reconstruction the stay/guide vane geometries associated to hydropower plant. These algorithms were implemented in in-house code called INteractive FOil geomeTry REConstruction (InFoTRec) being used for preparing the three-dimensional geometries of the computational domains available into the hydropower plants. Next, the two phase algorithms were developed and tested in order to compute the cavitating flows together with Prof. R. Susan-Resiga and Dr. S. Bernad. These algorithms for cavitating flows were validated against experimental data on semi-spherical bodies and hydrofoils. Further, these algorithms were applied for computing the two phase flows in hydraulic machines (turbines and pumps). The numerical developments and tests with different partitioning techniques applied to the parallel computation of the fluid flow can be found in the book entitled “Modern Methods of Parallel Computing for Fluid Flow Simulation”, authors R. Susan-Resiga, S. Muntean, S. Bernad, D. Balint, I. Balint published in 2003 by “Orizonturi Universitare” publishing house. The swirling flow hydrodynamics associated to the hydraulic machineries is a special topic in my research. The swirling flow topic supports the fundamental knowledge for designing the flow and the geometry to deliver this flow using inverse method, respectively. The mathematical models for swirling flow hydrodynamics were developed together with Prof. R. Susan-Resiga for one dimensional flow. Next, the mathematical models for swirling flow hydrodynamics were extended to two dimensional axi-symmetric flows together with Prof. R. Susan-Resiga and Dr. A.A. Anton using Portable Extensible Toolkit for Scientific Computation (PETSc) platform.
The second additional research topic is associated to the swirling flows and the flow control techniques to mitigate its self-induce instabilities. It was inferred that the main cause of the self-induced instability of the decelerated swirling flow, when the steady axisymmetric swirl in the turbine discharge cone becomes unsteady and threedimensional, with a well-know precessing helical vortex (so-called vortex rope). This phenomenon occurs in hydraulic turbines operated far from the best efficiency point, and it hinders the turbine normal operation through severe pressure fluctuations leading to vibrations, bearing damage, blade rupture, power swing. It is known that most of the technical solutions attempted in practice to mitigate the vortex rope were not actually addressing the main cause of the swirling flow instability. Therefore, an
Habilitation thesis Sebastian Muntean, PhD
12/161
experimental test rig with a swirl generator was designed and manufactured to explore the unsteady hydrodynamic phenomena encounter in the hydraulic turbines as well as to investigate several innovative control techniques (e.g. axial water jet, flow feedback, pulsating jet, adjustable diaphragm, and magneto-rheological speed control) to mitigate the unsteady effects.
(IV) Swirling flow is investigated to deeply understand the flow physics and new control techniques (e.g. axial water jet control, flow-feedback control (FF), additional flow-feedback control (FF+), pulsating jet control, adjustable diaphragm control and variable speed control using a magneto-rheological fluid) were developed, implemented on the test rig and experimentaly examined by our group. Also, extensive numerical investigations have been performed for each new control technique. I have been involved in all these investigations at several levels.
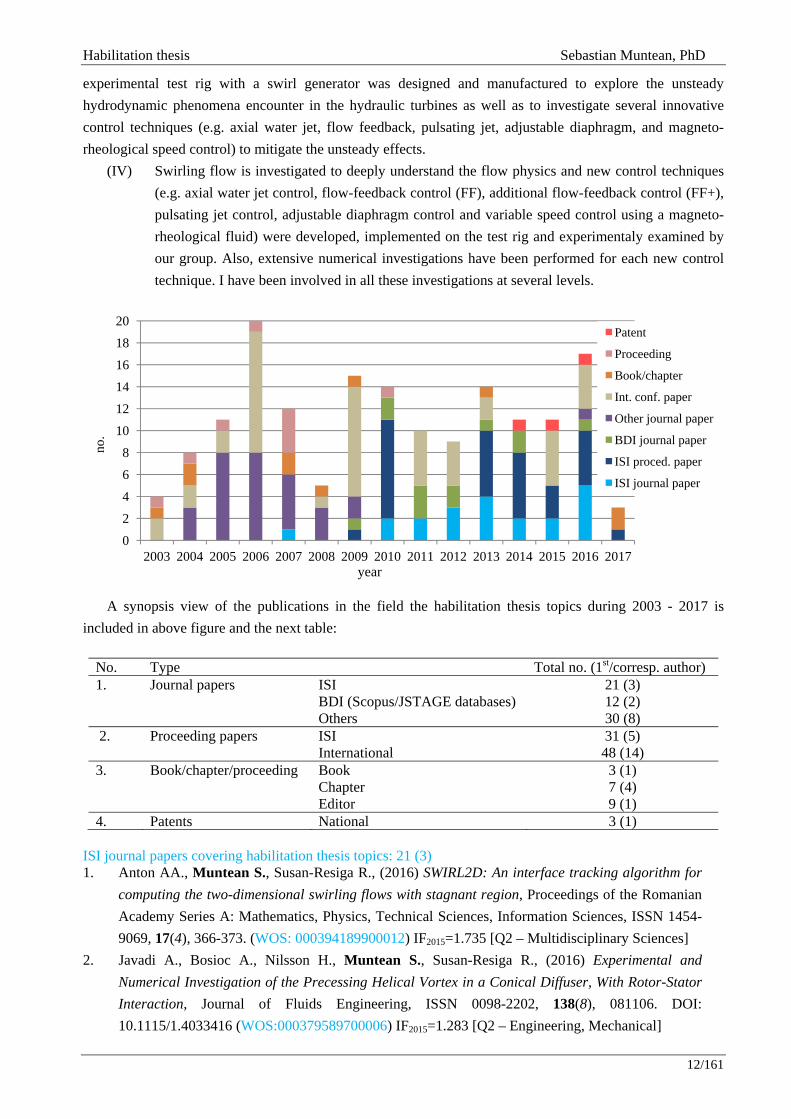
A synopsis view of the publications in the field the habilitation thesis topics during 2003 - 2017 is included in above figure and the next table:
No. Type Total no. (1st/corresp. author) 1. Journal papers ISI 21 (3)
BDI (Scopus/JSTAGE databases) 12 (2) Others 30 (8)
2. Proceeding papers ISI 31 (5) International 48 (14)
3. Book/chapter/proceeding Book 3 (1) Chapter 7 (4) Editor 9 (1)
4. Patents National 3 (1) ISI journal papers covering habilitation thesis topics: 21 (3) 1. Anton AA., Muntean S., Susan-Resiga R., (2016) SWIRL2D: An interface tracking algorithm for
computing the two-dimensional swirling flows with stagnant region, Proceedings of the Romanian Academy Series A: Mathematics, Physics, Technical Sciences, Information Sciences, ISSN 1454-9069, 17(4), 366-373. (WOS: 000394189900012) IF2015=1.735 [Q2 – Multidisciplinary Sciences]
2. Javadi A., Bosioc A., Nilsson H., Muntean S., Susan-Resiga R., (2016) Experimental and Numerical Investigation of the Precessing Helical Vortex in a Conical Diffuser, With Rotor-Stator Interaction, Journal of Fluids Engineering, ISSN 0098-2202, 138(8), 081106. DOI: 10.1115/1.4033416 (WOS:000379589700006) IF2015=1.283 [Q2 – Engineering, Mechanical]
0
2
4
6
8
10
12
14
16
18
20
2003 2004 2005 2006 2007 2008 2009 2010 2011 2012 2013 2014 2015 2016 2017
Patent
Proceeding
Book/chapter
Int. conf. paper
Other journal paper
BDI journal paper
ISI proced. paper
ISI journal paper
no.
year
Habilitation thesis Sebastian Muntean, PhD
13/161
3. Drăghici IA., Muntean S. (Corresponding author), Bosioc AI., Ginga G., Anton LE., (2016) Unsteady Pressure Field Analysis at Pump Inlet Equipped with a Symmetrical Suction Elbow, Proceedings of the Romanian Academy Series A: Mathematics, Physics, Technical Sciences, Information Sciences, ISSN 1454-9069, 17(3), 237-244. (WOS:000383527500007) IF2015=1.735 [Q2 – Multidisciplinary Sciences]
4. Ciocan T., Susan-Resiga R., Muntean S. (Corresponding author), (2016) Modelling and optimization of the velocity profiles at the draft tube inlet of a Francis turbine within an operating range, Journal of Hydraulic Research, ISSN 0022-1686, 54(1), 74-89. DOI: 10.1080/00221686.2015.1119763 (WOS:000370980100005) IF2015=1.471 [Q2 – Water Resources]
5. Susan-Resiga R., Muntean S., Stuparu A., Bosioc A.I., Tănasă C., Ighişan C., (2016) A variational model for swirling flow states with stagnant region, European Journal of Mechanics B-Fluids, ISSN 0097-7546, 55(1), 104-115. DOI: 10.1016/j.euromechflu.2015.09.002 (WOS:000367762900010) IF2015=1.418 [Q2 – Mechanics]
6. Muntean S., Drăghici I., Gînga G., Anton L.E., Baya A., (2015) Hydrodynamic design of a storage pump impeller using inverse method and experimental investigation of the global performances, WasserWirtschaft, ISSN 0043-0978, 105(1), 28-32.(WOS:000354657300007) IF2015=0.102 [Q4 – Water Resources]
7. Susan-Resiga R., Ighişan C., Muntean S., (2015) Mathematical Model for the Swirling Flow Ingested by the Draft Tube of Francis Turbines”, WasserWirtschaft, ISSN 0043-0978, 105(1), 23-27. (WOS:000354657300006) IF2015=0.102 [Q4 – Water Resources]
8. Ciocan T., Susan-Resiga R., Muntean S., (2014) Improving draft tube hydrodynamics over wide operating range”, Proceedings of the Romanian Academy Series A: Mathematics, Physics, Technical Sciences, Information Sciences, ISSN 1454-9069, 15(2), 182-190. (WOS: 000336714400011) IF2015=1.735 [Q2 – Multidisciplinary Sciences]
9. Negru R., Muntean S., Paşca N., Marşavina L., (2014) Failure assessment of the shaft of a pumped storage unit, Fatigue and Fracture of Engineering Materials and Structures, ISSN 1460-2695, 37(7), 807-820. DOI: 10.1115/1.4030678 (WOS: 000337593700012) IF2015=1.838 [Q1 – Engineering, Mechanical]
10. Moisă I.G., Susan-Resiga R., Muntean S., (2013) Pump inducer optimization based on cavitation criterion”, Proceedings of the Romanian Academy Series A: Mathematics, Physics, Technical Sciences, Information Sciences, ISSN 1454-9069, 14(4), 317-325. (WOS:000328441500008) IF2015=1.735 [Q2 – Multidisciplinary Sciences]
11. Anton A., Creţu V., Ruprecht A., Muntean S., (2013) Traffic Replay Compression (TRC): a highly efficient method for handling parallel numerical simulation data”, Proceedings of the Romanian Academy Series A: Mathematics, Physics, Technical Sciences, Information Sciences, ISSN 1454-9069, 14(4), 385-392. (WOS:000328441500016) IF2015=1.735 [Q2 – Multidisciplinary Sciences]
12. Stanciu I.R., Turcin I., Muntean S., Anton L.E., (2013) Cellular wind-power integration using remotely controlled pump hydro energy storage”, Proceedings of the Romanian Academy Series A: Mathematics, Physics, Technical Sciences, Information Sciences, ISSN 1454-9069, 14(3), 242-249. (WOS:000324011200009) IF2015=1.735 [Q2 – Multidisciplinary Sciences]
13. Tănasă C., Susan-Resiga R.F., Muntean S., Bosioc A.I., (2013) Flow-Feedback Method for Mitigating the Vortex Rope in Decelerated Swirling Flows, Journal of Fluids Engineering, ISSN 0098-2202, 135(6), 061304. DOI: 10.1115/1.4023946 (WOS:000326103300011) IF2015=1.283 [Q2 – Engineering, Mechanical]
Habilitation thesis Sebastian Muntean, PhD
14/161
14. Negru R., Muntean S., Marşavina L., Susan-Resiga R.F., Paşca N., (2012) Computation of stress distribution in a Francis turbine runner induced by fluid flow, Computational Material Science, ISSN 0927-0256, 64(11), 253-259. DOI: 10.1016/j.commatsci.2012.05.073
(WOS:000308396200053) IF2015=2.086 [Q2 – Material Science, Multidisciplinary] 15. Bosioc A.I., Susan-Resiga R.F., Muntean S., Tănasă C., (2012) Unsteady Pressure Analysis of a
Swirling Flow with Vortex Rope and Axial Water Injection in a Discharge Cone, Journal of Fluids Engineering, ISSN 0098-2202, 134(8), 081104. DOI: 10.1115/1.4007074 (WOS:000314759800004) IF2015=1.283 [Q2 – Engineering, Mechanical]
16. Stanciu I.R., Gînga Gh., Muntean S., Anton L.E., (2012) Low-speed-small-load direct torque control ripples filtering, Proceedings of the Romanian Academy Series A: Mathematics, Physics, Technical Sciences, Information Sciences, ISSN 1454-9069, 13(2), 125-132. (WOS: 000305318700006) IF2015=1.735 [Q2 – Multidisciplinary Sciences]
17. Susan-Resiga R.F., Muntean S., Avellan F., Anton I. (2011) Mathematical modeling of swirling flow in hydraulic turbines for the full operating range, Applied Mathematical Modelling, ISSN 0307-904X, 35(10), 4759-4773. DOI: 10.1016/j.apm.2011.03.052 (WOS:000292176200007) IF2015=2.291 [Q1 – Mechanics]
18. Tănasă C., Bosioc A.I., Muntean S., Susan-Resiga R., (2011) Flow-feedback control technique for vortex rope mitigation from conical diffuser of hydraulic turbines draft tube, Proceedings of the Romanian Academy Series A: Mathematics, Physics, Technical Sciences, Information Sciences, ISSN 1454-9069, 12(2), 125-132. (WOS:000291510700007) IF2015=1.735 [Q2 – Multidisciplinary Sciences]
19. Bosioc A.I., Tănasă C., Muntean S., Susan-Resiga R., (2010) Pressure recovery improvement in a conical diffuser with swirling flow using water jet injection, Proceedings of the Romanian Academy Series A: Mathematics, Physics, Technical Sciences, Information Sciences, ISSN 1454-9069, 11(3), 245-252. (WOS:000208624600008) IF2015=1.735 [Q2 – Multidisciplinary Sciences]
20. Susan-Resiga R.F., Muntean S., Hasmatuchi V., Anton I., Avellan F., (2010) Analysis and prevention of vortex breakdown in the simplified discharge cone of a Francis turbine, Journal of Fluids Engineering, ISSN 0098-2202, 132(5), 051102. DOI: 10.1115/1.4001486
(WOS:000277744700002) IF2015=1.283 [Q2 – Engineering, Mechanical] 21. Bernad S., Susan-Resiga R., Muntean S., Anton I., (2007) Cavitation phenomena in hydraulic
valves. Numerical modelling, Proceedings of the Romanian Academy Series A: Mathematics, Physics, Technical Sciences, Information Sciences, ISSN 1454-9069, 8(2), 151-160. (WOS: 000255027200010) IF2015=1.735 [Q2 – Multidisciplinary Sciences]
BDI journal papers covering habilitation thesis topics: 12(2) 1. Tănasă C., Muntean S., Bosioc A., Susan-Resiga R., Ciocan T., (2016) Influence of the air
admission on the unsteady pressure field in a decelerated swirling flow, UPB Scientific Bulletin, Series D: Mechanical Engineering, 78(3), pp. 161 – 170. (Scopus Database)
2. Drăghici I., Bosioc A.I., Muntean S., Anton L.E., (2014) Experimental investigation of the non-uniform inflow generated by the symmetrical section elbow of a large pump, UPB Scientific Bulletin, Series D: Mechanical Engineering, 76(3), pp. 207-214. (Scopus Database)
3. Muntean S., Susan-Resiga R., Câmpian V.C., Dumbravă C., Cuzmoş A., (2014) In situ unsteady pressure measurements on the draft tube cone of the Francis turbine with air injection over an extended operating range, UPB Scientific Bulletin, Series D: Mechanical Engineering, 6(3), pp.

Habilitation thesis Sebastian Muntean, PhD
15/161
173-180. (Scopus Database) 4. Dragomirescu F.I., Susan-Resiga R., Muntean S., (2013) Proper Orthogonal Decomposition
Method in Swirling Flows Applications, PAMM, 13, pp. 441-442. DOI: 10.1002/pamm.201310214 (Scopus Database)
5. Bernad S.I., Susan-Resiga R., Muntean S., (2012) Two-phase cavitating flow in turbomachines, Research Journal of Applied Sciences, Engineering and Technology, 4(22), pp. 4685-4695. (Scopus Database)
6. Gînga G., Anton L., Baya, A., Muntean S., (2012) Numerical investigation of the 3D flow in the suction elbow and impeller of a storage pump, UPB Scientific Bulletin, Series D: Mechanical Engineering, 74(1), pp. 43 - 50. (Scopus Database)
7. Petit O., Bosioc A.I., Nilsson H., Muntean S., Susan-Resiga R.F., (2011) Unsteady Simulations of the Flow in a Swirl Generator using OpenFOAM, International Journal of Fluid Machinery and Systems, 4(1), pp. 199-208. DOI: 10.5293/IJFMS.2011.4.1.199. (JSTAGE database)
8. Tănasă C., Bosioc A., Susan-Resiga R., Muntean S., (2011) Flow-feedback for pressure fluctuation mitigation and pressure recovery improvement in a conical diffuser with swirl, International Journal of Fluid Machinery and Systems, 4(1), pp. 47- 56. DOI: 10.5293/IJFMS.2011.4.1.047 (JSTAGE database)
9. Stuparu A., Susan-Resiga R., Anton L.E., Muntean S., (2011) A new approach in numerical assessment of the cavitation behaviour of centrifugal pumps, International Journal of Fluid Machinery and Systems, 4(1), pp. 104-113. DOI: 10.5293/IJFMS.2011.4.1.104 (JSTAGE database)
10. Muntean S., Ninaci I., Susan-Resiga R., Baya A., Anton I., (2010) Numerical analysis of the flow in the old Francis runner in order to define the refurbishment strategy, UPB Scientific Bulletin, Series D: Mechanical Engineering, 72(1), pp. 117 - 124. (Scopus Database)
11. Dunca G., Muntean S., Isbăşoiu E.C., (2010) 3D numerical analysis of the impeller - Stator interaction into a storage pump, UPB Scientific Bulletin, Series D: Mechanical Engineering, 72(1), pp. 149 – 156. (Scopus Database)
12. Susan-Resiga R., Muntean S., Stein P., Avellan F., (2009) Axi-symmetric Swirling Flow Simulation of the Draft Tube Vortex in Francis Turbines at Partial Discharge, International Journal of Fluid Machinery and Systems, 2(4). Paper no. O09028S (JSTAGE database)
Other journal papers covering habilitation thesis topics: 30(8) 1. Muntean S., Susan-Resiga R., Goede E., Baya A., Terzi R., Tîrşi C., (2016) Scenarios for
refurbishment of a hydropower plant equipped with Francis turbines, Renewable Energy and Environmental Sustainability, 1, 30, pp. 1- 6.
2. Muntean S., Baya A., Susan-Resiga R., Anton I., (2009) Numerical Flow Analysis into a Francis Turbine Runner with Medium Specific Speed at Off-Design Operating Conditions, Acta Technica Napocensis, Series: Applied Mathematics and Mechanics, 52, II, pp. 325 – 334
3. Baya A., Bosioc A., Muntean S., Susan-Resiga R., (2009) Experimental Investigations of the Vortex Rope into a Simplified Draft Tube and its Flow Control, Acta Technica Napocensis, Series: Applied Mathematics and Mechanics, 52, II, pp. 249 -257
4. Bosioc A., Susan-Resiga R., Muntean S., (2008) Unsteady Pressure Measurements in Conical Diffuser with Swirling Flow. In Georgescu A.-M., Georgescu S.-C., Bernad S. (eds.), Proceedings of the 4th Workshop on Vortex Dominated Flows, September 12-13, Bucharest, Romania. Scientific Bulletin of the Politehnica University of Timisoara, Transactions on Mechanics, 53(67),

Habilitation thesis Sebastian Muntean, PhD
16/161
3, pp. 81 – 88 5. Stuparu A., Muntean S., Baya A., Anton L.E., (2008) 3D Numerical Investigation of Flow through
the Centrifugal Pump with Double Flux. In Georgescu A.-M., Georgescu S.-C., Bernad S. (eds.), Proceedings of the 4th Workshop on Vortex Dominated Flows, September 12-13, Bucharest, Romania. Scientific Bulletin of the Politehnica University of Timisoara, Transactions on Mechanics, 53(67), Issue 3, pp. 75 – 80
6. Bobar M., Zsembinszki S., Muntean S., Nedelcu D., (2008) Hydrodynamic Design of a New Francis Turbine with High Specific Speed. In Balasoiu V., Popoviciu M.O., Bordeasu I., Milos T., Vasilescu M. (eds.), Proceedings of the International Conference on Hydraulic Machinery and Equipments (HME2008), October 16-17, Timisoara, Romania. Scientific Bulletin of the Politehnica University of Timisoara, Transactions on Mechanics, Special Issue, pp. 109 - 114.
7. Muntean S., Susan-Resiga R., Bosioc A., Bernad S., Anton I., (2007) Water Jet Control Technique for Swirling Flows in Francis Turbines Diffuser, Scientific Bulletin of the Politehnica University of Bucharest, Series C: Electrical Engineering, Bucharest, Romania. pp. 665 - 672.
8. Baya A., Bosioc A., Stuparu A., Muntean S., Susan-Resiga R., Milos T., Anton L.E., (2007) Development a New Test Rig for Analysis and Control of Swirling Flows, Scientific Bulletin of the Politehnica University of Bucharest, Series C: Electrical Engineering, Bucharest, Romania. pp. 672 - 680.
9. Susan-Resiga R., Muntean S., Bosioc A., Stuparu A., Milos T., Baya A., Bernad S., Anton L.E., (2007) Swirling Flow Apparatus and Test Rig for Flow Control in Hydraulic Turbines Discharge Cone. In Resiga R., Bernad S., Muntean S. (eds.), Proceedings of the 2nd IAHR International Meeting of the Workgroup on Cavitation and Dynamic Problems in Hydraulic Machinery and Systems, October 24-16, Timisoara, Romania. Scientific Bulletin of the Politehnica University of Timisoara, Transactions on Mechanics, Special Issue, pp. 203 - 217.
10. Kirschner O., Muntean S., Susan-Resiga R., Ruprecht A., (2007) Swirling Flow in a Straight Cone Draft Tube: Axi-symmetric Flow Analysis and Comparison with Circumferentially Averaged PIV Measurements. In Resiga R., Bernad S., Muntean S. (eds.), Proceedings of the 2nd IAHR International Meeting of the Workgroup on Cavitation and Dynamic Problems in Hydraulic Machinery and Systems, October 24-16, Timisoara, Romania. Scientific Bulletin of the Politehnica University of Timisoara, Transactions on Mechanics, Special Issue, pp. 185 - 197.
11. Susan-Resiga R., Muntean S., Hasmatuchi V., Bernad S., (2007) Development of a swirling flow control technique for Francis turbines operated at partial discharge, Scientific Bulletin of the Politehnica University of Timisoara, Transactions on Mechanics, 52(66), 3, pp. 1 - 12.
12. Bernad S., Susan-Resiga R., Muntean S., Anton I., (2006) Numerical analysis of the cavitating flows, Proceedings of the Romanian Academy, Series A: Mathematics, Physics, Technical Sciences, Information Science, 7(1).
13. Susan-Resiga R., Muntean S., Bernad S., Frunză T., Balint D., (2006) Thin hydrofoil cascade design and numerical flow analysis. Part I - Design, Proceedings of the Romanian Academy, Series A: Mathematics, Physics, Technical Sciences, Information Science, 7(2).
14. Susan-Resiga R., Muntean S., Bernad S., Frunză T., Balint D., (2006) Thin hydrofoil cascade design and numerical flow analysis. Part II - Analysis, Proceedings of the Romanian Academy, Series A: Mathematics, Physics, Technical Sciences, Information Science, 7(3).
15. Susan-Resiga R.F., Muntean S., Bernad S., Hasmatuchi V, Anton I., Avellan F., (2006) Inviscid vortex breakdown in decelerated swirling flows and flow control methods. Scientific Bulletin of the

Habilitation thesis Sebastian Muntean, PhD
17/161
Politehnica University of Timisoara, Transaction on Mechanics, 51(65), Special Issue, pp.15-22. 16. Miloş T., Muntean S., Stuparu A., Baya A., Susan-Resiga R., (2006) Automated procedure for
design and 3D numerical analysis of the flow through impellers, Scientific Bulletin of the Politehnica University of Timisoara, Transaction on Mechanics, 51(65), Special Issue, pp.23-30.
17. Stuparu A., Muntean S., Balint D., Anton L.E., Baya A., (2006) Numerical investigation of the influence of the suction elbow over the flow field of a storage pump impeller, Scientific Bulletin of the Politehnica University of Timisoara, Transaction on Mechanics, 51(65), Special Issue, pp. 31-36.
18. Muntean S., Susan-Resiga R., Balint D., Bernad S., Anton I., (2006) Numerical investigation of accelerated swirling flow in Kaplan turbines. Scientific Bulletin of the Politehnica University of Timisoara, Transaction on Mechanics, 51(65), Special Issue, pp.37-44.
19. Bernad S., Susan-Resiga R.F., Muntean S., (2006) Analysis of the recirculation region behind bluff bodies, Scientific Bulletin of the Politehnica University of Timisoara, Transaction on Mechanics, 51(65), Special Issue, pp. 45-50.
20. Susan-Resiga R.F., Avellan F., Ciocan G.D., Muntean S., Anton I., (2005) Mathematical and Numerical Modeling of Swirling Flow in Francis Turbine Draft Tube Cone, Scientific Bulletin of the Politehnica University of Timisoara, Transactions on Mechanics, 50(64), pp. 1-16.
21. Resiga R., Miloş T., Baya A., Muntean S., Bernad S., (2005) Mathematichal and numerical models for axi-symmetric swirling flow for turbomachinery applications, Scientific Bulletin of the Politehnica University of Timisoara, Transactions on Mechanics, 50(64), pp. 47-58.
22. Susan-Resiga R.F., Frunză T., Muntean S., Bernad S., Armeana C., (2005) CASCADExpert: Software Development for Cascade Hydrodynamics, Scientific Bulletin of the Politehnica University of Timisoara, Transactions on Mechanics, 50(64), pp. 59-68.
23. Muntean S., Ruprecht A., Susan-Resiga R., (2005) A Numerical Investigation of the 3D Swirling Flow in a Pipe with Constant Diameter. Part 1: Inviscid Computation, Scientific Bulletin of the Politehnica University of Timisoara, Transactions on Mechanics, 50(64), pp. 77-86.
24. Muntean S., Buntić I., Ruprecht A., Susan-Resiga R., (2005) A Numerical Investigation of the 3D Swirling Flow in a Pipe with Constant Diameter. Part 2: Turbulent Computation, Scientific Bulletin of the Politehnica University of Timisoara, Transactions on Mechanics, 50(64), pp. 87-96.
25. Muntean S., Balint D., Susan-Resiga R., Bernad S., Anton I., (2005) A Numerical Study of the 3D Swirling Flow Upstream to the Kaplan turbine runner at off-design operating conditions, Scientific Bulletin of the Politehnica University of Timisoara, Transactions on Mechanics, 50(64), pp. 97-104.
26. Balint D., Susan-Resiga R., Muntean S., Bernad S., (2005) Swirling Flow Optimization in the Spiral Case and Distributor of Kaplan hydraulic turbine, Scientific Bulletin of the Politehnica University of Timisoara, Transactions on Mechanics, 50(64), pp. 105-112.
27. Balint D., Muntean S., Anton I., Susan-Resiga R., (2005) A New Mixing Interface Approach for Turbulent Swirling Flows in Hydraulic Turbines, Scientific Bulletin of the Politehnica University of Timisoara, Transactions on Mechanics, 50(64), pp. 113-120.
28. Muntean S., Susan-Resiga R., Bernad S., Anton I., (2004) Analysis of the Francis GAMM Turbine Distributor 3D Flow for the Whole Operating Range and Optimization of the Guide Vane Axis Location. In Resiga R., Bernad S., Muntean S., Popoviciu M. (Eds.) Proceedings of the 6th International Conference in Hydraulic Machinery and Hydrodynamics, October 21-22, Timişoara. Scientific Bulletin of the Politehnica University of Timişoara, Transactions on Mechanics, 49(63), Special Issue, pp. 131-136.
Habilitation thesis Sebastian Muntean, PhD
18/161
29. Bernad S., Susan-Resiga R., Muntean S., Anton I., (2004) Numerical Simulation of Two-Phase Cavitating Flow in Turbomachines. In Resiga R., Bernad S., Muntean S., Popoviciu M. (Eds.) Proceedings of the 6th International Conference in Hydraulic Machinery and Hydrodynamics, October 21-22, Timişoara. Scientific Bulletin of the Politehnica University of Timişoara, Transactions on Mechanics, 49(63), Special Issue, pp. 439-446.
30. Balint D., Susan-Resiga R., Muntean S., Anton I., (2004) A Numerical Investigation of the Full 3D Turbulent Flow in Kaplan Hydraulic Turbines. In Resiga R., Bernad S., Muntean S., Popoviciu M. (Eds.) Proceedings of the 6th International Conference in Hydraulic Machinery and Hydrodynamics, October 21-22, Timişoara . Scientific Bulletin of the Politehnica University of Timişoara, Transactions on Mechanics, 49(63), Special Issue, pp. 59-66.
ISI proceeding papers covering habilitation thesis topics: 31 (5) 1. Moş D.C., Muntean S. (Corresponding author), Tănasă C., Bosioc A.I. and Susan-Resiga R.
(2017) Experimental Investigation of the Unsteady Pressure Field in Decelerated Swirling Flow with 74° Sharp Heel Elbow, IOP Conference Series - Journal of Physics: Conference Series, 813(1), Paper No. 012046. DOI:10.1088/1742-6596/813/1/012046
2. Muntean S., Bosioc A.I., Drăghici I., Anton L.E., (2016) Hydrodynamic analysis of the flow field induced by a symmetrical suction elbow at the pump inlet, IOP Conference Series - Earth and Environmental Science, 49(3), Paper No 032014. DOI: 10.1088/1755-1315/49/3/032014
3. Bosioc A.I., Muntean S., Drăghici I., Anton L.E., (2016) Hydrodynamic analysis of the flow in an axial rotor and impeller for large storage pump, IOP Conference Series - Earth and Environmental Science, 49(3), Paper No 032016. DOI: 10.1088/1755-1315/49/3/032016
4. Muntean S., Tănasă C., Bosioc A.I., Moş D.C., (2016) Investigation of the plunging pressure pulsation in a swirling flow with precessing vortex rope in a straight diffuser, IOP Conference Series - Earth and Environmental Science, 49(8), Paper No 082010. DOI: 10.1088/1755-1315/49/8/082010
5. Susan-Resiga R., Muntean S., Popescu C., (2016) Swirling flow computation at the trailing edge of radial-axial hydraulic turbines, IOP Conference Series - Earth and Environmental Science, 49(8), Paper No 082012. DOI: 10.1088/1755-1315/49/8/082012
6. Tănasă C., Muntean S., Ciocan T., Susan-Resiga R., (2016) 3D Numerical Simulation versus Experimental Assessment of Pressure Pulsations Using a Passive Method for Swirling Flow Control in Conical Diffusers of Hydraulic Turbines, IOP Conference Series - Earth and Environmental Science, 49(8), Paper No 082018. DOI: 10.1088/1755-1315/49/8/082018
7. Anton A., Muntean S., (2015) A Method for Data Handling Numerical Results in Parallel OpenFOAM Simulations, AIP Conference Proceedings, 1702, Paper No. 080005. ISSN: 0094-243X DOI: 10.1063/1.4938800. (WOS:000371804300031)
8. Bosioc A.I., Muntean S., Susan-Resiga R.F., Borbath I., Vékás L., (2015) Numerical Analysis of the Temperature Field in A Magneto-Rheological Brake, AIP Conference Proceedings, 1702, Paper No. 080002. DOI: 10.1063/1.4938797 (WOS:000371804300028)
9. Tănasă C., Susan-Resiga R.F., Muntean S., Stuparu A., Bosioc A.I., Ciocan T., (2015) Numerical Assessment of a Novel Concept for Mitigating the Unsteady Pressure Pulsations Associated to Decelerating Swirling Flow with Precessing Helical Vortex, AIP Conference Proceedings, 1702, Paper No. 080003. DOI: 10.1063/1.4938798 (WOS:000371804300029)
10. Bosioc A.I., Muntean S., Tanasa C., Susan-Resiga R.F., Vékás L., (2014) Unsteady pressure
Habilitation thesis Sebastian Muntean, PhD
19/161
measurements of decelerated swirling flow in a discharge cone at lower runner speeds, IOP Conference Series - Earth and Environmental Science, 22, Paper No 032008. DOI: 10.1088/1755-1315/22/3/032008 (WOS: 000347441900066)
11. Drăghici I., Muntean S. (Corresponding author), Bosioc A.I., Anton L.E., (2014) LDV measurements of the velocity field on the inlet section of a pumped storage equipped with a symmetrical suction elbow for variable discharge values, IOP Conference Series - Earth and Environmental Science, 22, Paper No 032017. DOI: 10.1088/1755-1315/22/3/032017 (WOS: 000347441900075)
12. Javadi A., Bosioc A.I., Nilsson, H., Muntean S., Susan-Resiga R.F., (2014) Velocity and pressure fluctuations induced by the precessing helical vortex in a conical diffuser, IOP Conference Series - Earth and Environmental Science, 22, Paper No 032009 DOI: 10.1088/1755-1315/22/3/032009 (WOS: 000347441900067)
13. Kuibin P.A., Susan-Resiga R.F., Muntean S., (2014) A model for precessing helical vortex in the turbine discharge cone, IOP Conference Series - Earth and Environmental Science, 22, Paper No 022024 DOI: 10.1088/1755-1315/22/2/022024 (WOS: 000347441900058)
14. Susan-Resiga R.F., Muntean S., Ciocan T., de Colombel T., Leroy P., (2014) Surrogate runner model for draft tube losses computation within a wide range of operating points, IOP Conference Series - Earth and Environmental Science, 22, Paper No 012022. DOI: 10.1088/1755-1315/22/1/012022 (WOS: 000347441900022)
15. Bosioc A.I., Muntean S., Susan-Resiga R.F., Vékás L., Bernad S., (2014) Numerical Simulation of the Swirl Generator Discharge Cone at Lower Runner Speeds, AIP Conference Proceedings, 1558, Pages 204-207. DOI: 10.1063/1.4825456 (WOS:000331472800049)
16. Dragomirescu F.I., Susan-Resiga R., Muntean S., (2013) Proper Orthogonal Decomposition Method in Swirling Flows Applications, AIP Conference Proceedings, 1558, 1349-1352 DOI: 10.1063/1.4825762 (WOS: 000331472800319)
17. Muntean S., Ciocan T., Susan-Resiga R.F., Cervantes M., Nilsson H., (2013) Mathematical, numerical and experimental analysis of the swirling flow at a Kaplan runner outlet, IOP Conference Series - Earth and Environmental Science, 15, Paper No 032001. DOI: 10.1088/1755-1315/15/3/032001 (WOS: 000324782300031)
18. Susan-Resiga R.F., Muntean S., Ciocan T., Joubarne E., Leroy P., Bornard L., (2013) Influence of the velocity field at the inlet of a Francis turbine draft tube on performance over an operating range, IOP Conference Series - Earth and Environmental Science, 15, Paper No 032008. DOI: 10.1088/1755-1315/15/3/032008 (WOS: 000324782300038)
19. Tănasă C., Bosioc A.I., Susan-Resiga R.F., Muntean S., (2013) Experimental investigations of the swirling flow in the conical diffuser using flow-feedback control technique with additional energy source, IOP Conference Series - Earth and Environmental Science, 15, Paper No 062043. DOI: 10.1088/1755-1315/15/6/062043 (WOS: 000324782300210)
20. Stanciu I.R., Gînga G., Muntean S., Anton L.E., (2013) A multi-purpose vision-equipped-remotely-operable rig for hydro-units monitoring, Advanced Engineering Forum, 8-9, pp. 175-184. DOI: 10.4028/www.scientific.net/AEF.8-9.175 (WOS: 000323184000020)
21. Negru R., Marsavina L., Muntean S., Pasca N., (2013) Fatigue Behaviour of Stainless Steel used for Turbine Runners, Advanced Engineering Forum, 8-9, pp. 413-420. DOI:10.4028/www.scientific.net/AEF.8-9.413 (WOS: 000323184000047)
22. Baya A., Muntean S., Campian V.C., Cuzmos A., Diaconescu M., Balan G., (2010) Experimental
Habilitation thesis Sebastian Muntean, PhD
20/161
investigations of the unsteady flow in a Francis turbine draft tube cone, IOP Conference Series-Earth and Environmental Science, 12, Paper No 012007. DOI: 10.1088/1755-1315/12/1/012007 (WOS: 000325657000007)
23. Bosioc A.I., Tanasa C., Muntean S., Susan-Resiga R.F., (2010) Unsteady pressure measurements and numerical investigation of the jet control method in a conical diffuser with swirling flow, IOP Conference Series-Earth and Environmental Science, 12, Paper No 012017. DOI: 10.1088/1755-1315/12/1/012017 (WOS: 000325657000017)
24. Dunca G., Muntean S., Isbasoiu E.C., (2010) Analysis of the flow field into a two stages and double entry storage pump taking into account two geometries of stator blades, IOP Conference Series - Earth and Environmental Science, 12, Paper No 012016. DOI: 10.1088/1755-1315/12/1/012016 (WOS: 000325657000016)
25. Frunză T., Susan-Resiga R., Muntean S., Bernad S., (2010) Optimization of the hydrofoil cascade and validation with quasi-analytical solution for hydraulic machinery, IOP Conference Series - Earth and Environmental Science, 12, Paper No 012075. DOI: 10.1088/1755-1315/12/1/012075 (WOS: 000325657000075)
26. Frunzăverde D., Muntean S., Mărginean G., Câmpian V., Marşavina L., Terzi R., Şerban V., (2010) Failure analysis of a Francis turbine runner, IOP Conference Series - Earth and Environmental Science, 12, Paper No 012115. DOI: 10.1088/1755-1315/12/1/012115 (WOS: 000325657000115)
27. Kuibin P.A., Okulov V.L., Susan-Resiga R.F., Muntean S., (2010) Validation of mathematical models for predicting the swirling flow and the vortex rope in a Francis turbine operated at partial discharge, IOP Conference Series - Earth and Environmental Science, 12, Paper No 012051. DOI: 10.1088/1755-1315/12/1/012051 (WOS: 000325657000051)
28. Petit O., Bosioc A.I., Nilsson H., Muntean S., Susan-Resiga R.F., (2010) A swirl generator case study for OpenFOAM, IOP Conference Series - Earth and Environmental Science, 12, Paper No 012056. DOI: 10.1088/1755-1315/12/1/012056 (WOS: 000325657000056)
29. Stuparu A., Susan-Resiga R., Anton L.E., Muntean S., (2010) Numerical investigation of the cavitational behaviour into a storage pump at off design operating points, IOP Conference Series - Earth and Environmental Science, 12, Paper No 012068. DOI: 10.1088/1755-1315/12/1/012068 (WOS: 000325657000068)
30. Tănasă C., Susan-Resiga R., Bosioc A., Muntean S., (2010) Mitigation of pressure fluctuations in the discharge cone of hydraulic turbines using Flow-Feedback, IOP Conference Series - Earth and Environmental Science, 12, Paper No 012067. DOI: 10.1088/1755-1315/12/1/012067 (WOS: 000325657000067)
31. Bistrian D.A., Dragomirescu I.F., Muntean S., Topor M., (2009) Numerical Methods for Convective Hydrodynamic Stability of Swirling Flows, Mathematics and Computers in Science and Engineering, pp. 283-288. (WOS:000272165400039)
Books/chapters: 10(4) 1. Muntean S., Bosioc A.I., Szakal R.A., Vékás L., Susan-Resiga R.F. (2017) Hydrodynamic
investigations in a swirl generator using a magneto-rheological brake. In da Silva L.F.M. (Ed.), Advanced Structured Materials, Vol. 65, pp. 209-218. Springer ISBN: 978-3-319-50783-5 DOI: 10.1007/978-3-319-50784-2_17
2. Bosioc A.I., Beja T.E., Muntean S., Borbáth I., Vékás L. (2017) Experimental investigations of
Habilitation thesis Sebastian Muntean, PhD
21/161
Magneto-Rheological Fluids in air and water used for brakes and clutches. In da Silva L.F.M. (Ed.), Advanced Structured Materials, Vol. 65, pp. 197-207. Springer ISBN: 978-3-319-50783-5 DOI: 10.1007/978-3-319-50784-2_16
3. Pasca N., Marsavita L., Negru R., Muntean S. (2013) Estimation of the Stress Intensity Factor for 3D Cracked T – Joint. In: Jármai K., Farkas J. (eds) Design, Fabrication and Economy of Metal Structures, pp. 273-280. Springer ISBN: 978-3-642-36690-1 DOI: 10.1007/978-3-642-36691-8_41
4. Susan-Resiga R., Muntean S. (2009) Decelerated Swirling Flow Control in the Discharge Cone of Francis Turbines. In: Xu J., Wu Y., Zhang Y., Zhang J. (eds) Fluid Machinery and Fluid Mechanics, pp. 89-96. Springer ISBN: 978-3-540-89748-4 DOI: 10.1007/978-3-540-89749-1_12
5. Muntean S., (2008) Numerical analysis of the flow in Francis turbines [Analiza numerica a curgerii in turbinele Francis], Orizonturi Universitare Publishing House, Timişoara. ISBN 978-973-638-355-7 (Romanian National Library, reference no. III 284038)
6. Susan-Resiga R., Muntean S., Baya A., Anton L.E., Milos T., Stuparu A., (2007) Chapter 3. Mathematical and Numerical Analysis of Axisymmetric Swirling Flow. In Susan-Resiga R., Bernad S., Muntean S. (Editors) Vortex Hydrodynamics and Applications, Eurostampa Publishing House, Timisoara. ISBN: 978-973-687-659-2 (Romanian National Library, reference no. IV 78273)
7. Muntean S., Susan-Resiga R., Bosioc A., Stuparu A., Baya A., Campian V., Nedelcu D., Balint D., Safta C., Stoia M., (2007) Chapter 5. Turbomachinery Swirling Flows. In Susan-Resiga R., Bernad S., Muntean S. (Editors) Vortex Hydrodynamics and Applications, Eurostampa Publishing House, Timisoara. ISBN: 978-973-687-659-2 (Romanian National Library, reference no. IV 78273)
8. Muntean S., Susan-Resiga R.F., Anton I., (2004) Mixing interface algorithm for 3D turbulent flow analysis of the GAMM Francis turbine. In: Vad J., Lajos T., Schilling R. (Eds.) Modelling Fluid Flow, pp. 359-372. Springer ISBN: 978-3-642-06034-2 DOI: 10.1007/978-3-662-08797-8_25
9. Anton L., Balint D., Baya A., Badarau R., Bălăşoiu V., Bej A., Milos T., Muntean S., Resiga R., Stuparu A., (2004) Fluid Mechanics, Hydraulic Machinery and Hydropower. Computing applications [Mecanica Fluidelor, Masini Hidraulice si Actionari. Aplicatii de Calcul], Orizonturi Universitare Publishing House, Timişoara. ISBN 978-973-638-076-9
10. Susan-Resiga R., Muntean S., Bernad S., Balint D., Balint I., (2003) Modern Methods for Parallel Computing in Fluid Flow Simulation [Metode Moderne de Calcul Paralel pentru Simularea Curgerii Fluidelor], Orizonturi Universitare Publishing House, Timişoara. ISBN 978-973-638-064-5 (Romanian National Library, reference no. III 259590)
Proceedings: 9(1) 1. Susan-Resiga R., Muntean S., Bernad S., (Eds.), (2010) Proceedings of the 25th IAHR Symposium
on Hydraulic Machinery and Systems, Timisoara, 20-24 Sept. 2010, in Institute of Physics. Conference Series Earth and Environment Science, Issue 12, ISSN 1775-1315. (http://iopscience.iop.org/1755-1315/12/)
2. Susan-Resiga R., Bernad S., Muntean S. (Eds.), (2007) Proceedings of the 2nd IAHR International Meeting of the Workgroup on Cavitation and Dynamic Problems in Hydraulic Machinery and Systems, Timisoara, 24-26 Oct. 2007, in Scientific Bulletin of the Politehnica University of Timisoara, Transactions on Mechanics, Issue 6, Tom 52(66), (244 pp.), ISSN 1224-6077. (http://mh.mec.upt.ro/iahrwg2007/)
Habilitation thesis Sebastian Muntean, PhD
22/161
3. Susan-Resiga R., Bernad S., Muntean S. (Eds.) (2007) Vortex Hydrodynamics and Applications, Eurostampa Publishing House, (600 pp.). ISBN: 978-973-687-659-2 (Romanian National Library, reference no. IV 78273)
4. Muntean S., Ruprecht A. (Eds.), (2007) Proceedings of the 3rd Romanian-German Workshop on Turbomachinery Hydrodynamics, Orizonturi Universitare Publishing House, (160 pp.). ISBN 978-973-638-329-8 (Romanian National Library, reference no. III 278897)
5. Bernad S., Muntean S., Susan-Resiga R. (Eds.), (2007) Proceedings of the 3rd Workshop on Vortex Dominated Flows. Achievements and Open Problems, in Scientific Bulletin of the Politehnica University of Timisoara, Transactions on Mechanics, Issue 3, Tom 52(66), (158 pp.). ISSN 1224-6077 (http://mh.mec.upt.ro/accord-fluid/workshop2007/)
6. BernadS., Muntean S., Susan-Resiga R. (Eds.), (2006) Proceedings of the 2nd Workshop on Vortex Dominated Flows Achievements and Open Problems, in Scientific Bulletin of the Politehnica University of Timisoara, Romania, Transactions on Mechanics, Special Issue, (196 pp.). ISSN 1224-6077 (http://mh.mec.upt.ro/accord-fluid/workshop2006/)
7. Bernad S., Muntean S., Susan-Resiga R. (Eds.), (2005) Proceedings of the Workshop on Vortex Dominated Flows Achievements and Open Problems, in Scientific Bulletin of the Politehnica University of Timisoara, Romania, Transactions on Mechanics, Special Issue, (214 pp.). ISSN 1224-6077 (http://mh.mec.upt.ro/accord-fluid/workshop2005/)
8. Susan-Resiga R., Bernad S., Muntean S., Popoviciu M. (Eds.), (2004) Proceedings of the 6th International Conference on Hydraulic Machinery and Hydrodynamics, Scientific Bulletin of the Politehnica University of Timisoara, Romania, Transactions on Mechanics, Tom 49(63), Special Issue, (740 pp.). ISSN 1224-6077 (http://mh.mec.upt.ro/hmh2004/)
9. Anton I., Resiga R., Sofonea S., Bernad S., Muntean S., (Eds.) (2003) Proceedings of Workshop on Numerical Methods in Fluid Mechanics and FLUENT Applications, Orizonturi Universitare Publishing House, (312 pp.). ISBN 973-638-022-X (Romanian National Library, reference no. III 256975)
International conference papers covering habilitation thesis topics: 48(14) 1. Muntean S., Moş D.C., Tănasă C., Bosioc A.I. and Susan-Resiga R. (2016) The Plunging
Components with Low Frequencies in Swirling Flows Through a Straight Diffuser with and without a 90º Heel Elbow. In Proceedings of the 19th International Conference on Hydropower Plants, November 9 - 11, Vienna, Austria, Paper No. 1073.
2. Susan-Resiga R., Muntean S., Ighisan C., Popescu C. (2016) Splitter band influence on the draft tube flow within a range of turbine discharge. In Proceedings of the 19th International Conference on Hydropower Plants, November 9 - 11, Vienna, Austria, Paper No. 1072.
3. Bosioc A.I., Constantin S., Muntean S., Anton L.E. (2016) Numerical Assessment of the Flow Field Induced by an Axial Rotor with Variable Speed in a Pump Impeller. In Proceedings of the 19th International Conference on Hydropower Plants, November 9 - 11, Vienna, Austria, Paper No. 1075.
4. Tănasă C., Ciocan T., Muntean S., Susan-Resiga R. (2016) Numerical Assessment of Decelerated Swirling Flow with Vortex Rope from Conical Diffuser Using Pulsating Water Jet. In Proceedings of the 19th International Conference on Hydropower Plants, November 9 - 11, Vienna, Austria, Paper No. 1074.
5. Muntean S., Škerlavaj A., Drăghici I., Anton L.E., (2015) Numerical Analysis of the Flow Non-

Habilitation thesis Sebastian Muntean, PhD
23/161
uniformity Generated by Symmetrical Suction Elbow of the Large Storage Pumps. In Proceedings of the 6th IAHR International Meeting of the Workgroup on Cavitation and Dynamic Problems in Hydraulic Machinery and Systems (IAHRWG2015), Septembre 9-11, Ljubliana, Slovenia. pp. 1-8
6. Susan-Resiga R., Muntean S., Stuparu A., Neipp A., Ruprecht A., Riedelbauch S., (2015) On the Hub-to-Shroud Ratio of an Axial Expansion Turbine for Energy Recovery. In Proceedings of the 6th IAHR International Meeting of the Workgroup on Cavitation and Dynamic Problems in Hydraulic Machinery and Systems (IAHRWG2015), Septembre 9-11, Ljubliana, Slovenia. pp. 1-7
7. Tănasă C., Bosioc A., Muntean S., Susan-Resiga R., (2015) Experimental and Numerical Assessment of the Velocity Profiles using a Passive Method for Swirling Flow Control. In Proceedings of the 6th IAHR International Meeting of the Workgroup on Cavitation and Dynamic Problems in Hydraulic Machinery and Systems (IAHRWG2015), Septembre 9-11, Ljubliana, Slovenia. pp. 1-8
8. Muntean S., Tănasă C., Susan-Resiga R., Bosioc A.I., (2015) Influence of the Adverse Pressure Gradient on the Swirling Flow. In Proceedings of the 16th International Conference on Modeling Fluid Flow (CMFF’15), September 1-4, Budapest, Hungary. pp. 1-8
9. Tănasă C., Susan-Resiga R., Muntean S., Stuparu A., Bosioc A., Cicoan T., (2015) Numerical Assessment of a New Passive Control Method for Mitigating the Precessing Helical Vortex in a Conical Diffuser. In Proceedings of the 16th International Conference on Modeling Fluid Flow (CMFF’15), September 1-4, Budapest, Hungary. pp. 1-8
10. Bosioc A.I., Muntean S., Susan-Resiga R., (2013) Swirling flow analysis downstream the runner of the swirl generator at lower speeds. In Proceedings of 5th IAHR International Workgshop on Cavitation and Dynamic Problems in Hydraulic Machinery (IAHRWG2013), September 8-11, Lausanne, Switzerland. Paper 2.1
11. Susan-Resiga R., Muntean S., Anton A., (2013) Swirling flow with stagnat region and vortex sheet. A novel variational approach. In Proceedings of 5th IAHR International Workgshop on Cavitation and Dynamic Problems in Hydraulic Machinery (IAHRWG2013), September 8-11, Lausanne, Switzerland. Paper 8.5.
12. Gînga G., Stanciu R.I., Muntean S., Baya A., Anton L.E., (2012) 3D Numerical Flow Analysis and Experimental Validation into a Model Impeller of a Storage Pump. In Proceedings of the 15th International Conference on Fluid Flow Technologies (CMFF12), September 4-7, Budapest, Hungary.
13. Ciocan T., Muntean S., Susan-Resiga R.F., (2012) Self - induced unsteadiness of the GAMM Francis turbine draft tube at partial discharge. In Proceedings of the 15th International Conference on Fluid Flow Technologies (CMFF12), September 4-7, Budapest, Hungary.
14. Moisă I., Ginga G., Muntean S., Susan-Resiga R., (2012) Inverse Design and 3D Numerical Analysis of the Inducer for Storage Pump Impeller. In Proceedings of the 15th International Conference on Fluid Flow Technologies (CMFF12), September 4-7, Budapest, Hungary.
15. Bosioc A.I., Tănasă C., Susan-Resiga R.F., Muntean S., Vékás L., (2012) Numerical Analysis of a Swirling Flow Generated at Lower Runner Speeds. In Proceedings of the 15th International Conference on Fluid Flow Technologies (CMFF12), September 4-7, Budapest, Hungary.
16. Gînga G., Stuparu A., Bosioc A., Anton L.E., Muntean S., (2011) 3D Numerical Simulation of the Flow into the Suction Elbow and Impeller of a Storage Pump. Gajic A., Benisek M., Nedeljkovic M., (eds) in Proceedings of the 4th IAHR International Meeting of the Workgroup on Cavitation and Dynamic Problems in Hydraulic Machinery and Systems (IAHRWG2011), October 26-28,

Habilitation thesis Sebastian Muntean, PhD
24/161
Belgrade, Serbia, pp. 151 – 160. 17. Moisă I., Stuparu A., Susan-Resiga R., Muntean S., (2011) Inverse Design of a Pump Inducer and
Performance Evaluation with 3D Flow Simulation. Gajic A., Benisek M., Nedeljkovic M., (eds) in Proceedings of the 4th IAHR International Meeting of the Workgroup on Cavitation and Dynamic Problems in Hydraulic Machinery and Systems (IAHRWG2011), October 26-28, Belgrade, Serbia, pp. 171 – 178.
18. Muntean S., Bosioc A.I., Stanciu R., Tănasă C., Susan-Resiga R., (2011) 3D Numerical Analysis of a Swirling Flow Generator. Gajic A., Benisek M., Nedeljkovic M., (eds) in Proceedings of the 4th IAHR International Meeting of the Workgroup on Cavitation and Dynamic Problems in Hydraulic Machinery and Systems (IAHRWG2011), October 26-28, Belgrade, Serbia, pp. 115 – 124
19. Bosioc A.I., Tănasă C., Susan-Resiga R., Muntean S., (2011) Experimental analysis of unsteady velocity in decelerated swirling flows. Gajic A., Benisek M., Nedeljkovic M., (eds) in Proceedings of the 4th IAHR International Meeting of the Workgroup on Cavitation and Dynamic Problems in Hydraulic Machinery and Systems (IAHRWG2011), October 26-28, Belgrade, Serbia, pp. 105 – 114
20. Tănasă C., Bosioc A., Susan-Resiga R., Muntean S., (2011) LDV Experimental Measurements of Swirling Flow using Flow-Feedback Jet Injection Method. Gajic A., Benisek M., Nedeljkovic M., (eds) in Proceedings of the 4th IAHR International Meeting of the Workgroup on Cavitation and Dynamic Problems in Hydraulic Machinery and Systems (IAHRWG2011), October 26-28, Belgrade, Serbia, pp. 305 – 312
21. Muntean S., Nilsson H., Susan-Resiga R., (2009) 3D Numerical Analysis of the Unsteady Turbulent Swirling Flow in a Conical Diffuser using FLUENT and OpenFOAM. In Proceedings of the 3rd IAHR International Meeting of the Workgroup on Cavitation and Dynamic Problems in Hydraulic Machinery and Systems (IAHRWG2009), October 14-16, Brno, Czech Republic. Vol. I, Paper C4, pp. 155 – 164
22. Muntean S., Susan-Resiga R., Bosioc A., (2009) Numerical Investigation of the Jet Control Method for Swirling Flow with Precessing Vortex Rope. In Proceedings of the 3rd IAHR International Meeting of the Workgroup on Cavitation and Dynamic Problems in Hydraulic Machinery and Systems (IAHRWG2009), October 14-16, Brno, Czech Republic. Vol. I, Paper B2, pp. 65 – 74
23. Bosioc A., Tanasa C., Muntean S., Susan-Resiga R., (2009) 2D LDV Measurements and Comparison with Axisymmetric Flow Analysis of Swirling Flow in a Simplified Draft Tube. In Proceedings of the 3rd IAHR International Meeting of the Workgroup on Cavitation and Dynamic Problems in Hydraulic Machinery and Systems (IAHRWG2009), October 14-16, Brno, Czech Republic. Vol. II, Paper P6, pp. 551 – 560.
24. Dragomirescu F.I., Bistrian D.A., Muntean S., Susan-Resiga R., (2009) The stability of the swirling flows with applications to hydraulic turbines. In Proceedings of the 3rd IAHR International Meeting of the Workgroup on Cavitation and Dynamic Problems in Hydraulic Machinery and Systems (IAHRWG2009), October 14-16, Brno, Czech Republic. pp. 1-10.
25. Stuparu A., Muntean S., Susan-Resiga R., Anton L., (2009) Numerical investigation of the cavitational behaviour of a storage pump operating at best efficiency point. In Proceedings of the 3rd IAHR International Meeting of the Workgroup on Cavitation and Dynamic Problems in Hydraulic Machinery and Systems (IAHRWG2009), November 14-16, Brno, Czech Republic, pp. 229-238
26. Bosioc A., Tanasa C., Muntean S., Susan-Resiga R., (2009) 2D LDV Measurements of Swirling Flow in a Simplified Draft Tube. In Proceedings of the Conference on Modelling Fluid Flow
Habilitation thesis Sebastian Muntean, PhD
25/161
(CMFF’09), September 9-12, Budapest, Hungary. Vol. II, pp. 833 – 838. 27. Dunca G., Muntean S., Isbăşoiu C.E., (2009) 3D Numerical Flow Analysis into a Double Stage and
Double Flux Storage Pump. In Proceedings of the Conference on Modelling Fluid Flow (CMFF’09), September 9 -12, Budapesta, Hungary. Vol. II, pp. 811 - 817.
28. Muntean S., Susan-Resiga R., Bosioc A., (2009) 3D Numerical Analysis of Unsteady Pressure Fluctuations in a Swirling Flow without and with Axial Water Jet Control. In Proceedings of the Conference on Modelling Fluid Flow (CMFF’09), September 9-12, Budapest, Hungary. Vol. II, pp. 510 – 517
29. Stuparu A., Muntean S., Anton L., (2009) Validation of the 2D numerical investigation methodology of the turbulent flow into an inducer with the 3D computation. In Proceedings of the Conference on Modelling Fluid Flow (CMFF’09), September 9 -12, Budapesta, Hungary. Vol. II, pp. 736 – 742.
30. Susan-Resiga R., Muntean S., Tanasa C., Bosioc A., (2009) Three-Dimensional versus Two-Dimensional Axi-symmetric Analysis for Decelerated Swirling Flows. In Proceedings of the Conference on Modelling Fluid Flow (CMFF’09), September 9-12, Budapest, Hungary. Vol. II, pp. 862 – 869.
31. Muntean S., Susan-Resiga R., Bosioc A., Stuparu A., Baya A., Anton L.E., (2008), Mitigation of Pressure Fluctuations in a Conical Diffuser with Precessing Vortex Rope Using Axial Jet Control Method. In Proceedings of the 24th IAHR Symposium on Hydraulic Machinery and Systems, October 27-31, Foz do Iguassu, Brasil. pp. 1-10. (on CD)
32. Susan-Resiga R.F., Muntean S., Bernad S., Anton I., (2006) Numerical Simulation and Analysis of the Decelerated Swirling Flows in Hydraulic Turbines. Lajos T., Vad J. (Eds) Proceedings of the 13th International Conference on Modelling Fluid Flow (CMFF’06), Vol. II Budapest, Hungary. pp. 956-963.
33. Balint D., Susan-Resiga R., Muntean S., Anton I., (2006) Numerical Study of the Cavitation Phenomenon in Hydraulic Turbines. Lajos T., Vad J. (Eds) Proceedings of the 13th International Conference on Modelling Fluid Flow (CMFF’06), Vol. II, Budapest, Hungary. pp. 980-987.
34. Muntean S., Susan-Resiga R., Balint D., Bernad S., Anton I., (2006) Numerical Investigation and Analysis of Swirling Flow Upstream of Kaplan Runner for variable discharge. Lajos T., Vad J. (Eds) Proceedings of the 13th International Conference on Modelling Fluid Flow (CMFF’06), Vol. II, Budapest, Hungary. pp. 964-971.
35. Muntean S., D. Balint, R. Susan-Resiga, S. Bernad, I. Anton, (2006) Analytical representation of the swirling flow upstream the Kaplan turbine runner for variable guide vane opening. In Proceedings of the 23rd IAHR Symposium on Hydraulic Machinery and Systems (IAHR2006), October 17-21, Yokohama, Japan, Paper No.151, pp. 1-12. (on CD)
36. Muntean S., Anton L.E., Balint D., Baya A., Susan-Resiga R., Campian V., (2006) Evaluation of the Kaplan Turbine Discharge using Numerical Simulation. In Proceedings of the 23rd IAHR Symposium on Hydraulic Machinery and Systems (IAHR2006), October 17-21, Yokohama, Japan, Paper No. 154, pp.1-10. (on CD)
37. Susan-Resiga R., Ciocan G.D., Muntean S., Anton I., Avellan F., (2006) Numerical Simulation and Analysis of Swirling Flow in the Draft Tube Cone of a Francis Turbine. In Proceedings of the 23rd IAHR Symposium on Hydraulic Machinery and Systems (IAHR2006), October 17-21, Yokohama, Japan. Paper No. 211, pp. 1-13. (on CD)
38. Susan-Resiga R., Vu T.C., Muntean S., Ciocan G.D., Nennemann B., (2006) Jet Control of the
Habilitation thesis Sebastian Muntean, PhD
26/161
Draft Tube Vortex Rope in Francis Turbines at Partial Discharge. In Proceedings of the 23rd IAHR Symposium on Hydraulic Machinery and Systems (IAHR2006), October 17-21, Yokohama, Japan, Paper No. 192, pp.1-14. (on CD)
39. Balint D., Susan-Resiga R., Muntean S., Anton I., (2006) Numerical Simulation and Analysis of the Two-Phase Cavitating Flow in Kaplan Turbines. In Proceedings of the 23rd IAHR Symposium on Hydraulic Machinery and Systems (IAHR2006), October 17-21, Yokohama, Japan, Paper No. 216, pp.1-10. (on CD)
40. Bernad S.I., Susan-Resiga R., Muntean S., Anton I., (2006) Numerical Analysis of the Cavitating Flow Around a Hydrofoil. In Proceedings of the 23rd IAHR Symposium on Hydraulic Machinery and Systems (IAHR2006), October 17-21 2006, Yokohama, Japan, Paper No. 193, pp. 1 -10. (on CD)
41. Muntean S., Anton L.E., Campian V., Baya A., Balint D., Susan-Resiga R., (2006) Validation of Numerical Results with In-Situ Measurements for Kaplan Turbine. In Proceedings of the 6th International Conference on Innovation in Hydraulic Efficiency Measurements, July 30 – August 1, Portland, Oregon, USA. Paper D14, pp. 1-10. (on CD)
42. Susan-Resiga R., Muntean S., Anton I., Avellan F., (2006) Analysis and Control of Decelerated Turbulent Swirling Flow in Francis Turbine Draft Tube Cone. In Proceedings of the IAHR International Meeting of Work Group on Cavitation and Dynamic Problems in Hydraulic Machinery and Systems (IAHRWG2006), June 28-30, Barcelona, Spain. pp. 1-24. (on CD)
43. Balint D., Resiga R., Muntean S., (2005) Automated algorithms for computing the full 3D turbulent flows in Kaplan turbines, Proceedings of the Southeastern Europe FLUENT Event 2005, May 11-13, Porto Carras Grand Resort, Halkidiki, Greece. (on CD)
44. Balint D., Resiga R., Muntean S., (2005) Energetic and cavitational behavior of the real flows in Kaplan turbines, Proceedings of the Southeastern Europe FLUENT Event, May 11-13, Porto Carras Grand Resort, Halkidiki, Greece. (on CD)
45. Muntean S., Balint D., Susan-Resiga R., Anton I, Darzan C., (2004) 3D Flow analysis in the spiral case and distributor of a Kaplan turbine, Proceedings of the 22nd IAHR Symposium on Hydraulic Machinery and Systems (IAHR2004), June 29 – July 2, Stockholm, Sweden. Part. A, paper A10-2, pp. 1-10.
46. Muntean S., Susan-Resiga R., Bernad S., Anton I., (2004) 3D Turbulent flow analysis of the GAMM Francis turbine for variable discharge, Proceedings of the 22nd IAHR Symposium on Hydraulic Machinery and Systems (IAHR2004), June 29 – July 2, Stockholm, Sweden. Part A, paper A11-2, pp. 1-12.
47. Susan-Resiga R., Muntean S., Bernad S., Anton I., (2003) Numerical investigation of 3D cavitating flow in Francis turbines. Proceedings of the Conference on Modelling Fluid Flow (CMFF’03), September 2003, Budapest, Hungary. pp. 950-957.
48. Balint D., Susan-Resiga R., Muntean S., (2003) A Numerical Approach fot the 3D Flow in Kaplan Turbines, Proceedings of the International Conference on Case Studies in Hydraulic Systems (CSHS’03), Belgrade, Serbia. pp.29 – 36.
Patents: 3(1) 1. Muntean S., Susan-Resiga R., Bosioc A.I., Constantin S.-R., Maxim D.-I., Tănasă C., Vékás L.,
Borbath I., Anton L.E., (2016) Equipment for Mitigating the Cavitating Effects and Flow Uniformity at the Turbopump Inlet, RO131578-A0
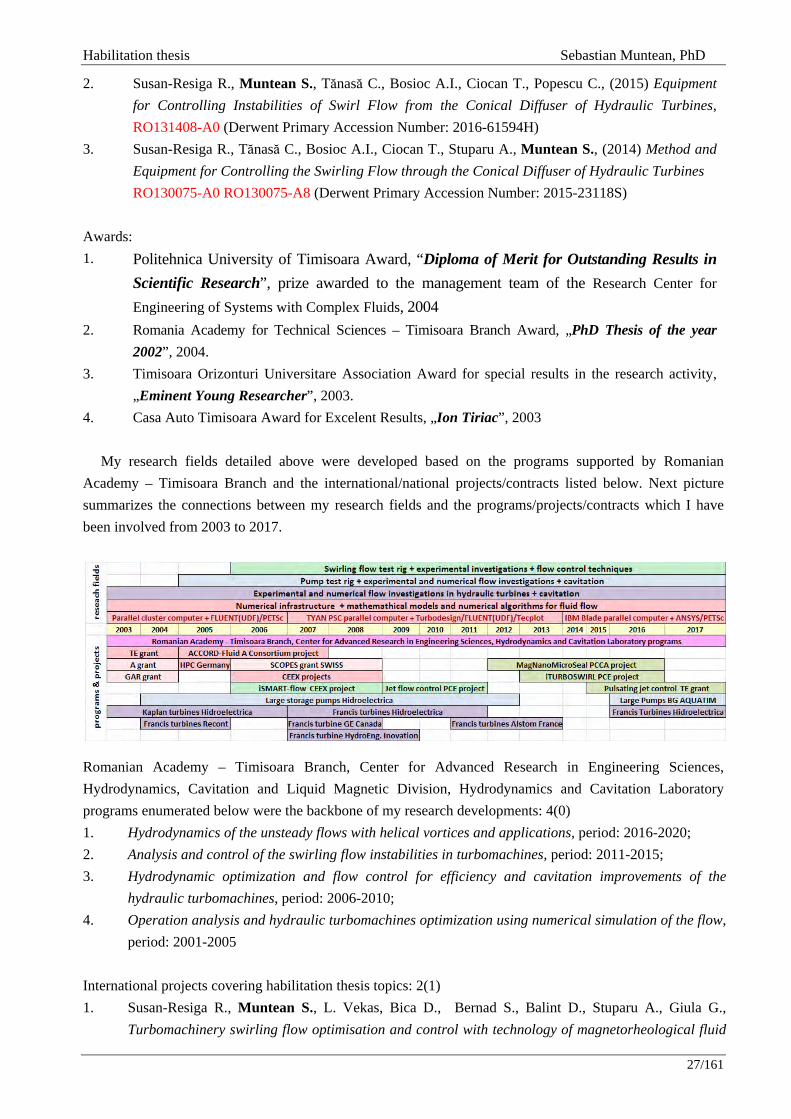
Habilitation thesis Sebastian Muntean, PhD
27/161
2. Susan-Resiga R., Muntean S., Tănasă C., Bosioc A.I., Ciocan T., Popescu C., (2015) Equipment for Controlling Instabilities of Swirl Flow from the Conical Diffuser of Hydraulic Turbines, RO131408-A0 (Derwent Primary Accession Number: 2016-61594H)
3. Susan-Resiga R., Tănasă C., Bosioc A.I., Ciocan T., Stuparu A., Muntean S., (2014) Method and Equipment for Controlling the Swirling Flow through the Conical Diffuser of Hydraulic Turbines RO130075-A0 RO130075-A8 (Derwent Primary Accession Number: 2015-23118S)
Awards: 1. Politehnica University of Timisoara Award, “Diploma of Merit for Outstanding Results in
Scientific Research”, prize awarded to the management team of the Research Center for Engineering of Systems with Complex Fluids, 2004
2. Romania Academy for Technical Sciences – Timisoara Branch Award, „PhD Thesis of the year 2002”, 2004.
3. Timisoara Orizonturi Universitare Association Award for special results in the research activity, „Eminent Young Researcher”, 2003.
4. Casa Auto Timisoara Award for Excelent Results, „Ion Tiriac”, 2003
My research fields detailed above were developed based on the programs supported by Romanian Academy – Timisoara Branch and the international/national projects/contracts listed below. Next picture summarizes the connections between my research fields and the programs/projects/contracts which I have been involved from 2003 to 2017.
Romanian Academy – Timisoara Branch, Center for Advanced Research in Engineering Sciences, Hydrodynamics, Cavitation and Liquid Magnetic Division, Hydrodynamics and Cavitation Laboratory programs enumerated below were the backbone of my research developments: 4(0) 1. Hydrodynamics of the unsteady flows with helical vortices and applications, period: 2016-2020; 2. Analysis and control of the swirling flow instabilities in turbomachines, period: 2011-2015; 3. Hydrodynamic optimization and flow control for efficiency and cavitation improvements of the
hydraulic turbomachines, period: 2006-2010; 4. Operation analysis and hydraulic turbomachines optimization using numerical simulation of the flow,
period: 2001-2005 International projects covering habilitation thesis topics: 2(1) 1. Susan-Resiga R., Muntean S., L. Vekas, Bica D., Bernad S., Balint D., Stuparu A., Giula G.,
Turbomachinery swirling flow optimisation and control with technology of magnetorheological fluid
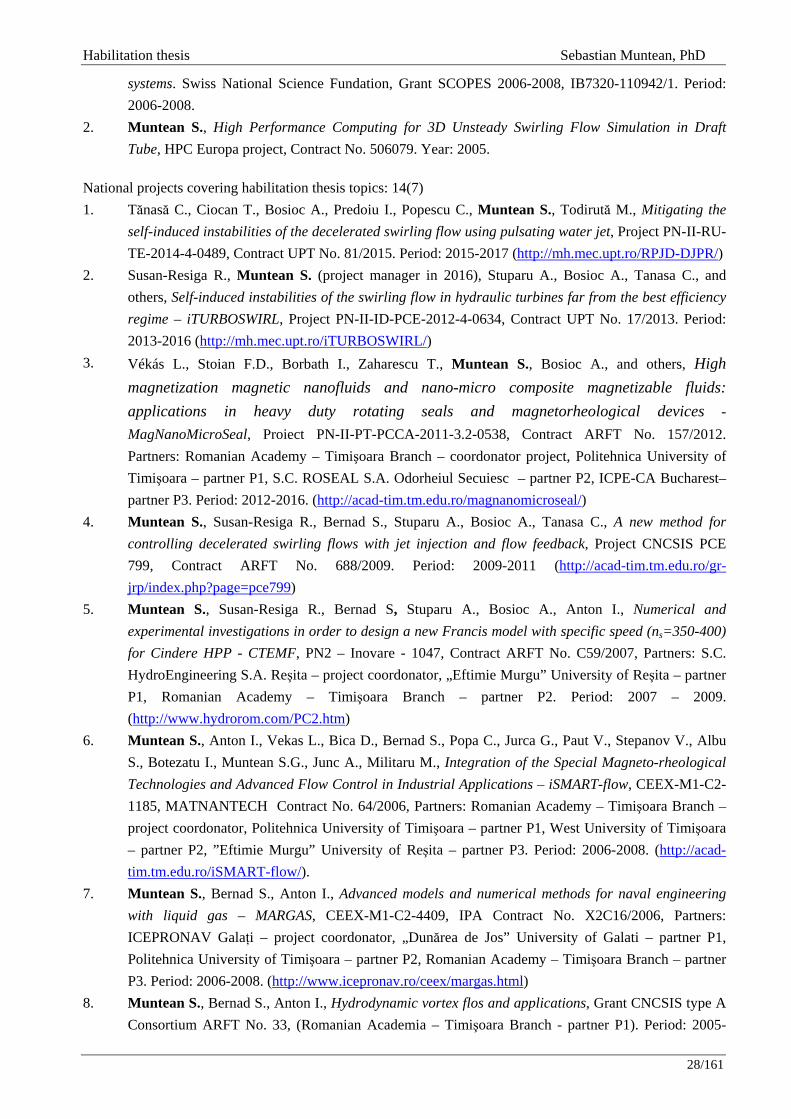
Habilitation thesis Sebastian Muntean, PhD
28/161
systems. Swiss National Science Fundation, Grant SCOPES 2006-2008, IB7320-110942/1. Period: 2006-2008.
2. Muntean S., High Performance Computing for 3D Unsteady Swirling Flow Simulation in Draft Tube, HPC Europa project, Contract No. 506079. Year: 2005.
National projects covering habilitation thesis topics: 14(7) 1. Tănasă C., Ciocan T., Bosioc A., Predoiu I., Popescu C., Muntean S., Todirută M., Mitigating the
self-induced instabilities of the decelerated swirling flow using pulsating water jet, Project PN-II-RU-TE-2014-4-0489, Contract UPT No. 81/2015. Period: 2015-2017 (http://mh.mec.upt.ro/RPJD-DJPR/)
2. Susan-Resiga R., Muntean S. (project manager in 2016), Stuparu A., Bosioc A., Tanasa C., and others, Self-induced instabilities of the swirling flow in hydraulic turbines far from the best efficiency regime – iTURBOSWIRL, Project PN-II-ID-PCE-2012-4-0634, Contract UPT No. 17/2013. Period: 2013-2016 (http://mh.mec.upt.ro/iTURBOSWIRL/)
3. Vékás L., Stoian F.D., Borbath I., Zaharescu T., Muntean S., Bosioc A., and others, High magnetization magnetic nanofluids and nano-micro composite magnetizable fluids: applications in heavy duty rotating seals and magnetorheological devices - MagNanoMicroSeal, Proiect PN-II-PT-PCCA-2011-3.2-0538, Contract ARFT No. 157/2012. Partners: Romanian Academy – Timişoara Branch – coordonator project, Politehnica University of Timişoara – partner P1, S.C. ROSEAL S.A. Odorheiul Secuiesc – partner P2, ICPE-CA Bucharest– partner P3. Period: 2012-2016. (http://acad-tim.tm.edu.ro/magnanomicroseal/)
4. Muntean S., Susan-Resiga R., Bernad S., Stuparu A., Bosioc A., Tanasa C., A new method for controlling decelerated swirling flows with jet injection and flow feedback, Project CNCSIS PCE 799, Contract ARFT No. 688/2009. Period: 2009-2011 (http://acad-tim.tm.edu.ro/gr-jrp/index.php?page=pce799)
5. Muntean S., Susan-Resiga R., Bernad S, Stuparu A., Bosioc A., Anton I., Numerical and experimental investigations in order to design a new Francis model with specific speed (ns=350-400) for Cindere HPP - CTEMF, PN2 – Inovare - 1047, Contract ARFT No. C59/2007, Partners: S.C. HydroEngineering S.A. Reşita – project coordonator, „Eftimie Murgu” University of Reşita – partner P1, Romanian Academy – Timişoara Branch – partner P2. Period: 2007 – 2009. (http://www.hydrorom.com/PC2.htm)
6. Muntean S., Anton I., Vekas L., Bica D., Bernad S., Popa C., Jurca G., Paut V., Stepanov V., Albu S., Botezatu I., Muntean S.G., Junc A., Militaru M., Integration of the Special Magneto-rheological Technologies and Advanced Flow Control in Industrial Applications – iSMART-flow, CEEX-M1-C2-1185, MATNANTECH Contract No. 64/2006, Partners: Romanian Academy – Timişoara Branch – project coordonator, Politehnica University of Timişoara – partner P1, West University of Timişoara – partner P2, ”Eftimie Murgu” University of Reşita – partner P3. Period: 2006-2008. (http://acad-tim.tm.edu.ro/iSMART-flow/).
7. Muntean S., Bernad S., Anton I., Advanced models and numerical methods for naval engineering with liquid gas – MARGAS, CEEX-M1-C2-4409, IPA Contract No. X2C16/2006, Partners: ICEPRONAV Galaţi – project coordonator, „Dunărea de Jos” University of Galati – partner P1, Politehnica University of Timişoara – partner P2, Romanian Academy – Timişoara Branch – partner P3. Period: 2006-2008. (http://www.icepronav.ro/ceex/margas.html)
8. Muntean S., Bernad S., Anton I., Hydrodynamic vortex flos and applications, Grant CNCSIS type A Consortium ARFT No. 33, (Romanian Academia – Timişoara Branch - partner P1). Period: 2005-

Habilitation thesis Sebastian Muntean, PhD
29/161
2007. (http://mh.mec.utt.ro/accord-fluid/) 9. Bernad S., Muntean S., Anton L., Baya A., Balint D., Stuparu A., Hydraulic turbines interinfluence
with rotating stabilized vertical shaft by Achard type - THARVEST, CEEX-M1-C2-2566, AMCSIT Contract No. 192/2006, Partners: Technical University of Civil Engineering Bucharest – project coordonator, Politehnica University of Bucharest – partner P1, Romanian Academia – Timişoara Branch – partner P2. Period: 2006-2008. (http://hidraulica.utcb.ro/tharvest/)
10. Resiga R, Muntean S., Bernad S., Anton L., Baya A., Balint D., Stuparu A., Hasmatuchi V., Frunză T., Hydrodynamics and mass transfer in fine bubble columns with application in environmental advanced technology - TEHNOMED, CEEX-M1-C2-2297, IPA Contract No. X2C05/2006, Partners: INCDIE ICPE-CA – project coordonator, ”Politehnica” University of Bucharest – partner P1, Technical University of Civil Engineering Bucharest – partner P2, Politehnica University of Timişoara – partner P3, S.C. National Institute of Glass S.A. – partner P4, RAGC –Târgovişte – partner P5. Period: 2006-2008.
11. Bernad S., Resiga R., Muntean S., Balint D., Frunză T., Mathematical models and numerical simulation for two phase cavitating flows with industrial and biomedical appliactions, Grant CNCSIS type A No. 730, Period: 2005-2007.
12. Muntean S., Balint D., Frunză Teodora, Stuparu A., Deatcu M., Using modern methods for numerical simulation and 3D flow analysis in hydraulic turbines with practical applications in Francis turbines and Kaplan, Grant CNCSIS type AT, (220/2003, 238/2004). Period: 2003 - 2004.
13. Anton I, Susan-Resiga R., Muntean S., Bernad S., Numerical analysis of the cavitating fluid flows in hydraulic turbines, Romanian Academy Grant (103/2004, 362/2003). Period: 2003-2004.
14. Susan-Resiga R., Sofonea V., Bernad S., Muntean S., Balint D., Frunză T., Cristea A., Broştean M., Modern Methods for Parallel Computing. Numerical Simulation of Fluid Flow with Application to Hydro-pneumatic machines and systems, Grant CNCSIS type A, (24/2004, 29/2003, 109/2002). Period: 2002-2004.
International contracts covering habilitation thesis topics: 3(0) 1. Resiga R., Muntean S., Anton A., Ciocan T., Ighisan C., Modelling the Two-Dimensional Swirling
Flow in Francis Turbines for Optimization of Draft Tube Performances within an Operating. Range. Part I: Two-Dimensional Steady Axisymmetric Swirling Flow Computation Downstream the Francis Runner, Contract UPT no. BCI 4/2012, beneficiary Alstom Hydro, Grenoble, France. Period: 2012-2013.
2. Resiga R., Muntean S., Ciocan T., Modelling and Optimization of the Swirling Flow Ingested by the Draft Tube of a Francis Turbine within an Operating Range, Contract UPT no. 1/2011, beneficiary Alstom Hydro, Grenoble, France. Period: 2011-2012.
3. Resiga R., Muntean S., Bernad S., Hasmatuchi V., Taming the Vortex Rope Project – TAVORO, Contract UPT no. 5214/19.04.2007, beneficiary General Electric Hydro Canada. Period: 2007-2008.
No. National contracts covering habilitation thesis topics: 17(8) 1. Susan-Resiga R., Baya A., Muntean S., Hopota A., and others, Specialized support services for
testing refurbished Francis turbine model type II related investment objective ”Stejaru HPP”, Contract No. 299/27.10.2016 beneficiary Hidroelectrica SA, Bistrita Subsidiary. Politehnica University of Timişoara. Period 2016-2018
2. Anton L.E., Muntean S., and others, Investigations to improve efficiency and cavitational behaviour
Habilitation thesis Sebastian Muntean, PhD
30/161
of the hydraulic pumps PRO 10-195 from Jidoaia PSP – Stage 3, Contract No. 175/30.12.2010 beneficiary Hidroelectrica SA, Râmnicu Vâlcea Subsidiary. Partners: Politehnica University of Timişoara – project coordonator, Romanian Academy – Timişoara Branch – partner P1. Period 2011-2012
3. Baya A., Muntean S., and others, Investigations to improve the efficiency and cavitational behaviour of the Francis turbines 57.5 – 128.5 from Bradişor HPP - Stage 3, Contract No. 174/30.12.2010, beneficiary Hidroelectrica SA, Râmnicu Vâlcea Subsidiary. Partners: Politehnica University of Timişoara – project coordonator, Romanian Academy – Timişoara Branch – partner P1. Year 2011
4. Anton L.E., Muntean S., and others, Investigations to improve efficiency and cavitational behaviour of the hydraulic pumps PRO 10-195 from Jidoaia PSP – Stage 2, Contract Nr. 72-113.03/05.11.2009 (UPT BC119/2009) beneficiary Hidroelectrica SA, Râmnicu Vâlcea Subsidiary. Partners: Politehnica University of Timişoara – project coordonator, Romanian Academy – Timişoara Branch – partner P1. Year 2009
5. Baya A., Muntean S., and others, Investigations to improve the efficiency and cavitational behaviour of the Francis turbines 57.5 – 128.5 from Bradişor HPP - Stage 2, Contract No. 71-113.03/05.11.2009 (UPT BC 120/2009) beneficiary Hidroelectrica SA, Râmnicu Vâlcea Subsidiary. Partners: Politehnica University of Timişoara – project coordonator, Romanian Academia – Timişoara Branch – partner P1. Year 2009
6. Anton L.E., Muntean S., and others, Investigations to improve efficiency and cavitational behaviour of the hydraulic pumps PRO 10-195 from Jidoaia PSP – Stage 1, Contract No. 97-113.03/16.10.2008, beneficiary Hidroelectrica SA, Râmnicu Vâlcea Subsidiary. Partners: Politehnica University of Timişoara – project coordonator, Romanian Academia – Timişoara Branch – partner P1. Year 2008
7. Baya A., Muntean S., and others, Investigations to improve the efficiency and cavitational behaviour of the Francis turbines 57.5 – 128.5 from Bradişor HPP - Stage 1, Contract No. 96-113.03/16.10.2008, beneficiary Hidroelectrica SA, Râmnicu Vâlcea Subsidiary. Partners: Politehnica University of Timişoara – project coordonator, Romanian Academia – Timişoara Branch – partner P1, ”Eftimie Murgu” University of Reşita – partner P2, S.C. HydroEngineering S.A. Reşita - partner P3. Year 2008
8. Muntean S., Bernad S., Resiga R., Stuparu A., Bosioc A., Baya A., Anton L., Anton I., Numerical analysis of flow in the hydraulic passage of the Francis turbines from Munteni HPP to determine the hydraulic load on the runner blades at the most frequently operated points, Contract ARFT no. 9875/30.11.2007 beneficiary Hidroelectrica S.A., Cluj Subsidiary. Year 2007.
9. Muntean S., Campian V., Nedelcu D., Liuba G., Cuzmos A., Dumbrava C., Anton I., Measurement of pressure pulsations in the draft tube cone of the Francis turbines from Turnu-Ruieni HPP, Contract ARFT no. 58/04.10.2007 beneficiary S.C Hidroelectrica S.A., Caransebeş Subsidiary. Year 2007
10. Muntean S., Campian V., Nedelcu D., Grando I., Liuba G., Cuzmos A., Dumbrava C., Anton I., Measurement of pressure pulsations in the draft tube cone of the Francis turbines from Munteni HPP, Contract ARFT no. 5007/27.06.2007 beneficiary S.C Hidroelectrica S.A., Cluj Subsidiary. Year 2007.
11. Muntean S., Bernad S., Barbat T., Junc C., Anton I., Studies on the behavior of the hydropower equipment and its in situ operation, Contract UPT no. 120-12.02/24.08.2007, beneficiary S.C. Hidroelectrica S.A., Râmnicu Vâlcea Subsidiary. Partners: Politehnica University of Timişoara – project coordonator, Romanian Academy – Timişoara Branch – partner P1, Technical University of
Habilitation thesis Sebastian Muntean, PhD
31/161
Civil Engineering, Bucharest – partner P2, S.C. HydroEngineering S.A Reşita – subcontractant. Year 2007
12. Susan-Resiga R., Muntean S., Balint D., Numerical simulation of the water flow through the refurbished Kaplan turbine runner of Iron Gates I HPP to determine the pressure distribution on blades at two operating points, Contract UPT no. 380/20.12.2005, beneficiary „Eftimie Murgu” University of Reşita, CCHAPT. Period 2005-2006.
13. Muntean S., Resiga R., Bernad S., Balint D., Baya A., Determination of the discharge through the hydraulic turbine passage of the Gura Lotrului, Turnu and Dăieşti HPPs, Contract ARFT no. 164-12.02/05.08.2004, beneficiary Hidroelectrica SA, Râmnicu Vâlcea Subsidiary. Partners: Romanian Academy –Timişoara Branch – project coordinator, Politehnica University of Timişoara – partner P1, ”Eftimie Murgu” University of Reşita – partner P2. Year 2004
14. Muntean S., Balint D., Bernad S., Susan-Resiga R., Anton I., CFD analysis at the best efficiency point of the Francis turbine with specific speed of 285=kW
sn . Contract UPT no. 54/16.04.2004,
beneficiary S.C. RECONT S.A. Year 2004 15. Anton L.E., Anton A., Biriescu M., Muntean S., and others, Determination of the hydrounits
characteristics in operation at Petrimanu, Jidoaia and Lotru Aval PSP, Contract UPT no. 87-12.02/04.05.2004, beneficiary Hidroelectrica SA, Râmnicu Vâlcea Subsidiary. Partners: Politehnica University of Timişoara – project coordonator, Technical University of Civil Engineering Bucharest – partner P1, Romanian Academy – Timişoara Branch – partner P2. Period 2004-2006
16. Muntean S., Balint D., Bernad S., Susan-Resiga R., Anton I., Determining the geometrical position of the stay vanes of the Kaplan turbines from Zăvideni HPP to optimize water flow through it, Contract ARFT no. 90-12.02/05.05.2004, beneficiary Hidroelectrica SA, Râmnicu Vâlcea Subsidiary. Year 2004
17. Muntean S., Balint D., Frunza T., Stuparu A., Deatcu M., Anton I., Susan-Resiga R., Numerical analysis of two geometrical positions of the stay vanes and its influence on the hydrodynamic field at the inlet of the Kaplan turbine runner from Drăgăşăni HPP, Contract ARFT no. 23-77.03-146/09.04.2003, beneficiary Hidroelectrica SA, Râmnicu Vâlcea Subsidiary. Year 2003
A synopsis view of the projects and contracts in the field of my habilitation thesis during 2003 - 2017 is
included in the following table: No. Type Total no. (manager/partner responsible) 1 Programs National 4 (0) 2. Projects National 14 (7)
International 2 (1) 3. Contracts National 17 (8)
International 3 (0)
I extended my scientific knowledge participating to the international course entitled “Fluid Dynamics and Cavitating Turbopumps” organized by CISM International Center for Mechanical Sciences, Udine, Italy during July 25 – 29, 2005.
Habilitation thesis Sebastian Muntean, PhD
32/161
i.3 Professional and academic achievements My professional achievements are listed below (after I defended my PhD theses in 2002):
Since 2002: Senior Researcher, Politehnica University of Timişoara, Research Center for Engineering of Systems with Complex Fluids (http://mh.mec.upt.ro/), Numerical Simulation and Parallel Computing Laboratory, Timişoara;
Since 2008: Senior Researcher (1st degree), Romanian Academy – Timisoara Branch, Center of Advanced Research in Engineering Sciences (http://acad-tim.tm.edu.ro/cctfa/), Hydrodynamics and Cavitation Laboratory, Timişoara;
2002 – 2008: Senior Researcher (2nd degree) Romanian Academy – Timisoara Branch, Center of Advanced Research in Engineering Sciences (http://acad-tim.tm.edu.ro/cctfa/), Hydrodynamics and Cavitation Laboratory, Timişoara;
I have been involved in developing the high parallel computing (HPC) infrastructure at Research Center for System Engineering with Complex Fluids (RCSECF) from Politehnica University of Timisoara together with Prof. R. Susan-Resiga and Dr. S. Bernad since 2000. Firstly, I have installed and used the commercial code FLUENT V5.1 (with parallel license) on a parallel computer with distributed memory (computer cluster). The domain decomposition techniques for parallel computing algorithms and the numerical results obtained using parallel computing were published to several national and international conferences. The most significant numerical results were included in the book entitled “Modern Methods for Parallel Computing in Fluid Flow Simulation” published together with my colleagues Prof. R. Susan-Resiga, Dr. S. Bernad, D. Balint and I. Balint in 2003.
Next, I have extended my knowledge in HPC field during 25 January – 31 March 2005 at Institute of Fluid Mechanics and Hydraulic Machinery (IHS) from Stuttgart University in the project “High Performance Computing for 3D Unsteady Swirling Flow Simulation in Draft Tube”, HPC-Europa Project No. 506079 under supervision of Dr. Albert Ruprecht, vice-director IHS and head of Fluid Mechanics Group.
High Performance Computing (HPC) is a key ingredient to compute the three-dimensional complex fluid flows. Therefore, a parallel computer with common memory (TYAN Personal SuperComputer) was installed during 2007 at RCSECF-UPT together with commercial code FLUENT V6.3 with parallel license. An IBM Blade parallel supercomputer is available since 2015 with new ANSYS/FLUENT V16.2 and TECPLOT 360. All these developments are directly connected with new ideas and new technical solutions explored in our group. I have contributed to these developments in my position as head of the Numerical Simulation and Parallel Computing Laboratory from NCSECF-UPT since 2001.
I have extended the flow analysis platform detailed above with design capability by purchasing the Turbodesign-1 software in 2007. This software is dedicated to turbomachinery blade design using inverse method. The output files generated with Turbodesign-1 software are ingested by G/Turbo module part of the Gambit preprocessor. Once that the geometry and mesh are generated in Gambit would be exported to FLUENT software to numerically asses it performances. In this way, I have developed a numerical platform for turbomachinery design and flow analysis being used by a few doctoral students (e.g. Dr. G. Gînga, Dr. G. Moisă) and postdoctoral researchers (e.g. Dr. T. Ciocan) in their investigations. Also, I have used this platform to design together Prof. R. Susan-Resiga the blade geometries of the swirl generator and to numerically analyse the swirling flow in the test section.
The swirling flow test rig was developed by our group within the iSMART-flow project starting with 2006 to investigate the flow physics and testing new control techniques (e.g. axial water jet control, flow-feedback control (FF), additional flow-feedback control (FF+), pulsating jet control, adjustable diaphragm control and variable speed control using a magneto-rheological fluid). The swirling flow case developed by

Habilitation thesis Sebastian Muntean, PhD
33/161
our group was used by several groups (e.g. Sweden, Japan, Germany, Czech Republic) to validate their numerical results. As a result, our swirling flow case called “Timişoara Swirl Generator” was selected as test case for 5th OpenFOAM Workshop, Goetenburg, Sweden in 2010 by Turbomachinery Special Interest Group (TSIG) (https://www.openfoamwiki.net/index.php/Sig_Turbomachinery_/ _Timisoara_Swirl_Generator). Next, our swirling flow case entitled “Swirling flow in a conical diffuser generated with rotor-stator interaction” was selected as ERCOFTAC QNET - CFD test case AC6-14, Application Area 6: Turbomachinery Internal Flow in 2016 (http://qnet-ercoftac.cfms.org.uk/w/index.php/Related_UFRs_AC6-14). The ERCOFTAC test case includes the rotor and stator geometries designed together with Prof. R. Susan-Resiga using Turbodesign-1 software. A Laser Doppler Velocimetry (LDV) system was purchased in the project to deeply investigate the flow field. As a result, a comprehensive experimental investigation was carried out by Dr. A. Bosioc who clearly showed the capability of the axial water injection approach to successfully mitigate the swirl instabilities in a conical diffuser. The LDV measurements for the velocity field, coupled with the unsteady pressure measurements at the wall, clarified the physical mechanism for instability mitigation by eliminating the central quasi-stagnant region and the associated vortex sheet at the boundary with the flow confined in an annular section up to the wall. However, it is found that a complete removal of the instability requires the jet discharge to reach a rather large threshold value (about 10% of the main flow discharge). From practical applications, this is an unacceptable large value, particularly when the jet is supplied with water which bypasses the runner, thus introducing a large volumetric loss. As a result, Dr. C. Tănasă has designed and tested a novel flow-feedback method for supplying the control jet with water from downstream the runner, thus eliminating the above drawback. The axial water injection, flow-feedback (FF) and additional flow-feedback (FF+) techniques were successfully investigated in the project PCE No. 799 entiled “A new method for controlling decelerated swirling flows with jet injection and flow feedback”. Moreover, an innovative control technique with water pulsating jet is under testing by our group using upgraded swirling flow test rig in the project managed by Dr. C. Tănasă since 2016. I was involved in this project in the position of scientific consultant being in charge to support the young research team. This new technique is included within the national patent number RO131408-A0.
Also, a passive control technique for swirling flows encountered in the hydraulic turbines was developed and tested by our group using an adjustable diaphragm. This new idea is included within the national patent number RO130075-A0.
I have developed and tested together with Dr. A. Bosioc a new control technique in MagNanoMicroSeal project managed by Dr. L. Vékás, member of the Romanian Academy. This new control technique is slowing down the runner/inducer speed adjusting the circumferential flux of moment of momentum in the swirling flows. The speed is controlled modifying the apparent viscosity of a magneto-rhehological fluid produced by the group coordinated by Dr. L. Vékás, member of the Romanian Academy. In one case, the runner speed of the swirl generator is slow down to diminish the circumferential flux of moment of momentum in decelared swirling flows. Consequently, the self-induced instabilities generated within the swirling flows and its effects are mitigated. In other case, the inducer speed is adjusted to improve the cavitational behavior at the pump impeller with constant speed. This new idea is included within the national patent number RO131578-A0 being developed and tested in a research project managed by Dr. A. Bosioc. Both magneto-rheological solutions were implemented with a valuable support from I. Borbáth, general manager of ROSEAL S.A. Odorheiul Secuiesc and his team.
The pump test rig was developed by our group starting 2009 in order to investigate the hydrodynamics based on previous experience in this field. This test rig was manufactured and installed with valuable support
Habilitation thesis Sebastian Muntean, PhD
34/161
from Dr. L. Stoia, general manager of Sangari Engineering SRL and his team. I was involved in all stages in my position of scientific responsible of the project. The deep investigations of the hydrodynamics corresponding to the storage pumps available in Lotru hydropower site (e.g. Jidoaia PS and Petrimanu PS) was the first goal of the project coordinated by Prof. L.E. Anton and supported by Hidroelectrica S.A. Râmincu Vâlcea to find technical solutions for the rehabilitation stage. As a result, a model impeller (1:5.7) being half of the double flux impeller installed in Jidoaia pumping station was manufactured and tested to assess its performances. A suction elbow model (1:5.7) was designed by Dr. A. Bosioc together with me allowing LDV measurements at the impeller inlet. Dr. G. Gînga was designed a new impeller using TurboDesign-1 together with me. Also, an axial rotor was designed by Dr. I.G. Moisă together with me and Prof. R. Susan-Resiga using TurboDesign-1 to improve the cavitational behavior of both impellers. Both impeller geometries were installed and tested on new test rig with and without axial rotor at speed of 3000 rpm by Dr. G. Gînga. I have worked together with Dr. I. Drăghici and Dr. A. Bosioc to investigate the velocity field at the pump impeller using LDV system. Also, I have contributed to the investigations performed by Dr. I. Drăghici to assess the unsteadiness level at the pump inlet for variable speed values.
I have coordinated and I have participated as member in several projects with industrial partners which were focused on hydraulic turbines. In almost all those projects my principal partner was Prof. A. Baya from Politehnica University of Timişoara. Firstly, I have focused on numerical investigations of the prototype hydraulic turbines (e.g. Bradişor HPP, Munteni HPP, Zăvideni HPP) to investigate its hydrodynamics in order to assses the efficiency and cavitational behavior. Next, I have extended my numerical investigations to unsteady behavior of the hydraulic turbines on a wide operating range. These investigations were developed in partnership with several subsidiaries of Hidroelectrica S.A. (e.g. Râmnicu Vâlcea, Cluj, Portile de Fier, Bistrita) and with technical support of HydroEngineering S.A. and UCM Reşita. Also, I have participated to in situ experimental investigations performed on several hydrounits by team coordinated Prof. V. Câmpian from “Eftimie Murgu” University from Reşita. The experimental data were used to assess the operation of hydrounits and to validate numerical results against its.
I have been part of the national network in the fluid engineering developed since 2005. The ACademic COnsortium for Research and Development in Fluid engineering (ACCORD-FluiD) project was an enthusiastic period during 2005 - 2007 with 8 partners: Politehnica University of Timişoara; Romanian Academy - Timişoara Branch;”Politehnica” University of Bucharest; Technical University of Civil Engineering Bucharest; ”Dunărea de Jos” University of Galati; Technical University of Cluj-Napoca; ”Gheorghe Asachi” Technical University of Iaşi and ”Eftimie Murgu” University of Reşita. A workshop was organized every year with participation of members of the groups involved in the project that were thus able to know each other and to understand the work of the partners in the consortium. At the end of the project a book entitled “Vortex dominated flows” was published with contributions from members of each group involved in the project. The fourth workshop was organized by ACCORD-FluiD community in 2008 at Bucharest bringing together all partners. This framework was crucial for partnerships to be successful in the next national and international competitions. For instance, several collaborative projects were earned together by teams of the ACCORD-FluiD community during CEEX competitions.
I have organized the training course entitled “Numerical Methods in Fluid Dynamics and FLUENT applications” at Politehnica University of Timisoara during September 18-23, 2006. The course program was included the following topics with hands-on laboratories.
Habilitation thesis Sebastian Muntean, PhD
35/161
18th September Fluid dynamic basics and numerical methods
Prof. S. Dănăilă “Politehnica” University of Bucharest
19th September Computational domain reconstruction methods and spatial
discretization techniques
Prof. A. Lungu Assoc.Prof. M. Amorăritei
”Dunărea de Jos” University of Galaţi 20th September Modelling of the complex fluid
flows at small Reynolds numbers Prof. C. Bălan
Assoc.Prof. D. Broboană “Politehnica” University of Bucharest
21th September Turbulence models and its implementation in FLUENT
commercial code
Prof. S. Dănăilă Assoc.Prof. M. Stoia
“Politehnica” University of Bucharest 22th September Modelling of the two phase flows.
Introduction in the parallel computing.
Prof. R. Susan-Resiga Dr. S. Bernad, Senior Researcher
Politehnica University of Timişoara 23th September Modelling of the fluid flows
around hydrofoils and turbomachinery blades
Dr. S. Muntean, Senior Researcher Assist.Prof. D. Balint
Romanian Academy - Timişoara Branch
The training course was attanded by 30 researchers, postdoctoral researchers and PhD students from following institutions: 5 persons – “Politehnica” University of Bucharest, Aeronautics Department; 6 persons – “Politehnica” University of Bucharest, Energy Department; 4 persons –Technical University of Civil Engineering from Bucharest; 5 persons – ”Dunărea de Jos” University of Galaţi; 3 persons – Technical University of Cluj; 5 persons – Politehnica University of Timişoara and 2 persons – Romanian Academy – Timişoara Branch.
Next, I was involved during 2012-2013 as expert in the national education project entitled “Fluids Engineering Information Platform” (PiiF, www.piif.ro) coordinated by Prof. Anton Anton from Technical University of Civil Engineering Bucharest (UTCB) for improving actual courses content and learning environment using suitable teaching technologies related to fluid engineering (for mechanical engineers, civil engineers, naval engineers, chemical engineers). This project has brought again the ACCORD-FluiD community in order to build up a web based platform to be used, by students as well as by teachers, in the study of fluid engineering. The web platform was organised around the main idea “basic concepts + correct scientific logic = solving applications”. In this project, I prepared and posted online several materials (e.g. basic concepts, interactive applications, movies, images). Also, I participated at 2 Summer Schools (Timişoara and Cluj-Napoca) and 1 Project Meeting (Galati) together with the students and the academic staff of the partner.
Also, I have participated at three meetings with diaspora. These meetings were debated several scientific, technical, administrative and managerial issues linked with requirements and tendencies of our community. These events are enumerated below:
17-18 September 2008, Technical University of Civil Engineering Bucharest Workshop: Actuality and Perspective in Fluid Science and Engineering (http://vechi.diaspora-stiintifica.ro/diaspora2008/docs/prog_prelim/program_preliminar_WE22.pdf) Chairman: Prof. Lucian Sandu, Technical University of Civil Engineering Bucharest Co-chairmen: Prof. Romeo Susan-Resiga, Politehnica University of Timisoara and Prof. Paul G.A. Cizmas, Texas A & M University Rapporteur: Dr. Sebastian Muntean, Romanian Academy – Timişoara Branch Number of participants: 33
26-27 September 2012, Technical University of Civil Engineering Bucharest Workshop: Synergy of research and education in fluid engineering
Habilitation thesis Sebastian Muntean, PhD
36/161
(http://vechi.diaspora-stiintifica.ro/diaspora2012/index.php?page=programe-workshop&id=10) Chairman: Prof. Anton Anton, Technical University of Civil Engineering Bucharest Co-chairman: Dr. Gabriel Dan Ciocan, ALSTOM Power Hydro Number of participants: 41
25-28 April 2016, Politehnica University of Timişoara Workshop: Renewable Energies (http://www.diaspora-stiintifica.ro/we-actualitate-si-perspectiva-in-domeniul-energiilor-regenerabile/) Chairman: Prof. Ion Boldea, member of the Romanian Academy, Politehnica University of Timişoara; Co-chairmen: Dr. Gabriel Dan Ciocan, GE Renewable Energy and Laval University, Canada and Dr. Sebastian Muntean, Politehnica University of Timişoara; Number of participants: 48
I have been chairman of the 7th IAHR Meeting of the Working Group on Cavitation and Dynamic Problems, 1st February 2017, Porto, Portugal. (http://mh.mec.upt.ro/iahrwg2017/home.html)
I have contributed as member of the scientific committee at the following conferences: • 8th International Conference on Energy and Environment (CIEM2017), October 19-20, 2017,
Bucharest, Romania (http://ciem2017.energ.pub.ro/committees.html); • 19th International Seminar on Hydropower Plants, “Flexible Operation of Hydropower Plants in
the Energy System”, November 9-11, 2016, Vienna, Austria (http://www.viennahydro.com/program-2/#_committee);
• 7th International Conference on Energy and Environment (CIEM2015), October 22-23, 2015, Iaşi, Romania (http://ciem2015.energ.pub.ro/committees.html);
• 6th International Conference on Energy and Environment (CIEM2013), November 7-8, 2013, Bucharest, Romania (http://ciem2013.energ.pub.ro/committees.html);
I have contributed as member of the organizing committee at the following events: o 9th German-Romanian Workshop on Turbomachinery Hydrodynamics, 16-18 July 2013,
Timişoara; o 7th German-Romanian Workshop on Turbomachinery Hydrodynamics, 26-28 May 2011,
Timişoara (http://mh.mec.upt.ro/Index.aspx?p=Conference7Growth); o 25th IAHR Symposium on Hydraulic Machinery and Systems, 20-24 September 2010,
Timişoara (http://acad-tim.tm.edu.ro/iahr2010/); o 5th German-Romanian Workshop on Turbomachinery Hydrodynamics, 2-4 July 2009,
Timişoara (http://mh.mec.upt.ro/Index.aspx?p=Conference5Growth); o 2nd IAHR International Meeting of the Workgroup on Cavitation and Dynamic Problems in
Hydraulic Machinery and Systems, 24-26 October 2007, Timişoara. (http://mh.mec.upt.ro/iahr2007/)
o 3rd German-Romanian Workshop on Turbomachinery Hydrodynamics, 10-12 May 2007, Timişoara (http://acad-tim.tm.edu.ro/iSMART-flow/pdf/GRW2007Program.pdf)
o 3rd Workshop on Vortex Dominated Flows. Achievements and Open Problems, 1 - 2 June 2007, Timişoara;
o 2nd Workshop on Vortex Dominated Flows Achievements and Open Problems, 30 June – 1 July 2006, Bucharest;
Habilitation thesis Sebastian Muntean, PhD
37/161
o 1st German-Romanian Workshop on Turbomachinery Hydrodynamics, 24-26 November 2005, Timişoara (http://mh.mec.upt.ro/Index.aspx?p=Conference1Growth);
o 1st Workshop on Vortex Dominated Flows Achievements and Open Problems, 10-11 June 2005, Timişoara;
o 6th International Conference on Hydraulic Machinery and Hydrodynamics, 21-22 October 2004, Timişoara;
o Workshop on Numerical Methods in Fluid Mechanics and FLUENT Applications, 22-23 May 2003, Timişoara.
o 8th International Conference on Magnetic Fluids (ICMF8), 29 June - 3 July 1998, Timişoara. I have contributed as reviewer at the following journals:
• Energies (since 2017); http://www.mdpi.com/journal/energies • Chemical Engineering Communications (since 2017);
http://www.tandfonline.com/toc/gcec20/current • Advanced in Mechanical Engineering (since 2016);
https://us.sagepub.com/en-us/nam/journal/advances-mechanical-engineering • ASME Journal of Fluids Engineering (since 2016);
http://fluidsengineering.asmedigitalcollection.asme.org/journal.aspx • Engineering Computations (since 2015); http://www.emeraldinsight.com/loi/ec • International Journal on Fluid Machinery and Systems (since 2014);
https://www.jstage.jst.go.jp/browse/ijfms • Applied Energy (since 2013); https://www.journals.elsevier.com/applied-energy/ • Canadian Journal of Physics (since 2013); http://www.nrcresearchpress.com/journal/cjp • Journal of Zhejiang University – Science A (since 2013);
https://link.springer.com/journal/11582 • Proceedings of the Romanian Academy Series A: Mathematics, Physics, Technical Sciences,
Information Sciences (since 2013); http://www.acad.ro/proceedings.htm • Journal of Hydraulic Research (since 2012) http://www.tandfonline.com/loi/tjhr20.
My participation to the events (workshops, symposia, conferences) organized by International Association on Hydraulic Research (IAHR), Section: Hydraulic Machinery and Systems (https://www.iahr.org/site/cms/contentviewarticle.asp?article=648) is a priority. The IAHR Section on Hydraulic Machinery and Systems is the community dealing with the advancement of technology associated with the understanding of steady and unsteady flow characteristics in hydraulic machinery and conduit systems connected to the machinery. The technology elements include the fluid behaviour within machine components, hydro behaviour of machine components, cavitation, and two phase flow in turbines and pumps and hydraulic machine and plant control systems. I have participated to the following 14 events organized by International Association on Hydraulic Research, Section: Hydraulic Machinery and Systems during 2002 - 2017: (i) Symposia on Hydraulic Machinery and Systems
• 28th IAHR Symposium on Hydraulic Machinery and Systems, 4-8 July 2016, Grenoble, France (http://www.iahrgrenoble2016.org/);
• 27th IAHR Symposium on Hydraulic Machinery and Systems, 22-26 September 2014, Montréal, Canada (http://iopscience.iop.org/article/10.1088/1755-1315/22/0/001001/meta);
• 26th IAHR Symposium on Hydraulic Machinery and Systems, 19-23 August 2012, Beijing, China (http://iopscience.iop.org/article/10.1088/1755-1315/22/0/001001/meta);
Habilitation thesis Sebastian Muntean, PhD
38/161
• 25th IAHR Symposium on Hydraulic Machinery and Systems, 20-24 September 2010, Timişoara, Romania (http://iopscience.iop.org/issue/1755-1315/12/1);
• 24th IAHR Symposium on Hydraulic Machinery and Systems, 27-31 October 2008, Foz do Iguassu, Brazil;
• 23rd IAHR Symposium on Hydraulic Machinery and Systems, 17-21 October 2006, Yokohama, Japan;
• 22nd IAHR Symposium on Hydraulic Machinery and Systems, 29 June – 2 July 2004. Stockholm, Sweden;
• 21st IAHR Symposium on Hydraulic Machinery and Systems, 9-12 September 2002, Lausanne, Switzerland.
(ii) International Workshops on Cavitation and Dynamic Problems in Hydraulic Machinery • 7th IAHR International Workshop on Cavitation and Dynamic Problems in Hydraulic Machinery, 1
February 2017, Porto, Portugal (http://mh.mec.upt.ro/iahrwg2017/); • 6th IAHR International Workshop on Cavitation and Dynamic Problems in Hydraulic Machinery, 9-
11 September 2015, Ljubljana, Slovenia (http://iahrwg2015.si/en/); • 5th IAHR International Workshop on Cavitation and Dynamic Problems in Hydraulic Machinery, 8-
11 September 2013, Lausanne, Switzerland (http://lmh.epfl.ch/iahrworkshop2013); • 4th IAHR International Workshop on Cavitation and Dynamic Problems in Hydraulic Machinery,
26-28 October 2011, Belgrade, Serbia; • 3rd IAHR International Workshop on Cavitation and Dynamic Problems in Hydraulic Machinery,
14-16 October 2009, Brno, Czech Republic; • 2nd IAHR International Workshop on Cavitation and Dynamic Problems in Hydraulic Machinery,
24-26 October 2007, Timişoara, Romania (http://mh.mec.upt.ro/iahr2007/); I have contributed as member of the organizing committee at two IAHR events (2007, 2010), chaiman of
the IAHR workshop (2017) and chairman of one technical session at several IAHR events (2010, 2014, 2015, 2016).
I have participated to the events mentioned above as well as to next meetings: • 19th International Conference on Hydropower Plants, 9 – 11 November 2016, Vienna, Austria;
(http://www.viennahydro.com/) • 1st International Conference on Materials Design and Applications (MDA2016), 30 June – 1 July
2016, Porto, Portugal; (https://paginas.fe.up.pt/~mda2016/) • XIV World Renewable Energy Congress (WREC2015), 8-12 June 2015, Bucharest, Romania;
(http://www.wrec.ro/) • 18th International Conference on Hydropower Plants, 9 – 11 November 2014, Vienna, Austria;
(http://archiv.viennahydro.com/2014/) • 5th International Conference on Energy and Environment (CIEM2011), 3 – 4 November 2011,
Bucharest, Romania; (http://ciem2011.energ.pub.ro/) • Conference on Modelling Fluid Flow (CMFF’09), 9-12 September 2009, Budapest, Hungary; • 4th International Conference on Energy and Environment (CIEM2009), 12-14 Noiembrie 2009,
Bucharest, Romania; • 4th International Symposium Fluid Machinery and Fluid Mechanics (ISFMFE2008), 24- 27
November 2008, Beijing, China; • International Conference on Hydraulic Machinery and Equipments (HME2008), 16-17 October
2008, Timisoara, Romania;
Habilitation thesis Sebastian Muntean, PhD
39/161
• 3th International Conference on Energy and Environment (CIEM2007), 22-23 November 2007, Bucharest, Romania;
• Conference on Modelling Fluid Flow (CMFF’06), 6-9 September 2006, Budapest, Hungary; • Conference on Modelling Fluid Flow (CMFF’03), 3-6 September 2003, Budapest, Hungary; I have had a continuing concern to develop and strengthen partnerships with the industrial environment
to find new solutions to the problems encountered in reality. This partnership has unfolded on several levels: - colaborative projects with industrial partners to investigate solutions for the problems encountered in
reality; - contracts with industrial partners to solve its problems and/or to provide them with assistance; - organizing events together with industrial partners in order to define the framework of the
partnership and/or to debate the results; - inviting industrial partners to participate in scientific events at national and international level to
detail their issues; - visiting industrial objectives with my colleagues to identify in situ problems and to understand the
constrains associated to each problem. I would like to remind following two events with industrial partners organized as chairman: 4th national conference “Engineering education. The chalanges for the XXI century”
(www.creding.ro/doc/CREDING2015_Program_rev09.pdf), 14-15 May 2015 organized at Timişoara by Romanian Coalition for Engineering Education CREDING (www.creding.ro), Timişoara Branch. More than 60 persons from Timişoara, Bucharest, Cluj-Napoca, Iaşi, Piteşti, Braşov, Arad, Satu Mare, Reşita were participated at this event. This event brought together experts from universities, research institutes and industry to debate issues and challenges in engineering long term education. An important contribution had the leading companies in engineering in western part of Romania (e.g. Continental SRL, Hella SRL, Saguaro Technology SRL, ELBA SA, AQUATIM SA Timişoara, Lasting SRL, Dosetimpex SRL);
Workshop entitled “Actual problems regarding the operation and refurbishment of hydrounits in Romania” part of the Timişoara Academic Days (11th Edition) organized during 23-24 July 2009 at Timişoara. At this event has participated several subsidiaries of Hidroelectrica (Romanian Hydropower Company) and AQUATIM SA Timişoara.
It is well known that each hydropower plant and storage power plant is unique. I have visited the following hydraulic machinery laboratories, hydropower plants and pumping plants all around the world:
• 2017 Venta Nova II PSP and Venta Nova III PSP, Portugal • 2016 Turboinštitut, Ljubljana, Slovenia • 2015 Sareş PSP, Romania • 2014 Cluj-Napoca Water Supply Pumping Station, Romania • 2014 Beauharnois HPP, Canada • 2014 IREQ, Hydro Quebec, Varennes, Canada • 2014 Glems PSP, Germany • 2013, 2014 Râul Mare – Retezat HPP, Romania • 2013 Bieudron HPP, Elvetia (the hydropower plant with largest head in the world) • 2013 Stejaru HPP, Romania • 2012 Timişoara’s Water Supply Pumping Station, Romania • 2012, 2016, 2017 Timişoara’s WasteWater Treatment Station, Romania
Habilitation thesis Sebastian Muntean, PhD
40/161
• 2012, 2013, 2016 Alstom Hydro, Grenoble, France • 2012 Three Gorges HPP, China (the hydropower plant with largest installed power in the world) • 2012 Constance PSP, Germany • 2011 Bajina Basta HPP and PSP, Serbia • 2010, 2011 Lotru – Ciunget HPP, Romania • 2010 Sadu IV HPP, Sinaia, Romania • 2010 Andritz Hydro, Ravensburg, Germany • 2009 Dalešice HPP, Czech Republic • 2009 Zerveşti HPP, Romania • 2009 Mălaia HPP, Romania • 2008 Itaipu HPP, Brazil (the hydropower plant with the second largest installed power in the world) • 2008 Voith Hydro, Heidenheim, Germany • 2008 Munteni HPP, Romania • 2007 Marişelu HPP, Romania • 2007, 2008, 2009 HydroEngineering , Reşita, Romania • 2007 Aleşd HPP, Romania • 2007, 2009 Brădişor HPP, Romania • 2007, 2008 Turnu-Ruieni HPP, Romania • 2006, 2013 Hydraulic Machinery Laboratory, École Polytechnique Fédérale de Lausanne,
Switzerland; • 2006 Wehr PSP, Germany • 2005, 2006, 2008, 2010, 2012, 2014 Institute of Hydraulic Machinery and Fluid Mechanics, Stuttgart
University, Germany • 2005, 2010 Portile de Fier I HPP, Romania • 2004 Portile de Fier II HPP, Romania • 2005 Turnu HPP, Romania • 2004 Jidoaia PSP, Romania • 2004 Petrimanu PSP, Romania • 2004 Lotru Aval PSP, Romania • 2004 Zăvideni HPP, Romania • 2003 Drăgăşani HPP, Romania I have participated to several training courses organized by European Association of Research Managers
and Administrators (EARMA) to extend my knowledge in field of research management and administration: - 11-12 May 2009: Helmholtz Office, Brussels, Belgium, European Association of Research Managers
and Administrators (EARMA) Training Course on “Intellectual Property Rights and Contract Management”, Lecturer: Susanne Burnett
- 26-27 June 2008: Forschungszentrum Karlsruhe, Germany. European Association of Research Managers and Administrators (EARMA) Training Course on “Effective Negotiations”, Lecturer: Kenneth Taylor
- 28-29 April 2008: Helmholtz Office, Brussels, Belgium, European Association of Research Managers and Administrators (EARMA) Training Course on “Advanced International Project Management”, Lecturer: Dr. Susanne Rahner

Habilitation thesis Sebastian Muntean, PhD
41/161
- 6-7 March 2008: Helmholtz Office, Brussels, Belgium, European Association of Research Managers and Administrators (EARMA) Training Course on “Leadership: Managing and Motivating Teams”, Lecturer: Kenneth Taylor
- 12 July 2007: Camera de Comert si Industrie Timisoara, Romania, Training Course on “How to write a FP7 Proposal Successfully”, Lecturer: Sean McCarty
- 21-22 May 2007: Helmholtz Office, Brussels, Belgium. European Association of Research Managers and Administrators (EARMA) Training Course on “Financial Management in EU Projects”, Lecturer: Paul Drath
- 16 April 2007: Helmholtz Office, Brussels, Belgium. European Association of Research Managers and Administrators (EARMA) Training Course on “FP7 Agreements”, Lecturers: Lotte Jaspers, Jet van Dijk, Margot Spaargaren
- 20-23 March 2007: Camera de Comert si Industrie Timisoara, Romania Minstry of Economy and Finance Training Course on “Horizontal Training for Structural Instruments”, Lecturer Team Leader: Dr. Dimitra Ioannou
- 16 May 2006: Forschungszentrum Karlsruhe, Germany. European Association of Research Managers and Administrators (EARMA) Training Course on “Risk Management in Projects” Lecturer: Prof.dr. Bernd J. Madauss.
- 15 May 2006: Forschungszentrum Karlsruhe, Germany. European Association of Research Managers and Administrators (EARMA) Training Course on “Coordination of Complex Projects” Lecturer: Prof.dr. Bernd J. Madauss.
- 24 -26 June 2004: European Association of Research Managers and Administrators Conference (EARMA), Bucharest, Romania, “Methods and Techniques of Management and Administration in Research”
My teaching career has started in 2016, when I joined as associate professor at the Hydraulic Machinery Group from Mechanical Machinery, Equipment and Transport Department, Politehnica University of Timişoara. My teaching activities are focused on hydraulic machineries, hydropower plants and pumping stations which is part of the curriculum in mechanical engineering at Bachelor and master levels, respectively.
I have contributed with one chapter to the book entitled “Fluid Mechanics, Hydraulic Machinery and Hydropower. Computing applications” ISBN: 973-638-076-9 published by Orizonturi Universitare publising house in 2004. This book includes computing applications of fluid mechanics and hydraulic machines for students.
I have supported several students to prepare their diploma theses (10), master dissertations (5) and PhD thesis (more than 10 with bold in next table) to generate a design for turbomachines (turbine or pump) or to perform an in-depth numerical flow investigation. I have supported four students at Batchelor level (their names are marked with bold in the next table) to develop their own research and to present their results at Student Technical Days (http://zts.lsfmt.ro/): No. Paper title Authors Event 1. Analysis of the operation of centrifugal pumps in
the flood protection system D. Ognean, D.C. Moş, S. Muntean
ZTS2017, 5-6 May 2017, Timisoara
2. 3D numerical flow analysis in the double flux impeller of the storage pump PRO 10-195 at the best efficiency point
S.-R. Constantin, A. Stuparu, R. Susan-Resiga, S. Muntean
ZTS2008, 11-18 May 2008, Timişoara
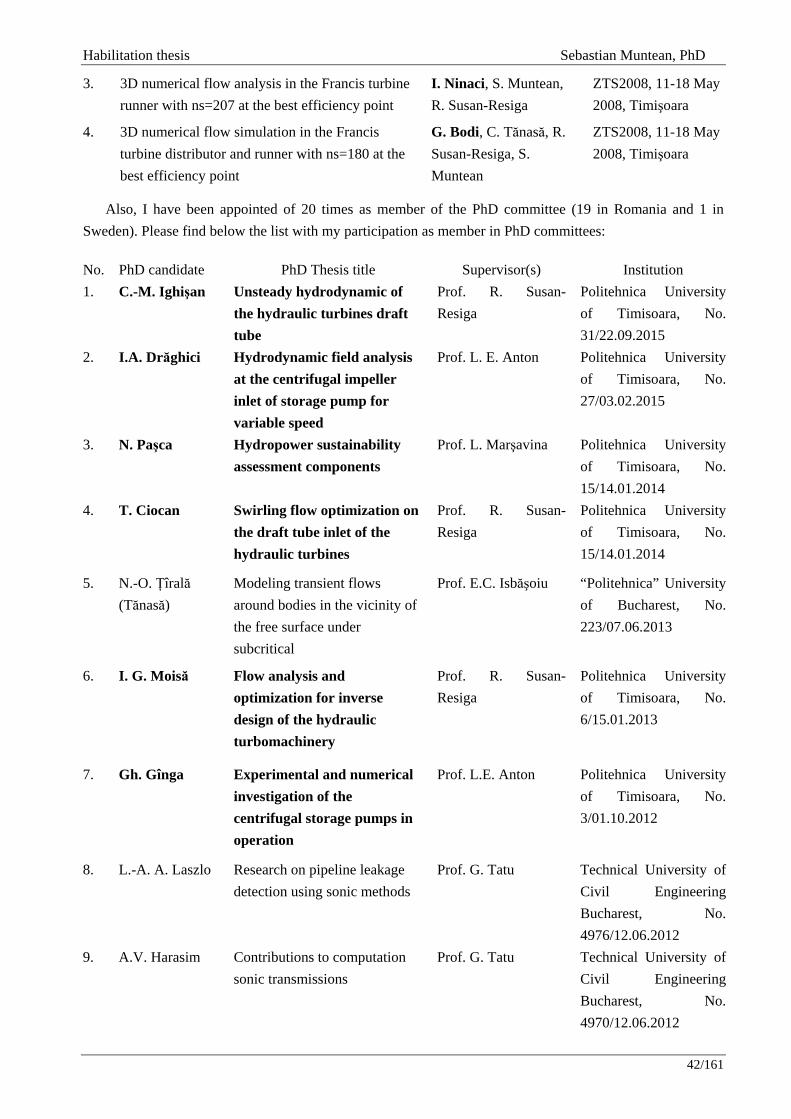
Habilitation thesis Sebastian Muntean, PhD
42/161
3. 3D numerical flow analysis in the Francis turbine runner with ns=207 at the best efficiency point
I. Ninaci, S. Muntean, R. Susan-Resiga
ZTS2008, 11-18 May 2008, Timişoara
4. 3D numerical flow simulation in the Francis turbine distributor and runner with ns=180 at the best efficiency point
G. Bodi, C. Tănasă, R. Susan-Resiga, S. Muntean
ZTS2008, 11-18 May 2008, Timişoara
Also, I have been appointed of 20 times as member of the PhD committee (19 in Romania and 1 in Sweden). Please find below the list with my participation as member in PhD committees: No. PhD candidate PhD Thesis title Supervisor(s) Institution 1. C.-M. Ighişan Unsteady hydrodynamic of
the hydraulic turbines draft tube
Prof. R. Susan-Resiga
Politehnica University of Timisoara, No. 31/22.09.2015
2. I.A. Drăghici Hydrodynamic field analysis at the centrifugal impeller inlet of storage pump for variable speed
Prof. L. E. Anton Politehnica University of Timisoara, No. 27/03.02.2015
3. N. Paşca Hydropower sustainability assessment components
Prof. L. Marşavina Politehnica University of Timisoara, No. 15/14.01.2014
4. T. Ciocan Swirling flow optimization on the draft tube inlet of the hydraulic turbines
Prof. R. Susan-Resiga
Politehnica University of Timisoara, No. 15/14.01.2014
5. N.-O. Ţîrală (Tănasă)
Modeling transient flows around bodies in the vicinity of the free surface under subcritical
Prof. E.C. Isbăşoiu “Politehnica” University of Bucharest, No. 223/07.06.2013
6. I. G. Moisă Flow analysis and optimization for inverse design of the hydraulic turbomachinery
Prof. R. Susan-Resiga
Politehnica University of Timisoara, No. 6/15.01.2013
7. Gh. Gînga Experimental and numerical investigation of the centrifugal storage pumps in operation
Prof. L.E. Anton Politehnica University of Timisoara, No. 3/01.10.2012
8. L.-A. A. Laszlo Research on pipeline leakage detection using sonic methods
Prof. G. Tatu Technical University of Civil Engineering Bucharest, No. 4976/12.06.2012
9. A.V. Harasim Contributions to computation sonic transmissions
Prof. G. Tatu Technical University of Civil Engineering Bucharest, No. 4970/12.06.2012
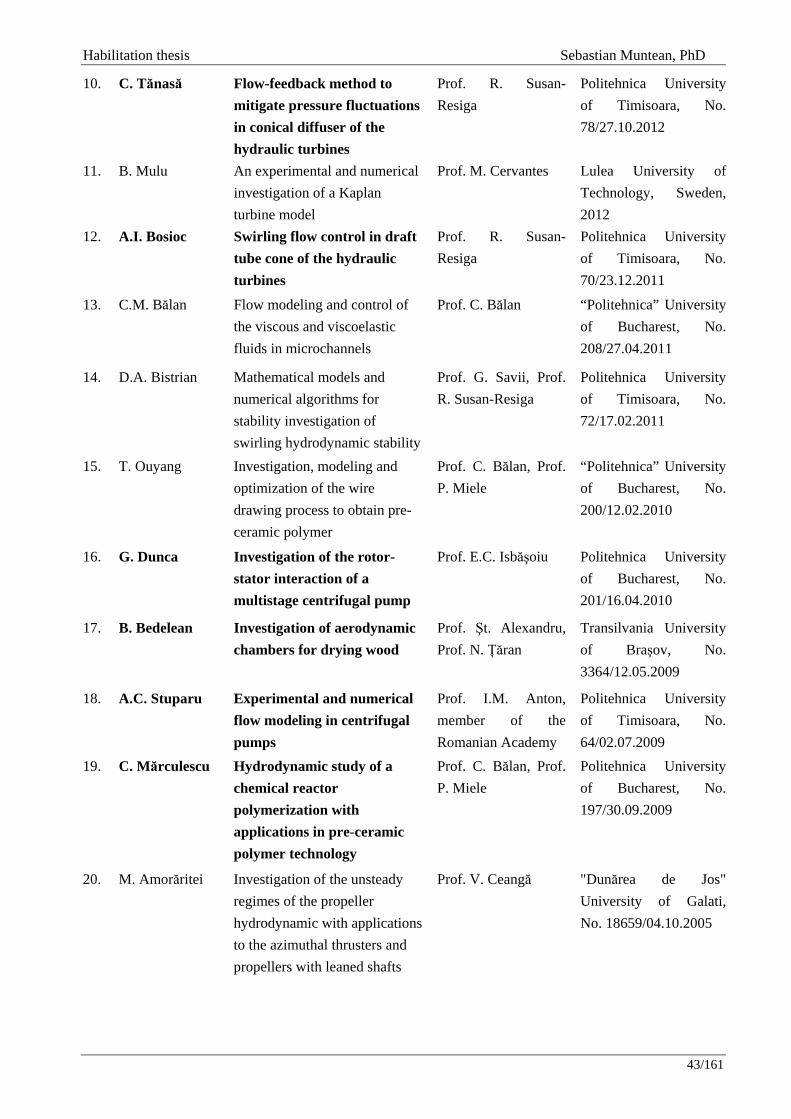
Habilitation thesis Sebastian Muntean, PhD
43/161
10. C. Tănasă Flow-feedback method to mitigate pressure fluctuations in conical diffuser of the hydraulic turbines
Prof. R. Susan-Resiga
Politehnica University of Timisoara, No. 78/27.10.2012
11. B. Mulu An experimental and numerical investigation of a Kaplan turbine model
Prof. M. Cervantes Lulea University of Technology, Sweden, 2012
12. A.I. Bosioc Swirling flow control in draft tube cone of the hydraulic turbines
Prof. R. Susan-Resiga
Politehnica University of Timisoara, No. 70/23.12.2011
13. C.M. Bălan Flow modeling and control of the viscous and viscoelastic fluids in microchannels
Prof. C. Bălan “Politehnica” University of Bucharest, No. 208/27.04.2011
14. D.A. Bistrian Mathematical models and numerical algorithms for stability investigation of swirling hydrodynamic stability
Prof. G. Savii, Prof. R. Susan-Resiga
Politehnica University of Timisoara, No. 72/17.02.2011
15. T. Ouyang Investigation, modeling and optimization of the wire drawing process to obtain pre-ceramic polymer
Prof. C. Bălan, Prof. P. Miele
“Politehnica” University of Bucharest, No. 200/12.02.2010
16. G. Dunca Investigation of the rotor-stator interaction of a multistage centrifugal pump
Prof. E.C. Isbăşoiu Politehnica University of Bucharest, No. 201/16.04.2010
17. B. Bedelean Investigation of aerodynamic chambers for drying wood
Prof. Şt. Alexandru, Prof. N. Ţăran
Transilvania University of Braşov, No. 3364/12.05.2009
18. A.C. Stuparu Experimental and numerical flow modeling in centrifugal pumps
Prof. I.M. Anton, member of the Romanian Academy
Politehnica University of Timisoara, No. 64/02.07.2009
19. C. Mărculescu Hydrodynamic study of a chemical reactor polymerization with applications in pre-ceramic polymer technology
Prof. C. Bălan, Prof. P. Miele
Politehnica University of Bucharest, No. 197/30.09.2009
20. M. Amorăritei Investigation of the unsteady regimes of the propeller hydrodynamic with applications to the azimuthal thrusters and propellers with leaned shafts
Prof. V. Ceangă "Dunărea de Jos" University of Galati, No. 18659/04.10.2005
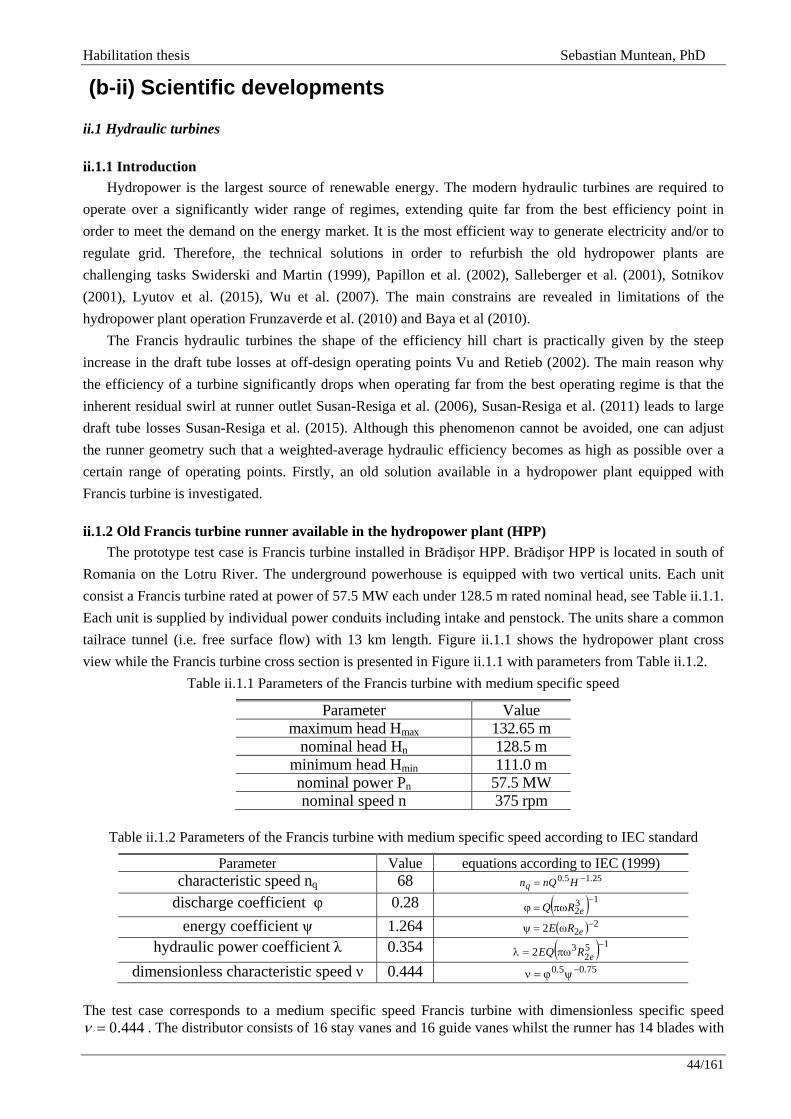
Habilitation thesis Sebastian Muntean, PhD
44/161
(b-ii) Scientific developments ii.1 Hydraulic turbines
ii.1.1 Introduction Hydropower is the largest source of renewable energy. The modern hydraulic turbines are required to
operate over a significantly wider range of regimes, extending quite far from the best efficiency point in order to meet the demand on the energy market. It is the most efficient way to generate electricity and/or to regulate grid. Therefore, the technical solutions in order to refurbish the old hydropower plants are challenging tasks Swiderski and Martin (1999), Papillon et al. (2002), Salleberger et al. (2001), Sotnikov (2001), Lyutov et al. (2015), Wu et al. (2007). The main constrains are revealed in limitations of the hydropower plant operation Frunzaverde et al. (2010) and Baya et al (2010).
The Francis hydraulic turbines the shape of the efficiency hill chart is practically given by the steep increase in the draft tube losses at off-design operating points Vu and Retieb (2002). The main reason why the efficiency of a turbine significantly drops when operating far from the best operating regime is that the inherent residual swirl at runner outlet Susan-Resiga et al. (2006), Susan-Resiga et al. (2011) leads to large draft tube losses Susan-Resiga et al. (2015). Although this phenomenon cannot be avoided, one can adjust the runner geometry such that a weighted-average hydraulic efficiency becomes as high as possible over a certain range of operating points. Firstly, an old solution available in a hydropower plant equipped with Francis turbine is investigated.
ii.1.2 Old Francis turbine runner available in the hydropower plant (HPP) The prototype test case is Francis turbine installed in Brădişor HPP. Brădişor HPP is located in south of
Romania on the Lotru River. The underground powerhouse is equipped with two vertical units. Each unit consist a Francis turbine rated at power of 57.5 MW each under 128.5 m rated nominal head, see Table ii.1.1. Each unit is supplied by individual power conduits including intake and penstock. The units share a common tailrace tunnel (i.e. free surface flow) with 13 km length. Figure ii.1.1 shows the hydropower plant cross view while the Francis turbine cross section is presented in Figure ii.1.1 with parameters from Table ii.1.2.
Table ii.1.1 Parameters of the Francis turbine with medium specific speed
Parameter Valuemaximum head Hmax 132.65 m
nominal head Hn 128.5 mminimum head Hmin 111.0 mnominal power Pn 57.5 MWnominal speed n 375 rpm
Table ii.1.2 Parameters of the Francis turbine with medium specific speed according to IEC standard
Parameter Value equations according to IEC (1999)characteristic speed nq 68 25150 ..
q HnQn −= discharge coefficient φ 0.28 ( ) 13
2−
πω=ϕ eRQ energy coefficient ψ 1.264 ( ) 2
22 −ω=ψ eRE hydraulic power coefficient λ 0.354 ( ) 15
232
−πω=λ eREQ
dimensionless characteristic speed ν 0.444 75050 .. −ψϕ=ν The test case corresponds to a medium specific speed Francis turbine with dimensionless specific speed
444.0=ν . The distributor consists of 16 stay vanes and 16 guide vanes whilst the runner has 14 blades with

Habilitation thesis Sebastian Muntean, PhD
45/161
the reference radius 137512 .R e = m. Figure ii.1.1 shows the Francis turbine cross view with parameters from Table ii.1 while the three-dimensional geometry of the Francis runner is presented in Figure ii.1.2.
Arbore hidrogenerator
+5,000
Ø 900;z=14
Ø 140
Ø 600
Ø 900H7f7
+2,195
+2,620+2,540
+1,870
+1,700
Ø 570
+1,400
+0,800
+0,600
-0,600
510
500
34
55
Ø 800; z=14
Ø 2275
Ø 2500; z=48; M=30
Ø 3400
Ø 3100; z=36; M48
Ø 2000
Ø 1806; z=14
Ø 2275
Ø 2400; z=16
2 -0,730 -0,745
A
A
12 14 8 7
9
10
3 132 415
11
1
10
-1,500
-1,850
-3,600
-3,760-3,680
-6,450
Ø 2670; z=48; M30
4500
3200
Ø 2900; z=48; M42
Ø 2680
Ø 1
350
5
6
+0,450
0,000
-1,340
Figure ii.1.1 Cross section through the hydropower plant and cross section through the Francis turbine.
The runner is a welded construction where hot formed blades are welded to the cast ring and crown. In our case, the runner is manufactured from martensitic-ferritic-austenitic stainless steel, T10CuNiCr180, Frunzaverde et al. (2010).
0
34
55
Ø 800; z=14
Ø 2275
Ø 2500; z=48; M=30
Ø 3400
Ø 3100; z=36; M48
Ø 2000
Ø 1806; z=14
Ø 2275
Ø 2400; z=16
2 -0,730 -0,745
1
+0,450
Figure ii.1.2 Cross section through the runner and the Francis turbine runner.
ii.1.3 Francis turbine units operation during 10 years Five control regimes denoted from R1 to R5 are selected on a wide discharge range together with its weighted values based on Francis turbine operation during one decade (1999-2009), Figure ii.1.3. The red dots on the hill chart correspond to operating points recorded in situ from 1999 to 2009. Then, five control regimes are selected to collect these operating points. The first control regime (R1) collects the operating

Habilitatio
points with(R3) fromdischarge v
Fig
Fig
Figurplant durin23798 houcomputed control reghours. Thecorrespondincluded inconditionswith vorteoperation regimes (Rresult, a sreference v
on thesis
h discharge vm 40 m3/s to
values larger
gure ii.1.3 Frdecade
gure ii.1.4. N
re ii.1.4 presng 1999 - 20urs for unit U
based on lasgime as a rate weighted vds to the wen each contros have shownex rope, 35%time was at R2, R3 and synopsis viewvalue.
values lower45 m3/s, ther than 47.5 m
rancis turbineoperation (1
Number of ho
sents number009. As a resuU2, respectivst ten years tio between cvalues are meighted averol regime whn the followi% from totafull load coR4) are clusw based on
r than 35 m3/e forth regimm3/s.
e hill chart to999 - 2009)
ours in servic
r of hours inult, total numely. Figure iof the operacumulated n
marked with rage values hile it radius ing distributial operation nditions, Bastered near t
n one decade
/s, the seconme (R4) from
ogether with of both units
ce of the old
n service onmber of houri.1.3 present
ation (the rednumber of ho
black circlesof dischargeis proportio
ion: 15% frotime was ar
aya et al. (20to the best ee operation
nd one (R2) fm 45 m3/s to
five control s available in
Francis turb
n each Francrs in service ts the hill chad points). A ours in servics in Figure ie and head nal with the m total operround best e
010). One caefficiency poof the exist
Se
from 35 m3/so 47.5 m3/s a
regimes selen the hydropo
ines units: U
is turbine unof 18092 is cart of the Fraweighted va
ce associatedii.1.3 The cecomputed uweight.The
ration time wefficiency p
an see that aroint revealinting Francis
ebastian Mun
s to 40 m3/s,and last regim
ected based oower plant.
U1 (red); U2
nit installed counted for uancis turbinealue is compd to it and toenter of eachsing the opeanalysis of h
was at part looint and 50round 76.8%
ng a peak opturbine is c
ntean, PhD
46/16
the third onme (R5) wit
on one
(blue).
in the poweunit U1 whil with regime
puted for eactal number oh black circlerating pointhydrodynamioad condition% from tota
% of operatinperation. As considered a
61
ne th
er le es ch of le ts ic ns al
ng a
as

Habilitation thesis Sebastian Muntean, PhD
47/161
ii.1.4 Technical problems in turbine operation The operation of a hydroelectric power plant is associated with several unsteady and transient
phenomena. Start-up and shut-down operation, modification of operating point, out of phase synchronization during start-up and emergency stop induce unsteady loading conditions, Trivedi et al. (2013). The start-stop cycle is considered as the low-cycle fatigue cycle; the high-frequent load cycles from unsteady fluid flow are associated to as the high-cycle fatigue cycles acting on runner blades, Gagnon et al. (2012), Gagnon et al. (2014). During a complete start-stop cycle, the steady low cycles fatigue loading goes from zero to a maximum under service conditions and back to zero.
The following problems were detected during to the part load operation conditions: i) the vibrations are generated and propagated to the hydraulic turbine elements, Casanova (2009); ii) the runner cone ogive is removed, see Figure ii.1.5; iii) the runner band seal is worn; iv) the cracks are initiated at the junction between crown and runner blades on the trailing edge and leads to failure of the runner blades Frunzaverde et al. (2010), Luna-Ramirez et al. (2016). The air admission through the choke valve situated to the end of hollow shaft is performed in the hydropower plant if the pressure level goes down to the atmospheric pressure, Figure ii.1.5, Muntean et al. (2014).
Figure ii.1.5 The runner cone was removed due to the vortex rope generated at part load conditions. The
view of the runner without cone ogive and the runner cone ogive recovered from draft tube.
In the case of the Francis turbine interactions between the turbine components are quite common, especially between guide vanes and Franics runner with low specific speed. Under one complete rotation of the turbine runner, fluctuations in the water flow as many as there are guide vanes take place in each runner canal. The unsteady flow from blades passing the guide vanes is normally assumed to induce the predominant high-cycle fatigue vibration stresses. The largest bending stresses appear where the blade is fixed to the band or crown, Frunzaverde et al. (2010). At this T-joint geometry, the level of stress and strain is further intensified due to notch effects, Huth (2005), Pasca et al. (2013), Carpinteri et al. (2015). Notch stresses of two areas of the circular-shaped transition between the blade and the band or crown of the Francis turbine runner was subject of investigation. Due to stress concentration, these areas are the runner’s two locations of highest local stress amplitudes and therewith the most critical locations for fatigue. The welded joint between blade and band or crown was idealized by a simple T-joint subject to pure bending. The investigations were revealed the transition radius to be by far the more decisive parameter regarding stress concentration, compared to the influence of blade edge radius Carpinteri et al. (2005), Huth (2005). Figure ii.1.6 a shows the crack in the runner blade while the runner without blade is presented.
The most important requirement for the manufacture is weldability in order to avoid defects and brittleness in the heat affected zones of the material. To fulfill these requirement limitations in the chemical
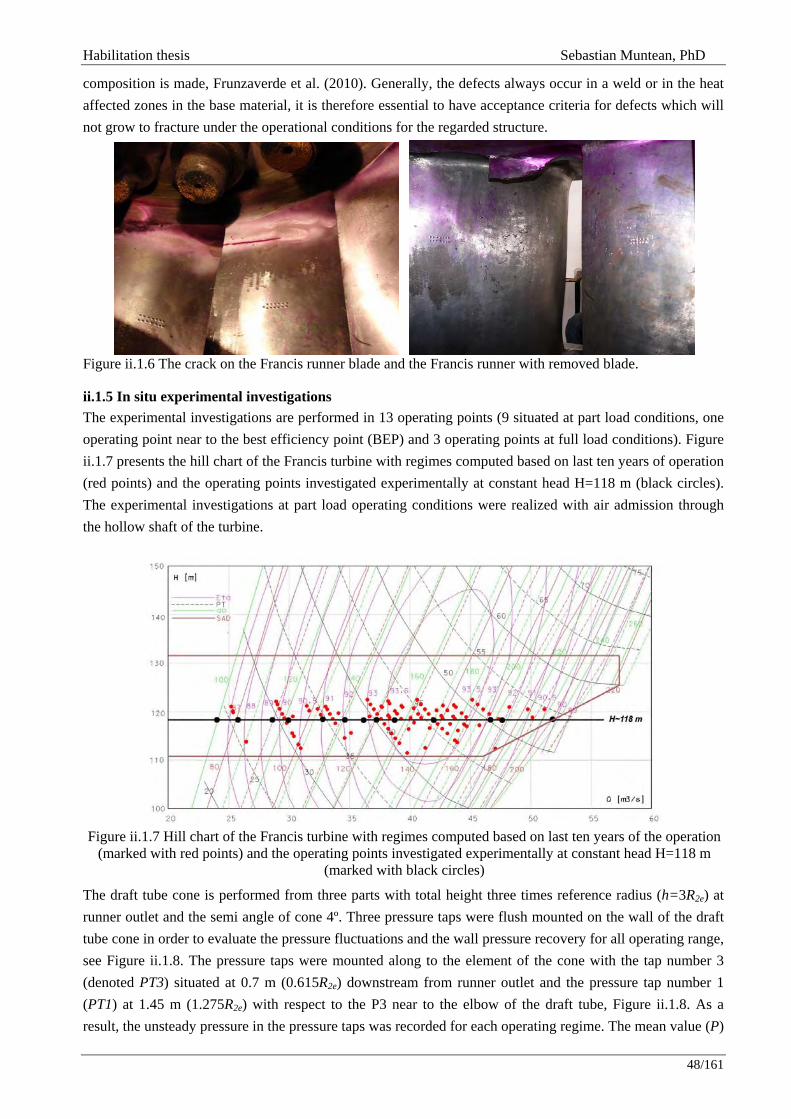
Habilitation thesis Sebastian Muntean, PhD
48/161
composition is made, Frunzaverde et al. (2010). Generally, the defects always occur in a weld or in the heat affected zones in the base material, it is therefore essential to have acceptance criteria for defects which will not grow to fracture under the operational conditions for the regarded structure.
Figure ii.1.6 The crack on the Francis runner blade and the Francis runner with removed blade.
ii.1.5 In situ experimental investigations The experimental investigations are performed in 13 operating points (9 situated at part load conditions, one operating point near to the best efficiency point (BEP) and 3 operating points at full load conditions). Figure ii.1.7 presents the hill chart of the Francis turbine with regimes computed based on last ten years of operation (red points) and the operating points investigated experimentally at constant head H=118 m (black circles). The experimental investigations at part load operating conditions were realized with air admission through the hollow shaft of the turbine.
Figure ii.1.7 Hill chart of the Francis turbine with regimes computed based on last ten years of the operation
(marked with red points) and the operating points investigated experimentally at constant head H=118 m (marked with black circles)
The draft tube cone is performed from three parts with total height three times reference radius (h=3R2e) at runner outlet and the semi angle of cone 4º. Three pressure taps were flush mounted on the wall of the draft tube cone in order to evaluate the pressure fluctuations and the wall pressure recovery for all operating range, see Figure ii.1.8. The pressure taps were mounted along to the element of the cone with the tap number 3 (denoted PT3) situated at 0.7 m (0.615R2e) downstream from runner outlet and the pressure tap number 1 (PT1) at 1.45 m (1.275R2e) with respect to the P3 near to the elbow of the draft tube, Figure ii.1.8. As a result, the unsteady pressure in the pressure taps was recorded for each operating regime. The mean value (P)

Habilitation thesis Sebastian Muntean, PhD
49/161
and fluctuant component (p’) are obtained from unsteady pressure signal recorded in the pressure taps using the following equation
'pPp += (ii.1.1)
Figure ii.1.8 The pressure taps flush mounted on the wall along to the element of the cone: photo and sketch
Consequently, the wall pressure recovery is computed using eq. (ii.1.2) based on averaged values between taps, see Table ii.1.3. The wall pressure recovery on the first part of draft tube cone is denoted χ23 while the wall pressure recovery between PT1 and PT3 marked χ13 is obtained along to the draft tube cone. The reference section is no. 3 displaced just downstream to the runner.
⎥⎥
⎦
⎤
⎢⎢
⎣
⎡
⎟⎟⎠
⎞⎜⎜⎝
⎛−
⎟⎟⎠
⎞⎜⎜⎝
⎛+
ρ−⎟⎟
⎠
⎞⎜⎜⎝
⎛+
ρ≡χ
23
3
23
3
12 i
wall
i
wall
i
AA
AQ
gzPgzP
(ii.1.2)
where i =1,2 corresponds to the pressure taps (PT) installed on the wall cone, Figure ii.1.8.
Table ii.1.3 Wall pressure recovery along to the draft tube cone for variable operating points
Q/Qbep χ23 χ13 Operating regimes 0.58927 -0.289 0.553
Part load
0.62439 -0.090 0.737 0.69610 0.334 0.829 0.72805 0.484 0.859 0.79488 0.742 0.860 0.84829 0.730 0.818 0.87561 0.760 0.744 0.89268 0.721 0.719 0.93902 0.635 0.665 1.03976 0.552 0.582 BEP 1.14878 0.530 0.547
Overload 1.15937 0.519 0.535 1.32683 0.444 0.474
Figure ii.1.9 shows the distribution of the wall pressure recovery (χ23 and χ13) for all operating points
investigated. The wall pressure recovery on the cone χ13 (marked with black circle in Figure ii.1.9) seems to be quite similar with the values measured on the first part of the cone χ23 at full load operation and near to best efficiency point. Contrary, at part load operation, the wall pressure recovery on the first part of the cone χ23 (plotted with red square in Figure ii.1.9) is smaller than the wall pressure recovery along to the cone χ13 due to the strong influence of the residual swirling level downstream to the runner. The maximum value

Habilitation thesis Sebastian Muntean, PhD
50/161
χ23=0.75 of wall pressure recovery coefficient on the first part of draft tube cone is reached at 85% from best efficiency point discharge (Qbep) while the maximum value χ13=0.86 of wall pressure recovery coefficient on the draft tube cone at 75% from Qbep. That situation is obtained due to the runner is designed with free swirling flow at best efficiency point in conjunction with high draft tube cone (h=3R2e) and small semi angle of cone. However, one should bear in mind that the measurements at part load operation are performed with air admission just downstream to the runner through the hollow shaft. Consequently, the wall pressure recovery at part load operation includes the influence of the air admission.
Figure ii.1.9 The wall pressure recovery along to the draft tube cone for all operating range: on the first part
of cone (χ23) and along to the element of cone (χ13).
The pressure fluctuations (p’) are analyzed based on Fourier spectra in order to evaluate the amplitude and frequency. Figure ii.1.10 presents the Fourier spectra in the pressure taps (PT1, PT2 and PT3 in Figureiii.1.8) flush mounted on the cone wall at four part load operating conditions. The fundamental harmonic (1st harmonic) corresponds to the vortex rope and associated frequency is around 20-25% from runner frequency. The maximum amplitude (1.3% from head) is obtained for pressure transducer PT3 situated just downstream to the runner at part load operation (around 60% see Figure ii.1.10). The maximum amplitude decreases with more than 50% if the turbine operates at regime above 80%. The maxima of dimensionless amplitude and associated frequency for each operating point as well as each wall pressure tap are presented in Table ii.1.4.
Table ii.1.4 Maximum amplitude and associated frequency at part load operating regimes measured on the draft tube cone wall in the hydropower plant with air admission
Q/Qbep [-] Pressure tap no. 1 (PT1) Pressure tap no. 2 (PT2) Pressure tap no. 3 (PT3)
A/(ρE) [%] f/n [-] A/(ρE) [%] f/n [-] A/(ρE) [%] f/n [-] 0.58927 0.6750 0.5184 (2nd harmonic) 0.7356 0.2592 (1st harmonic) 1.3414 0.2592 (1st harmonic) 0.62439 0.5625 0.5056 (2nd harmonic) 0.6491 0.2528 (1st harmonic) 1.3414 0.2528 (1st harmonic) 0.69610 0.4673 0.4672 (2nd harmonic) 0.5712 0.2336 (1st harmonic) 1.0731 0.2336 (1st harmonic) 0.72805 0.5798 0.2256 (1st harmonic) 0.7010 0.2256 (1st harmonic) 1.2462 0.2256 (1st harmonic) 0.79488 0.4154 0.2240 (1st harmonic) 0.4414 0.2240 (1st harmonic) 0.6318 0.2240 (1st harmonic) 0.84829 0.3635 0.2224 (1st harmonic) 0.2077 0.2224 (1st harmonic) 0.1904 0.2224 (1st harmonic) 0.87561 0.2942 0.1936 (1st harmonic) 0.2337 0.1936 (1st harmonic) 0.1991 0.1936 (1st harmonic)
The maximum amplitude measured in pressure transducer PT1 situated near to the elbow is two times
smaller than the maximum amplitude from PT3, see Figure ii.1.10. Moreover, at part load operating regimes (Q ≈ 0.6Qbep) the maximum amplitude corresponds to 2nd harmonic frequency, Table iii1.4. The air
0.4 0.6 0.8 1 1.2 1.4Q/Qbep [−]
−0.5
0
0.5
1
X23
, X13
[−]
X13X23
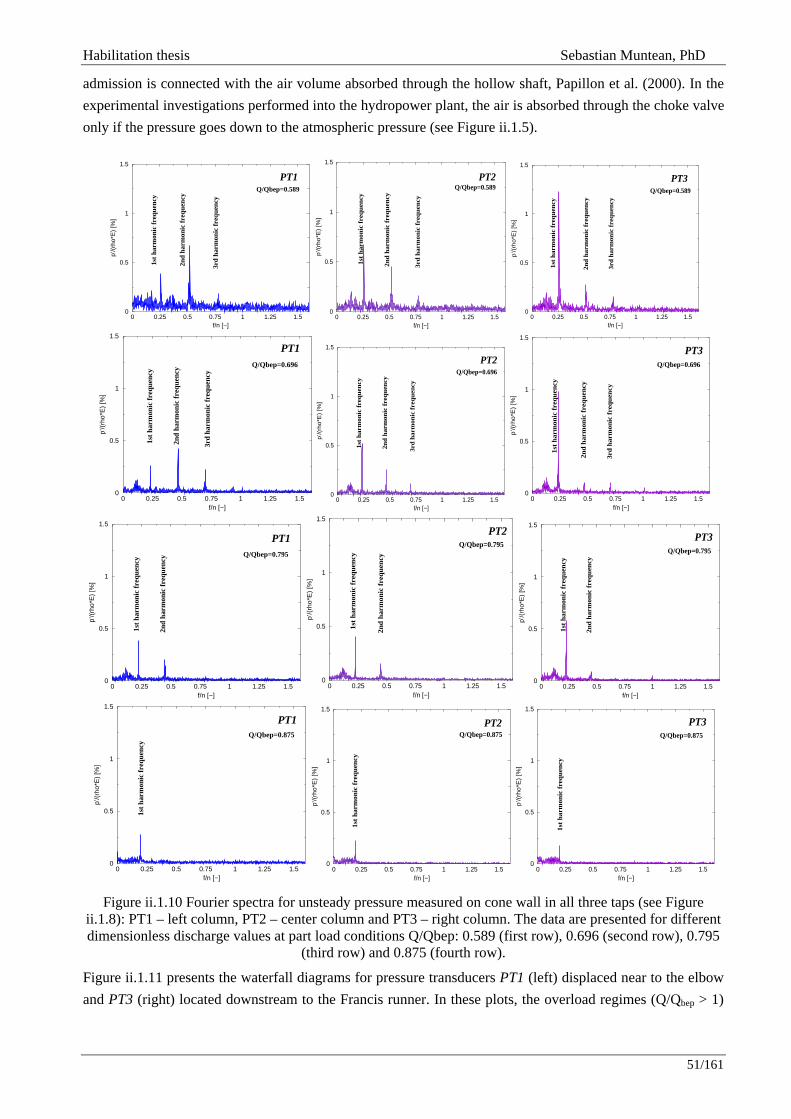
Habilitation thesis Sebastian Muntean, PhD
51/161
admission is connected with the air volume absorbed through the hollow shaft, Papillon et al. (2000). In the experimental investigations performed into the hydropower plant, the air is absorbed through the choke valve only if the pressure goes down to the atmospheric pressure (see Figure ii.1.5).
Figure ii.1.10 Fourier spectra for unsteady pressure measured on cone wall in all three taps (see Figure
ii.1.8): PT1 – left column, PT2 – center column and PT3 – right column. The data are presented for different dimensionless discharge values at part load conditions Q/Qbep: 0.589 (first row), 0.696 (second row), 0.795
(third row) and 0.875 (fourth row).
Figure ii.1.11 presents the waterfall diagrams for pressure transducers PT1 (left) displaced near to the elbow and PT3 (right) located downstream to the Francis runner. In these plots, the overload regimes (Q/Qbep > 1)
0 0.25 0.5 0.75 1 1.25 1.5f/n [−]
0
0.5
1
1.5
p’/(
rho*
E)
[%]
2nd
harm
onic
fre
quen
cy
1st
harm
onic
fre
quen
cy
3rd
harm
onic
fre
quen
cy
PT1Q/Qbep=0.589
0 0.25 0.5 0.75 1 1.25 1.5f/n [−]
0
0.5
1
1.5
p’/(
rho
*E)
[%]
2nd
har
mon
ic f
req
uen
cy
1st
har
mon
ic f
req
uen
cy
3rd
har
mon
ic f
req
uen
cy
PT2Q/Qbep=0.589
0 0.25 0.5 0.75 1 1.25 1.5f/n [−]
0
0.5
1
1.5
p’/(
rho*E
) [%
]
2nd
har
mon
ic f
req
uen
cy
1st
har
mon
ic f
req
uen
cy
3rd
har
mon
ic f
req
uen
cy
PT3Q/Qbep=0.589
0 0.25 0.5 0.75 1 1.25 1.5f/n [−]
0
0.5
1
1.5
p’/(
rho*
E)
[%]
2nd
harm
onic
fre
quen
cy
1st
harm
onic
fre
quen
cy
3rd
harm
onic
fre
quen
cy
Q/Qbep=0.696
PT1
0 0.25 0.5 0.75 1 1.25 1.5f/n [−]
0
0.5
1
1.5
p’/(
rho*E
) [%
]
2nd
har
mon
ic f
req
uen
cy
1st
har
mon
ic f
req
uen
cy
3rd
har
mon
ic f
req
uen
cy
PT2Q/Qbep=0.696
0 0.25 0.5 0.75 1 1.25 1.5f/n [−]
0
0.5
1
1.5
p’/(
rho
*E)
[%]
2nd
har
mon
ic f
req
uen
cy
1st
har
mon
ic f
req
uen
cy
3rd
har
mon
ic f
req
uen
cy
PT3Q/Qbep=0.696
0 0.25 0.5 0.75 1 1.25 1.5f/n [−]
0
0.5
1
1.5
p’/(
rho*
E)
[%]
2nd
harm
onic
fre
quen
cy
1st
harm
onic
fre
quen
cy
PT1Q/Qbep=0.795
0 0.25 0.5 0.75 1 1.25 1.5f/n [−]
0
0.5
1
1.5
p’/(
rho
*E)
[%]
2nd
har
mon
ic f
req
uen
cy
1st
har
mon
ic f
req
uen
cy
PT2Q/Qbep=0.795
0 0.25 0.5 0.75 1 1.25 1.5f/n [−]
0
0.5
1
1.5p’/(
rho*E
) [%
]
2nd
har
mon
ic f
req
uen
cy
1st
har
mon
ic f
req
uen
cy
PT3Q/Qbep=0.795
0 0.25 0.5 0.75 1 1.25 1.5f/n [−]
0
0.5
1
1.5
p’/(
rho*
E)
[%]
1st
harm
onic
fre
quen
cy
PT1Q/Qbep=0.875
0 0.25 0.5 0.75 1 1.25 1.5f/n [−]
0
0.5
1
1.5
p’/(
rho
*E)
[%]
1st
har
mon
ic f
req
uen
cy
PT2Q/Qbep=0.875
0 0.25 0.5 0.75 1 1.25 1.5f/n [−]
0
0.5
1
1.5
p’/(
rho*E
) [%
]
1st
har
mon
ic f
req
uen
cy
PT3Q/Qbep=0.875
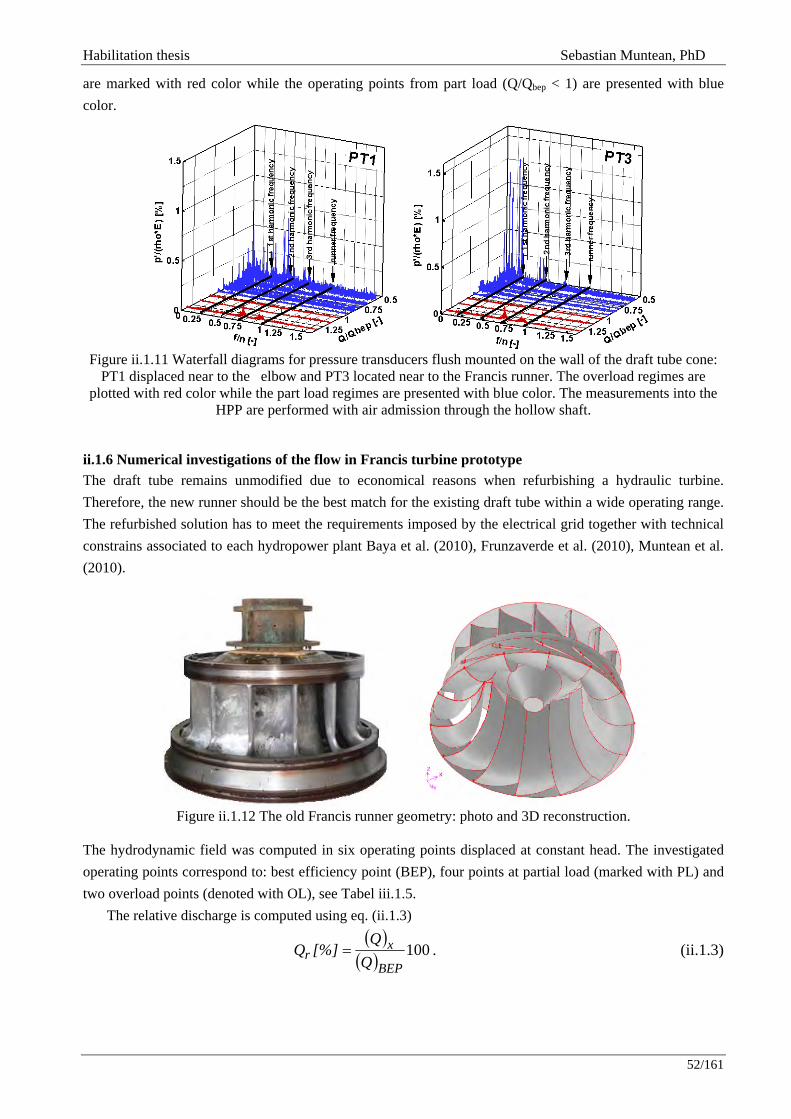
Habilitation thesis Sebastian Muntean, PhD
52/161
are marked with red color while the operating points from part load (Q/Qbep < 1) are presented with blue color.
Figure ii.1.11 Waterfall diagrams for pressure transducers flush mounted on the wall of the draft tube cone:
PT1 displaced near to the elbow and PT3 located near to the Francis runner. The overload regimes are plotted with red color while the part load regimes are presented with blue color. The measurements into the
HPP are performed with air admission through the hollow shaft.
ii.1.6 Numerical investigations of the flow in Francis turbine prototype The draft tube remains unmodified due to economical reasons when refurbishing a hydraulic turbine. Therefore, the new runner should be the best match for the existing draft tube within a wide operating range. The refurbished solution has to meet the requirements imposed by the electrical grid together with technical constrains associated to each hydropower plant Baya et al. (2010), Frunzaverde et al. (2010), Muntean et al. (2010).
Figure ii.1.12 The old Francis runner geometry: photo and 3D reconstruction.
The hydrodynamic field was computed in six operating points displaced at constant head. The investigated operating points correspond to: best efficiency point (BEP), four points at partial load (marked with PL) and two overload points (denoted with OL), see Tabel iii.1.5.
The relative discharge is computed using eq. (ii.1.3) ( )
( ) 100BEP
xr Q
Q[%]Q = . (ii.1.3)
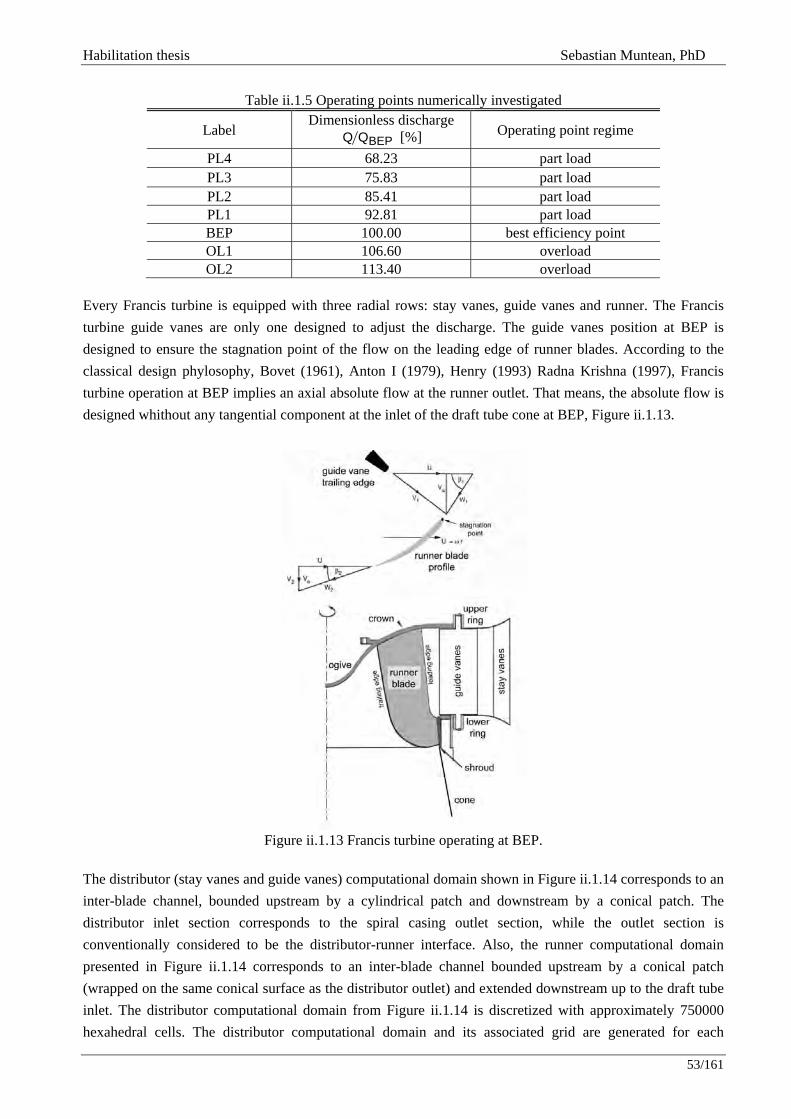
Habilitation thesis Sebastian Muntean, PhD
53/161
Table ii.1.5 Operating points numerically investigated
Label Dimensionless discharge
BEPQQ [%] Operating point regime
PL4 68.23 part load PL3 75.83 part load PL2 85.41 part load PL1 92.81 part load BEP 100.00 best efficiency point OL1 106.60 overload OL2 113.40 overload
Every Francis turbine is equipped with three radial rows: stay vanes, guide vanes and runner. The Francis turbine guide vanes are only one designed to adjust the discharge. The guide vanes position at BEP is designed to ensure the stagnation point of the flow on the leading edge of runner blades. According to the classical design phylosophy, Bovet (1961), Anton I (1979), Henry (1993) Radna Krishna (1997), Francis turbine operation at BEP implies an axial absolute flow at the runner outlet. That means, the absolute flow is designed whithout any tangential component at the inlet of the draft tube cone at BEP, Figure ii.1.13.
Figure ii.1.13 Francis turbine operating at BEP.
The distributor (stay vanes and guide vanes) computational domain shown in Figure ii.1.14 corresponds to an inter-blade channel, bounded upstream by a cylindrical patch and downstream by a conical patch. The distributor inlet section corresponds to the spiral casing outlet section, while the outlet section is conventionally considered to be the distributor-runner interface. Also, the runner computational domain presented in Figure ii.1.14 corresponds to an inter-blade channel bounded upstream by a conical patch (wrapped on the same conical surface as the distributor outlet) and extended downstream up to the draft tube inlet. The distributor computational domain from Figure ii.1.14 is discretized with approximately 750000 hexahedral cells. The distributor computational domain and its associated grid are generated for each
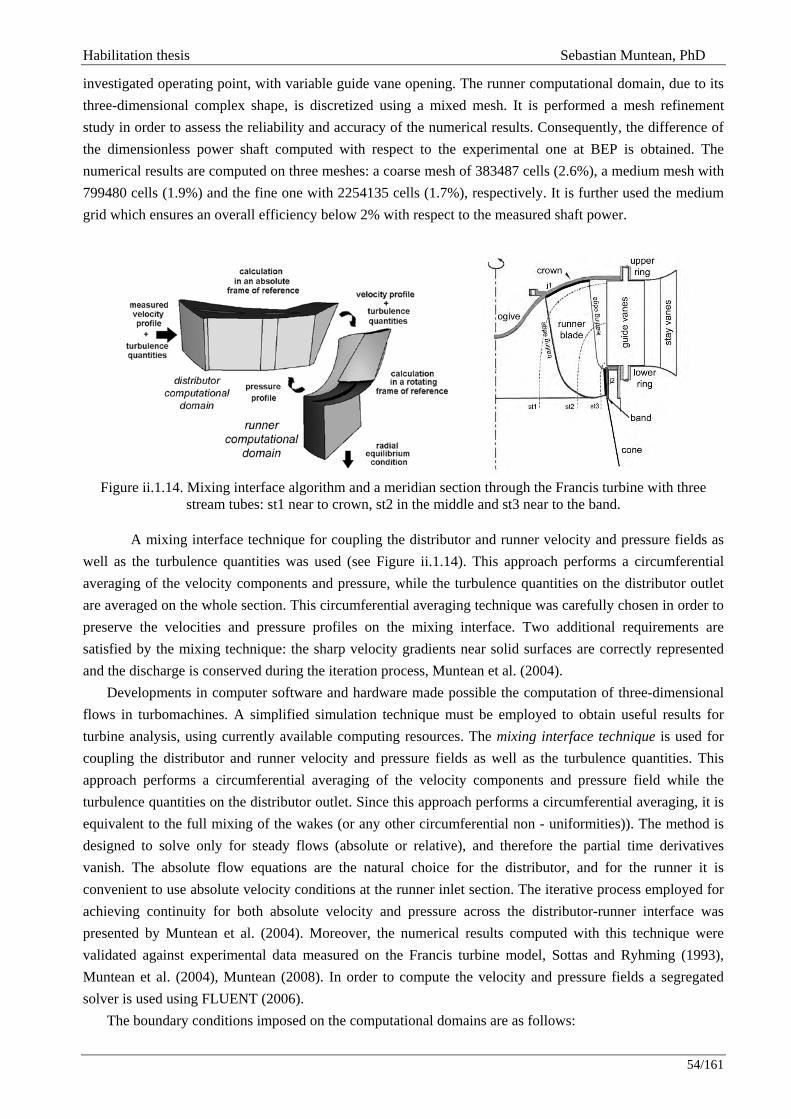
Habilitation thesis Sebastian Muntean, PhD
54/161
investigated operating point, with variable guide vane opening. The runner computational domain, due to its three-dimensional complex shape, is discretized using a mixed mesh. It is performed a mesh refinement study in order to assess the reliability and accuracy of the numerical results. Consequently, the difference of the dimensionless power shaft computed with respect to the experimental one at BEP is obtained. The numerical results are computed on three meshes: a coarse mesh of 383487 cells (2.6%), a medium mesh with 799480 cells (1.9%) and the fine one with 2254135 cells (1.7%), respectively. It is further used the medium grid which ensures an overall efficiency below 2% with respect to the measured shaft power.
Figure ii.1.14. Mixing interface algorithm and a meridian section through the Francis turbine with three
stream tubes: st1 near to crown, st2 in the middle and st3 near to the band.
A mixing interface technique for coupling the distributor and runner velocity and pressure fields as well as the turbulence quantities was used (see Figure ii.1.14). This approach performs a circumferential averaging of the velocity components and pressure, while the turbulence quantities on the distributor outlet are averaged on the whole section. This circumferential averaging technique was carefully chosen in order to preserve the velocities and pressure profiles on the mixing interface. Two additional requirements are satisfied by the mixing technique: the sharp velocity gradients near solid surfaces are correctly represented and the discharge is conserved during the iteration process, Muntean et al. (2004).
Developments in computer software and hardware made possible the computation of three-dimensional flows in turbomachines. A simplified simulation technique must be employed to obtain useful results for turbine analysis, using currently available computing resources. The mixing interface technique is used for coupling the distributor and runner velocity and pressure fields as well as the turbulence quantities. This approach performs a circumferential averaging of the velocity components and pressure field while the turbulence quantities on the distributor outlet. Since this approach performs a circumferential averaging, it is equivalent to the full mixing of the wakes (or any other circumferential non - uniformities)). The method is designed to solve only for steady flows (absolute or relative), and therefore the partial time derivatives vanish. The absolute flow equations are the natural choice for the distributor, and for the runner it is convenient to use absolute velocity conditions at the runner inlet section. The iterative process employed for achieving continuity for both absolute velocity and pressure across the distributor-runner interface was presented by Muntean et al. (2004). Moreover, the numerical results computed with this technique were validated against experimental data measured on the Francis turbine model, Sottas and Ryhming (1993), Muntean et al. (2004), Muntean (2008). In order to compute the velocity and pressure fields a segregated solver is used using FLUENT (2006).
The boundary conditions imposed on the computational domains are as follows:
Habilitation thesis Sebastian Muntean, PhD
55/161
(1) velocity field is prescribed on the inflow section for both distributor and runner domains. The velocity profile prescribed on the distributor inlet section corresponds to the spiral casing outlet, and the mixed velocity profile on the distributor outlet section is imposed on the runner inlet section using the mixing algorithm;
(2) turbulence quantities (turbulence intensity and turbulence length scale) are prescribed on the inflow section for both distributor and runner domains. Also, the turbulence quantities are imposed on the runner inlet section on each iteration. It is well known, the Reynolds number gives a measure of the ratio of inertial forces to viscous one. The Reynolds number of 2.35x10⁷ is associated to the actual Francis turbine operating at BEP. Consequently, the computation can be performed in order to evaluate with enough accuracy the blade loading for operating conditions near to BEP. However, the viscous effects became significant when the turbine operates far away to the best efficiency point where the flow separation is appeared. In this paper, the three-dimensional turbulent flow computation is performed for all investigated operating points using a k-ε model. Therefore, a turbulence intensity of 2% and a turbulence length scale of 0.01 m are assumed on the distributor inlet section. These values are computed as follows:
[ ]%V3k2100I 2sc= (ii.1.4)
and the turbulence length scale
[ ]mkCl 2343 ε= μ (ii.1.5)
over the spiral casing (sc) outlet section. From three-dimensional turbulent numerical simulation performed on the hydropower plant passage from penstock to the runner the following average values are obtained on the spiral casing outlet section in order to compute the turbulence quantities:
the turbulent kinetic energy ⎥⎦⎤
⎢⎣⎡= 22 sm01718.0k , the turbulent dissipation rate
⎥⎦⎤
⎢⎣⎡=ε 32 sm03717.0 , the mean velocity on the spiral casing outlet section [ ]sm5Vsc = and the
empirical constant specified in the turbulence model 09.0C =μ .
(3) pressure distribution is imposed on the distributor outlet section and an arbitrary (e.g. constant) outlet pressure distribution is used to initialize the iterative process. On the runner outlet section the radial equilibrium outlet condition is prescribed, assuming that in this section is no radial flow Muntean et al. (2004);
(4) periodic conditions are imposed on the periodic boundary; (5) wall conditions are imposed on the stay vanes, guide vanes and runner blades, as well as on the
distributor upper / lower rings and runner band and crown, respectively. The distributor flow was computed using the inlet velocity profile and an arbitrary (e.g. constant) outlet pressure distribution. Next, iterations were performed as follows:
(6) compute the runner flow, using the inlet velocity distribution obtained at the distributor outlet and the radial equilibrium outlet condition for outlet pressure;
(7) compute the distributor flow, keeping the inlet velocity constant and using the outlet pressure distribution obtained at the runner inlet;
(8) the stopping criterion considered in this procedure was that the pressure distribution on the distributor-runner interface remains practically unchanged from one iteration to another.
Moreover, the numerical results obtained with described methodology were validated against experimental data on the Francis turbine model, Muntean et al. (2004), Muntean (2008).
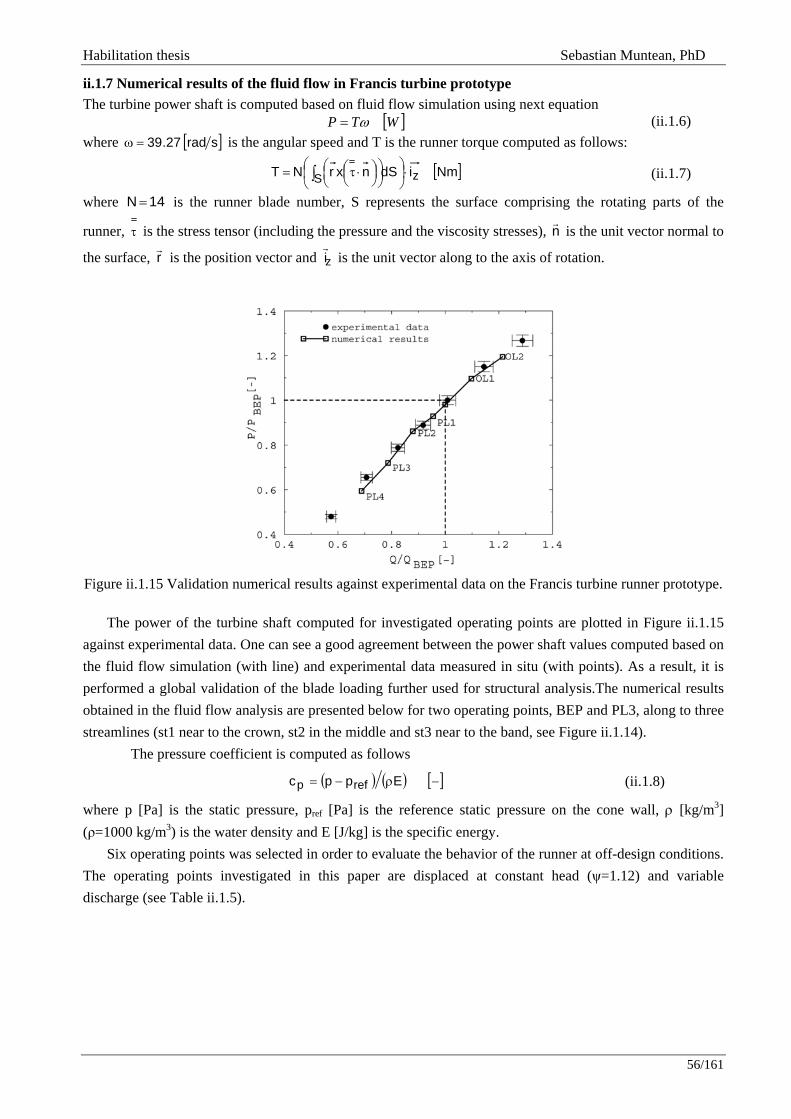
Habilitation thesis Sebastian Muntean, PhD
56/161
ii.1.7 Numerical results of the fluid flow in Francis turbine prototype The turbine power shaft is computed based on fluid flow simulation using next equation
[ ]WTP ω= (ii.1.6)where [ ]srad27.39=ω is the angular speed and T is the runner torque computed as follows:
[ ]NmidSnxrNT zS ⋅⎟⎠⎞
⎜⎝⎛
⎟⎠⎞
⎜⎝⎛ ⎟
⎠⎞⎜
⎝⎛ ⋅τ= ∫ (ii.1.7)
where 14N = is the runner blade number, S represents the surface comprising the rotating parts of the
runner, τ is the stress tensor (including the pressure and the viscosity stresses), nr
is the unit vector normal to
the surface, rr
is the position vector and zir
is the unit vector along to the axis of rotation.
Figure ii.1.15 Validation numerical results against experimental data on the Francis turbine runner prototype.
The power of the turbine shaft computed for investigated operating points are plotted in Figure ii.1.15
against experimental data. One can see a good agreement between the power shaft values computed based on the fluid flow simulation (with line) and experimental data measured in situ (with points). As a result, it is performed a global validation of the blade loading further used for structural analysis.The numerical results obtained in the fluid flow analysis are presented below for two operating points, BEP and PL3, along to three streamlines (st1 near to the crown, st2 in the middle and st3 near to the band, see Figure ii.1.14).
The pressure coefficient is computed as follows
( ) ( ) [ ]−ρ−= Eppc refp (ii.1.8)
where p [Pa] is the static pressure, pref [Pa] is the reference static pressure on the cone wall, ρ [kg/m3] (ρ=1000 kg/m3) is the water density and E [J/kg] is the specific energy.
Six operating points was selected in order to evaluate the behavior of the runner at off-design conditions. The operating points investigated in this paper are displaced at constant head (ψ=1.12) and variable discharge (see Table ii.1.5).
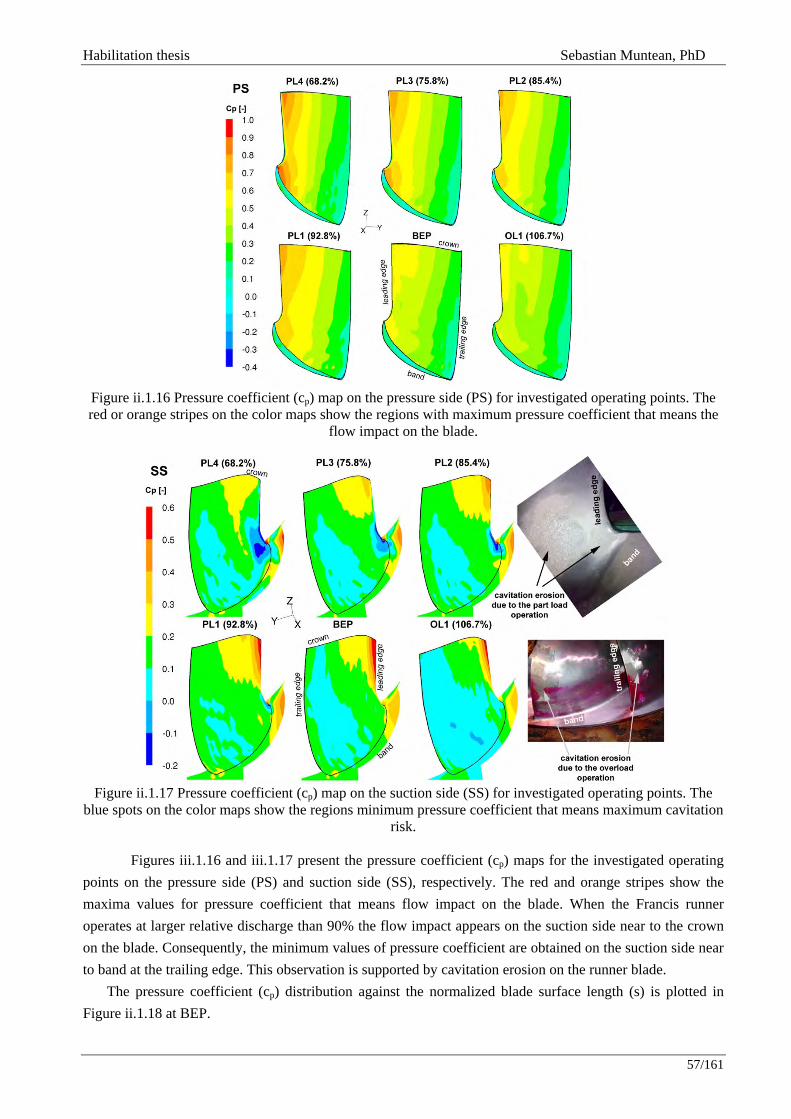
Habilitation thesis Sebastian Muntean, PhD
57/161
Figure ii.1.16 Pressure coefficient (cp) map on the pressure side (PS) for investigated operating points. The red or orange stripes on the color maps show the regions with maximum pressure coefficient that means the
flow impact on the blade.
Figure ii.1.17 Pressure coefficient (cp) map on the suction side (SS) for investigated operating points. The
blue spots on the color maps show the regions minimum pressure coefficient that means maximum cavitation risk.
Figures iii.1.16 and iii.1.17 present the pressure coefficient (cp) maps for the investigated operating
points on the pressure side (PS) and suction side (SS), respectively. The red and orange stripes show the maxima values for pressure coefficient that means flow impact on the blade. When the Francis runner operates at larger relative discharge than 90% the flow impact appears on the suction side near to the crown on the blade. Consequently, the minimum values of pressure coefficient are obtained on the suction side near to band at the trailing edge. This observation is supported by cavitation erosion on the runner blade.
The pressure coefficient (cp) distribution against the normalized blade surface length (s) is plotted in Figure ii.1.18 at BEP.
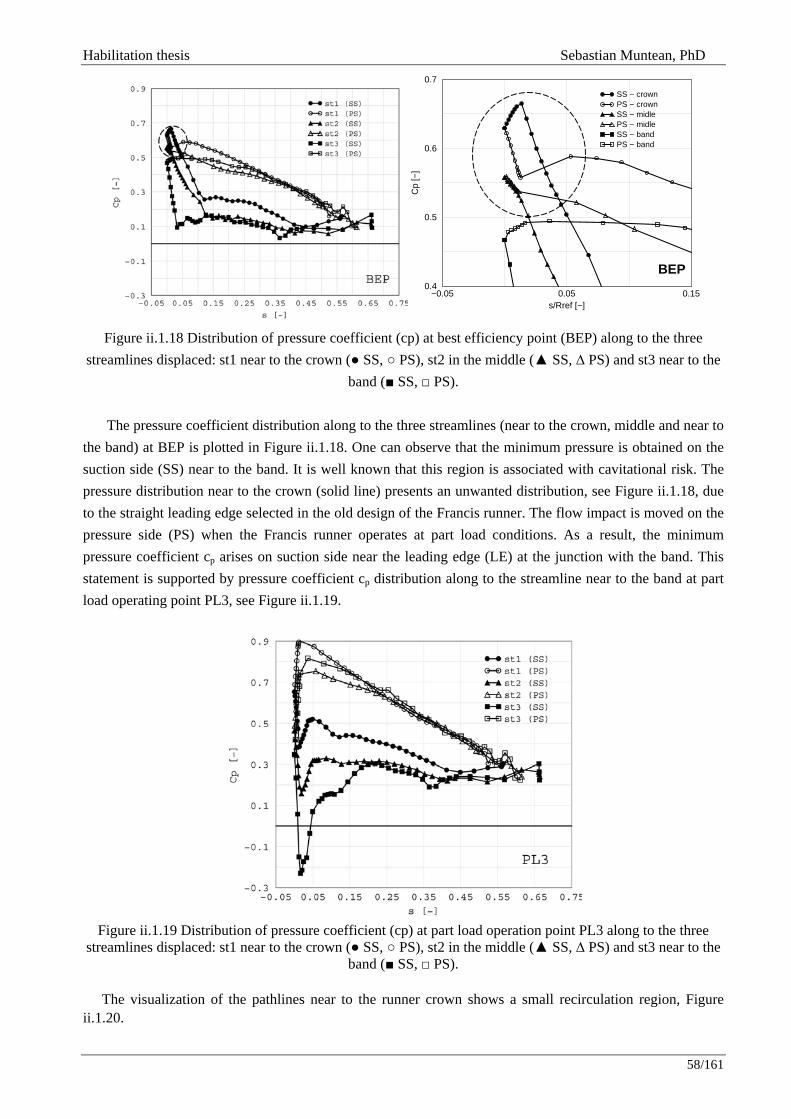
Habilitation thesis Sebastian Muntean, PhD
58/161
Figure ii.1.18 Distribution of pressure coefficient (cp) at best efficiency point (BEP) along to the three
streamlines displaced: st1 near to the crown ( SS, PS), st2 in the middle ( SS, ∆ PS) and st3 near to the band ( SS, PS).
The pressure coefficient distribution along to the three streamlines (near to the crown, middle and near to
the band) at BEP is plotted in Figure ii.1.18. One can observe that the minimum pressure is obtained on the suction side (SS) near to the band. It is well known that this region is associated with cavitational risk. The pressure distribution near to the crown (solid line) presents an unwanted distribution, see Figure ii.1.18, due to the straight leading edge selected in the old design of the Francis runner. The flow impact is moved on the pressure side (PS) when the Francis runner operates at part load conditions. As a result, the minimum pressure coefficient cp arises on suction side near the leading edge (LE) at the junction with the band. This statement is supported by pressure coefficient cp distribution along to the streamline near to the band at part load operating point PL3, see Figure ii.1.19.
Figure ii.1.19 Distribution of pressure coefficient (cp) at part load operation point PL3 along to the three
streamlines displaced: st1 near to the crown ( SS, PS), st2 in the middle ( SS, ∆ PS) and st3 near to the band ( SS, PS).
The visualization of the pathlines near to the runner crown shows a small recirculation region, Figure
ii.1.20.
−0.05 0.05 0.15s/Rref [−]
0.4
0.5
0.6
0.7
Cp
[−]
SS − crownPS − crownSS − midlePS − midleSS − bandPS − band
BEP
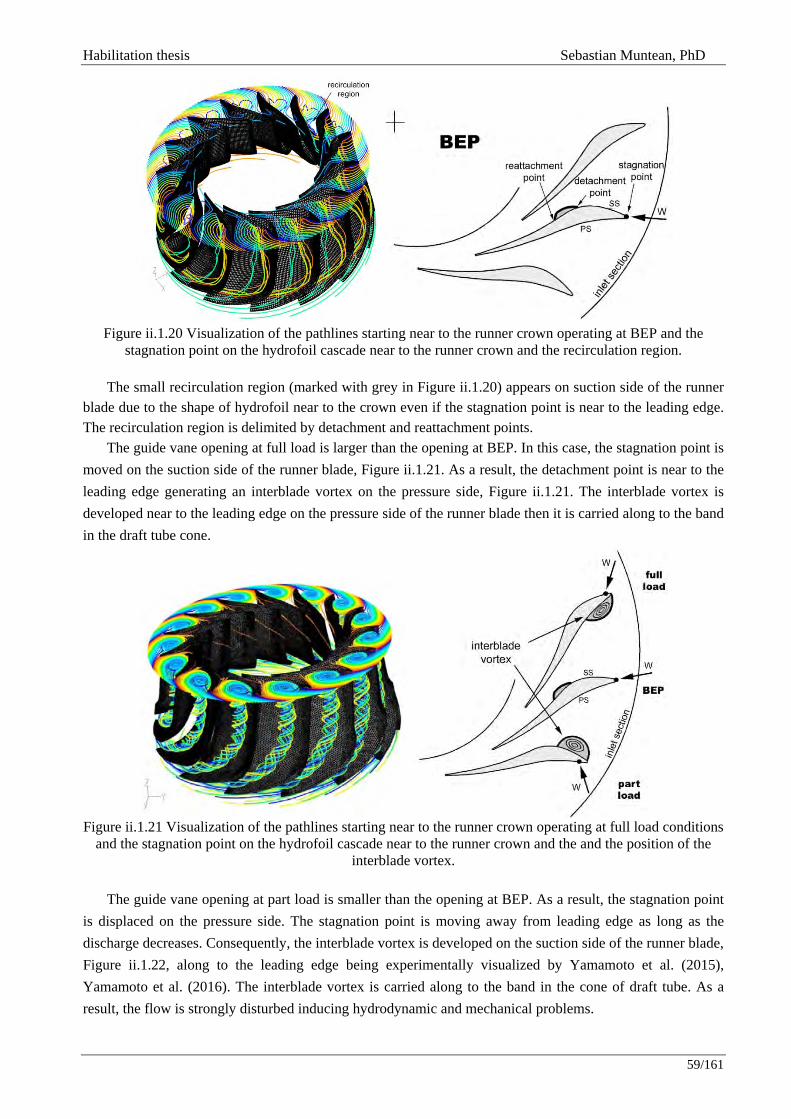
Habilitation thesis Sebastian Muntean, PhD
59/161
Figure ii.1.20 Visualization of the pathlines starting near to the runner crown operating at BEP and the
stagnation point on the hydrofoil cascade near to the runner crown and the recirculation region.
The small recirculation region (marked with grey in Figure ii.1.20) appears on suction side of the runner blade due to the shape of hydrofoil near to the crown even if the stagnation point is near to the leading edge. The recirculation region is delimited by detachment and reattachment points.
The guide vane opening at full load is larger than the opening at BEP. In this case, the stagnation point is moved on the suction side of the runner blade, Figure ii.1.21. As a result, the detachment point is near to the leading edge generating an interblade vortex on the pressure side, Figure ii.1.21. The interblade vortex is developed near to the leading edge on the pressure side of the runner blade then it is carried along to the band in the draft tube cone.
Figure ii.1.21 Visualization of the pathlines starting near to the runner crown operating at full load conditions
and the stagnation point on the hydrofoil cascade near to the runner crown and the and the position of the interblade vortex.
The guide vane opening at part load is smaller than the opening at BEP. As a result, the stagnation point
is displaced on the pressure side. The stagnation point is moving away from leading edge as long as the discharge decreases. Consequently, the interblade vortex is developed on the suction side of the runner blade, Figure ii.1.22, along to the leading edge being experimentally visualized by Yamamoto et al. (2015), Yamamoto et al. (2016). The interblade vortex is carried along to the band in the cone of draft tube. As a result, the flow is strongly disturbed inducing hydrodynamic and mechanical problems.
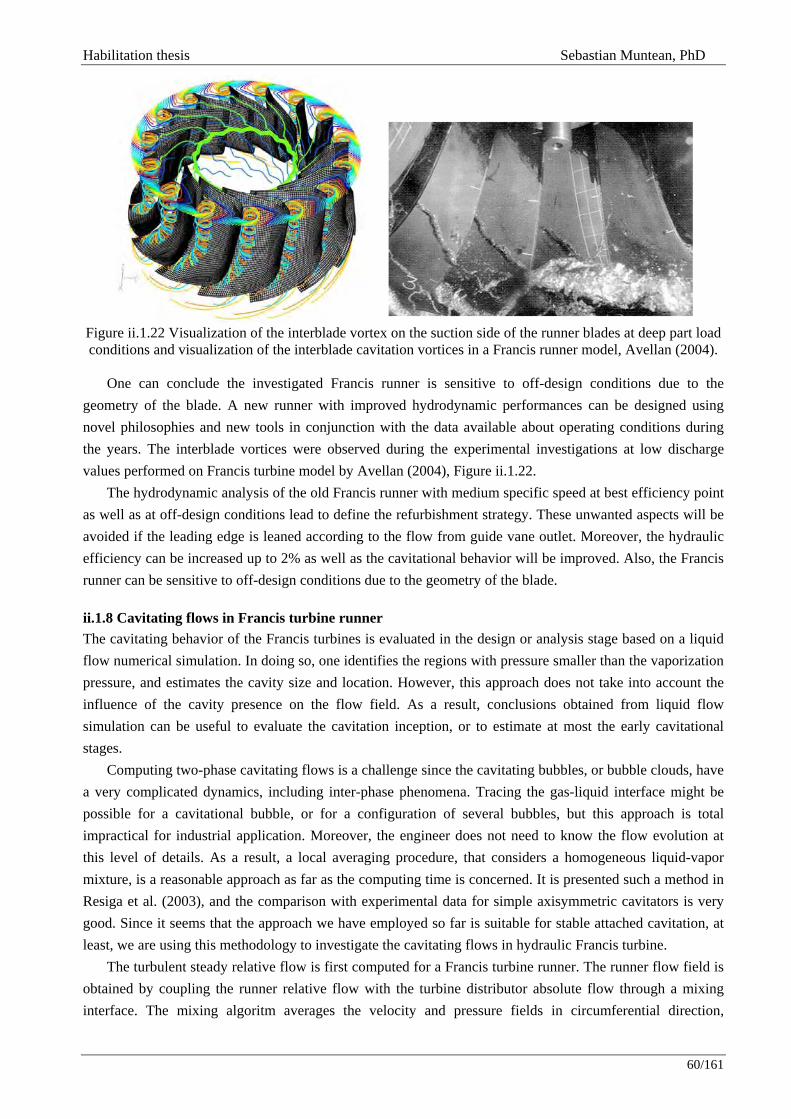
Habilitation thesis Sebastian Muntean, PhD
60/161
Figure ii.1.22 Visualization of the interblade vortex on the suction side of the runner blades at deep part load conditions and visualization of the interblade cavitation vortices in a Francis runner model, Avellan (2004).
One can conclude the investigated Francis runner is sensitive to off-design conditions due to the
geometry of the blade. A new runner with improved hydrodynamic performances can be designed using novel philosophies and new tools in conjunction with the data available about operating conditions during the years. The interblade vortices were observed during the experimental investigations at low discharge values performed on Francis turbine model by Avellan (2004), Figure ii.1.22.
The hydrodynamic analysis of the old Francis runner with medium specific speed at best efficiency point as well as at off-design conditions lead to define the refurbishment strategy. These unwanted aspects will be avoided if the leading edge is leaned according to the flow from guide vane outlet. Moreover, the hydraulic efficiency can be increased up to 2% as well as the cavitational behavior will be improved. Also, the Francis runner can be sensitive to off-design conditions due to the geometry of the blade.
ii.1.8 Cavitating flows in Francis turbine runner The cavitating behavior of the Francis turbines is evaluated in the design or analysis stage based on a liquid flow numerical simulation. In doing so, one identifies the regions with pressure smaller than the vaporization pressure, and estimates the cavity size and location. However, this approach does not take into account the influence of the cavity presence on the flow field. As a result, conclusions obtained from liquid flow simulation can be useful to evaluate the cavitation inception, or to estimate at most the early cavitational stages.
Computing two-phase cavitating flows is a challenge since the cavitating bubbles, or bubble clouds, have a very complicated dynamics, including inter-phase phenomena. Tracing the gas-liquid interface might be possible for a cavitational bubble, or for a configuration of several bubbles, but this approach is total impractical for industrial application. Moreover, the engineer does not need to know the flow evolution at this level of details. As a result, a local averaging procedure, that considers a homogeneous liquid-vapor mixture, is a reasonable approach as far as the computing time is concerned. It is presented such a method in Resiga et al. (2003), and the comparison with experimental data for simple axisymmetric cavitators is very good. Since it seems that the approach we have employed so far is suitable for stable attached cavitation, at least, we are using this methodology to investigate the cavitating flows in hydraulic Francis turbine.
The turbulent steady relative flow is first computed for a Francis turbine runner. The runner flow field is obtained by coupling the runner relative flow with the turbine distributor absolute flow through a mixing interface. The mixing algoritm averages the velocity and pressure fields in circumferential direction,
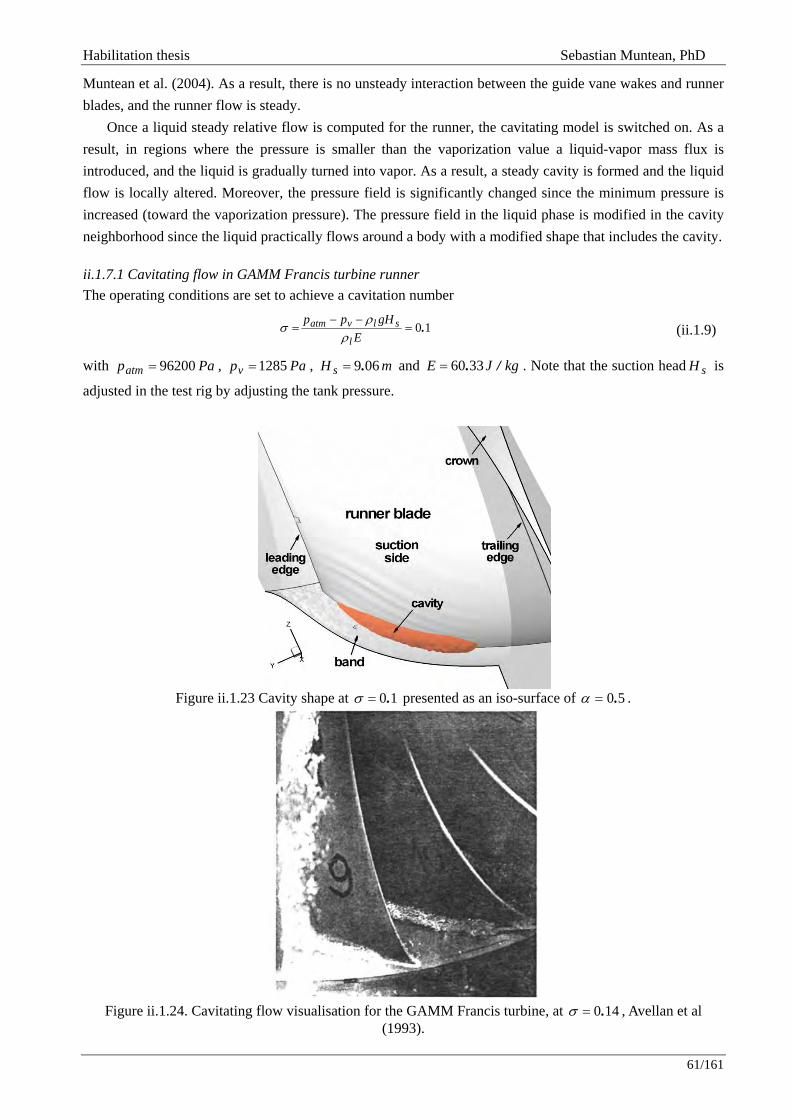
Habilitation thesis Sebastian Muntean, PhD
61/161
Muntean et al. (2004). As a result, there is no unsteady interaction between the guide vane wakes and runner blades, and the runner flow is steady.
Once a liquid steady relative flow is computed for the runner, the cavitating model is switched on. As a result, in regions where the pressure is smaller than the vaporization value a liquid-vapor mass flux is introduced, and the liquid is gradually turned into vapor. As a result, a steady cavity is formed and the liquid flow is locally altered. Moreover, the pressure field is significantly changed since the minimum pressure is increased (toward the vaporization pressure). The pressure field in the liquid phase is modified in the cavity neighborhood since the liquid practically flows around a body with a modified shape that includes the cavity.
ii.1.7.1 Cavitating flow in GAMM Francis turbine runner The operating conditions are set to achieve a cavitation number
10.=−−
=E
gHpp
l
slvatmρ
ρσ
(ii.1.9)
with Papatm 96200= , Papv 1285= , mH s 069.= and kgJE /.3360= . Note that the suction head sH is
adjusted in the test rig by adjusting the tank pressure.
Figure ii.1.23 Cavity shape at 10.=σ presented as an iso-surface of 50.=α .
Figure ii.1.24. Cavitating flow visualisation for the GAMM Francis turbine, at 140.=σ , Avellan et al
(1993).
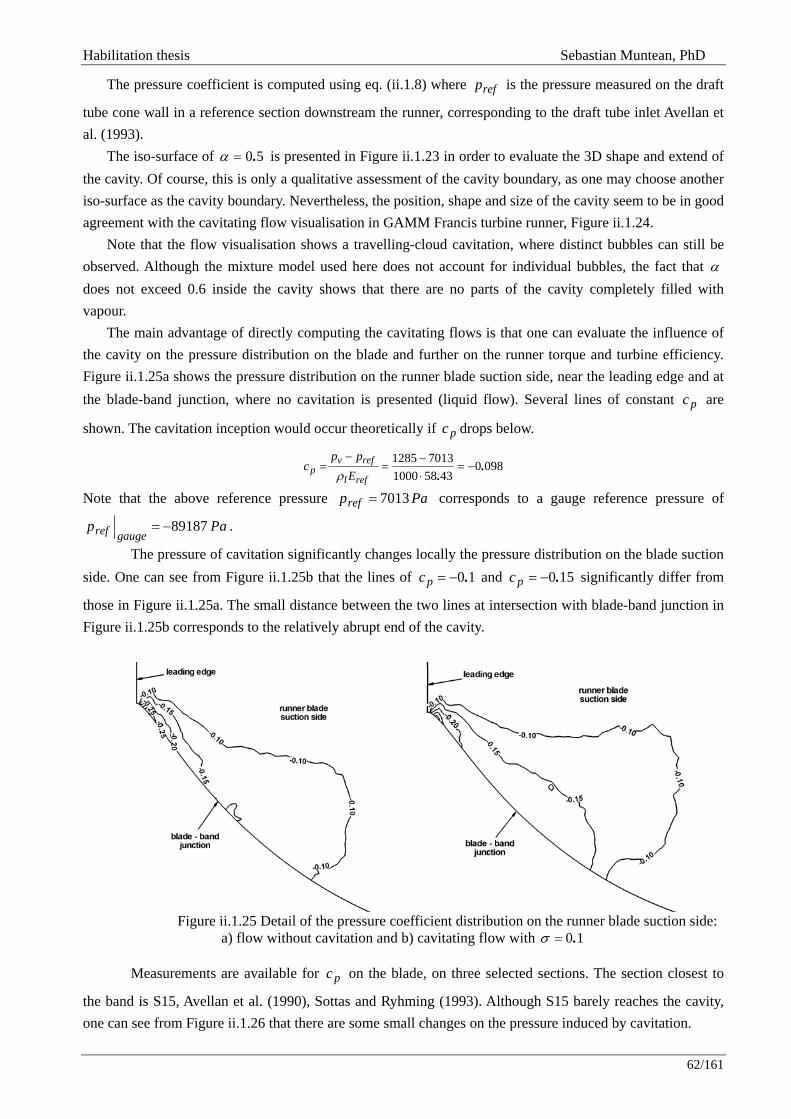
Habilitation thesis Sebastian Muntean, PhD
62/161
The pressure coefficient is computed using eq. (ii.1.8) where refp is the pressure measured on the draft
tube cone wall in a reference section downstream the runner, corresponding to the draft tube inlet Avellan et al. (1993).
The iso-surface of 50.=α is presented in Figure ii.1.23 in order to evaluate the 3D shape and extend of the cavity. Of course, this is only a qualitative assessment of the cavity boundary, as one may choose another iso-surface as the cavity boundary. Nevertheless, the position, shape and size of the cavity seem to be in good agreement with the cavitating flow visualisation in GAMM Francis turbine runner, Figure ii.1.24.
Note that the flow visualisation shows a travelling-cloud cavitation, where distinct bubbles can still be observed. Although the mixture model used here does not account for individual bubbles, the fact that α does not exceed 0.6 inside the cavity shows that there are no parts of the cavity completely filled with vapour.
The main advantage of directly computing the cavitating flows is that one can evaluate the influence of the cavity on the pressure distribution on the blade and further on the runner torque and turbine efficiency. Figure ii.1.25a shows the pressure distribution on the runner blade suction side, near the leading edge and at the blade-band junction, where no cavitation is presented (liquid flow). Several lines of constant pc are
shown. The cavitation inception would occur theoretically if pc drops below.
098043581000
70131285 ..
−=⋅−
=−
=refl
refvp E
ppc
ρ
Note that the above reference pressure Papref 7013= corresponds to a gauge reference pressure of
Papgaugeref 89187−= .
The pressure of cavitation significantly changes locally the pressure distribution on the blade suction side. One can see from Figure ii.1.25b that the lines of 10.−=pc and 150.−=pc significantly differ from
those in Figure ii.1.25a. The small distance between the two lines at intersection with blade-band junction in Figure ii.1.25b corresponds to the relatively abrupt end of the cavity.
Figure ii.1.25 Detail of the pressure coefficient distribution on the runner blade suction side:
a) flow without cavitation and b) cavitating flow with 10.=σ
Measurements are available for pc on the blade, on three selected sections. The section closest to
the band is S15, Avellan et al. (1990), Sottas and Ryhming (1993). Although S15 barely reaches the cavity, one can see from Figure ii.1.26 that there are some small changes on the pressure induced by cavitation.
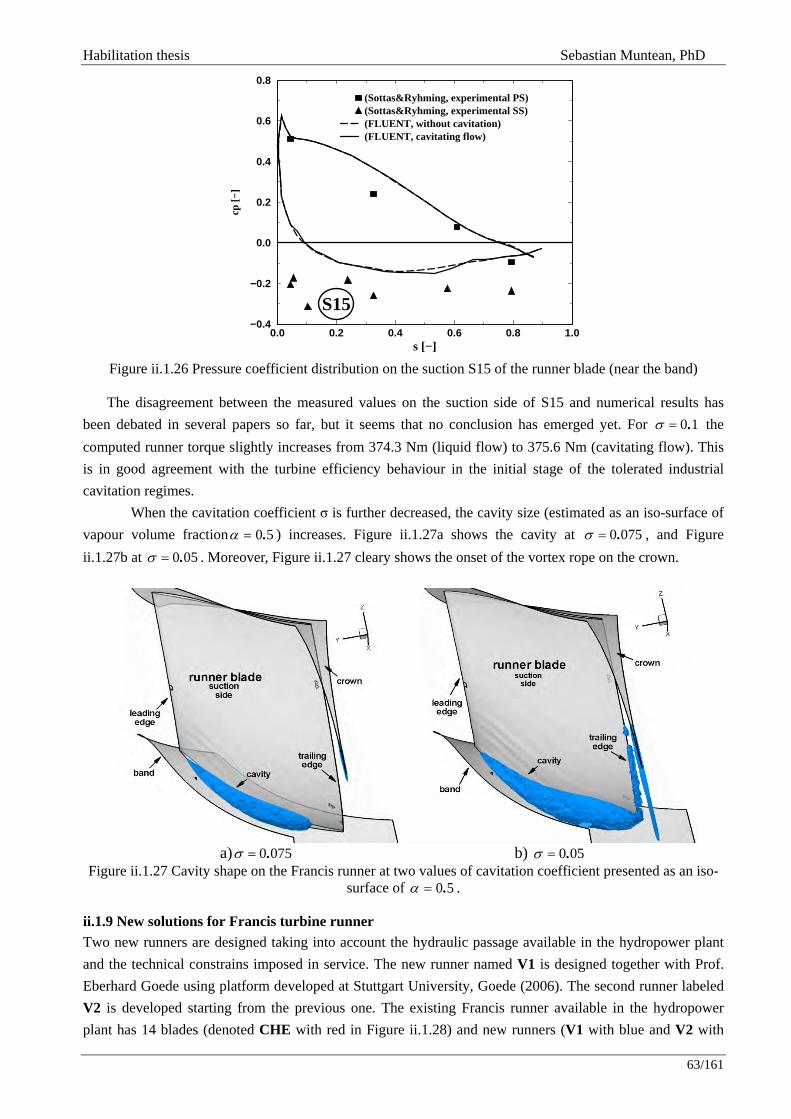
Habilitation thesis Sebastian Muntean, PhD
63/161
Figure ii.1.26 Pressure coefficient distribution on the suction S15 of the runner blade (near the band)
The disagreement between the measured values on the suction side of S15 and numerical results has
been debated in several papers so far, but it seems that no conclusion has emerged yet. For 10.=σ the computed runner torque slightly increases from 374.3 Nm (liquid flow) to 375.6 Nm (cavitating flow). This is in good agreement with the turbine efficiency behaviour in the initial stage of the tolerated industrial cavitation regimes. When the cavitation coefficient σ is further decreased, the cavity size (estimated as an iso-surface of vapour volume fraction 50.=α ) increases. Figure ii.1.27a shows the cavity at 0750.=σ , and Figure ii.1.27b at 050.=σ . Moreover, Figure ii.1.27 cleary shows the onset of the vortex rope on the crown.
a) 0750.=σ b) 050.=σ
Figure ii.1.27 Cavity shape on the Francis runner at two values of cavitation coefficient presented as an iso-surface of 50.=α .
ii.1.9 New solutions for Francis turbine runner Two new runners are designed taking into account the hydraulic passage available in the hydropower plant and the technical constrains imposed in service. The new runner named V1 is designed together with Prof. Eberhard Goede using platform developed at Stuttgart University, Goede (2006). The second runner labeled V2 is developed starting from the previous one. The existing Francis runner available in the hydropower plant has 14 blades (denoted CHE with red in Figure ii.1.28) and new runners (V1 with blue and V2 with
0.0 0.2 0.4 0.6 0.8 1.0s [−]
−0.4
−0.2
0.0
0.2
0.4
0.6
0.8
cp [
−]
(Sottas&Ryhming, experimental PS)(Sottas&Ryhming, experimental SS)(FLUENT, without cavitation)(FLUENT, cavitating flow)
S15

Habilitation thesis Sebastian Muntean, PhD
64/161
green in Figure ii.1.28) are designed with 17 blades. All solutions are investigated using three - dimensional fluid flow simulation using FLUENT (2006) in seven operating points (from 0.7 to 1.2 of best efficiency point discharge).
The normalized discharge and the dimensionless flux of moment of momentum quantities are defined according to eq (ii.1.10):
refQ
QQ =* , 23
22
refref RVMmπρ
≡ , (ii.1.10)
where Q is the turbine discharge, Qref =42.5 m3/s the discharge value corresponding to the best efficiency point, M2 the flux of moment of momentum at the runner outlet, Rref =1.1375 m the runner outlet radius and the transport velocity Vref = ΩRref = 44.67 m/s.
Figure ii.1.28 New runner geometries with 17 blades against old runner geometry with 14 blades
available in the hydropower plant (red): V1 (blue) and V2 (green). The dimensionless flux of moment of momentum at the runner outlet is computed based on numerical
simulation flow and it is plotted in Figure ii.1.29a for each solution. One can observe smaller values for new runners than old one providing a lower level of the residual swirl that is ingested by the draft tube. The hydraulic efficiency over an extended operating range is shown in Figure ii.1.29b for each solution computing the runner flow together with draft tube available in the hydropower plant Susan-Resiga et al. (2012), Susan-Resiga et al. (2014), Ciocan et al. (2014).
A polynomial cubic fitting is applied to hydraulic efficiency (ηh*) for each solution against normalized discharge (Q*). The fitting parameters are included in Table ii.1.6. The main constrain corresponds to the maximum normalized discharge of Q*=1.223 due to the capacity of the tailrace tunnel. As a result, both new solutions are designed with best efficiency point location at lower discharge values than existing one.
Table ii.1.6 The hydraulic efficiency (ηh*) versus normalized discharge (Q*) for each solution Polynomial cubic fitting equations
CHE ηh*=1.73821Q*-0.69318Q*2-0.0725609Q*3 V1 ηh*=2.68918 Q*-2.33751Q*2+0.619441Q*3 V2 ηh*=2.32431Q*-1.74060Q*2+0.389499Q*3
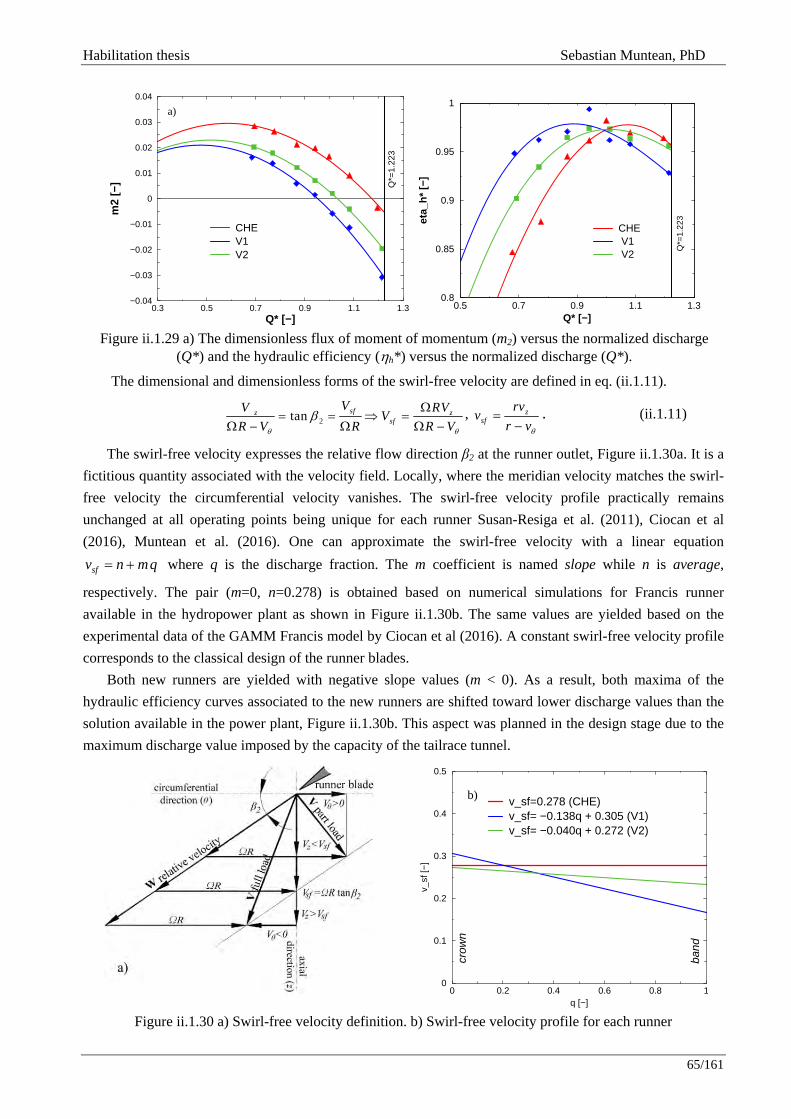
Habilitation thesis Sebastian Muntean, PhD
65/161
Figure ii.1.29 a) The dimensionless flux of moment of momentum (m2) versus the normalized discharge
(Q*) and the hydraulic efficiency (ηh*) versus the normalized discharge (Q*).
The dimensional and dimensionless forms of the swirl-free velocity are defined in eq. (ii.1.11).
2tan sfz z
sf
VV RVVR V R R Vθ θ
β Ω= = ⇒ =
Ω − Ω Ω −, z
sfrvv
r vθ=
−. (ii.1.11)
The swirl-free velocity expresses the relative flow direction β2 at the runner outlet, Figure ii.1.30a. It is a fictitious quantity associated with the velocity field. Locally, where the meridian velocity matches the swirl-free velocity the circumferential velocity vanishes. The swirl-free velocity profile practically remains unchanged at all operating points being unique for each runner Susan-Resiga et al. (2011), Ciocan et al (2016), Muntean et al. (2016). One can approximate the swirl-free velocity with a linear equation
qmnvsf += where q is the discharge fraction. The m coefficient is named slope while n is average,
respectively. The pair (m=0, n=0.278) is obtained based on numerical simulations for Francis runner available in the hydropower plant as shown in Figure ii.1.30b. The same values are yielded based on the experimental data of the GAMM Francis model by Ciocan et al (2016). A constant swirl-free velocity profile corresponds to the classical design of the runner blades.
Both new runners are yielded with negative slope values (m < 0). As a result, both maxima of the hydraulic efficiency curves associated to the new runners are shifted toward lower discharge values than the solution available in the power plant, Figure ii.1.30b. This aspect was planned in the design stage due to the maximum discharge value imposed by the capacity of the tailrace tunnel.
Figure ii.1.30 a) Swirl-free velocity definition. b) Swirl-free velocity profile for each runner
0.3 0.5 0.7 0.9 1.1 1.3Q* [−]
−0.04
−0.03
−0.02
−0.01
0
0.01
0.02
0.03
0.04
m2
[−]
CHEV1V2
Q*=
1.22
3
a)
0.5 0.7 0.9 1.1 1.3Q* [−]
0.8
0.85
0.9
0.95
1
eta_
h*
[−]
CHE V1 V2
Q*=
1.22
3
0 0.2 0.4 0.6 0.8 1q [−]
0
0.1
0.2
0.3
0.4
0.5
v_sf
[−]
v_sf=0.278 (CHE)v_sf= −0.138q + 0.305 (V1)v_sf= −0.040q + 0.272 (V2)
band
crow
n
b)
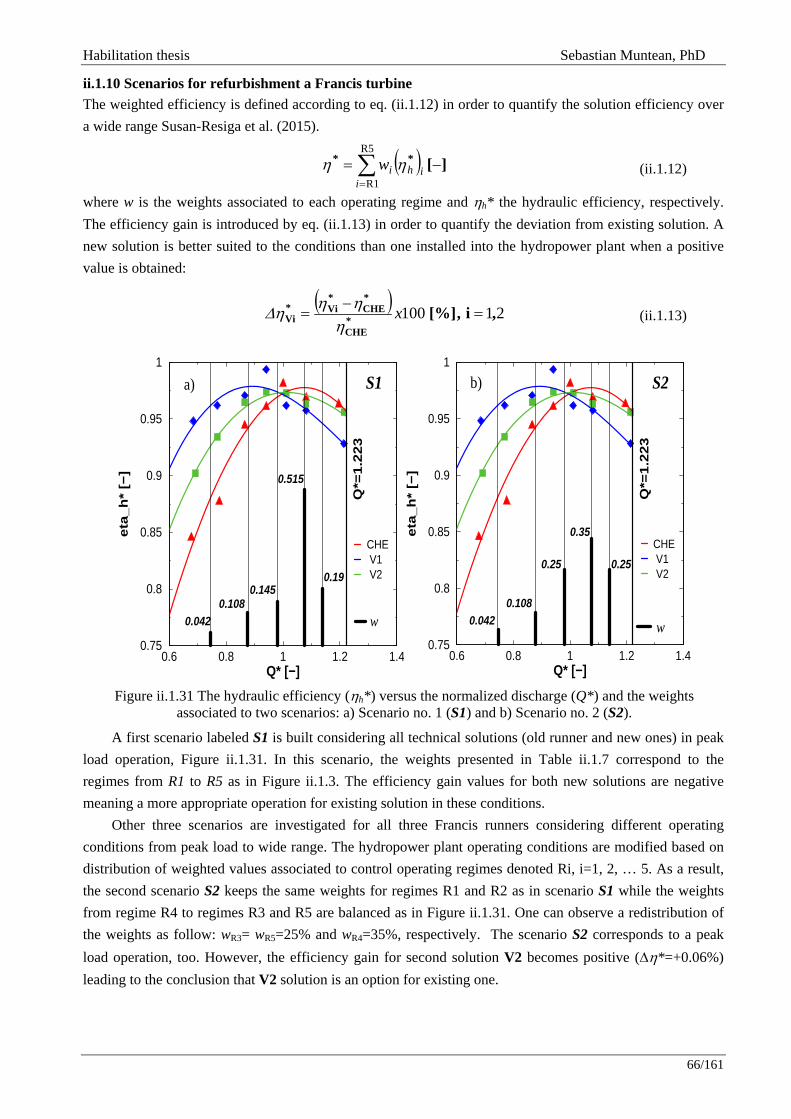
Habilitation thesis Sebastian Muntean, PhD
66/161
ii.1.10 Scenarios for refurbishment a Francis turbine The weighted efficiency is defined according to eq. (ii.1.12) in order to quantify the solution efficiency over a wide range Susan-Resiga et al. (2015).
( ) ][** −= ∑=
R5
R1iihiw ηη (ii.1.12)
where w is the weights associated to each operating regime and ηh* the hydraulic efficiency, respectively. The efficiency gain is introduced by eq. (ii.1.13) in order to quantify the deviation from existing solution. A new solution is better suited to the conditions than one installed into the hydropower plant when a positive value is obtained:
( ) 21100 ,i,[%]*
CHE
*CHE
*Vi*
Vi =−
= xη
ηηηΔ (ii.1.13)
Figure ii.1.31 The hydraulic efficiency (ηh*) versus the normalized discharge (Q*) and the weights associated to two scenarios: a) Scenario no. 1 (S1) and b) Scenario no. 2 (S2).
A first scenario labeled S1 is built considering all technical solutions (old runner and new ones) in peak load operation, Figure ii.1.31. In this scenario, the weights presented in Table ii.1.7 correspond to the regimes from R1 to R5 as in Figure ii.1.3. The efficiency gain values for both new solutions are negative meaning a more appropriate operation for existing solution in these conditions.
Other three scenarios are investigated for all three Francis runners considering different operating conditions from peak load to wide range. The hydropower plant operating conditions are modified based on distribution of weighted values associated to control operating regimes denoted Ri, i=1, 2, … 5. As a result, the second scenario S2 keeps the same weights for regimes R1 and R2 as in scenario S1 while the weights from regime R4 to regimes R3 and R5 are balanced as in Figure ii.1.31. One can observe a redistribution of the weights as follow: wR3= wR5=25% and wR4=35%, respectively. The scenario S2 corresponds to a peak load operation, too. However, the efficiency gain for second solution V2 becomes positive (∆η*=+0.06%) leading to the conclusion that V2 solution is an option for existing one.
0.6 0.8 1 1.2 1.4Q* [−]
0.75
0.8
0.85
0.9
0.95
1
eta
_h
* [−
]
CHE V1 V2
Q*=
1.2
23
S1
0.515
0.1450.108
0.042
0.19
a)
w
0.6 0.8 1 1.2 1.4Q* [−]
0.75
0.8
0.85
0.9
0.95
1
eta
_h
* [−
]
CHE V1 V2
Q*=
1.2
23
S2
0.35
0.25
0.1080.042
0.25
b)
w
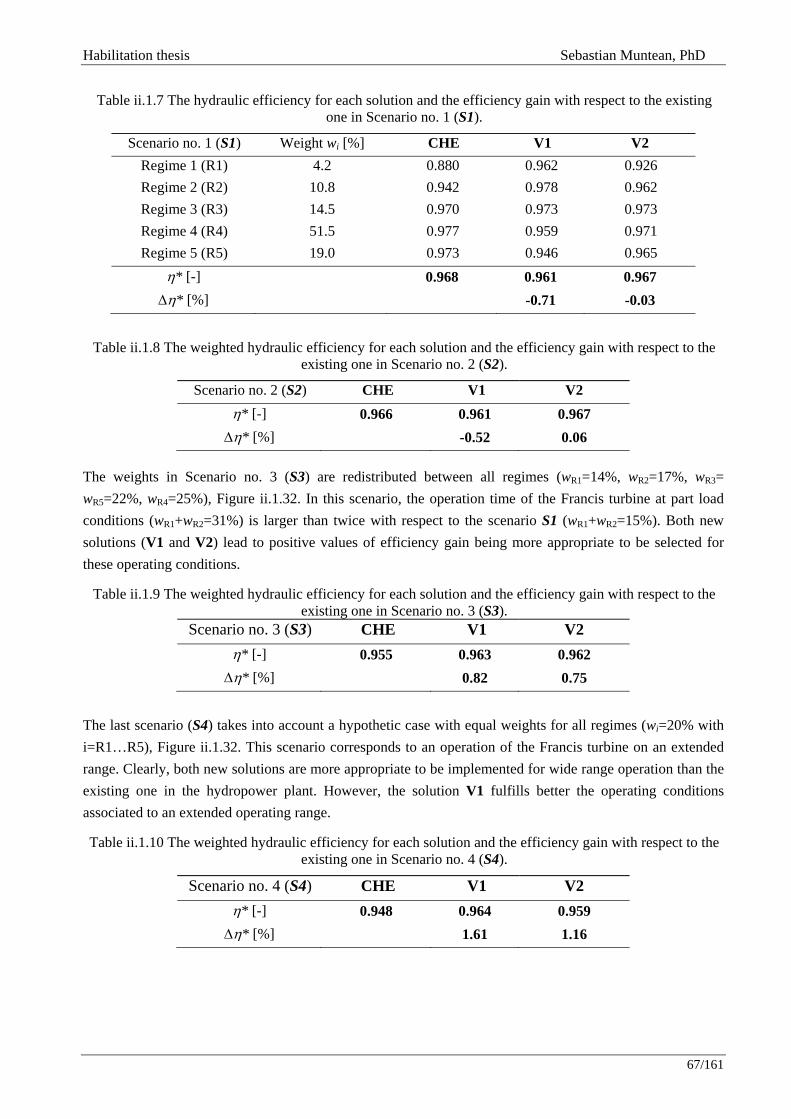
Habilitation thesis Sebastian Muntean, PhD
67/161
Table ii.1.7 The hydraulic efficiency for each solution and the efficiency gain with respect to the existing
one in Scenario no. 1 (S1).
Scenario no. 1 (S1) Weight wi [%] CHE V1 V2 Regime 1 (R1) 4.2 0.880 0.962 0.926 Regime 2 (R2) 10.8 0.942 0.978 0.962 Regime 3 (R3) 14.5 0.970 0.973 0.973 Regime 4 (R4) 51.5 0.977 0.959 0.971 Regime 5 (R5) 19.0 0.973 0.946 0.965
η* [-] 0.968 0.961 0.967 ∆η* [%] -0.71 -0.03
Table ii.1.8 The weighted hydraulic efficiency for each solution and the efficiency gain with respect to the existing one in Scenario no. 2 (S2).
Scenario no. 2 (S2) CHE V1 V2 η* [-] 0.966 0.961 0.967 ∆η* [%] -0.52 0.06
The weights in Scenario no. 3 (S3) are redistributed between all regimes (wR1=14%, wR2=17%, wR3= wR5=22%, wR4=25%), Figure ii.1.32. In this scenario, the operation time of the Francis turbine at part load conditions (wR1+wR2=31%) is larger than twice with respect to the scenario S1 (wR1+wR2=15%). Both new solutions (V1 and V2) lead to positive values of efficiency gain being more appropriate to be selected for these operating conditions.
Table ii.1.9 The weighted hydraulic efficiency for each solution and the efficiency gain with respect to the existing one in Scenario no. 3 (S3).
Scenario no. 3 (S3) CHE V1 V2 η* [-] 0.955 0.963 0.962 ∆η* [%] 0.82 0.75
The last scenario (S4) takes into account a hypothetic case with equal weights for all regimes (wi=20% with i=R1…R5), Figure ii.1.32. This scenario corresponds to an operation of the Francis turbine on an extended range. Clearly, both new solutions are more appropriate to be implemented for wide range operation than the existing one in the hydropower plant. However, the solution V1 fulfills better the operating conditions associated to an extended operating range.
Table ii.1.10 The weighted hydraulic efficiency for each solution and the efficiency gain with respect to the existing one in Scenario no. 4 (S4).
Scenario no. 4 (S4) CHE V1 V2 η* [-] 0.948 0.964 0.959 ∆η* [%] 1.61 1.16
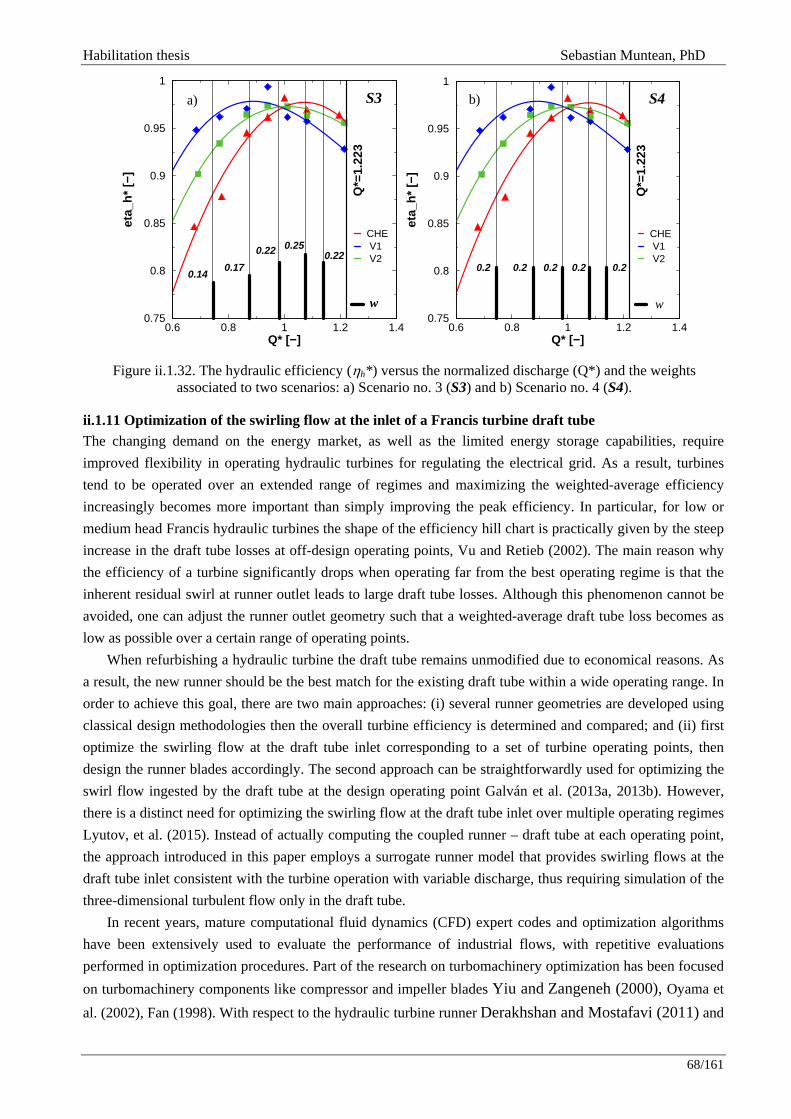
Habilitation thesis Sebastian Muntean, PhD
68/161
Figure ii.1.32. The hydraulic efficiency (ηh*) versus the normalized discharge (Q*) and the weights associated to two scenarios: a) Scenario no. 3 (S3) and b) Scenario no. 4 (S4).
ii.1.11 Optimization of the swirling flow at the inlet of a Francis turbine draft tube The changing demand on the energy market, as well as the limited energy storage capabilities, require improved flexibility in operating hydraulic turbines for regulating the electrical grid. As a result, turbines tend to be operated over an extended range of regimes and maximizing the weighted-average efficiency increasingly becomes more important than simply improving the peak efficiency. In particular, for low or medium head Francis hydraulic turbines the shape of the efficiency hill chart is practically given by the steep increase in the draft tube losses at off-design operating points, Vu and Retieb (2002). The main reason why the efficiency of a turbine significantly drops when operating far from the best operating regime is that the inherent residual swirl at runner outlet leads to large draft tube losses. Although this phenomenon cannot be avoided, one can adjust the runner outlet geometry such that a weighted-average draft tube loss becomes as low as possible over a certain range of operating points.
When refurbishing a hydraulic turbine the draft tube remains unmodified due to economical reasons. As a result, the new runner should be the best match for the existing draft tube within a wide operating range. In order to achieve this goal, there are two main approaches: (i) several runner geometries are developed using classical design methodologies then the overall turbine efficiency is determined and compared; and (ii) first optimize the swirling flow at the draft tube inlet corresponding to a set of turbine operating points, then design the runner blades accordingly. The second approach can be straightforwardly used for optimizing the swirl flow ingested by the draft tube at the design operating point Galván et al. (2013a, 2013b). However, there is a distinct need for optimizing the swirling flow at the draft tube inlet over multiple operating regimes Lyutov, et al. (2015). Instead of actually computing the coupled runner – draft tube at each operating point, the approach introduced in this paper employs a surrogate runner model that provides swirling flows at the draft tube inlet consistent with the turbine operation with variable discharge, thus requiring simulation of the three-dimensional turbulent flow only in the draft tube.
In recent years, mature computational fluid dynamics (CFD) expert codes and optimization algorithms have been extensively used to evaluate the performance of industrial flows, with repetitive evaluations performed in optimization procedures. Part of the research on turbomachinery optimization has been focused on turbomachinery components like compressor and impeller blades Yiu and Zangeneh (2000), Oyama et al. (2002), Fan (1998). With respect to the hydraulic turbine runner Derakhshan and Mostafavi (2011) and
0.6 0.8 1 1.2 1.4Q* [−]
0.75
0.8
0.85
0.9
0.95
1
eta_
h*
[−]
CHE V1 V2
Q*=
1.22
3
S3
0.250.22
0.170.14
0.22
w
a)
0.6 0.8 1 1.2 1.4Q* [−]
0.75
0.8
0.85
0.9
0.95
1
eta_
h*
[−]
CHE V1 V2
Q*=
1.22
3
S4
0.20.20.20.2 0.2
b)
w

Habilitation thesis Sebastian Muntean, PhD
69/161
Lipej and Poloni (2000) used a global optimization method based on artificial neural networks (ANN) and genetic algorithms (GA) coupled with 3D Navier-Stokes flow solver to improve the performance of an initial geometry of a Francis and Kaplan runners, respectively. Pen et al. (2002) combined a multi-variable and multi-objective constrained optimization method with an improved three dimensional inverse computational model of performance for the Kaplan runner. Singh and Nestmann (2010) investigated the effects of exit blade geometry on the part-load performance of low-head, axial flow propeller turbines and concluded that the effects of exit tip modification are significant. Singh and Nestmann (2011) investigated the influence of design parameters in low head axial flow turbines like blade profiles, blade height and blade number for micro-hydro application and concluded that the influence of blade number is more dominating compared to that of the blade height and that choice of blade number should be carefully made. Goede, Ruprecht and Lippold (2006) investigated the draft tube hydrodynamics at part load operation of a turbine with fixed runner blades, such as Francis or propeller turbines, in order to find a correlation between the inlet conditions and the draft tube vortex flow structure. Wu et al. (2007) developed a CFD-based design optimization system that integrates internally blade design tools, automatic mesh generator, parameterized mathematical geometry models, and inviscid quasi-3D CFD codes that enables a quick and efficient design optimization of turbine components. Marjavaara and Lundström (2005) have demonstrated the potential of an in-house procedure to automatically optimize new or existing parts of the waterways in a hydropower plant. Eisinger and Ruprecht (2001) and Lindgren (2002) used the flow information obtained from CFD prediction and detailed measurements to systematically improve in the geometry design.
It can be seen that none of these approaches directly address the turbine performance in term of velocity profiles at the draft tube inlet. A first step in this direction was performed by Galván (2007), who proposed an optimization methodology for maximizing the draft tube performance as a function of the inlet velocity profile. In their work Galván et al. (2013a, 2013b) adapted the three vortex analytical model introduced by Susan-Resiga et al. (2006) to the swirling flow generated by a Kaplan turbine runner, in order to account for the near wall axial velocity increase at the draft tube entrance. Although, this model is quite accurate, it is mainly suitable for a-posteriori analysis due to a relatively large number of parameters. Additionally, it cannot capture the quasi-stagnant central region developed at low discharge regimes. Such analytical model is rather difficult to use in an optimization procedure due to the relatively large number of parameters.
Motivated by these conclusions, Susan-Resiga et al. (2011) developed a new methodology for computing the swirling flow at the draft tube inlet, within a large operating range, prior to the runner design. This methodology is further developed in this paper and used as a runner surrogate model for finding the best runner outlet geometry that provides an optimized runner-draft tube match.
The main objectives can be summarized as follows. First, the methodology is focused on the runner outlet flow, or more precisely on the relative flow angle instead of designing and computing the full runner. This kinematic parameter is expressed via a novel fictitious quantity called the “swirl-free velocity”, which is intuitive and it lends itself to a two-parameter representation. Second, it is introduced a variational formulation for the differential equation that governs the kinematically constrained swirling flow. This is the main ingredient for the runner surrogate model and it allows the development of a central quasi-stagnant region for low turbine discharge, in agreement with experimental and numerical evidence Susan-Resiga et al. (2009). Third, it is defined an objective function corresponding to weighted average draft tube losses. The weights and the operating points (e.g., various discharge values at a constant head) are chosen for each power-plant according to specific operation requirements. This objective function depends on the parameters chosen for the swirl-free velocity profile, thus completing the optimization problem.The main advantage of this methodology is that the runner outlet can be optimized prior to runner blade design. Moreover, the
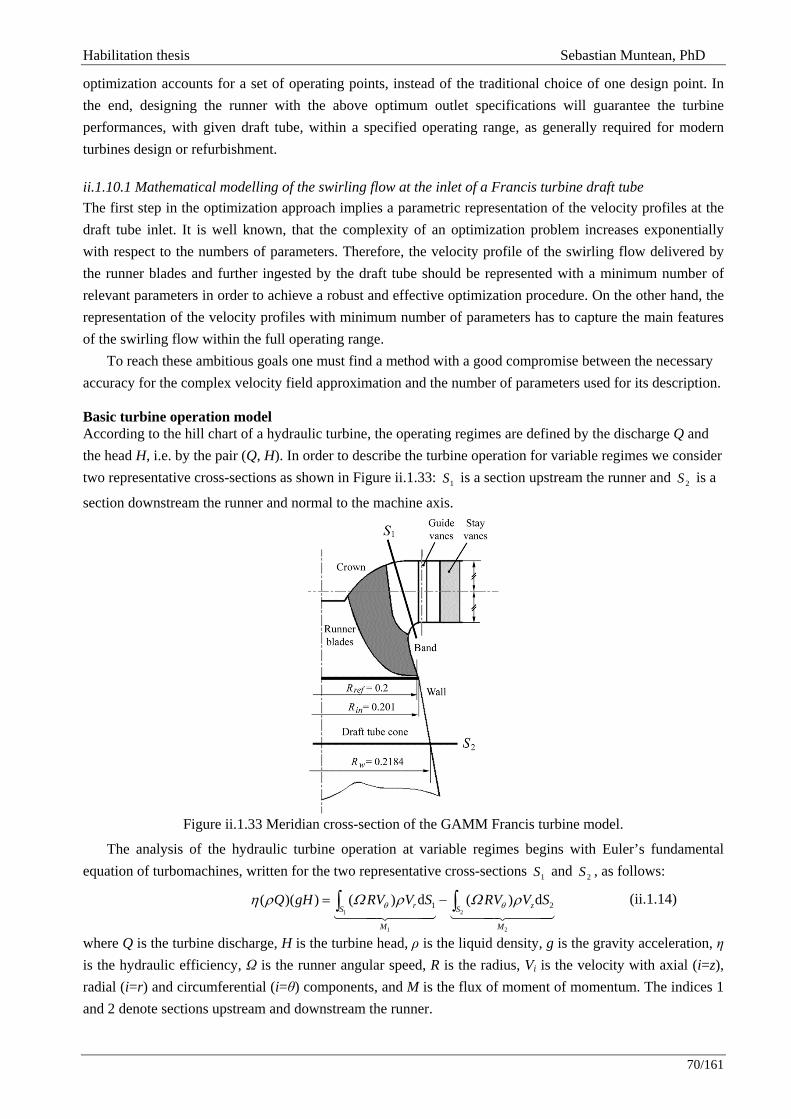
Habilitation thesis Sebastian Muntean, PhD
70/161
optimization accounts for a set of operating points, instead of the traditional choice of one design point. In the end, designing the runner with the above optimum outlet specifications will guarantee the turbine performances, with given draft tube, within a specified operating range, as generally required for modern turbines design or refurbishment.
ii.1.10.1 Mathematical modelling of the swirling flow at the inlet of a Francis turbine draft tube The first step in the optimization approach implies a parametric representation of the velocity profiles at the draft tube inlet. It is well known, that the complexity of an optimization problem increases exponentially with respect to the numbers of parameters. Therefore, the velocity profile of the swirling flow delivered by the runner blades and further ingested by the draft tube should be represented with a minimum number of relevant parameters in order to achieve a robust and effective optimization procedure. On the other hand, the representation of the velocity profiles with minimum number of parameters has to capture the main features of the swirling flow within the full operating range.
To reach these ambitious goals one must find a method with a good compromise between the necessary accuracy for the complex velocity field approximation and the number of parameters used for its description. Basic turbine operation model According to the hill chart of a hydraulic turbine, the operating regimes are defined by the discharge Q and the head H, i.e. by the pair (Q, H). In order to describe the turbine operation for variable regimes we consider two representative cross-sections as shown in Figure ii.1.33: 1S is a section upstream the runner and 2S is a
section downstream the runner and normal to the machine axis.
Figure ii.1.33 Meridian cross-section of the GAMM Francis turbine model.
The analysis of the hydraulic turbine operation at variable regimes begins with Euler’s fundamental equation of turbomachines, written for the two representative cross-sections 1S and 2S , as follows:
θ θη ρ Ω ρ Ω ρ= −∫ ∫144424443 1444244431 2
1 2
1 2( )( ) ( ) d ( ) dr zS S
M M
Q gH RV V S RV V S (ii.1.14)
where Q is the turbine discharge, H is the turbine head, ρ is the liquid density, g is the gravity acceleration, η is the hydraulic efficiency, Ω is the runner angular speed, R is the radius, Vi is the velocity with axial (i=z), radial (i=r) and circumferential (i=θ) components, and M is the flux of moment of momentum. The indices 1 and 2 denote sections upstream and downstream the runner.
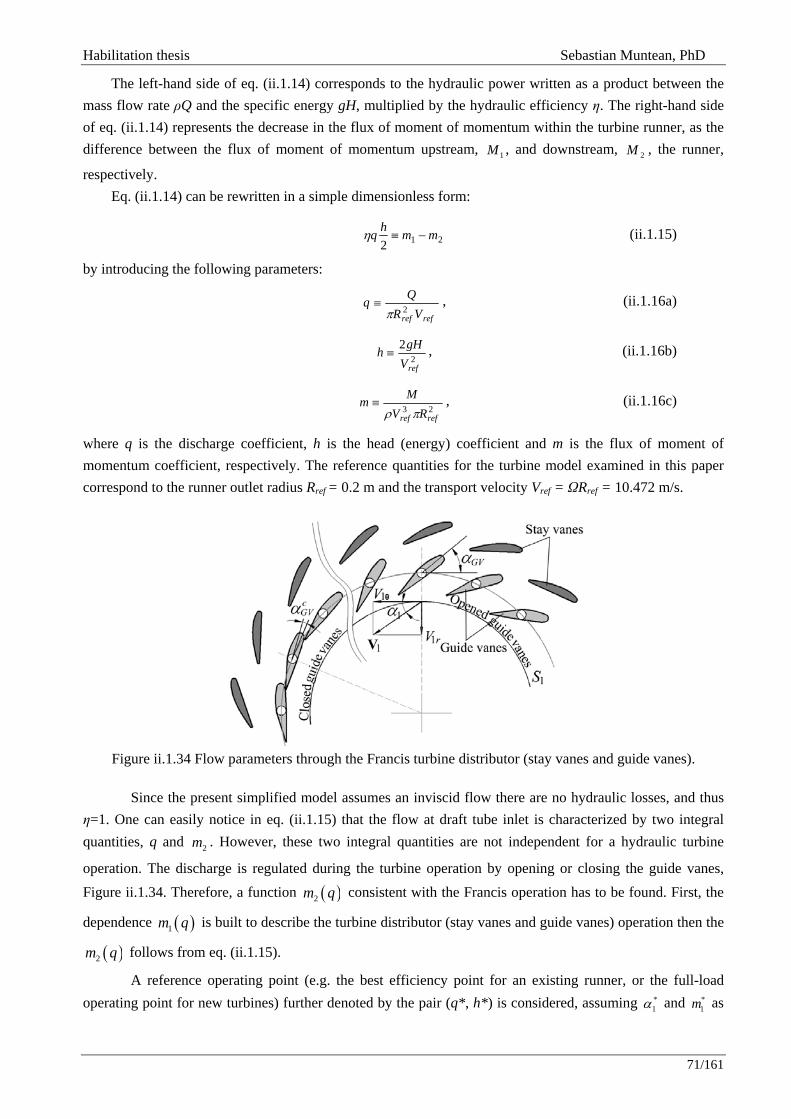
Habilitation thesis Sebastian Muntean, PhD
71/161
The left-hand side of eq. (ii.1.14) corresponds to the hydraulic power written as a product between the mass flow rate ρQ and the specific energy gH, multiplied by the hydraulic efficiency η. The right-hand side of eq. (ii.1.14) represents the decrease in the flux of moment of momentum within the turbine runner, as the difference between the flux of moment of momentum upstream, 1M , and downstream, 2M , the runner,
respectively. Eq. (ii.1.14) can be rewritten in a simple dimensionless form:
212mmhq −≡η (ii.1.15)
by introducing the following parameters:
refref VR
Qq2π
≡ , (ii.1.16a)
2
2
refVgHh ≡ , (ii.1.16b)
23refref RV
Mmπρ
≡ , (ii.1.16c)
where q is the discharge coefficient, h is the head (energy) coefficient and m is the flux of moment of momentum coefficient, respectively. The reference quantities for the turbine model examined in this paper correspond to the runner outlet radius Rref = 0.2 m and the transport velocity Vref = ΩRref = 10.472 m/s.
Figure ii.1.34 Flow parameters through the Francis turbine distributor (stay vanes and guide vanes).
Since the present simplified model assumes an inviscid flow there are no hydraulic losses, and thus
η=1. One can easily notice in eq. (ii.1.15) that the flow at draft tube inlet is characterized by two integral quantities, q and 2m . However, these two integral quantities are not independent for a hydraulic turbine
operation. The discharge is regulated during the turbine operation by opening or closing the guide vanes, Figure ii.1.34. Therefore, a function ( )2m q consistent with the Francis operation has to be found. First, the
dependence ( )1m q is built to describe the turbine distributor (stay vanes and guide vanes) operation then the
( )2m q follows from eq. (ii.1.15).
A reference operating point (e.g. the best efficiency point for an existing runner, or the full-load operating point for new turbines) further denoted by the pair (q*, h*) is considered, assuming *
1α and *1m as

Habilitation thesis Sebastian Muntean, PhD
72/161
known quantities. α1 is the average absolute flow angle downstream the guide vanes, as shown in Figure ii.1.34.
Then ( )1m q is estimated by solving a set of two algebraic equations introduced by Susan-Resiga et al.
(2011):
( )( )
1* *
1
sinsin
αα
= (ii.1.17a)
( )( )
11* *1 1
sin 2sin 2
mm
αα
= (ii.1.17b)
This simplified model assumes that the turbine discharge coefficient q is proportional to the square root
of the head coefficient √ as well as to the sine of the absolute flow angle, ( )1sin α . In order to check this
assumption, it is shown in Figure ii.1.35a the lines h(q) for various guide vane opening, measured for the Gesellschaft für Angewandte Mathematik und Mechanik (GAMM) Francis turbine model, Avellan et al. (1990), Sottas and Ryhming (1993). The experimental data can be quite well approximated with parabola
( ) ( ) 21h q c qα= . As a result, for a constant head the discharge will change with the flow angle 1α as
( ) 11~q c α − . On the other hand, the kinematical considerations lead to the relationship ( )1~ sinq α .
Consequently, our hypothesis is appropriate if ( ) ( )11 1~ sinc α α− . This proportionality is very well confirmed
in Figure ii.1.35b, where the regression line ( ) ( )11 10.5456sinc α α− = fits quite well the data for all five
operating points.
Figure ii.1.35 Head coefficient versus discharge coefficient for various guide vane opening with associated absolute flow angle 1α for the GAMM Francis turbine model and regression fit for ( ) 1
1c α − versus ( )1sin α at a constant head.
Once ( )1m q is known, one can compute ( )2m q from eq. (ii.1.15). The dimensionless flux of moment of
momentum upstream ( ( )1m q , solid line) and downstream ( ( )2m q , dashed line), for the GAMM runner are
shown in Figure ii.1.36. The experimental data for three operating points at part-load (PL) Gros et al. (1998),
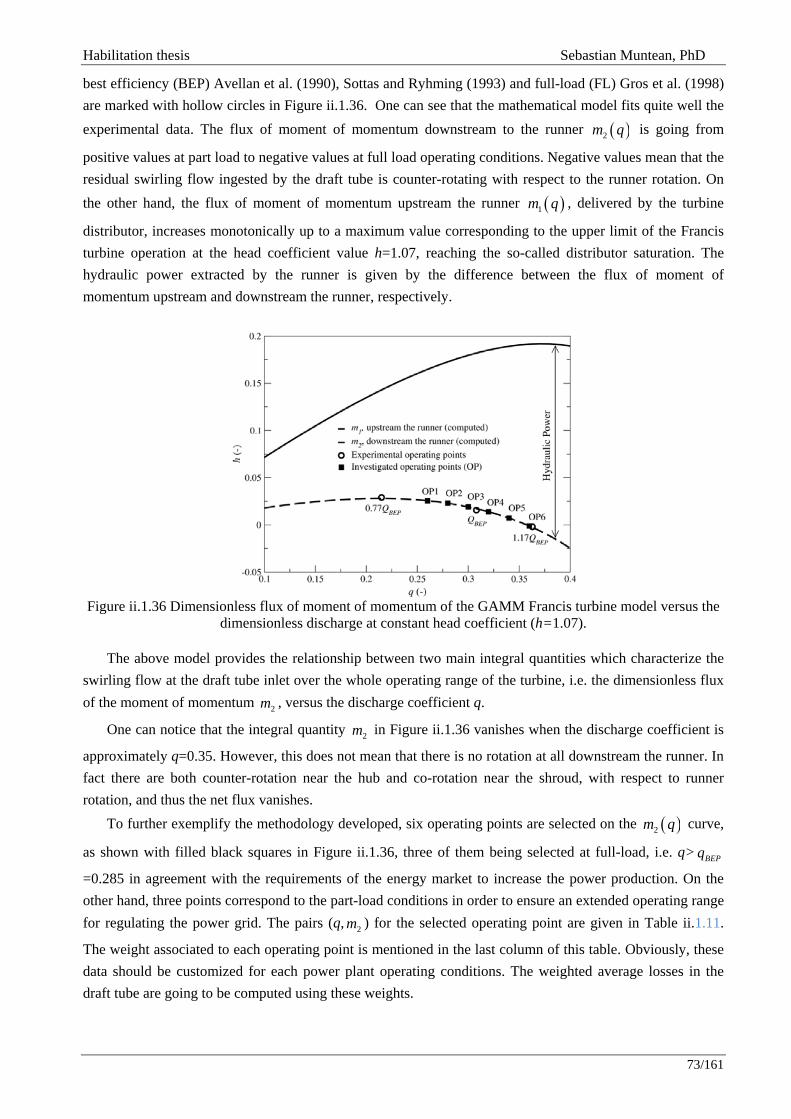
Habilitation thesis Sebastian Muntean, PhD
73/161
best efficiency (BEP) Avellan et al. (1990), Sottas and Ryhming (1993) and full-load (FL) Gros et al. (1998) are marked with hollow circles in Figure ii.1.36. One can see that the mathematical model fits quite well the experimental data. The flux of moment of momentum downstream to the runner ( )2m q is going from
positive values at part load to negative values at full load operating conditions. Negative values mean that the residual swirling flow ingested by the draft tube is counter-rotating with respect to the runner rotation. On the other hand, the flux of moment of momentum upstream the runner ( )1m q , delivered by the turbine
distributor, increases monotonically up to a maximum value corresponding to the upper limit of the Francis turbine operation at the head coefficient value h=1.07, reaching the so-called distributor saturation. The hydraulic power extracted by the runner is given by the difference between the flux of moment of momentum upstream and downstream the runner, respectively.
Figure ii.1.36 Dimensionless flux of moment of momentum of the GAMM Francis turbine model versus the
dimensionless discharge at constant head coefficient (h=1.07).
The above model provides the relationship between two main integral quantities which characterize the swirling flow at the draft tube inlet over the whole operating range of the turbine, i.e. the dimensionless flux of the moment of momentum 2m , versus the discharge coefficient q.
One can notice that the integral quantity 2m in Figure ii.1.36 vanishes when the discharge coefficient is
approximately q=0.35. However, this does not mean that there is no rotation at all downstream the runner. In fact there are both counter-rotation near the hub and co-rotation near the shroud, with respect to runner rotation, and thus the net flux vanishes.
To further exemplify the methodology developed, six operating points are selected on the ( )2m q curve,
as shown with filled black squares in Figure ii.1.36, three of them being selected at full-load, i.e. q> BEPq
=0.285 in agreement with the requirements of the energy market to increase the power production. On the other hand, three points correspond to the part-load conditions in order to ensure an extended operating range for regulating the power grid. The pairs (q, 2m ) for the selected operating point are given in Table ii.1.11.
The weight associated to each operating point is mentioned in the last column of this table. Obviously, these data should be customized for each power plant operating conditions. The weighted average losses in the draft tube are going to be computed using these weights.

Habilitation thesis Sebastian Muntean, PhD
74/161
Table ii.1.11 Investigated operating points at constant head (h=1.07).
Operating point Discharge coefficient
q
Flux of moment of momentum coefficient
2m
Weight
OP1 0.26 0.2560640E-01 10%
OP2 0.28 0.2294782E-01 20% OP3 0.30 0.1910405E-01 20% OP4 0.32 0.1392180E-01 20% OP5 0.34 0.7216558E-02 20% OP6 0.36 -0.1232879E-02 10%
Swirling flow kinematics parameterization Besides the integral constraints specified by q and 2m the swirling flow has to satisfy the kinematic
constraint corresponding with the relative flow angle 2β downstream the runner blade, variable from hub to
shroud. This kinematic constraint is quantified by Susan-Resiga et al. (2011) through the swirl-free velocity concept vsf, see Figure ii.1.25, instead of the relative flow angle 2β . This fictitious swirl-free velocity is
defined in eq (ii.1.10). The swirl-free velocity is just another way to express the relative flow direction 2β , and it is not a
physical quantity associated with the velocity field. Locally where the meridian velocity matches the swirl-free velocity the circumferential velocity vanishes. However, this is not simultaneously occurring for the whole cross section. As a result, generally there is no operating point where the flow rotation vanishes from hub-to-shroud downstream the runner.
The main assumption for the swirl-free velocity is that the relative flow angle is not significantly changing with the operating point. This assumption is particularly valid for Francis runners due to the large number of blades (from 11 to 19) that prevents severe flow detachments of the accelerated flow in the inter-blade channels. However, this assumption can be violated if recirculation is developed when the Francis turbine operates at very low part load conditions.
The normalized discharge 01q is defined as a fraction of the volumetric flow rate passed through a disc
of arbitrary radius r ≤ rw with respect to the overall discharge. As a result, we have 010 1≤ ≤q at each
operating point. The normalized discharge is numerically evaluated from experimental data as:
( ) 001
0
2 'd ' with 0 .
2 'd 'w
r
zwr
z
v r rq r r r
v r r= ≤ ≤∫∫
(ii.1.18)
The plots in Figure ii.1.37 show the swirl-free velocity profile versus the normalized discharge computed from experimental data for three operating regimes at best efficiency point Avellan et al. (1990), Sottas and Ryhming (1993), part and full load regimes Gros et al. (1998), respectively. Three distinct regions can be identified in Figures iii.1.37a and iii.1.37b. The first one corresponds to the main swirling flow which is approximated as inviscid in our simplified model, and includes the data in the middle. The second region close to the axis corresponds to the crown wake, being associated with the viscous effects in the boundary layer developed on the crown surface. The third region corresponds to the boundary layer developed at the wall of the discharge cone and it includes the cumulated development of the boundary layer on the runner
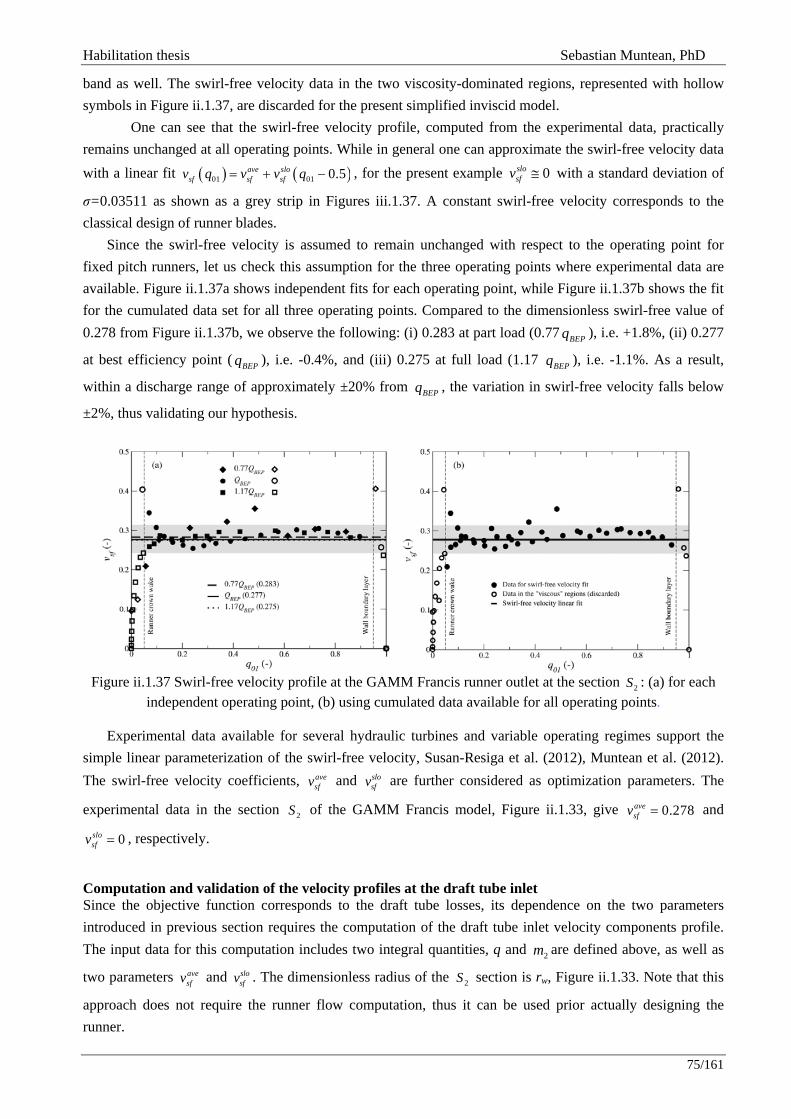
Habilitation thesis Sebastian Muntean, PhD
75/161
band as well. The swirl-free velocity data in the two viscosity-dominated regions, represented with hollow symbols in Figure ii.1.37, are discarded for the present simplified inviscid model.
One can see that the swirl-free velocity profile, computed from the experimental data, practically remains unchanged at all operating points. While in general one can approximate the swirl-free velocity data with a linear fit ( ) ( )01 01 0.5= + −ave slo
sf sf sfv q v v q , for the present example 0≅slosfv with a standard deviation of
σ=0.03511 as shown as a grey strip in Figures iii.1.37. A constant swirl-free velocity corresponds to the classical design of runner blades.
Since the swirl-free velocity is assumed to remain unchanged with respect to the operating point for fixed pitch runners, let us check this assumption for the three operating points where experimental data are available. Figure ii.1.37a shows independent fits for each operating point, while Figure ii.1.37b shows the fit for the cumulated data set for all three operating points. Compared to the dimensionless swirl-free value of 0.278 from Figure ii.1.37b, we observe the following: (i) 0.283 at part load (0.77 BEPq ), i.e. +1.8%, (ii) 0.277
at best efficiency point ( BEPq ), i.e. -0.4%, and (iii) 0.275 at full load (1.17 BEPq ), i.e. -1.1%. As a result,
within a discharge range of approximately ±20% from BEPq , the variation in swirl-free velocity falls below
±2%, thus validating our hypothesis.
Figure ii.1.37 Swirl-free velocity profile at the GAMM Francis runner outlet at the section 2S : (a) for each
independent operating point, (b) using cumulated data available for all operating points.
Experimental data available for several hydraulic turbines and variable operating regimes support the simple linear parameterization of the swirl-free velocity, Susan-Resiga et al. (2012), Muntean et al. (2012). The swirl-free velocity coefficients, ave
sfv and slosfv are further considered as optimization parameters. The
experimental data in the section 2S of the GAMM Francis model, Figure ii.1.33, give 0.278avesfv = and
0slosfv = , respectively.
Computation and validation of the velocity profiles at the draft tube inlet Since the objective function corresponds to the draft tube losses, its dependence on the two parameters introduced in previous section requires the computation of the draft tube inlet velocity components profile. The input data for this computation includes two integral quantities, q and 2m are defined above, as well as
two parameters avesfv and slo
sfv . The dimensionless radius of the 2S section is rw, Figure ii.1.33. Note that this
approach does not require the runner flow computation, thus it can be used prior actually designing the runner.
Habilitation thesis Sebastian Muntean, PhD
76/161
The present simplified model considers steady, axi-symmetric, incompressible and inviscid swirling flow. It is convenient to replace the dimensionless radius r by the modified radial coordinate defined as y ≡ r2. The integral constraints corresponding to the discharge and flux of moment of momentum values can be written as follows:
0
dwy
zv y q=∫ , (ii.1.19)
20
d1 myyvvv
z
wy
sf
z =⎟⎟⎠
⎞⎜⎜⎝
⎛−∫ . (ii.1.20)
Within the assumption of columnar flow (i.e. negligible radial velocity), valid in the neighborhood of a Francis turbine throat, the differential equation that governs the swirling flow can be written in dimensionless form:
0dd
dd2
dd4
2
2=++−
ψψ i
yc
vy sf (ii.1.21)
where
θψ rvc
vy
z ≡= ,2d
d and cpvv
i z −++
≡2
22θ . (ii.1.22)
The above differential equation is written for the Stokes’ streamfunction ψ, and it involves both the circulation function c(y) and the rothalpy i(ψ). The differential equation (ii.1.21) is derived from a more general model for axi-symmetric swirling flows in turbomachines Bosman and El-Shaarawi (1977), based on the steady Euler equation, Muntean et al. (2012). Equation (ii.1.21) has the Stokes’ streamfunction as the unknown function, since it is far more convenient to solve for a single scalar variable than for the primitive variables, velocity vector and pressure. The boundary conditions for the differential equation (ii.1.21) are ψ=0 on the axis and ψ=q/2 on the wall, respectively. The equivalent variational formulation requires the minimization of the functional,
( ) ( ) yicy
cy
Fwy
d2d
d20
22
∫ ⎥⎥⎦
⎤
⎢⎢⎣
⎡++−⎟⎟
⎠
⎞⎜⎜⎝
⎛= ψψψ . (ii.1.23)
Generally, the rothalpy is quasi-constant across streamtubes, thus the last term in the eq. (ii.1.21) is negligible, and it simply leads to an arbitrary constant added to the functional of eq. (ii.1.23). One of the advantages of the present variational formulation is that it can capture the development of the central quasi-stagnant (dead water) region when operating the turbine at off-design operating points. In this case, the lower limit of the integral in eq. (ii.1.23) becomes an additional unknown of the problem, being the radius of the central quasi-stagnant (dead water) region ys ≥ 0.
The velocity profile at the draft tube inlet can now be computed using the mathematical model for the constrained swirling flow. The problem can be summarized as follows: given the volumetric flow rate q through the cross-section of radial extent yw, the flux of moment of momentum 2m and the swirl-free
velocity profile vsf, find the axial velocity vz and the stagnant region extent ys by minimizing the functional:
( )2 2
2, 1 d2 2
w
s
yz z
z ssfy
v vyF v y yv
⎡ ⎤⎛ ⎞= + −⎢ ⎥⎜ ⎟⎜ ⎟⎢ ⎥⎝ ⎠⎣ ⎦∫ (ii.1.24)
subject to the integral constraints:
Habilitation thesis Sebastian Muntean, PhD
77/161
dw
s
y
zy
v y q=∫ , (ii.1.25)
21 dw
s
yz
zsfy
vv y y m
v⎛ ⎞− =⎜ ⎟⎜ ⎟
⎝ ⎠∫ . (ii.1.26)
Once the axial velocity component is obtained, the circumferential component immediately follows as:
( ) 1 z
sf
vv r r
vθ
⎛ ⎞= −⎜ ⎟⎜ ⎟
⎝ ⎠. (ii.1.27)
The numerical solution of the problem defined by eqs (ii.1.24), (ii.1.25) and (ii.1.26) is detailed by Susan-Resiga et al. (2011), and it employs a Fourier-Bessel series for the unknown axial velocity profile.
Although the above simplified flow model assumes a columnar flow, i.e. a flow with vanishing radial velocity, neglecting the radial velocity may lead to spurious flow detachment at the wall, with accuracy loss in estimating the draft tube hydraulic losses. A first approximation of the radial velocity component was developed for the Turbine-99 test case by Bergström (1999) assuming a linear distribution of the meridian flow angle. Cervantes and Gustavsson (2007) further analyzed this radial velocity component in an attempt to develop a more rigorous approach. Tridon et al. (2010) propose a new analytical representation using a superposition of three vortices adapted after Susan-Resiga et al. (2006).
Analytical developments for the swirling flow models led Muntean et al. (2012) to a more rigorous relationship between the radial and axial velocity components, which is further employed in the present methodology, i.e.:
( ) ( ) dd
wr z
w
rrv r v rr z
= (ii.1.28)
where r/rw is the normalized radius and drw/ dz is the cone wall slope, respectively. Equation (ii.1.28) satisfies two important requirements: (i) the radial velocity vanishes at the axis, and (ii) the meridian velocity is tangent to the wall.
Figure ii.1.38 shows the computed velocity profiles (axial, circumferential and radial velocity components) versus the dimensionless radius on the 2S section, as well as the experimental data from Sottas
and Ryhming (1993). One can observe a very good agreement between computed velocity and the experimental data. One exception can be seen in the central region corresponding to the runner crown wake, where viscous effects are dominant. This is a limitation of the present model based on the inviscid assumption. Nevertheless, it is important to note that the quasi-analytical model captures fairly well the stagnant region developed at part load conditions. Moreover, one should bear in mind that the present theoretical model is developed for rapid a-priori assessment of the swirling flow at the draft tube inlet to be used in the optimization procedure.
In conclusion, it is considered that the above runner surrogate model to be accurate enough for optimizing the draft tube inlet swirl via the swirl-free velocity parameters.
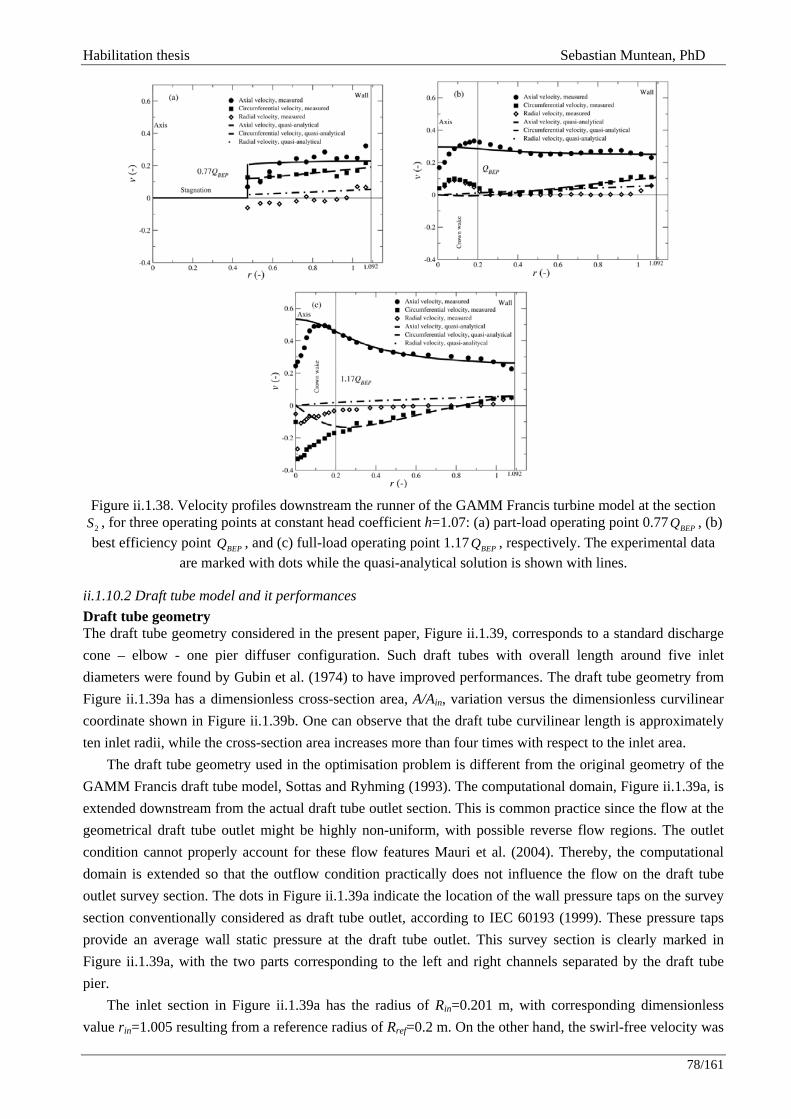
Habilitation thesis Sebastian Muntean, PhD
78/161
Figure ii.1.38. Velocity profiles downstream the runner of the GAMM Francis turbine model at the section 2S , for three operating points at constant head coefficient h=1.07: (a) part-load operating point 0.77 BEPQ , (b) best efficiency point BEPQ , and (c) full-load operating point 1.17 BEPQ , respectively. The experimental data
are marked with dots while the quasi-analytical solution is shown with lines.
ii.1.10.2 Draft tube model and it performances Draft tube geometry The draft tube geometry considered in the present paper, Figure ii.1.39, corresponds to a standard discharge cone – elbow - one pier diffuser configuration. Such draft tubes with overall length around five inlet diameters were found by Gubin et al. (1974) to have improved performances. The draft tube geometry from Figure ii.1.39a has a dimensionless cross-section area, A/Ain, variation versus the dimensionless curvilinear coordinate shown in Figure ii.1.39b. One can observe that the draft tube curvilinear length is approximately ten inlet radii, while the cross-section area increases more than four times with respect to the inlet area.
The draft tube geometry used in the optimisation problem is different from the original geometry of the GAMM Francis draft tube model, Sottas and Ryhming (1993). The computational domain, Figure ii.1.39a, is extended downstream from the actual draft tube outlet section. This is common practice since the flow at the geometrical draft tube outlet might be highly non-uniform, with possible reverse flow regions. The outlet condition cannot properly account for these flow features Mauri et al. (2004). Thereby, the computational domain is extended so that the outflow condition practically does not influence the flow on the draft tube outlet survey section. The dots in Figure ii.1.39a indicate the location of the wall pressure taps on the survey section conventionally considered as draft tube outlet, according to IEC 60193 (1999). These pressure taps provide an average wall static pressure at the draft tube outlet. This survey section is clearly marked in Figure ii.1.39a, with the two parts corresponding to the left and right channels separated by the draft tube pier.
The inlet section in Figure ii.1.39a has the radius of Rin=0.201 m, with corresponding dimensionless value rin=1.005 resulting from a reference radius of Rref=0.2 m. On the other hand, the swirl-free velocity was
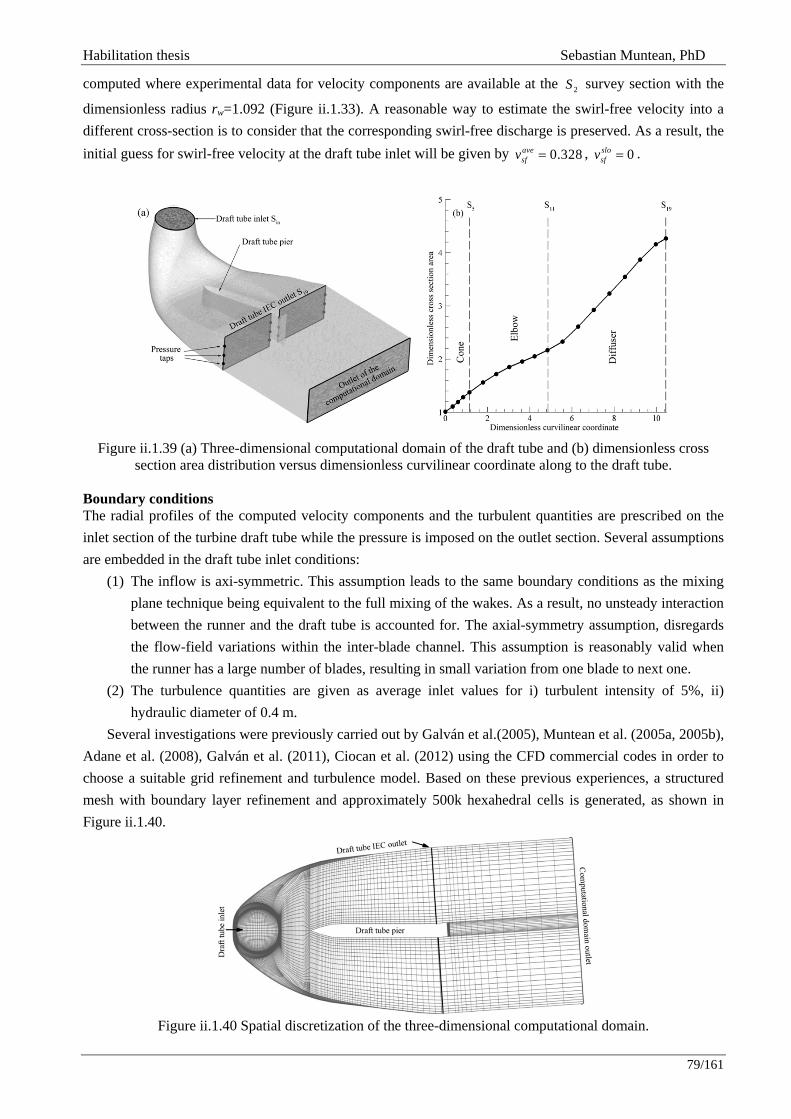
Habilitation thesis Sebastian Muntean, PhD
79/161
computed where experimental data for velocity components are available at the 2S survey section with the
dimensionless radius rw=1.092 (Figure ii.1.33). A reasonable way to estimate the swirl-free velocity into a different cross-section is to consider that the corresponding swirl-free discharge is preserved. As a result, the initial guess for swirl-free velocity at the draft tube inlet will be given by 0.328=ave
sfv , 0slosfv = .
Figure ii.1.39 (a) Three-dimensional computational domain of the draft tube and (b) dimensionless cross
section area distribution versus dimensionless curvilinear coordinate along to the draft tube. Boundary conditions The radial profiles of the computed velocity components and the turbulent quantities are prescribed on the inlet section of the turbine draft tube while the pressure is imposed on the outlet section. Several assumptions are embedded in the draft tube inlet conditions:
(1) The inflow is axi-symmetric. This assumption leads to the same boundary conditions as the mixing plane technique being equivalent to the full mixing of the wakes. As a result, no unsteady interaction between the runner and the draft tube is accounted for. The axial-symmetry assumption, disregards the flow-field variations within the inter-blade channel. This assumption is reasonably valid when the runner has a large number of blades, resulting in small variation from one blade to next one.
(2) The turbulence quantities are given as average inlet values for i) turbulent intensity of 5%, ii) hydraulic diameter of 0.4 m.
Several investigations were previously carried out by Galván et al.(2005), Muntean et al. (2005a, 2005b), Adane et al. (2008), Galván et al. (2011), Ciocan et al. (2012) using the CFD commercial codes in order to choose a suitable grid refinement and turbulence model. Based on these previous experiences, a structured mesh with boundary layer refinement and approximately 500k hexahedral cells is generated, as shown in Figure ii.1.40.
Figure ii.1.40 Spatial discretization of the three-dimensional computational domain.
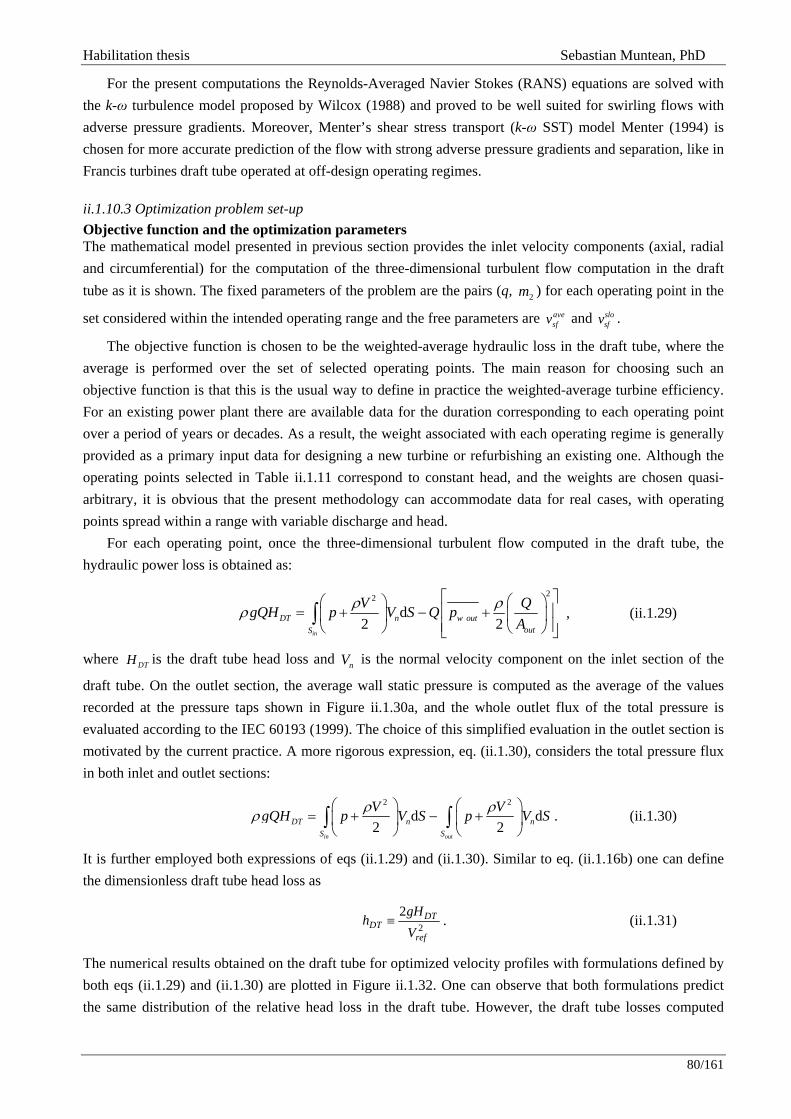
Habilitation thesis Sebastian Muntean, PhD
80/161
For the present computations the Reynolds-Averaged Navier Stokes (RANS) equations are solved with the k-ω turbulence model proposed by Wilcox (1988) and proved to be well suited for swirling flows with adverse pressure gradients. Moreover, Menter’s shear stress transport (k-ω SST) model Menter (1994) is chosen for more accurate prediction of the flow with strong adverse pressure gradients and separation, like in Francis turbines draft tube operated at off-design operating regimes.
ii.1.10.3 Optimization problem set-up Objective function and the optimization parameters The mathematical model presented in previous section provides the inlet velocity components (axial, radial and circumferential) for the computation of the three-dimensional turbulent flow computation in the draft tube as it is shown. The fixed parameters of the problem are the pairs (q, 2m ) for each operating point in the
set considered within the intended operating range and the free parameters are avesfv and slo
sfv .
The objective function is chosen to be the weighted-average hydraulic loss in the draft tube, where the average is performed over the set of selected operating points. The main reason for choosing such an objective function is that this is the usual way to define in practice the weighted-average turbine efficiency. For an existing power plant there are available data for the duration corresponding to each operating point over a period of years or decades. As a result, the weight associated with each operating regime is generally provided as a primary input data for designing a new turbine or refurbishing an existing one. Although the operating points selected in Table ii.1.11 correspond to constant head, and the weights are chosen quasi-arbitrary, it is obvious that the present methodology can accommodate data for real cases, with operating points spread within a range with variable discharge and head.
For each operating point, once the three-dimensional turbulent flow computed in the draft tube, the hydraulic power loss is obtained as:
22
d2 2
in
DT n w outoutS
V QgQH p V S Q pA
ρ ρρ⎡ ⎤⎛ ⎞⎛ ⎞⎢ ⎥= + − + ⎜ ⎟⎜ ⎟⎢ ⎥⎝ ⎠ ⎝ ⎠⎣ ⎦
∫ , (ii.1.29)
where DTH is the draft tube head loss and nV is the normal velocity component on the inlet section of the
draft tube. On the outlet section, the average wall static pressure is computed as the average of the values recorded at the pressure taps shown in Figure ii.1.30a, and the whole outlet flux of the total pressure is evaluated according to the IEC 60193 (1999). The choice of this simplified evaluation in the outlet section is motivated by the current practice. A more rigorous expression, eq. (ii.1.30), considers the total pressure flux in both inlet and outlet sections:
2 2
d d2 2
in out
DT n nS S
V VgQH p V S p V Sρ ρρ⎛ ⎞ ⎛ ⎞
= + − +⎜ ⎟ ⎜ ⎟⎝ ⎠ ⎝ ⎠∫ ∫ . (ii.1.30)
It is further employed both expressions of eqs (ii.1.29) and (ii.1.30). Similar to eq. (ii.1.16b) one can define the dimensionless draft tube head loss as
22
ref
DTDT
VgH
h ≡ . (ii.1.31)
The numerical results obtained on the draft tube for optimized velocity profiles with formulations defined by both eqs (ii.1.29) and (ii.1.30) are plotted in Figure ii.1.32. One can observe that both formulations predict the same distribution of the relative head loss in the draft tube. However, the draft tube losses computed
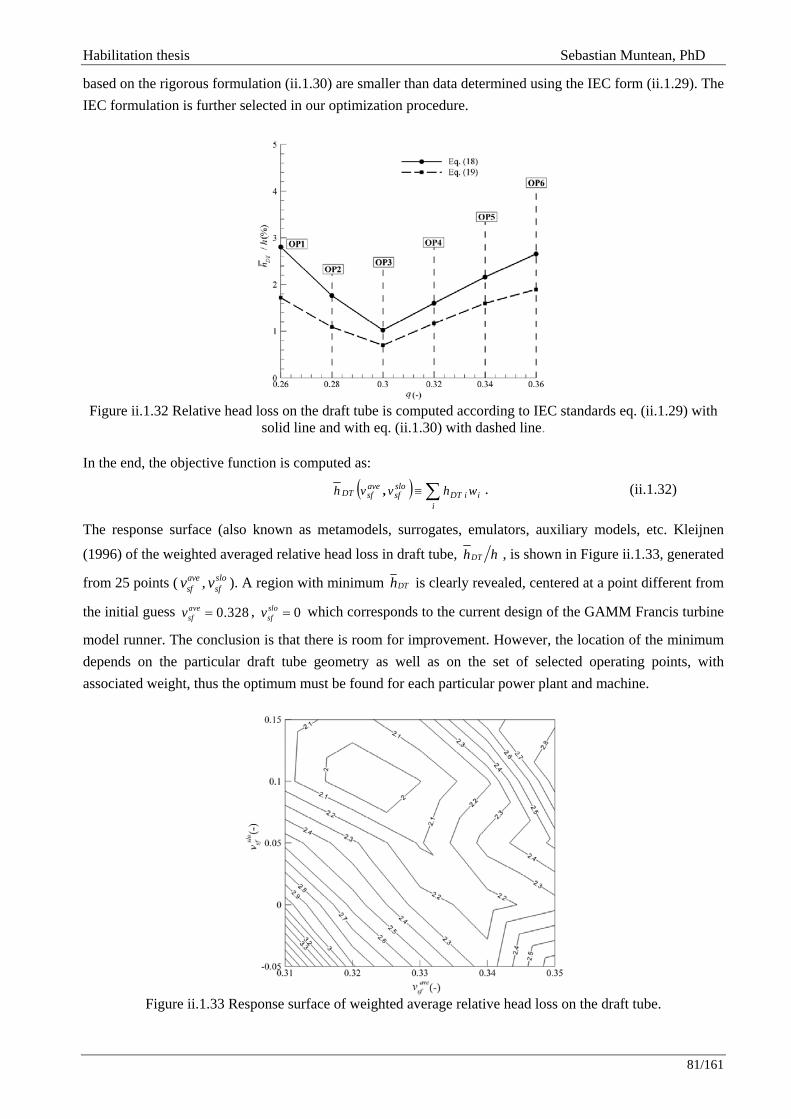
Habilitation thesis Sebastian Muntean, PhD
81/161
based on the rigorous formulation (ii.1.30) are smaller than data determined using the IEC form (ii.1.29). The IEC formulation is further selected in our optimization procedure.
Figure ii.1.32 Relative head loss on the draft tube is computed according to IEC standards eq. (ii.1.29) with
solid line and with eq. (ii.1.30) with dashed line. In the end, the objective function is computed as:
( ) ∑≡i
iiDTslosf
avesfDT whvvh , . (ii.1.32)
The response surface (also known as metamodels, surrogates, emulators, auxiliary models, etc. Kleijnen
(1996) of the weighted averaged relative head loss in draft tube, DTh h , is shown in Figure ii.1.33, generated
from 25 points ( avesfv , slo
sfv ). A region with minimum DTh is clearly revealed, centered at a point different from
the initial guess 0.328avesfv = , 0slo
sfv = which corresponds to the current design of the GAMM Francis turbine
model runner. The conclusion is that there is room for improvement. However, the location of the minimum depends on the particular draft tube geometry as well as on the set of selected operating points, with associated weight, thus the optimum must be found for each particular power plant and machine.
Figure ii.1.33 Response surface of weighted average relative head loss on the draft tube.
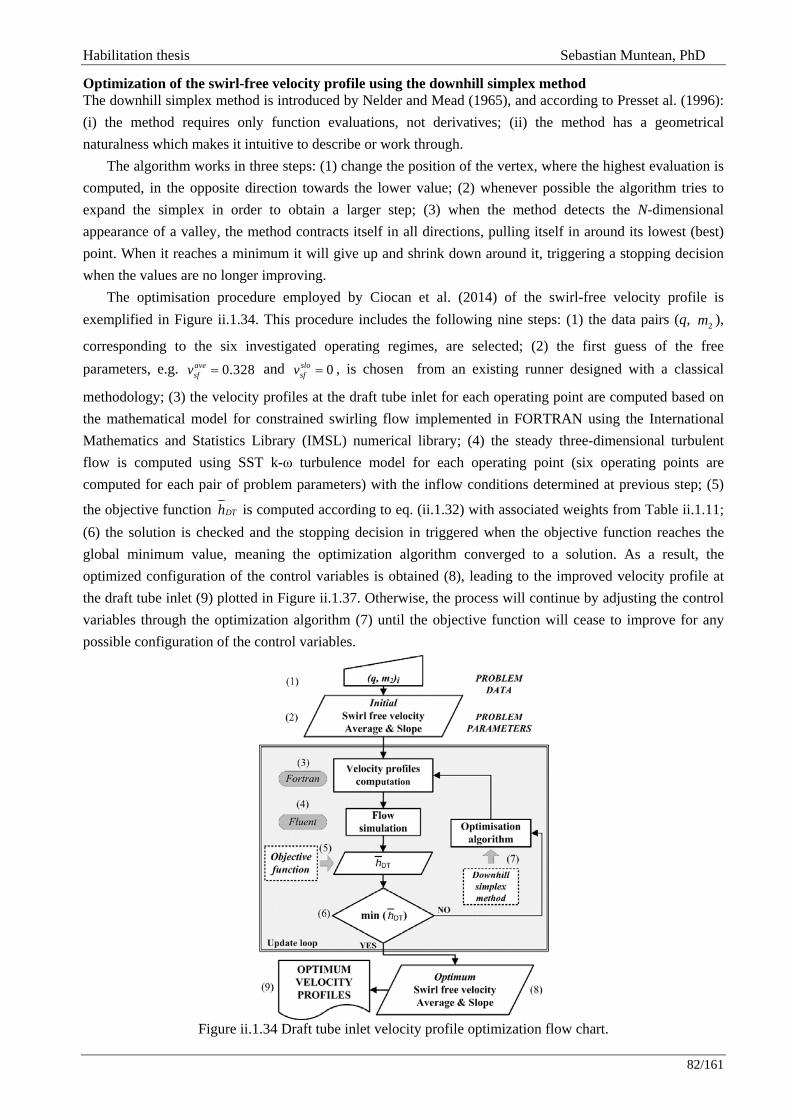
Habilitation thesis Sebastian Muntean, PhD
82/161
Optimization of the swirl-free velocity profile using the downhill simplex method The downhill simplex method is introduced by Nelder and Mead (1965), and according to Presset al. (1996): (i) the method requires only function evaluations, not derivatives; (ii) the method has a geometrical naturalness which makes it intuitive to describe or work through.
The algorithm works in three steps: (1) change the position of the vertex, where the highest evaluation is computed, in the opposite direction towards the lower value; (2) whenever possible the algorithm tries to expand the simplex in order to obtain a larger step; (3) when the method detects the N-dimensional appearance of a valley, the method contracts itself in all directions, pulling itself in around its lowest (best) point. When it reaches a minimum it will give up and shrink down around it, triggering a stopping decision when the values are no longer improving.
The optimisation procedure employed by Ciocan et al. (2014) of the swirl-free velocity profile is exemplified in Figure ii.1.34. This procedure includes the following nine steps: (1) the data pairs (q, 2m ),
corresponding to the six investigated operating regimes, are selected; (2) the first guess of the free parameters, e.g. 0.328ave
sfv = and 0slosfv = , is chosen from an existing runner designed with a classical
methodology; (3) the velocity profiles at the draft tube inlet for each operating point are computed based on the mathematical model for constrained swirling flow implemented in FORTRAN using the International Mathematics and Statistics Library (IMSL) numerical library; (4) the steady three-dimensional turbulent flow is computed using SST k-ω turbulence model for each operating point (six operating points are computed for each pair of problem parameters) with the inflow conditions determined at previous step; (5)
the objective function DTh is computed according to eq. (ii.1.32) with associated weights from Table ii.1.11; (6) the solution is checked and the stopping decision in triggered when the objective function reaches the global minimum value, meaning the optimization algorithm converged to a solution. As a result, the optimized configuration of the control variables is obtained (8), leading to the improved velocity profile at the draft tube inlet (9) plotted in Figure ii.1.37. Otherwise, the process will continue by adjusting the control variables through the optimization algorithm (7) until the objective function will cease to improve for any possible configuration of the control variables.
Figure ii.1.34 Draft tube inlet velocity profile optimization flow chart.

Habilitation thesis Sebastian Muntean, PhD
83/161
Particularly, eight successive moves of the Downhill Simplex Method are required to reach the optimum swirl-free velocity configuration, corresponding to the optimized runner geometry at the trailing edge, starting from the existing geometry. The moves are summarized in Table ii.1.12 and plotted in Figure ii.1.35. Note that such an optimum is depending on the particular requirements for turbine operation, as well as on the geometry of an existing draft tube, thus there is no “universal” optimum runner blade geometry at the trailing edge.
Figure ii.1.35 Downhill simplex method steps for optimisation the GAMM Francis runner: step 1 –
reflection; step 2 – reflection; step 3 – reflection; step 4 – reflection and expansion; step 5 – reflection; step 6 – reflection; step 7 – contraction; step 8 (optimum) – reflection.
Table ii.1.12 Downhill simplex moves toward the optimised swirl free velocity configuration.
Step No. Swirl-free velocity configuration
Objective function value
Simplex type step
Initial 0.3280, 0ave slosf sfv v= = 2.3080 -
1 0.3301, 0.0500= =ave slosf sfv v 2.0870 Reflection
2 0.3280, 0.1000= =ave slosf sfv v 1.9806 Reflection
3 0.3255, 0.0975ave slosf sfv v= = 1.9633 Reflection
4 0.3240, 0.0985= =ave slosf sfv v 1.9484
Reflection +
Expansion 5 0.3210, 0.1040= =ave slo
sf sfv v 1.9170 Reflection 6 0.3205, 0.1050= =ave slo
sf sfv v 1.9124 Reflection 7 0.3200, 0.1125= =ave slo
sf sfv v 1.9119 Contraction Optimum 0.3200, 0.1250= =ave slo
sf sfv v 1.8570 Reflection
The optimum configuration of the swirl-free velocity profile associated to the considered draft tube corresponds to 0.32ave
sfv = , 0.125slosfv = leading to the minimum weighted relative head loss of the draft tube
1.857%DTh h = . The location of the optimum point computed with the Downhill Simplex Method
algorithm in the parameter space is clearly shown in Figure ii.1.36.
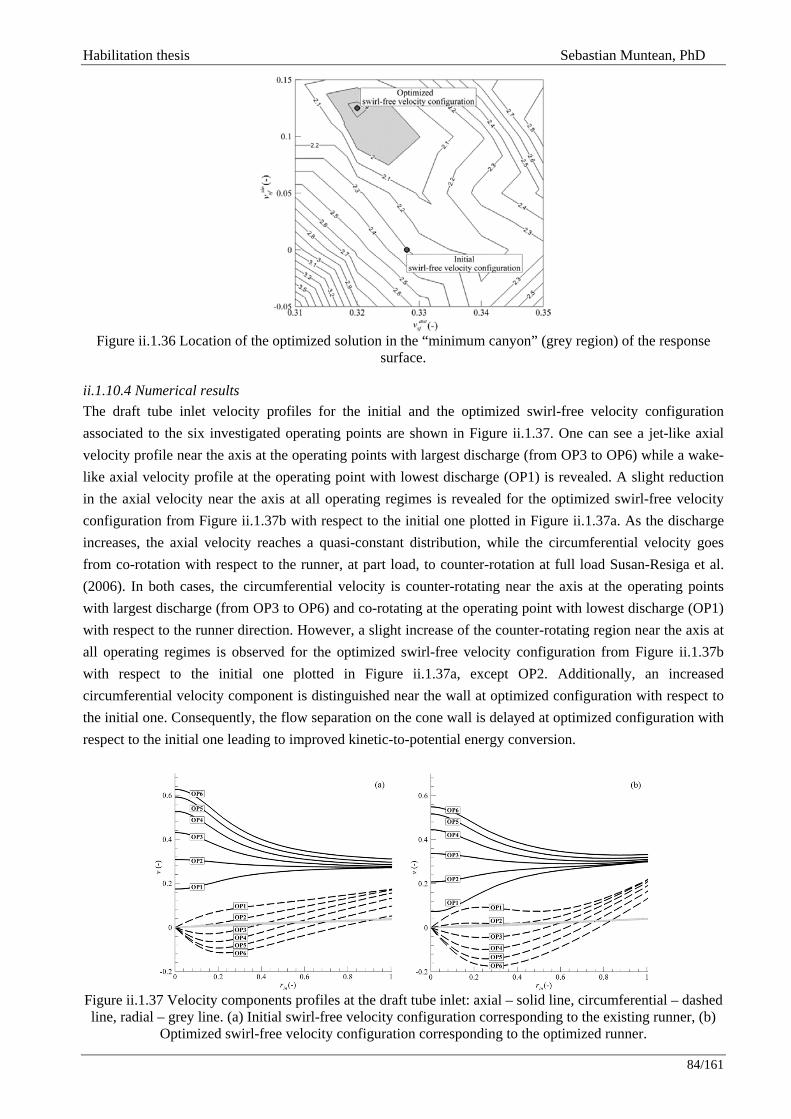
Habilitation thesis Sebastian Muntean, PhD
84/161
Figure ii.1.36 Location of the optimized solution in the “minimum canyon” (grey region) of the response
surface.
ii.1.10.4 Numerical results The draft tube inlet velocity profiles for the initial and the optimized swirl-free velocity configuration associated to the six investigated operating points are shown in Figure ii.1.37. One can see a jet-like axial velocity profile near the axis at the operating points with largest discharge (from OP3 to OP6) while a wake-like axial velocity profile at the operating point with lowest discharge (OP1) is revealed. A slight reduction in the axial velocity near the axis at all operating regimes is revealed for the optimized swirl-free velocity configuration from Figure ii.1.37b with respect to the initial one plotted in Figure ii.1.37a. As the discharge increases, the axial velocity reaches a quasi-constant distribution, while the circumferential velocity goes from co-rotation with respect to the runner, at part load, to counter-rotation at full load Susan-Resiga et al. (2006). In both cases, the circumferential velocity is counter-rotating near the axis at the operating points with largest discharge (from OP3 to OP6) and co-rotating at the operating point with lowest discharge (OP1) with respect to the runner direction. However, a slight increase of the counter-rotating region near the axis at all operating regimes is observed for the optimized swirl-free velocity configuration from Figure ii.1.37b with respect to the initial one plotted in Figure ii.1.37a, except OP2. Additionally, an increased circumferential velocity component is distinguished near the wall at optimized configuration with respect to the initial one. Consequently, the flow separation on the cone wall is delayed at optimized configuration with respect to the initial one leading to improved kinetic-to-potential energy conversion.
Figure ii.1.37 Velocity components profiles at the draft tube inlet: axial – solid line, circumferential – dashed line, radial – grey line. (a) Initial swirl-free velocity configuration corresponding to the existing runner, (b)
Optimized swirl-free velocity configuration corresponding to the optimized runner.
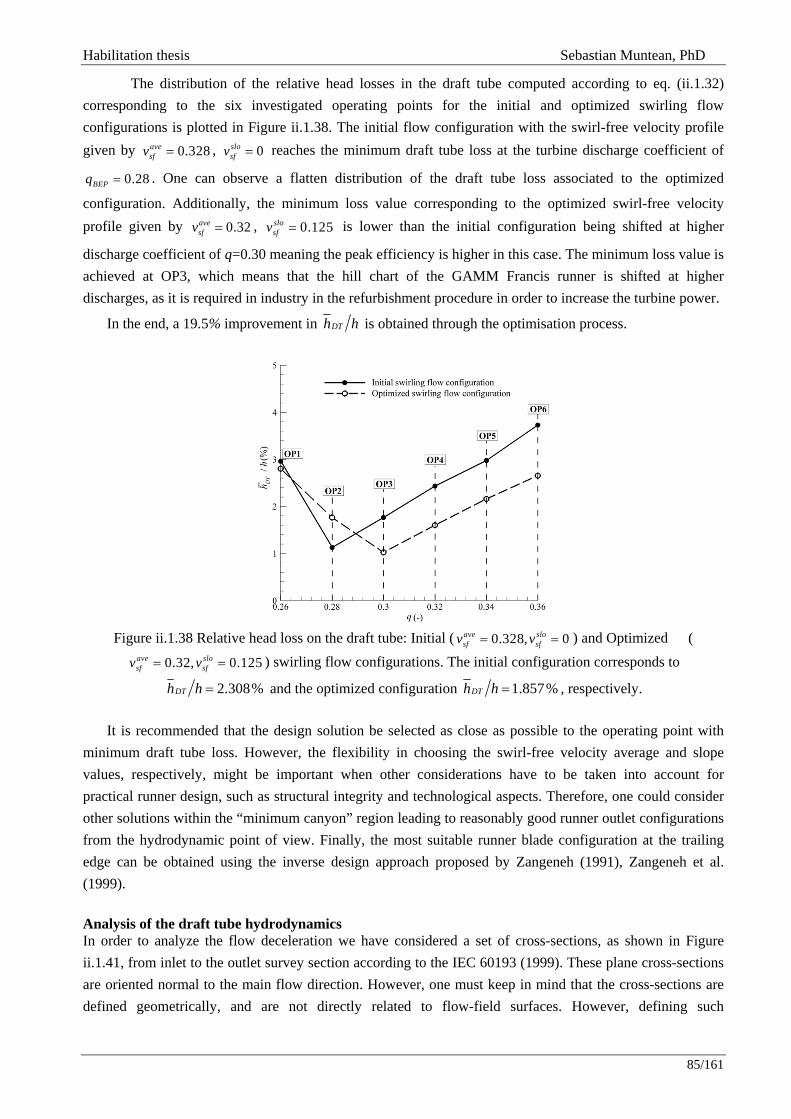
Habilitation thesis Sebastian Muntean, PhD
85/161
The distribution of the relative head losses in the draft tube computed according to eq. (ii.1.32) corresponding to the six investigated operating points for the initial and optimized swirling flow configurations is plotted in Figure ii.1.38. The initial flow configuration with the swirl-free velocity profile given by 0.328ave
sfv = , 0slosfv = reaches the minimum draft tube loss at the turbine discharge coefficient of
0.28=BEPq . One can observe a flatten distribution of the draft tube loss associated to the optimized
configuration. Additionally, the minimum loss value corresponding to the optimized swirl-free velocity profile given by 0.32ave
sfv = , 0.125slosfv = is lower than the initial configuration being shifted at higher
discharge coefficient of q=0.30 meaning the peak efficiency is higher in this case. The minimum loss value is achieved at OP3, which means that the hill chart of the GAMM Francis runner is shifted at higher discharges, as it is required in industry in the refurbishment procedure in order to increase the turbine power.
In the end, a 19.5% improvement in DTh h is obtained through the optimisation process.
Figure ii.1.38 Relative head loss on the draft tube: Initial ( 0.328, 0ave slo
sf sfv v= = ) and Optimized (
0.32, 0.125ave slosf sfv v= = ) swirling flow configurations. The initial configuration corresponds to
2.308%DTh h = and the optimized configuration 1.857%DTh h = , respectively.
It is recommended that the design solution be selected as close as possible to the operating point with minimum draft tube loss. However, the flexibility in choosing the swirl-free velocity average and slope values, respectively, might be important when other considerations have to be taken into account for practical runner design, such as structural integrity and technological aspects. Therefore, one could consider other solutions within the “minimum canyon” region leading to reasonably good runner outlet configurations from the hydrodynamic point of view. Finally, the most suitable runner blade configuration at the trailing edge can be obtained using the inverse design approach proposed by Zangeneh (1991), Zangeneh et al. (1999). Analysis of the draft tube hydrodynamics In order to analyze the flow deceleration we have considered a set of cross-sections, as shown in Figure ii.1.41, from inlet to the outlet survey section according to the IEC 60193 (1999). These plane cross-sections are oriented normal to the main flow direction. However, one must keep in mind that the cross-sections are defined geometrically, and are not directly related to flow-field surfaces. However, defining such
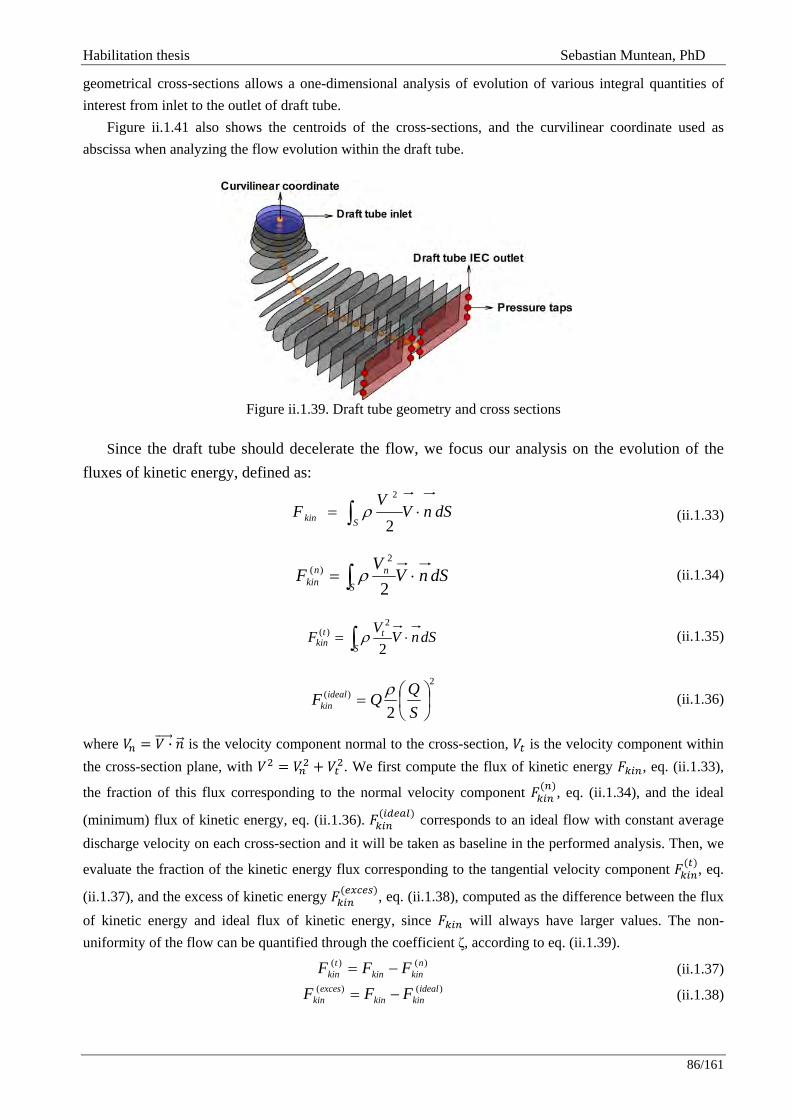
Habilitation thesis Sebastian Muntean, PhD
86/161
geometrical cross-sections allows a one-dimensional analysis of evolution of various integral quantities of interest from inlet to the outlet of draft tube.
Figure ii.1.41 also shows the centroids of the cross-sections, and the curvilinear coordinate used as abscissa when analyzing the flow evolution within the draft tube.
Figure ii.1.39. Draft tube geometry and cross sections
Since the draft tube should decelerate the flow, we focus our analysis on the evolution of the
fluxes of kinetic energy, defined as:
dSnVV
FSkin ⋅= ∫ 2
2
ρ (ii.1.33)
dSnVV
FS
nnkin ⋅= ∫ 2
2)( ρ (ii.1.34)
dSnVVFS
ttkin ⋅= ∫ 2
2)( ρ
(ii.1.35)
2)(
2⎟⎠⎞
⎜⎝⎛=
SQQF ideal
kinρ
(ii.1.36)
where · is the velocity component normal to the cross-section, is the velocity component within the cross-section plane, with . We first compute the flux of kinetic energy , eq. (ii.1.33),
the fraction of this flux corresponding to the normal velocity component , eq. (ii.1.34), and the ideal
(minimum) flux of kinetic energy, eq. (ii.1.36). corresponds to an ideal flow with constant average discharge velocity on each cross-section and it will be taken as baseline in the performed analysis. Then, we
evaluate the fraction of the kinetic energy flux corresponding to the tangential velocity component , eq.
(ii.1.37), and the excess of kinetic energy , eq. (ii.1.38), computed as the difference between the flux of kinetic energy and ideal flux of kinetic energy, since will always have larger values. The non-uniformity of the flow can be quantified through the coefficient ζ, according to eq. (ii.1.39).
)()( nkinkin
tkin FFF −= (ii.1.37)
)()( idealkinkin
exceskin FFF −= (ii.1.38)

Habilitation thesis Sebastian Muntean, PhD
87/161
)(idealkin
kin
FF
=ξ (ii.1.39)
The relationship between the actual kinetic energy flux through a cross-section, , and its minimum
possible value can obviously be expressed either as a difference, eq. (ii.1.38) or as a ratio, eq. (ii.1.39). Both versions are considered to be relevant for the complex analysis of the draft tube performance in decelerating the flow.
In Figure ii.1.40 is represented in comparison from inlet to outlet of the draft tube at operating point three, the flux of specific kinetic energy corresponding to the existing and the optimized swirl-free velocity profiles, respectively. We can see that almost half of the specific kinetic energy is recovered in the cone and about only one quarter remains at the elbow outlet for both swirl-free velocity configurations. The differences occur from the elbow outlet to the draft tube outlet, where for the existing swirl-free velocity configuration corresponding to the existing runner, the flux of kinetic energy (solid black line) is quasi-
constant compared with the ideal flux of kinetic energy (dashed black line). This means that the draft tube diffuser is no longer recovering the kinetic energy, which is well quantified through the excess of
kinetic energy (dashed green line) until the draft tube outlet. On the other hand for the optimized
swirl-free velocity configuration, the differences between and are small from inlet to outlet, thus resulting in a very small excess of kinetic energy at the draft tube outlet. Also, practically all tangential
kinetic energy (solid red line) is also recovered within cone – elbow.
Figure ii.1.40. Kinetic energy decrease in the draft tube at OP3 (a) Existing swirl-free velocity
configuration (b) Optimized swirl-free velocity configuration In Figure ii.1.40 is represented the flow non-uniformity from inlet to the draft tube outlet, quantified by
the non-uniformity coefficient , eq. (ii.1.35), for the whole investigated operating range. The flow non-uniformity is relatively small in the cone and even decreases in the elbow, reaching a local
minimum at the elbow outlet, for both swirl-free velocity configurations. The differences occur in the draft tube diffuser, where for the existing configuration, Figure ii.1.43a, excepting operating point two, the flow non-uniformity is large. The flow non-uniformity increases in the diffuser channels, where only a fraction of the cross-section is actually occupied by the main flow, and large dead-water regions develop by Tridon et al. (2012). At the optimized swirl-free velocity configuration, Figure ii.1.43b, the flow non-uniformity is

Habilitation thesis Sebastian Muntean, PhD
88/161
lower in the diffuser, excepting the operating points from the extremities, which have approximately the same distribution as in the existing case.
Figure ii.1.43 Non-uniformity of the flow in the draft tube (a) Existing swirl-free velocity configuration. (b) Optimized swirl-free velocity configuration.
Discharge imbalance at the draft tube outlet Because of the flow rotation, the discharge is not evenly distributed among the outlet channels. Table ii.1.12 presents the discharge imbalance between the left and right channel of the draft tube outlet.
Table ii.1.12 Discharge fraction through the outlet channels
Outlet channel OP1 OP2 OP3 OP4 OP5 OP6
0.328, 0.00
Existing configuration
Left 66.30% 55.00% 56.30% 54.00% 52.00% 47.80%
Right 33.70% 45.00% 43.70% 46.00% 48.00% 52.20%
0.32, 0.125
Optimized configuration
Left 65.14% 60.45% 53.27% 52.64% 50.25% 49.43%
Right 34.86% 39.55% 46.73% 47.36% 49.75% 50.57%
It can be seen that for low turbine discharge, the discharge in the left channel is practically half the
discharge through the right channel. As the turbine discharge increases, and the swirl general direction changes from co-rotating to counter-rotating with respect to the runner, the discharge in the left channel increases and eventually becomes larger than the discharge in the right channel for large turbine discharge. Note that for the optimized swirl-free configuration the discharge distribution through the outlet channels for operating points three to six, it is much closer to the ideal distribution of 50% 50%.
Habilitation thesis Sebastian Muntean, PhD
89/161
ii.2 Swirling flows
ii.2.1 Introduction Confined turbulent swirling flows are encountered in many industrial applications, such as hydraulic turbines, gas turbine combustors and internal combustion engines. The flow patterns associated with turbulent swirling flows are vortex-dominated and have long been of interest to scientists and engineers. The goal of the study on which this AC is based has been to understand and control the naturally occurring phenomena. The knowledge can be applied to increase the turbulent convection in heat and mass transfer applications Javadi and Nilsson (2015a), or to reduce unwanted pressure pulsations in e.g. hydro power systems Javadi and Nilsson (2015b). The present test case primarily relates to the flow in water turbines.
ii.2.2 Relevance to industrial sector The flow in water turbines running at off-design conditions often has a strong swirl which may cause vortex breakdown and pressure pulsation in the draft tube, Thicke et al. (1981). The pulsations may damage the structure Frunzaverde et al. (2010) and also its can produce electrical power swing, Rheingans (1940). The occurrence of the pulsation and its impact on the efficiency of the draft tube depends mainly on the flow rate of the turbine, the local pressure level, and the velocity field downstream of the runner Bosioc et al. (2012). Under circumstances leading to the surge, the swirling flow tends to separate into two concentric flow regions. The axial flow basically occurs in the outer region, while the inner region may contain an on-axis recirculation region, also called stagnation region Resiga et al. (2016). The breakdown of the swirling flow leads to a precessing helical vortex, also called vortex rope, which makes the recirculation region unsteady. The swirling flow configuration of the present test case corresponds to part load operation of a Francis turbine. A swirl generator is designed to generate similar flow properties as the Francis turbine at the inlet to the draft tube, yielding a precessing vortex rope in the draft tube.
ii.2.3 Assessment parameters The dimensionless precession frequency of the vortex rope is expressed using the Strouhal number Bosioc et al. (2012). The swirl apparatus generates a vortex rope with Strouhal number equal to 0.39, which is quite close to the Strouhal number for a model Francis turbine (St = 0.408). The shear layer between the two flow regions in the draft tube has two edges, one or both of which may give negative turbulence production Javadi and Nilsson (2015a). The production of the turbulence structure depends mainly on the level of the swirl in the flow field Javadi el al. (2016). The turbulence models have been assessed based how well they predict the on-axis recirculation region and the vortex breakdown.
ii.2.4 Flow physics The highly turbulent swirling flow and the Reynolds number based on the throat diameter and bulk velocity of 3.81x10⁵ is a challenging task for CFD. The flow in the cone contains the wakes of the blades, the vortex rope, an on-axis recirculation region, as well as separations from both the hub and in the divergent walls of the cone.
ii.2.5 Timisoara swirl test case
ii.2.5.1 Overview of test case A closed loop experimental test rig was developed and measured at the Politehnica University of Timisoara, Resiga et al. (2007) for investigating decelerated swirling flows in a conical diffuser and for assessing various flow control methods.
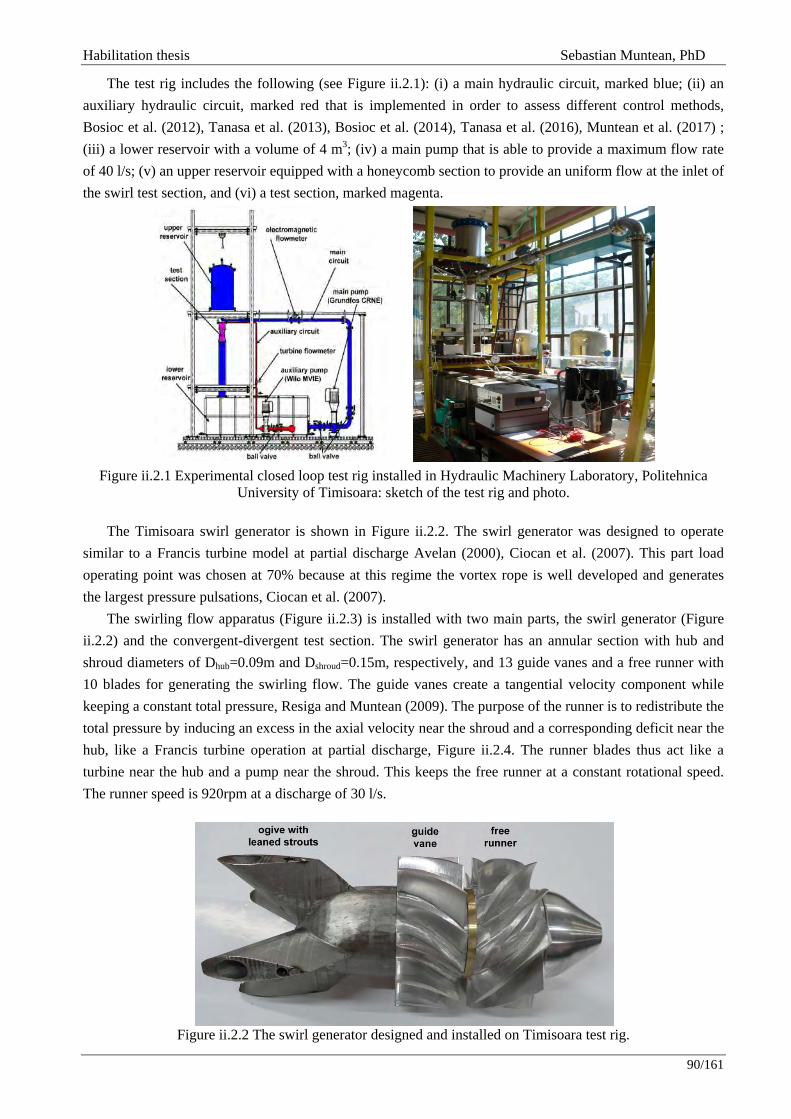
Habilitation thesis Sebastian Muntean, PhD
90/161
The test rig includes the following (see Figure ii.2.1): (i) a main hydraulic circuit, marked blue; (ii) an auxiliary hydraulic circuit, marked red that is implemented in order to assess different control methods, Bosioc et al. (2012), Tanasa et al. (2013), Bosioc et al. (2014), Tanasa et al. (2016), Muntean et al. (2017) ; (iii) a lower reservoir with a volume of 4 m3; (iv) a main pump that is able to provide a maximum flow rate of 40 l/s; (v) an upper reservoir equipped with a honeycomb section to provide an uniform flow at the inlet of the swirl test section, and (vi) a test section, marked magenta.
Figure ii.2.1 Experimental closed loop test rig installed in Hydraulic Machinery Laboratory, Politehnica
University of Timisoara: sketch of the test rig and photo.
The Timisoara swirl generator is shown in Figure ii.2.2. The swirl generator was designed to operate similar to a Francis turbine model at partial discharge Avelan (2000), Ciocan et al. (2007). This part load operating point was chosen at 70% because at this regime the vortex rope is well developed and generates the largest pressure pulsations, Ciocan et al. (2007).
The swirling flow apparatus (Figure ii.2.3) is installed with two main parts, the swirl generator (Figure ii.2.2) and the convergent-divergent test section. The swirl generator has an annular section with hub and shroud diameters of Dhub=0.09m and Dshroud=0.15m, respectively, and 13 guide vanes and a free runner with 10 blades for generating the swirling flow. The guide vanes create a tangential velocity component while keeping a constant total pressure, Resiga and Muntean (2009). The purpose of the runner is to redistribute the total pressure by inducing an excess in the axial velocity near the shroud and a corresponding deficit near the hub, like a Francis turbine operation at partial discharge, Figure ii.2.4. The runner blades thus act like a turbine near the hub and a pump near the shroud. This keeps the free runner at a constant rotational speed. The runner speed is 920rpm at a discharge of 30 l/s.
Figure ii.2.2 The swirl generator designed and installed on Timisoara test rig.
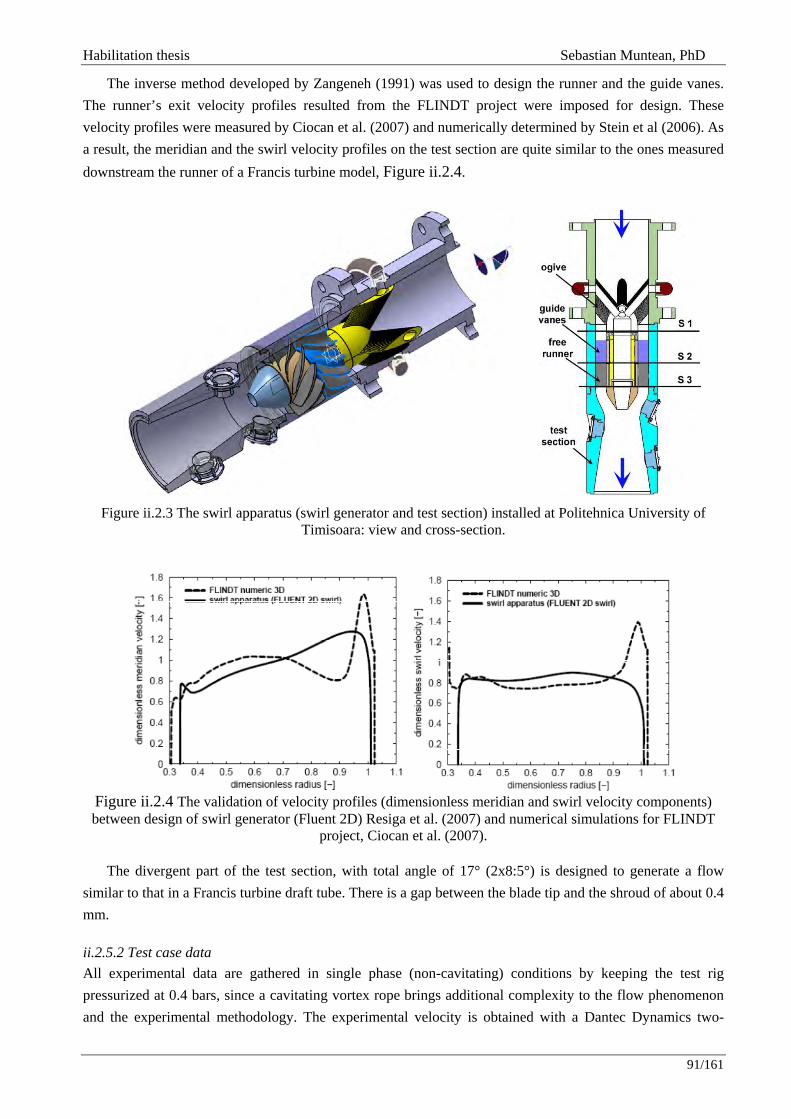
Habilitation thesis Sebastian Muntean, PhD
91/161
The inverse method developed by Zangeneh (1991) was used to design the runner and the guide vanes. The runner’s exit velocity profiles resulted from the FLINDT project were imposed for design. These velocity profiles were measured by Ciocan et al. (2007) and numerically determined by Stein et al (2006). As a result, the meridian and the swirl velocity profiles on the test section are quite similar to the ones measured downstream the runner of a Francis turbine model, Figure ii.2.4.
Figure ii.2.3 The swirl apparatus (swirl generator and test section) installed at Politehnica University of
Timisoara: view and cross-section.
Figure ii.2.4 The validation of velocity profiles (dimensionless meridian and swirl velocity components) between design of swirl generator (Fluent 2D) Resiga et al. (2007) and numerical simulations for FLINDT
project, Ciocan et al. (2007).
The divergent part of the test section, with total angle of 17° (2x8:5°) is designed to generate a flow similar to that in a Francis turbine draft tube. There is a gap between the blade tip and the shroud of about 0.4 mm.
ii.2.5.2 Test case data All experimental data are gathered in single phase (non-cavitating) conditions by keeping the test rig pressurized at 0.4 bars, since a cavitating vortex rope brings additional complexity to the flow phenomenon and the experimental methodology. The experimental velocity is obtained with a Dantec Dynamics two-
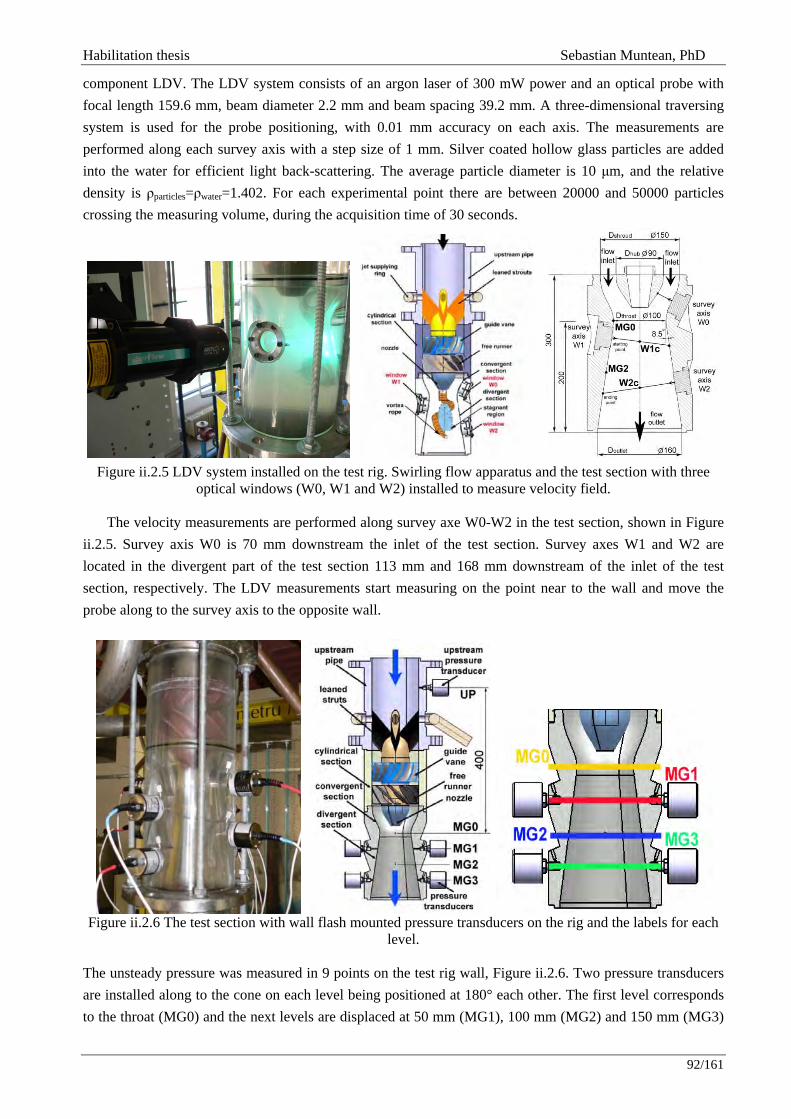
Habilitation thesis Sebastian Muntean, PhD
92/161
component LDV. The LDV system consists of an argon laser of 300 mW power and an optical probe with focal length 159.6 mm, beam diameter 2.2 mm and beam spacing 39.2 mm. A three-dimensional traversing system is used for the probe positioning, with 0.01 mm accuracy on each axis. The measurements are performed along each survey axis with a step size of 1 mm. Silver coated hollow glass particles are added into the water for efficient light back-scattering. The average particle diameter is 10 μm, and the relative density is ρparticles=ρwater=1.402. For each experimental point there are between 20000 and 50000 particles crossing the measuring volume, during the acquisition time of 30 seconds.
Figure ii.2.5 LDV system installed on the test rig. Swirling flow apparatus and the test section with three
optical windows (W0, W1 and W2) installed to measure velocity field.
The velocity measurements are performed along survey axe W0-W2 in the test section, shown in Figure ii.2.5. Survey axis W0 is 70 mm downstream the inlet of the test section. Survey axes W1 and W2 are located in the divergent part of the test section 113 mm and 168 mm downstream of the inlet of the test section, respectively. The LDV measurements start measuring on the point near to the wall and move the probe along to the survey axis to the opposite wall.
Figure ii.2.6 The test section with wall flash mounted pressure transducers on the rig and the labels for each
level.
The unsteady pressure was measured in 9 points on the test rig wall, Figure ii.2.6. Two pressure transducers are installed along to the cone on each level being positioned at 180° each other. The first level corresponds to the throat (MG0) and the next levels are displaced at 50 mm (MG1), 100 mm (MG2) and 150 mm (MG3)
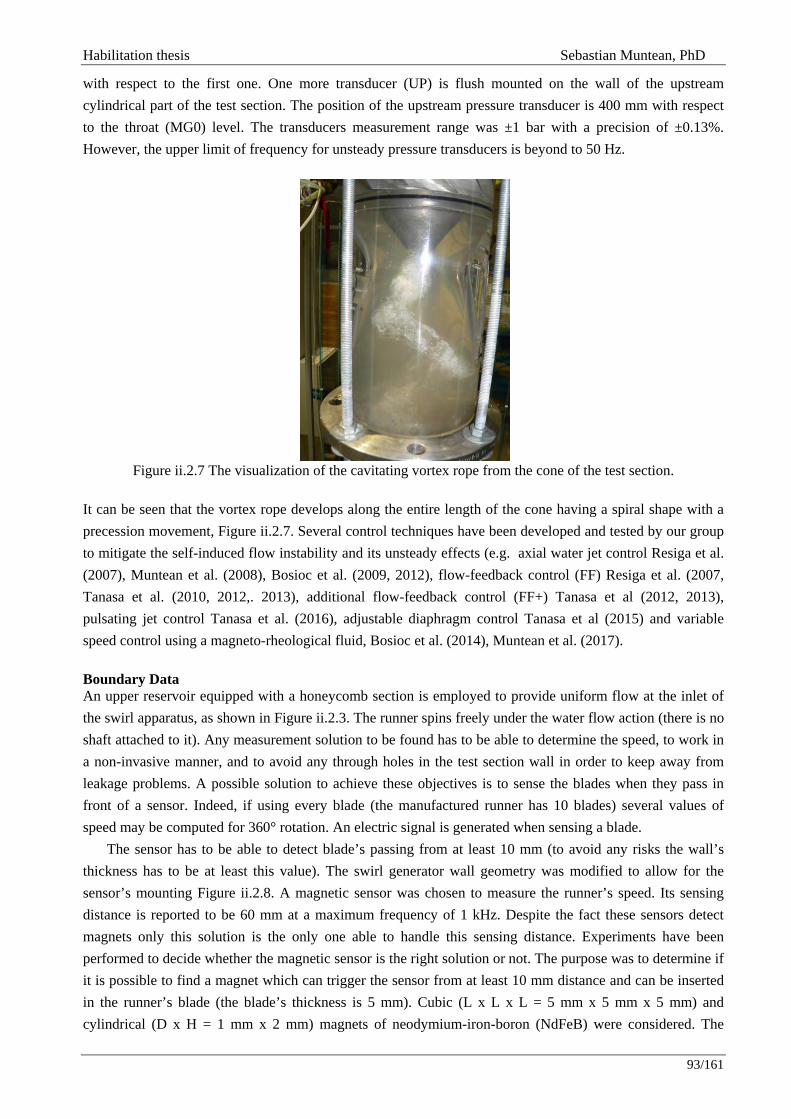
Habilitation thesis Sebastian Muntean, PhD
93/161
with respect to the first one. One more transducer (UP) is flush mounted on the wall of the upstream cylindrical part of the test section. The position of the upstream pressure transducer is 400 mm with respect to the throat (MG0) level. The transducers measurement range was ±1 bar with a precision of ±0.13%. However, the upper limit of frequency for unsteady pressure transducers is beyond to 50 Hz.
Figure ii.2.7 The visualization of the cavitating vortex rope from the cone of the test section.
It can be seen that the vortex rope develops along the entire length of the cone having a spiral shape with a precession movement, Figure ii.2.7. Several control techniques have been developed and tested by our group to mitigate the self-induced flow instability and its unsteady effects (e.g. axial water jet control Resiga et al. (2007), Muntean et al. (2008), Bosioc et al. (2009, 2012), flow-feedback control (FF) Resiga et al. (2007, Tanasa et al. (2010, 2012,. 2013), additional flow-feedback control (FF+) Tanasa et al (2012, 2013), pulsating jet control Tanasa et al. (2016), adjustable diaphragm control Tanasa et al (2015) and variable speed control using a magneto-rheological fluid, Bosioc et al. (2014), Muntean et al. (2017). Boundary Data An upper reservoir equipped with a honeycomb section is employed to provide uniform flow at the inlet of the swirl apparatus, as shown in Figure ii.2.3. The runner spins freely under the water flow action (there is no shaft attached to it). Any measurement solution to be found has to be able to determine the speed, to work in a non-invasive manner, and to avoid any through holes in the test section wall in order to keep away from leakage problems. A possible solution to achieve these objectives is to sense the blades when they pass in front of a sensor. Indeed, if using every blade (the manufactured runner has 10 blades) several values of speed may be computed for 360° rotation. An electric signal is generated when sensing a blade.
The sensor has to be able to detect blade’s passing from at least 10 mm (to avoid any risks the wall’s thickness has to be at least this value). The swirl generator wall geometry was modified to allow for the sensor’s mounting Figure ii.2.8. A magnetic sensor was chosen to measure the runner’s speed. Its sensing distance is reported to be 60 mm at a maximum frequency of 1 kHz. Despite the fact these sensors detect magnets only this solution is the only one able to handle this sensing distance. Experiments have been performed to decide whether the magnetic sensor is the right solution or not. The purpose was to determine if it is possible to find a magnet which can trigger the sensor from at least 10 mm distance and can be inserted in the runner’s blade (the blade’s thickness is 5 mm). Cubic (L x L x L = 5 mm x 5 mm x 5 mm) and cylindrical (D x H = 1 mm x 2 mm) magnets of neodymium-iron-boron (NdFeB) were considered. The

Habilitation thesis Sebastian Muntean, PhD
94/161
MM12-60APS-ZCK sensor manufactured by Sick was used for testing purpose. Both magnets triggered the sensor but the distance was different. The cubic magnet triggered the sensor at about 25 mm while for the cylindrical one the sensing distance was about 8-9 mm. Despite their satisfactory sensing range, attaching the cubic magnet to the blade was considered to be too difficult. As such, a bigger cylindrical NdFeB magnet of dimensions (D x H = 3 mm x 8 mm) was chosen. A 3 mm diameter hole was made in each blade and a magnet was inserted. A sensor’s assembling mechanism allowing distance adjustment is designed. The entire ensemble installed on the rig can be seen in Figure ii.2.8.
Each blade passing by triggers the sensor and generates a single rectangular pulse. The runner’s rotation generates a train of pulses (10 of them corresponding to one complete rotation). The NI 6289 data acquisition board manufactured by National Instruments is used to acquire the pulses and compute the runner’s speed. Due to the low frequency range, a single counter is used to measure the time intervals between two pulses. A LabVIEW program was employed to measure the runner’s speed, Muntean et al. (2011).
Using the above setup, the runner’s speed was measured using the pulse train frequency. The measured frequency was 153.3 Hz which corresponds to a speed of 920 rpm for a flow rate of 30 l/s. Previous speed measurements were performed using a strobe. The frequency measured using the stroboscope was 152.4 Hz (corresponding to a speed of 914.4 rpm). Actually, the relative error of the measured speed with strobe respect to magnetic system is less than ±1%. The runner speed is 920 rpm at a discharge of 30 l/s.
Figure ii.2.8 The system equipped with magnetic sensor installed on the rig in order to measure the speed of
free runner. Measured Data The survey axes, S* at sections W0-W2 (see Figure ii.2.5), are normalized by the throat radius, Rthroat=0.05 m, and the velocity is normalized by the bulk velocity, Wthroat=3.81 m/s, at the throat. The survey axes have their origin at the wall and are perpendicular to the wall. The mean meridian velocity component is measured along the survey axes. The meridian velocity is defined as the velocity component which is perpendicular to the survey axes. The meridian velocity is called axial velocity hereafter for simplicity. The mean tangential velocity component is measured along the survey axes. The length is based on the distance from the wall. The root mean square values corresponding to the velocity fluctuations are included. LDV data The computed velocity profiles with measured runner speed are compared with measured velocity data on the window W0 installed on test section in order to verify the statement from previous section. In the experimental investigations two velocity components were measured by Dr. A. Bosioc using the optical
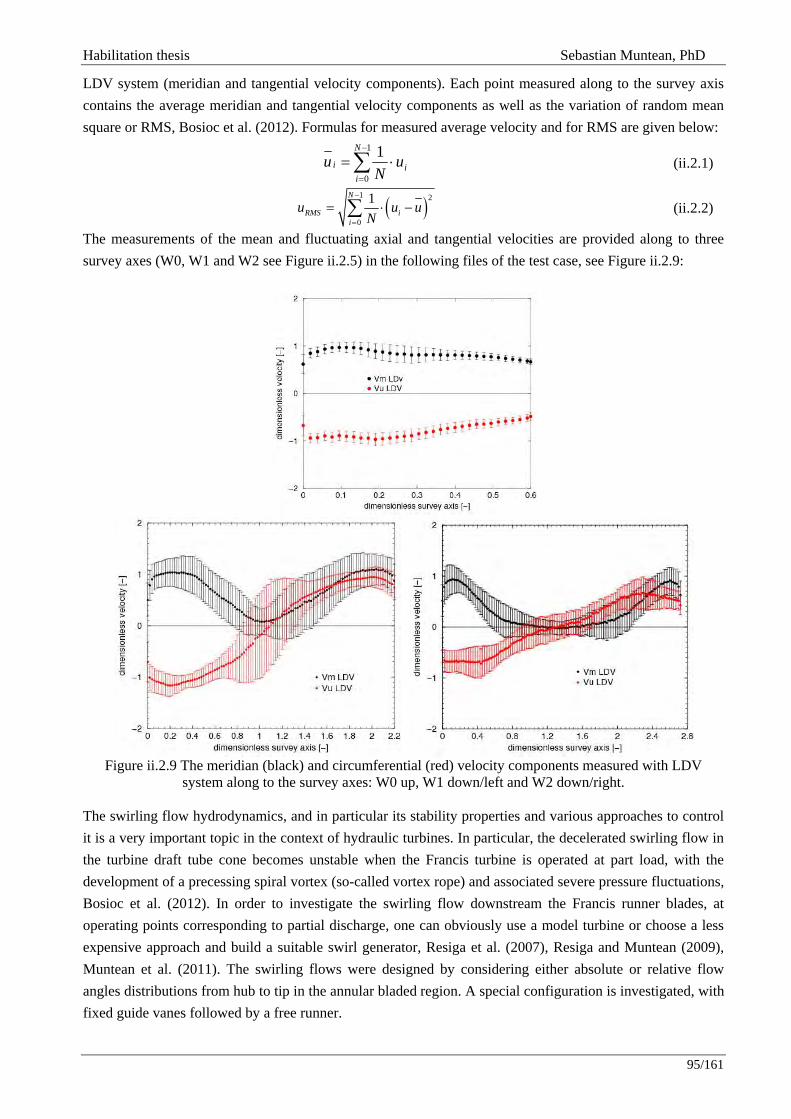
Habilitation thesis Sebastian Muntean, PhD
95/161
LDV system (meridian and tangential velocity components). Each point measured along to the survey axis contains the average meridian and tangential velocity components as well as the variation of random mean square or RMS, Bosioc et al. (2012). Formulas for measured average velocity and for RMS are given below:
∑−
=
⋅=1
0
1N
iii u
Nu (ii.2.1)
( )1 2
0
1N
RMS ii
u u uN
−
=
= ⋅ −∑ (ii.2.2)
The measurements of the mean and fluctuating axial and tangential velocities are provided along to three survey axes (W0, W1 and W2 see Figure ii.2.5) in the following files of the test case, see Figure ii.2.9:
Figure ii.2.9 The meridian (black) and circumferential (red) velocity components measured with LDV
system along to the survey axes: W0 up, W1 down/left and W2 down/right. The swirling flow hydrodynamics, and in particular its stability properties and various approaches to control it is a very important topic in the context of hydraulic turbines. In particular, the decelerated swirling flow in the turbine draft tube cone becomes unstable when the Francis turbine is operated at part load, with the development of a precessing spiral vortex (so-called vortex rope) and associated severe pressure fluctuations, Bosioc et al. (2012). In order to investigate the swirling flow downstream the Francis runner blades, at operating points corresponding to partial discharge, one can obviously use a model turbine or choose a less expensive approach and build a suitable swirl generator, Resiga et al. (2007), Resiga and Muntean (2009), Muntean et al. (2011). The swirling flows were designed by considering either absolute or relative flow angles distributions from hub to tip in the annular bladed region. A special configuration is investigated, with fixed guide vanes followed by a free runner.

Habilitation thesis Sebastian Muntean, PhD
96/161
Experimental data analysis Firstly, the Fourier spectrum of the signal recorded by the pressure transducer (UP) located upstream to the test section (see Figure ii.2.6) is plotted in Figure ii.2.10. The discriminated signals cannot be obtained on this level due to only one transducer is installed. Two frequencies around 2.5 Hz and 19 Hz can be clearly identified at this level.
Figure ii.2.10 Fourier spectrum of the unsteady pressure signal acquired by the pressure transducer (UP)
located upstream to the test section, see Figure ii.2.6. Secondly, two unsteady pressure signals acquired on each four level of the cone are used to discriminate
the plunging and rotating components using the procedure proposed by Nishi et al (1984, 1988). The Fourier spectra of the decomposed signals are plotted in Figure ii.2.11. Further, the spectrum of the plunging component (PC) is shown with black while the spectrum of the rotating one (RC) with red, respectively.
Figure ii.2.11 Fourier spectra of the decomposed unsteady pressure signals at all four levels on the cone wall
(from MG0 to MG3, Figure ii.2.6).
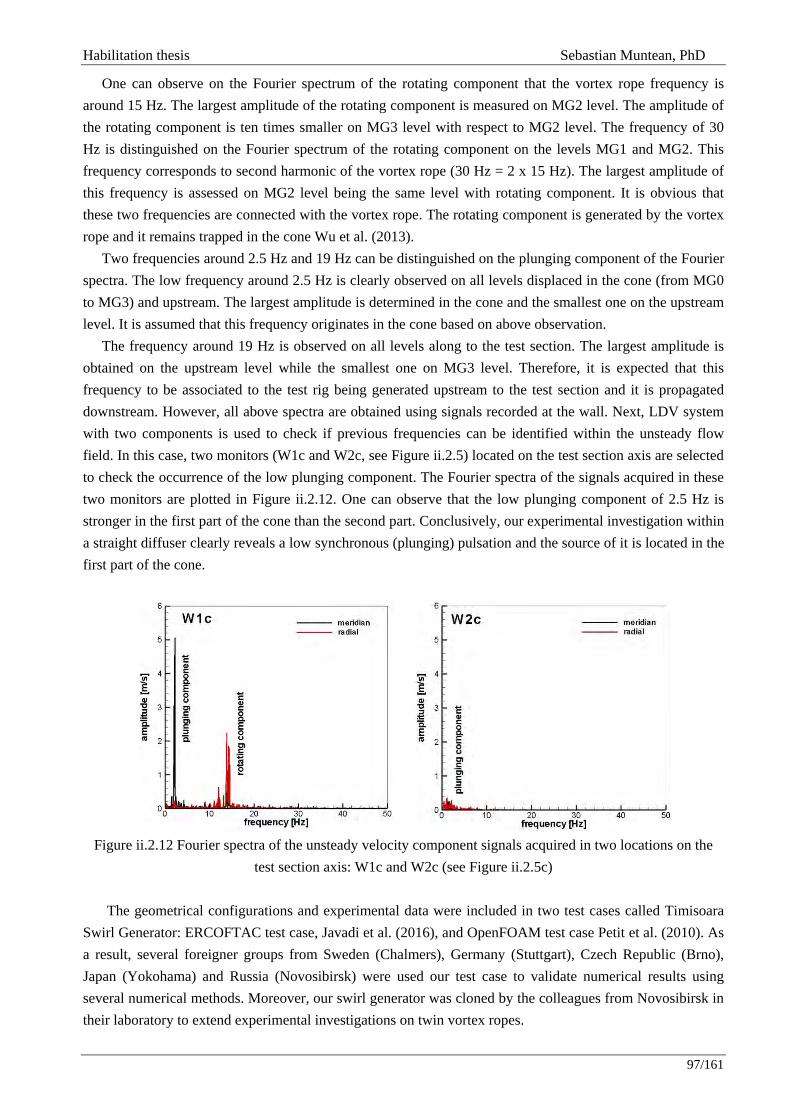
Habilitation thesis Sebastian Muntean, PhD
97/161
One can observe on the Fourier spectrum of the rotating component that the vortex rope frequency is around 15 Hz. The largest amplitude of the rotating component is measured on MG2 level. The amplitude of the rotating component is ten times smaller on MG3 level with respect to MG2 level. The frequency of 30 Hz is distinguished on the Fourier spectrum of the rotating component on the levels MG1 and MG2. This frequency corresponds to second harmonic of the vortex rope (30 Hz = 2 x 15 Hz). The largest amplitude of this frequency is assessed on MG2 level being the same level with rotating component. It is obvious that these two frequencies are connected with the vortex rope. The rotating component is generated by the vortex rope and it remains trapped in the cone Wu et al. (2013).
Two frequencies around 2.5 Hz and 19 Hz can be distinguished on the plunging component of the Fourier spectra. The low frequency around 2.5 Hz is clearly observed on all levels displaced in the cone (from MG0 to MG3) and upstream. The largest amplitude is determined in the cone and the smallest one on the upstream level. It is assumed that this frequency originates in the cone based on above observation.
The frequency around 19 Hz is observed on all levels along to the test section. The largest amplitude is obtained on the upstream level while the smallest one on MG3 level. Therefore, it is expected that this frequency to be associated to the test rig being generated upstream to the test section and it is propagated downstream. However, all above spectra are obtained using signals recorded at the wall. Next, LDV system with two components is used to check if previous frequencies can be identified within the unsteady flow field. In this case, two monitors (W1c and W2c, see Figure ii.2.5) located on the test section axis are selected to check the occurrence of the low plunging component. The Fourier spectra of the signals acquired in these two monitors are plotted in Figure ii.2.12. One can observe that the low plunging component of 2.5 Hz is stronger in the first part of the cone than the second part. Conclusively, our experimental investigation within a straight diffuser clearly reveals a low synchronous (plunging) pulsation and the source of it is located in the first part of the cone.
Figure ii.2.12 Fourier spectra of the unsteady velocity component signals acquired in two locations on the
test section axis: W1c and W2c (see Figure ii.2.5c)
The geometrical configurations and experimental data were included in two test cases called Timisoara Swirl Generator: ERCOFTAC test case, Javadi et al. (2016), and OpenFOAM test case Petit et al. (2010). As a result, several foreigner groups from Sweden (Chalmers), Germany (Stuttgart), Czech Republic (Brno), Japan (Yokohama) and Russia (Novosibirsk) were used our test case to validate numerical results using several numerical methods. Moreover, our swirl generator was cloned by the colleagues from Novosibirsk in their laboratory to extend experimental investigations on twin vortex ropes.
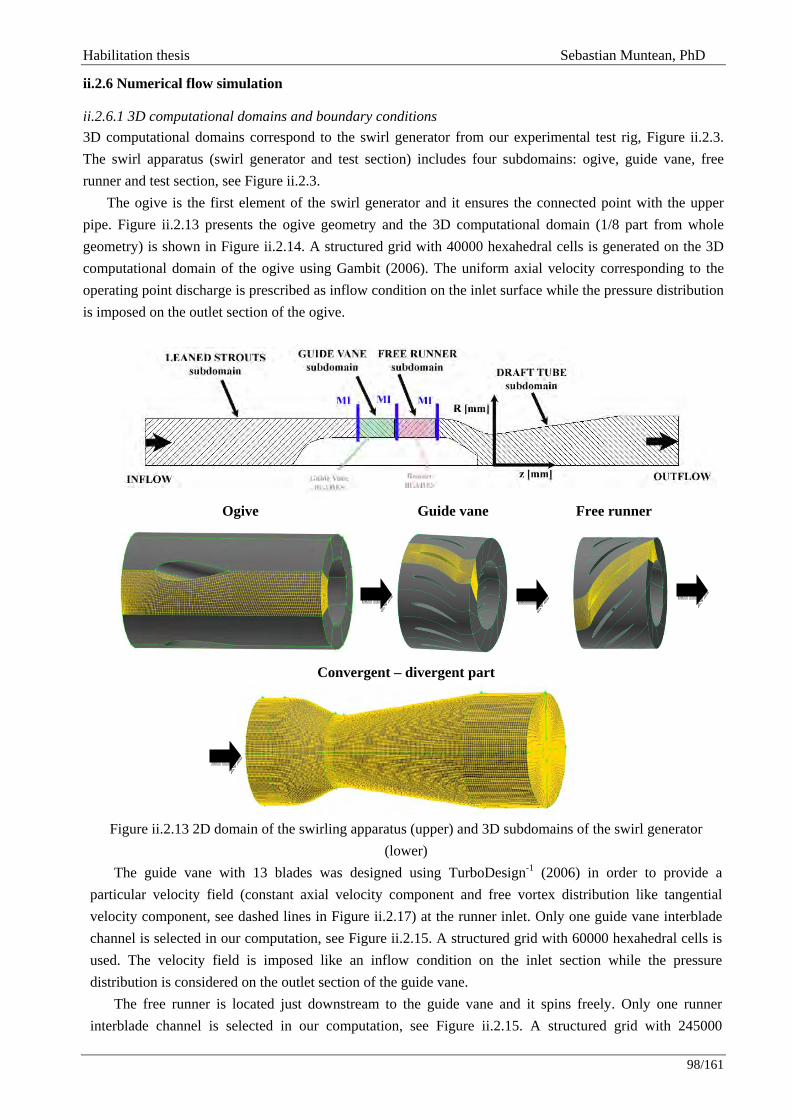
Habilitation thesis Sebastian Muntean, PhD
98/161
ii.2.6 Numerical flow simulation
ii.2.6.1 3D computational domains and boundary conditions 3D computational domains correspond to the swirl generator from our experimental test rig, Figure ii.2.3. The swirl apparatus (swirl generator and test section) includes four subdomains: ogive, guide vane, free runner and test section, see Figure ii.2.3.
The ogive is the first element of the swirl generator and it ensures the connected point with the upper pipe. Figure ii.2.13 presents the ogive geometry and the 3D computational domain (1/8 part from whole geometry) is shown in Figure ii.2.14. A structured grid with 40000 hexahedral cells is generated on the 3D computational domain of the ogive using Gambit (2006). The uniform axial velocity corresponding to the operating point discharge is prescribed as inflow condition on the inlet surface while the pressure distribution is imposed on the outlet section of the ogive.
Ogive Guide vane Free runner
Convergent – divergent part
Figure ii.2.13 2D domain of the swirling apparatus (upper) and 3D subdomains of the swirl generator
(lower) The guide vane with 13 blades was designed using TurboDesign-1 (2006) in order to provide a
particular velocity field (constant axial velocity component and free vortex distribution like tangential velocity component, see dashed lines in Figure ii.2.17) at the runner inlet. Only one guide vane interblade channel is selected in our computation, see Figure ii.2.15. A structured grid with 60000 hexahedral cells is used. The velocity field is imposed like an inflow condition on the inlet section while the pressure distribution is considered on the outlet section of the guide vane.
The free runner is located just downstream to the guide vane and it spins freely. Only one runner interblade channel is selected in our computation, see Figure ii.2.15. A structured grid with 245000
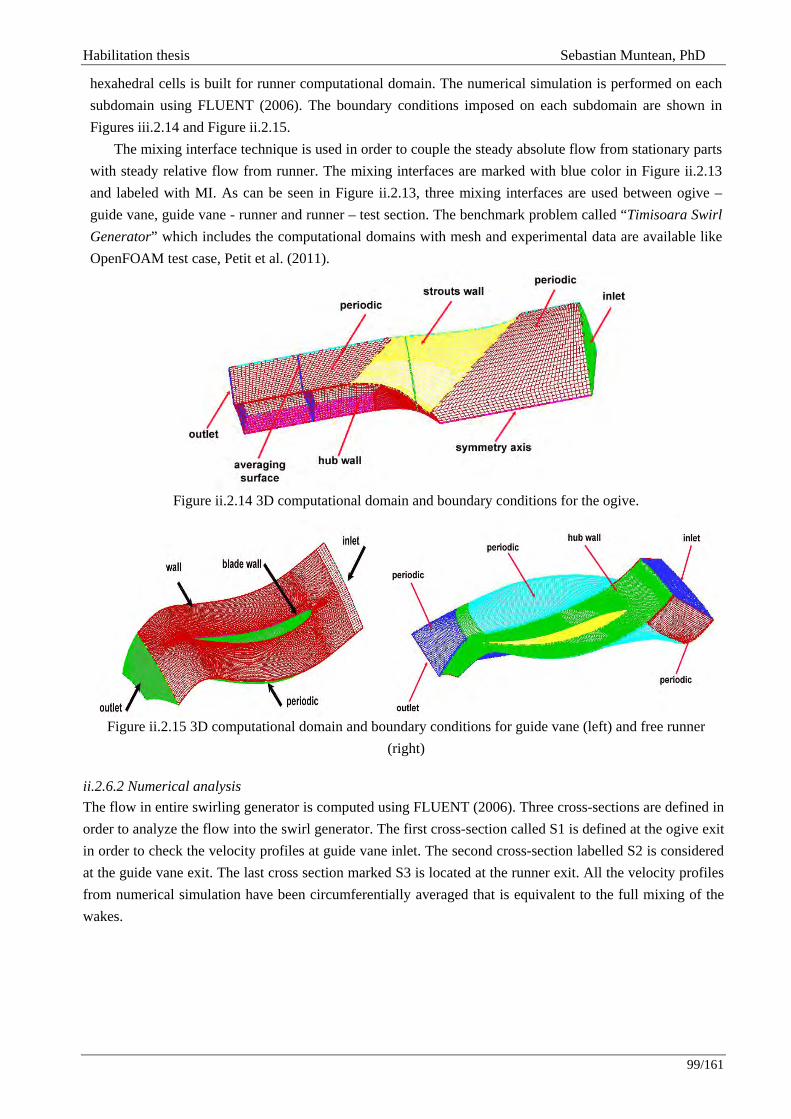
Habilitation thesis Sebastian Muntean, PhD
99/161
hexahedral cells is built for runner computational domain. The numerical simulation is performed on each subdomain using FLUENT (2006). The boundary conditions imposed on each subdomain are shown in Figures iii.2.14 and Figure ii.2.15.
The mixing interface technique is used in order to couple the steady absolute flow from stationary parts with steady relative flow from runner. The mixing interfaces are marked with blue color in Figure ii.2.13 and labeled with MI. As can be seen in Figure ii.2.13, three mixing interfaces are used between ogive – guide vane, guide vane - runner and runner – test section. The benchmark problem called “Timisoara Swirl Generator” which includes the computational domains with mesh and experimental data are available like OpenFOAM test case, Petit et al. (2011).
Figure ii.2.14 3D computational domain and boundary conditions for the ogive.
Figure ii.2.15 3D computational domain and boundary conditions for guide vane (left) and free runner
(right)
ii.2.6.2 Numerical analysis The flow in entire swirling generator is computed using FLUENT (2006). Three cross-sections are defined in order to analyze the flow into the swirl generator. The first cross-section called S1 is defined at the ogive exit in order to check the velocity profiles at guide vane inlet. The second cross-section labelled S2 is considered at the guide vane exit. The last cross section marked S3 is located at the runner exit. All the velocity profiles from numerical simulation have been circumferentially averaged that is equivalent to the full mixing of the wakes.
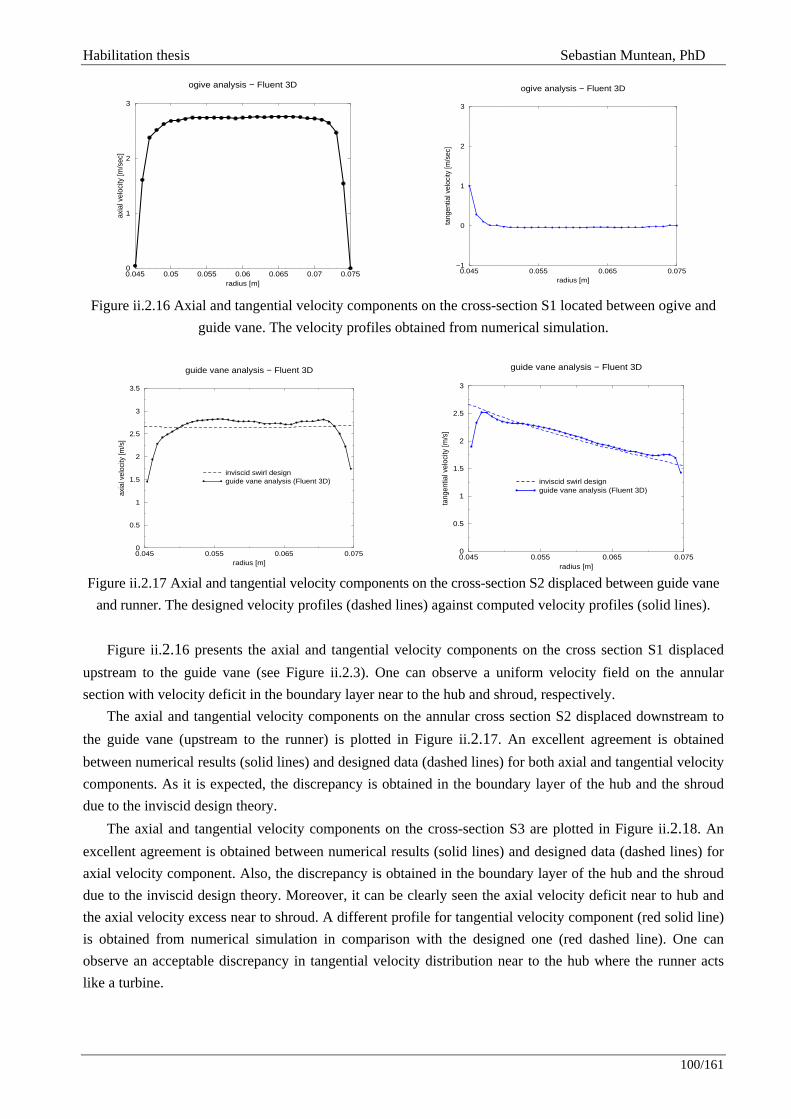
Habilitation thesis Sebastian Muntean, PhD
100/161
Figure ii.2.16 Axial and tangential velocity components on the cross-section S1 located between ogive and
guide vane. The velocity profiles obtained from numerical simulation.
Figure ii.2.17 Axial and tangential velocity components on the cross-section S2 displaced between guide vane
and runner. The designed velocity profiles (dashed lines) against computed velocity profiles (solid lines). Figure ii.2.16 presents the axial and tangential velocity components on the cross section S1 displaced
upstream to the guide vane (see Figure ii.2.3). One can observe a uniform velocity field on the annular section with velocity deficit in the boundary layer near to the hub and shroud, respectively.
The axial and tangential velocity components on the annular cross section S2 displaced downstream to the guide vane (upstream to the runner) is plotted in Figure ii.2.17. An excellent agreement is obtained between numerical results (solid lines) and designed data (dashed lines) for both axial and tangential velocity components. As it is expected, the discrepancy is obtained in the boundary layer of the hub and the shroud due to the inviscid design theory.
The axial and tangential velocity components on the cross-section S3 are plotted in Figure ii.2.18. An excellent agreement is obtained between numerical results (solid lines) and designed data (dashed lines) for axial velocity component. Also, the discrepancy is obtained in the boundary layer of the hub and the shroud due to the inviscid design theory. Moreover, it can be clearly seen the axial velocity deficit near to hub and the axial velocity excess near to shroud. A different profile for tangential velocity component (red solid line) is obtained from numerical simulation in comparison with the designed one (red dashed line). One can observe an acceptable discrepancy in tangential velocity distribution near to the hub where the runner acts like a turbine.
0.045 0.05 0.055 0.06 0.065 0.07 0.075radius [m]
0
1
2
3
axia
l vel
ocity
[m/s
ec]
ogive analysis − Fluent 3D
0.045 0.055 0.065 0.075radius [m]
−1
0
1
2
3
tang
entia
l vel
ocity
[m/s
ec]
ogive analysis − Fluent 3D
0.045 0.055 0.065 0.075radius [m]
0
0.5
1
1.5
2
2.5
3
3.5
axia
l vel
ocity
[m/s
]
guide vane analysis − Fluent 3D
inviscid swirl designguide vane analysis (Fluent 3D)
0.045 0.055 0.065 0.075radius [m]
0
0.5
1
1.5
2
2.5
3
tang
entia
l vel
ocity
[m/s
]
guide vane analysis − Fluent 3D
inviscid swirl designguide vane analysis (Fluent 3D)
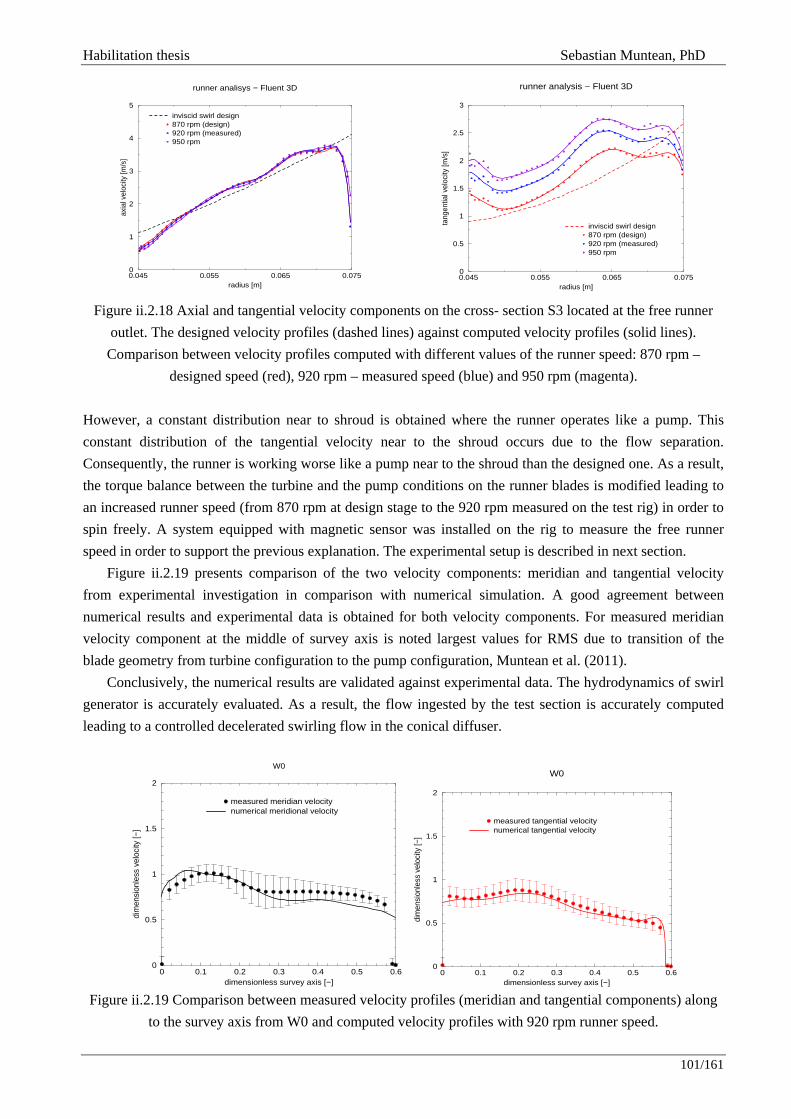
Habilitation thesis Sebastian Muntean, PhD
101/161
Figure ii.2.18 Axial and tangential velocity components on the cross- section S3 located at the free runner
outlet. The designed velocity profiles (dashed lines) against computed velocity profiles (solid lines). Comparison between velocity profiles computed with different values of the runner speed: 870 rpm –
designed speed (red), 920 rpm – measured speed (blue) and 950 rpm (magenta). However, a constant distribution near to shroud is obtained where the runner operates like a pump. This constant distribution of the tangential velocity near to the shroud occurs due to the flow separation. Consequently, the runner is working worse like a pump near to the shroud than the designed one. As a result, the torque balance between the turbine and the pump conditions on the runner blades is modified leading to an increased runner speed (from 870 rpm at design stage to the 920 rpm measured on the test rig) in order to spin freely. A system equipped with magnetic sensor was installed on the rig to measure the free runner speed in order to support the previous explanation. The experimental setup is described in next section.
Figure ii.2.19 presents comparison of the two velocity components: meridian and tangential velocity from experimental investigation in comparison with numerical simulation. A good agreement between numerical results and experimental data is obtained for both velocity components. For measured meridian velocity component at the middle of survey axis is noted largest values for RMS due to transition of the blade geometry from turbine configuration to the pump configuration, Muntean et al. (2011).
Conclusively, the numerical results are validated against experimental data. The hydrodynamics of swirl generator is accurately evaluated. As a result, the flow ingested by the test section is accurately computed leading to a controlled decelerated swirling flow in the conical diffuser.
Figure ii.2.19 Comparison between measured velocity profiles (meridian and tangential components) along
to the survey axis from W0 and computed velocity profiles with 920 rpm runner speed.
0.045 0.055 0.065 0.075radius [m]
0
1
2
3
4
5
axia
l vel
ocity
[m/s
]
runner analisys − Fluent 3D
inviscid swirl design870 rpm (design)920 rpm (measured)950 rpm
0.045 0.055 0.065 0.075radius [m]
0
0.5
1
1.5
2
2.5
3
tang
entia
l vel
ocity
[m/s
]
runner analysis − Fluent 3D
inviscid swirl design870 rpm (design)920 rpm (measured)950 rpm
0 0.1 0.2 0.3 0.4 0.5 0.6dimensionless survey axis [−]
0
0.5
1
1.5
2
dim
ensi
onle
ss v
eloc
ity [−
]
W0
measured meridian velocitynumerical meridional velocity
0 0.1 0.2 0.3 0.4 0.5 0.6dimensionless survey axis [−]
0
0.5
1
1.5
2
dim
ensi
onle
ss v
eloc
ity [−
]
W0
measured tangential velocitynumerical tangential velocity
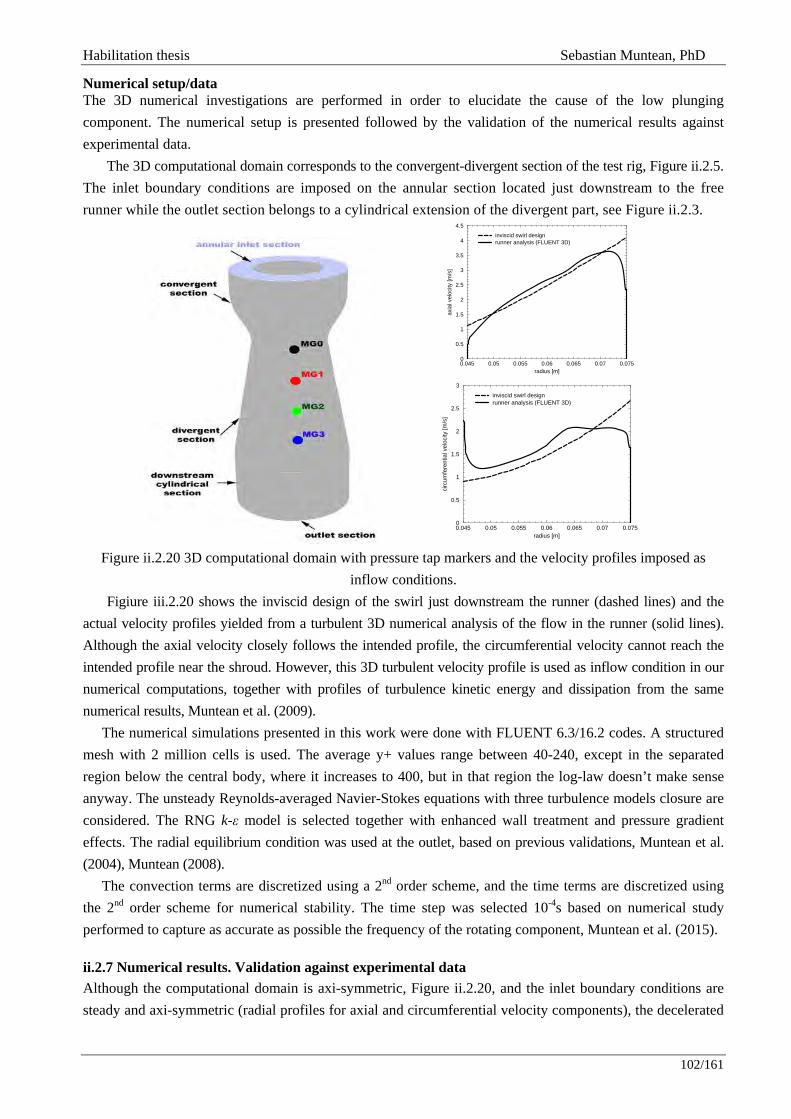
Habilitation thesis Sebastian Muntean, PhD
102/161
Numerical setup/data The 3D numerical investigations are performed in order to elucidate the cause of the low plunging component. The numerical setup is presented followed by the validation of the numerical results against experimental data.
The 3D computational domain corresponds to the convergent-divergent section of the test rig, Figure ii.2.5. The inlet boundary conditions are imposed on the annular section located just downstream to the free runner while the outlet section belongs to a cylindrical extension of the divergent part, see Figure ii.2.3.
Figure ii.2.20 3D computational domain with pressure tap markers and the velocity profiles imposed as
inflow conditions. Figiure iii.2.20 shows the inviscid design of the swirl just downstream the runner (dashed lines) and the
actual velocity profiles yielded from a turbulent 3D numerical analysis of the flow in the runner (solid lines). Although the axial velocity closely follows the intended profile, the circumferential velocity cannot reach the intended profile near the shroud. However, this 3D turbulent velocity profile is used as inflow condition in our numerical computations, together with profiles of turbulence kinetic energy and dissipation from the same numerical results, Muntean et al. (2009).
The numerical simulations presented in this work were done with FLUENT 6.3/16.2 codes. A structured mesh with 2 million cells is used. The average y+ values range between 40-240, except in the separated region below the central body, where it increases to 400, but in that region the log-law doesn’t make sense anyway. The unsteady Reynolds-averaged Navier-Stokes equations with three turbulence models closure are considered. The RNG k-ε model is selected together with enhanced wall treatment and pressure gradient effects. The radial equilibrium condition was used at the outlet, based on previous validations, Muntean et al. (2004), Muntean (2008).
The convection terms are discretized using a 2nd order scheme, and the time terms are discretized using the 2nd order scheme for numerical stability. The time step was selected 10-4s based on numerical study performed to capture as accurate as possible the frequency of the rotating component, Muntean et al. (2015).
ii.2.7 Numerical results. Validation against experimental data Although the computational domain is axi-symmetric, Figure ii.2.20, and the inlet boundary conditions are steady and axi-symmetric (radial profiles for axial and circumferential velocity components), the decelerated
0.045 0.05 0.055 0.06 0.065 0.07 0.075radius [m]
0
0.5
1
1.5
2
2.5
3
3.5
4
4.5
axia
l vel
ocity
[m/s
]
inviscid swirl designrunner analysis (FLUENT 3D)
0.045 0.05 0.055 0.06 0.065 0.07 0.075radius [m]
0
0.5
1
1.5
2
2.5
3
circ
umfe
rent
ial v
eloc
ity [m
/s]
inviscid swirl designrunner analysis (FLUENT 3D)
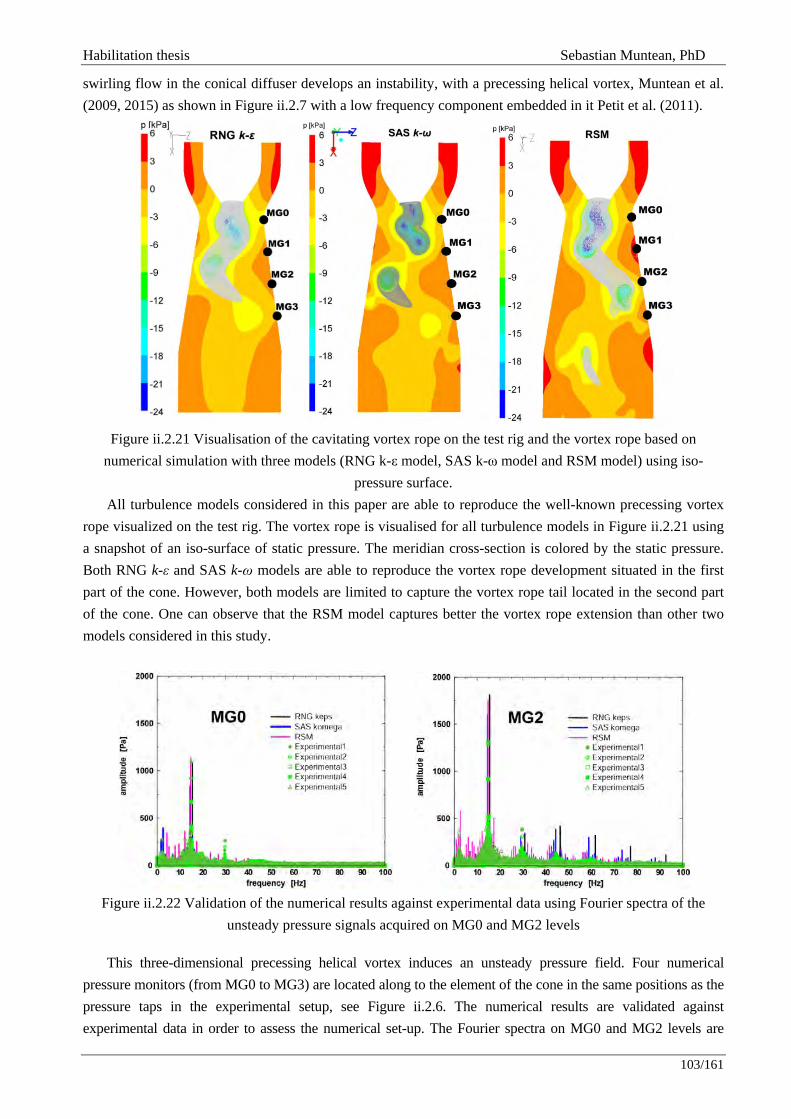
Habilitation thesis Sebastian Muntean, PhD
103/161
swirling flow in the conical diffuser develops an instability, with a precessing helical vortex, Muntean et al. (2009, 2015) as shown in Figure ii.2.7 with a low frequency component embedded in it Petit et al. (2011).
Figure ii.2.21 Visualisation of the cavitating vortex rope on the test rig and the vortex rope based on
numerical simulation with three models (RNG k-ε model, SAS k-ω model and RSM model) using iso-pressure surface.
All turbulence models considered in this paper are able to reproduce the well-known precessing vortex rope visualized on the test rig. The vortex rope is visualised for all turbulence models in Figure ii.2.21 using a snapshot of an iso-surface of static pressure. The meridian cross-section is colored by the static pressure. Both RNG k-ε and SAS k-ω models are able to reproduce the vortex rope development situated in the first part of the cone. However, both models are limited to capture the vortex rope tail located in the second part of the cone. One can observe that the RSM model captures better the vortex rope extension than other two models considered in this study.
Figure ii.2.22 Validation of the numerical results against experimental data using Fourier spectra of the
unsteady pressure signals acquired on MG0 and MG2 levels
This three-dimensional precessing helical vortex induces an unsteady pressure field. Four numerical pressure monitors (from MG0 to MG3) are located along to the element of the cone in the same positions as the pressure taps in the experimental setup, see Figure ii.2.6. The numerical results are validated against experimental data in order to assess the numerical set-up. The Fourier spectra on MG0 and MG2 levels are
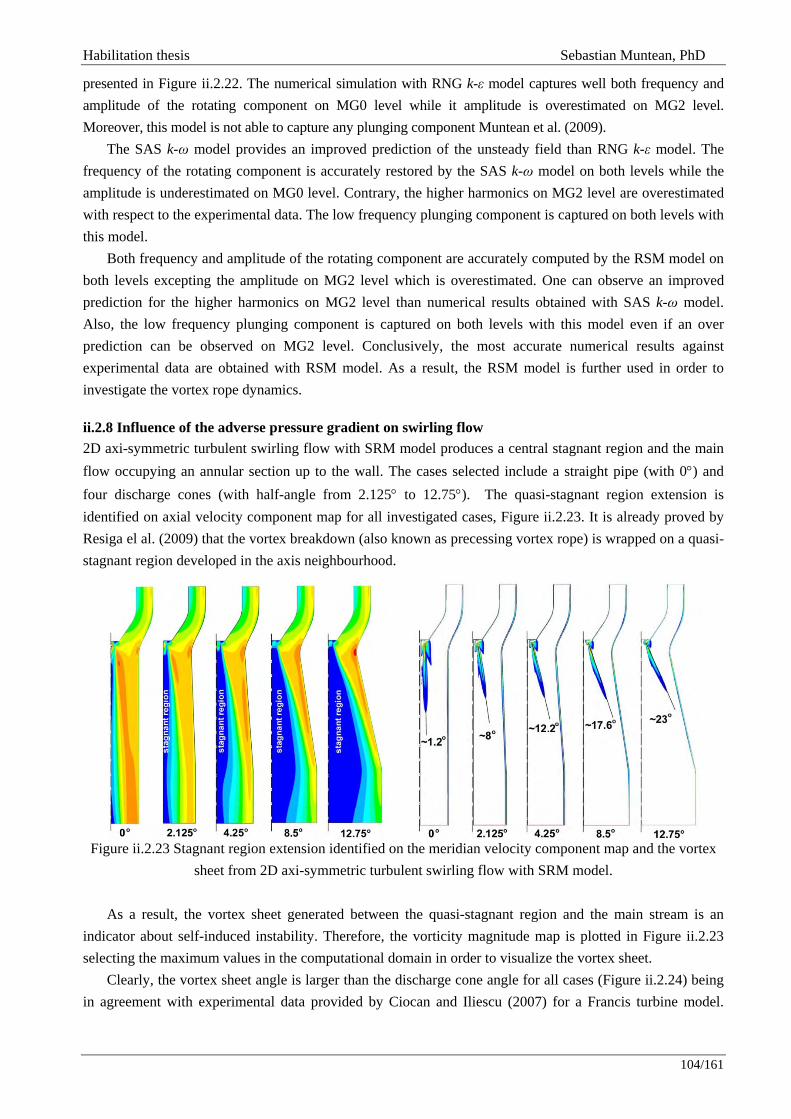
Habilitation thesis Sebastian Muntean, PhD
104/161
presented in Figure ii.2.22. The numerical simulation with RNG k-ε model captures well both frequency and amplitude of the rotating component on MG0 level while it amplitude is overestimated on MG2 level. Moreover, this model is not able to capture any plunging component Muntean et al. (2009).
The SAS k-ω model provides an improved prediction of the unsteady field than RNG k-ε model. The frequency of the rotating component is accurately restored by the SAS k-ω model on both levels while the amplitude is underestimated on MG0 level. Contrary, the higher harmonics on MG2 level are overestimated with respect to the experimental data. The low frequency plunging component is captured on both levels with this model.
Both frequency and amplitude of the rotating component are accurately computed by the RSM model on both levels excepting the amplitude on MG2 level which is overestimated. One can observe an improved prediction for the higher harmonics on MG2 level than numerical results obtained with SAS k-ω model. Also, the low frequency plunging component is captured on both levels with this model even if an over prediction can be observed on MG2 level. Conclusively, the most accurate numerical results against experimental data are obtained with RSM model. As a result, the RSM model is further used in order to investigate the vortex rope dynamics.
ii.2.8 Influence of the adverse pressure gradient on swirling flow 2D axi-symmetric turbulent swirling flow with SRM model produces a central stagnant region and the main flow occupying an annular section up to the wall. The cases selected include a straight pipe (with 0°) and four discharge cones (with half-angle from 2.125° to 12.75°). The quasi-stagnant region extension is identified on axial velocity component map for all investigated cases, Figure ii.2.23. It is already proved by Resiga el al. (2009) that the vortex breakdown (also known as precessing vortex rope) is wrapped on a quasi-stagnant region developed in the axis neighbourhood.
Figure ii.2.23 Stagnant region extension identified on the meridian velocity component map and the vortex
sheet from 2D axi-symmetric turbulent swirling flow with SRM model. As a result, the vortex sheet generated between the quasi-stagnant region and the main stream is an
indicator about self-induced instability. Therefore, the vorticity magnitude map is plotted in Figure ii.2.23 selecting the maximum values in the computational domain in order to visualize the vortex sheet.
Clearly, the vortex sheet angle is larger than the discharge cone angle for all cases (Figure ii.2.24) being in agreement with experimental data provided by Ciocan and Iliescu (2007) for a Francis turbine model.
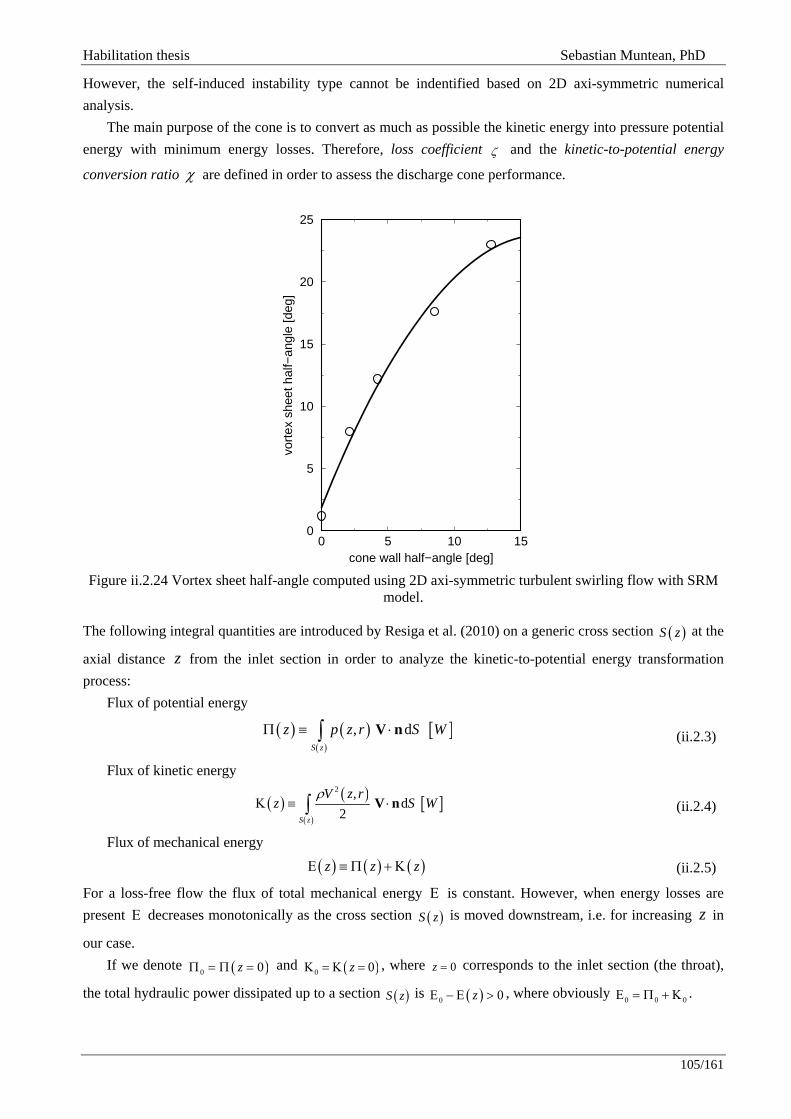
Habilitation thesis Sebastian Muntean, PhD
105/161
However, the self-induced instability type cannot be indentified based on 2D axi-symmetric numerical analysis.
The main purpose of the cone is to convert as much as possible the kinetic energy into pressure potential energy with minimum energy losses. Therefore, loss coefficient ζ and the kinetic-to-potential energy
conversion ratio χ are defined in order to assess the discharge cone performance.
Figure ii.2.24 Vortex sheet half-angle computed using 2D axi-symmetric turbulent swirling flow with SRM
model. The following integral quantities are introduced by Resiga et al. (2010) on a generic cross section ( )S z at the
axial distance z from the inlet section in order to analyze the kinetic-to-potential energy transformation process:
Flux of potential energy
( ) ( )( )
[ ], dS z
z p z r S WΠ ≡ ⋅∫ V n (ii.2.3)
Flux of kinetic energy
( ) ( )( )
[ ]2 ,
d2S z
V z rz S W
ρΚ ≡ ⋅∫ V n (ii.2.4)
Flux of mechanical energy
( ) ( ) ( )z z zΕ ≡ Π + Κ (ii.2.5)
For a loss-free flow the flux of total mechanical energy Ε is constant. However, when energy losses are present Ε decreases monotonically as the cross section ( )S z is moved downstream, i.e. for increasing z in
our case. If we denote ( )0 0zΠ = Π = and ( )0 0zΚ = Κ = , where 0z = corresponds to the inlet section (the throat),
the total hydraulic power dissipated up to a section ( )S z is ( )0 0zΕ − Ε > , where obviously 0 0 0Ε = Π + Κ .
0 5 10 15cone wall half−angle [deg]
0
5
10
15
20
25
vort
ex s
heet
hal
f−an
gle
[deg
]
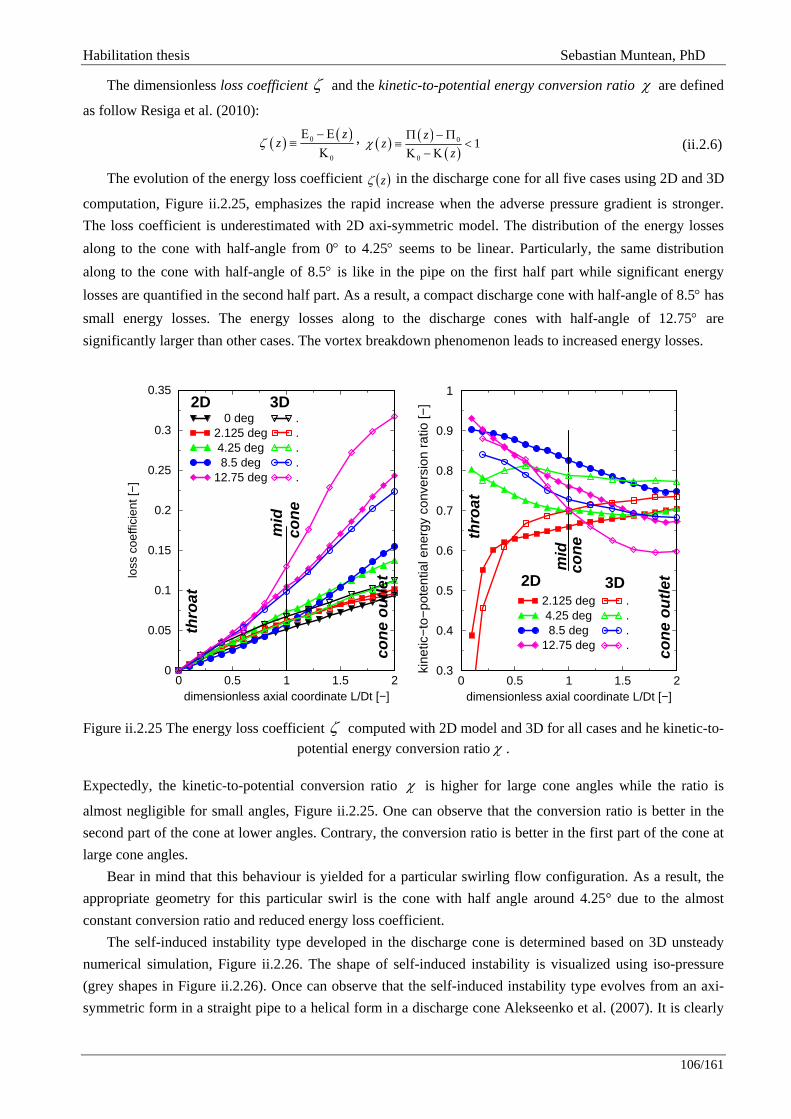
Habilitation thesis Sebastian Muntean, PhD
106/161
The dimensionless loss coefficient ζ and the kinetic-to-potential energy conversion ratio χ are defined
as follow Resiga et al. (2010):
( ) ( )0
0
zzζ
Ε − Ε≡
Κ, ( ) ( )
( )0
0
1z
zz
χΠ − Π
≡ <Κ − Κ
(ii.2.6)
The evolution of the energy loss coefficient ( )zζ in the discharge cone for all five cases using 2D and 3D
computation, Figure ii.2.25, emphasizes the rapid increase when the adverse pressure gradient is stronger. The loss coefficient is underestimated with 2D axi-symmetric model. The distribution of the energy losses along to the cone with half-angle from 0° to 4.25° seems to be linear. Particularly, the same distribution along to the cone with half-angle of 8.5° is like in the pipe on the first half part while significant energy losses are quantified in the second half part. As a result, a compact discharge cone with half-angle of 8.5° has small energy losses. The energy losses along to the discharge cones with half-angle of 12.75° are significantly larger than other cases. The vortex breakdown phenomenon leads to increased energy losses.
Figure ii.2.25 The energy loss coefficient ζ computed with 2D model and 3D for all cases and he kinetic-to-potential energy conversion ratio χ .
Expectedly, the kinetic-to-potential conversion ratio χ is higher for large cone angles while the ratio is
almost negligible for small angles, Figure ii.2.25. One can observe that the conversion ratio is better in the second part of the cone at lower angles. Contrary, the conversion ratio is better in the first part of the cone at large cone angles.
Bear in mind that this behaviour is yielded for a particular swirling flow configuration. As a result, the appropriate geometry for this particular swirl is the cone with half angle around 4.25° due to the almost constant conversion ratio and reduced energy loss coefficient.
The self-induced instability type developed in the discharge cone is determined based on 3D unsteady numerical simulation, Figure ii.2.26. The shape of self-induced instability is visualized using iso-pressure (grey shapes in Figure ii.2.26). Once can observe that the self-induced instability type evolves from an axi-symmetric form in a straight pipe to a helical form in a discharge cone Alekseenko et al. (2007). It is clearly
0 0.5 1 1.5 2dimensionless axial coordinate L/Dt [−]
0
0.05
0.1
0.15
0.2
0.25
0.3
0.35
loss
coe
ffici
ent [
−]
0 deg2.125 deg 4.25 deg 8.5 deg12.75 deg
.
.
.
.
.
thro
at
mid
con
e
con
e o
utl
et2D 3D
0 0.5 1 1.5 2dimensionless axial coordinate L/Dt [−]
0.3
0.4
0.5
0.6
0.7
0.8
0.9
1
kine
tic−
to−
pote
ntia
l ene
rgy
conv
ersi
on r
atio
[−]
2.125 deg 4.25 deg 8.5 deg12.75 deg
.
.
.
.
thro
at
mid
con
e
con
e o
utl
et2D 3D
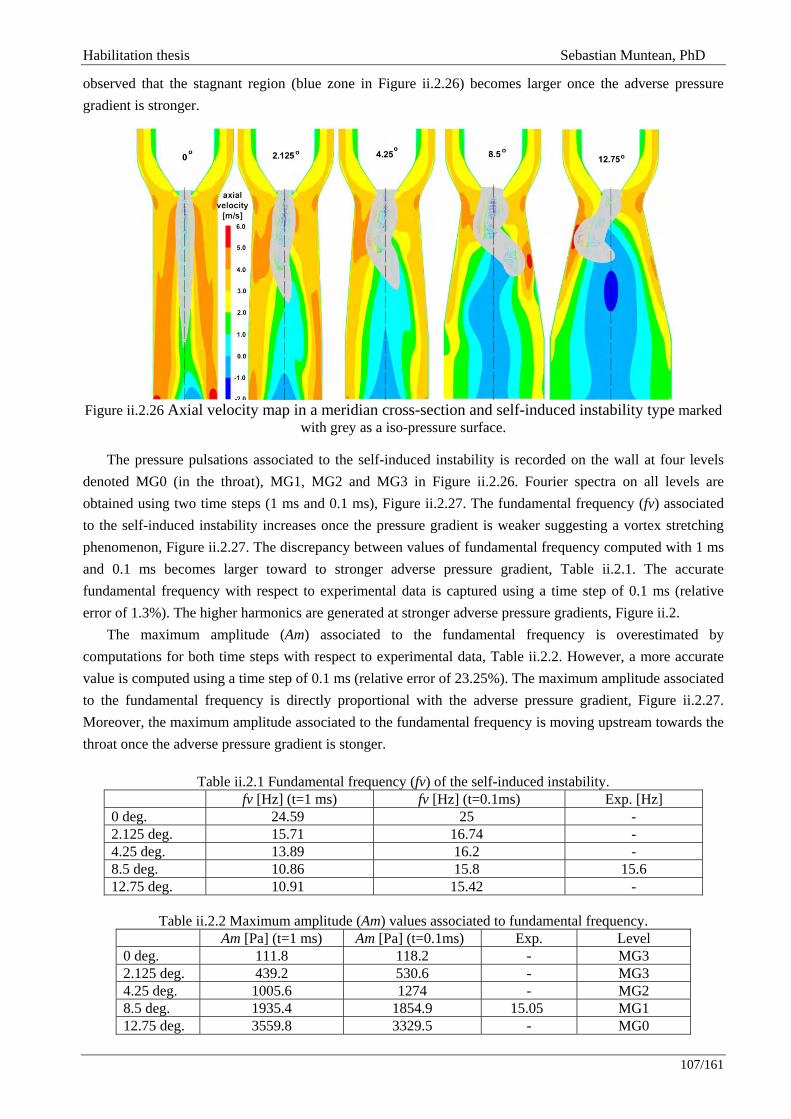
Habilitation thesis Sebastian Muntean, PhD
107/161
observed that the stagnant region (blue zone in Figure ii.2.26) becomes larger once the adverse pressure gradient is stronger.
Figure ii.2.26 Axial velocity map in a meridian cross-section and self-induced instability type marked
with grey as a iso-pressure surface. The pressure pulsations associated to the self-induced instability is recorded on the wall at four levels
denoted MG0 (in the throat), MG1, MG2 and MG3 in Figure ii.2.26. Fourier spectra on all levels are obtained using two time steps (1 ms and 0.1 ms), Figure ii.2.27. The fundamental frequency (fv) associated to the self-induced instability increases once the pressure gradient is weaker suggesting a vortex stretching phenomenon, Figure ii.2.27. The discrepancy between values of fundamental frequency computed with 1 ms and 0.1 ms becomes larger toward to stronger adverse pressure gradient, Table ii.2.1. The accurate fundamental frequency with respect to experimental data is captured using a time step of 0.1 ms (relative error of 1.3%). The higher harmonics are generated at stronger adverse pressure gradients, Figure ii.2.
The maximum amplitude (Am) associated to the fundamental frequency is overestimated by computations for both time steps with respect to experimental data, Table ii.2.2. However, a more accurate value is computed using a time step of 0.1 ms (relative error of 23.25%). The maximum amplitude associated to the fundamental frequency is directly proportional with the adverse pressure gradient, Figure ii.2.27. Moreover, the maximum amplitude associated to the fundamental frequency is moving upstream towards the throat once the adverse pressure gradient is stonger.
Table ii.2.1 Fundamental frequency (fv) of the self-induced instability. fv [Hz] (t=1 ms) fv [Hz] (t=0.1ms) Exp. [Hz] 0 deg. 24.59 25 - 2.125 deg. 15.71 16.74 - 4.25 deg. 13.89 16.2 - 8.5 deg. 10.86 15.8 15.6 12.75 deg. 10.91 15.42 -
Table ii.2.2 Maximum amplitude (Am) values associated to fundamental frequency.
Am [Pa] (t=1 ms) Am [Pa] (t=0.1ms) Exp. Level 0 deg. 111.8 118.2 - MG3 2.125 deg. 439.2 530.6 - MG3 4.25 deg. 1005.6 1274 - MG2 8.5 deg. 1935.4 1854.9 15.05 MG1 12.75 deg. 3559.8 3329.5 - MG0
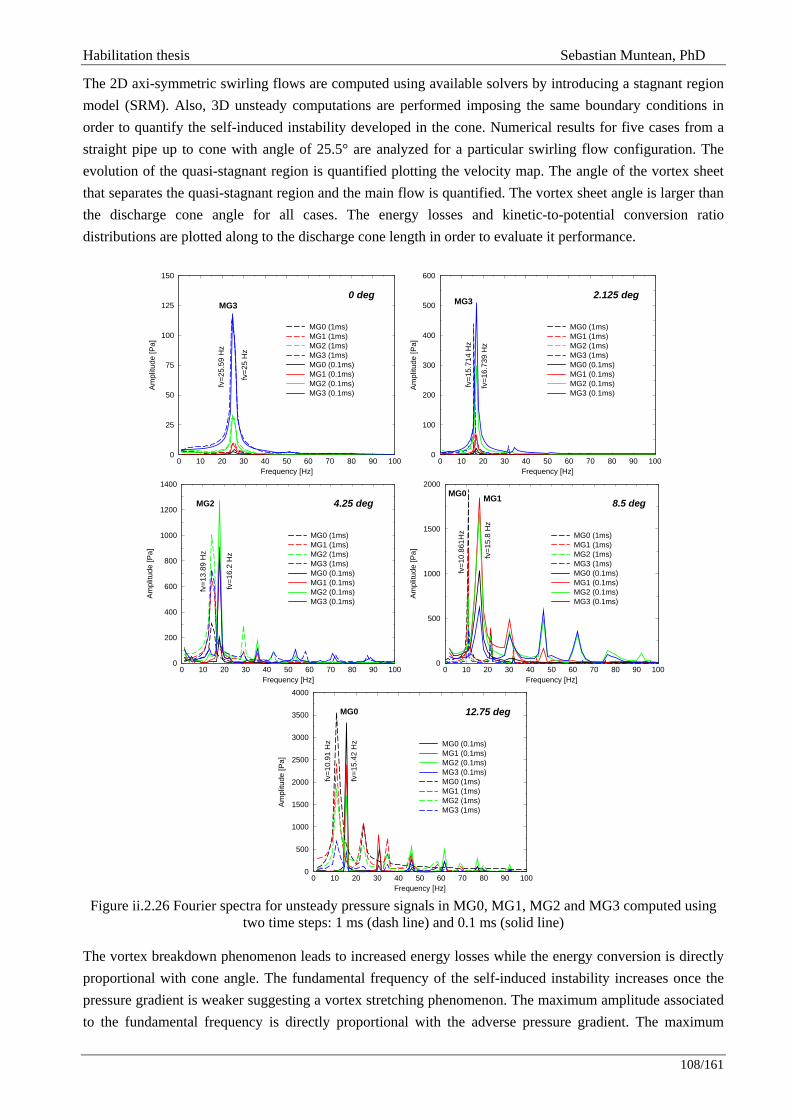
Habilitation thesis Sebastian Muntean, PhD
108/161
The 2D axi-symmetric swirling flows are computed using available solvers by introducing a stagnant region model (SRM). Also, 3D unsteady computations are performed imposing the same boundary conditions in order to quantify the self-induced instability developed in the cone. Numerical results for five cases from a straight pipe up to cone with angle of 25.5° are analyzed for a particular swirling flow configuration. The evolution of the quasi-stagnant region is quantified plotting the velocity map. The angle of the vortex sheet that separates the quasi-stagnant region and the main flow is quantified. The vortex sheet angle is larger than the discharge cone angle for all cases. The energy losses and kinetic-to-potential conversion ratio distributions are plotted along to the discharge cone length in order to evaluate it performance.
Figure ii.2.26 Fourier spectra for unsteady pressure signals in MG0, MG1, MG2 and MG3 computed using
two time steps: 1 ms (dash line) and 0.1 ms (solid line) The vortex breakdown phenomenon leads to increased energy losses while the energy conversion is directly proportional with cone angle. The fundamental frequency of the self-induced instability increases once the pressure gradient is weaker suggesting a vortex stretching phenomenon. The maximum amplitude associated to the fundamental frequency is directly proportional with the adverse pressure gradient. The maximum
0 10 20 30 40 50 60 70 80 90 100Frequency [Hz]
0
25
50
75
100
125
150
Am
plitu
de [P
a]
MG0 (1ms)MG1 (1ms)MG2 (1ms)MG3 (1ms)MG0 (0.1ms)MG1 (0.1ms)MG2 (0.1ms)MG3 (0.1ms)
0 degMG3
fv=
25.5
9 H
z
fv=
25 H
z
0 10 20 30 40 50 60 70 80 90 100Frequency [Hz]
0
100
200
300
400
500
600
Am
plitu
de [P
a]
MG0 (1ms)MG1 (1ms)MG2 (1ms)MG3 (1ms)MG0 (0.1ms)MG1 (0.1ms)MG2 (0.1ms)MG3 (0.1ms)
2.125 degMG3
fv=
15.7
14 H
z
fv=
16.7
39 H
z
0 10 20 30 40 50 60 70 80 90 100Frequency [Hz]
0
200
400
600
800
1000
1200
1400
Am
plitu
de [P
a]
MG0 (1ms)MG1 (1ms)MG2 (1ms)MG3 (1ms)MG0 (0.1ms)MG1 (0.1ms)MG2 (0.1ms)MG3 (0.1ms)
4.25 deg
fv=
13.8
9 H
z
fv=
16.2
Hz
MG2
0 10 20 30 40 50 60 70 80 90 100Frequency [Hz]
0
500
1000
1500
2000
Am
plitu
de [P
a]
MG0 (1ms)MG1 (1ms)MG2 (1ms)MG3 (1ms)MG0 (0.1ms)MG1 (0.1ms)MG2 (0.1ms)MG3 (0.1ms)
8.5 deg
fv=
10.8
61H
z
fv=
15.8
Hz
MG1MG0
0 10 20 30 40 50 60 70 80 90 100Frequency [Hz]
0
500
1000
1500
2000
2500
3000
3500
4000
Am
plitu
de [P
a]
MG0 (0.1ms)MG1 (0.1ms)MG2 (0.1ms)MG3 (0.1ms)MG0 (1ms)MG1 (1ms)MG2 (1ms)MG3 (1ms)
12.75 deg
fv=
10.9
1 H
z
fv=
15.4
2 H
z
MG0
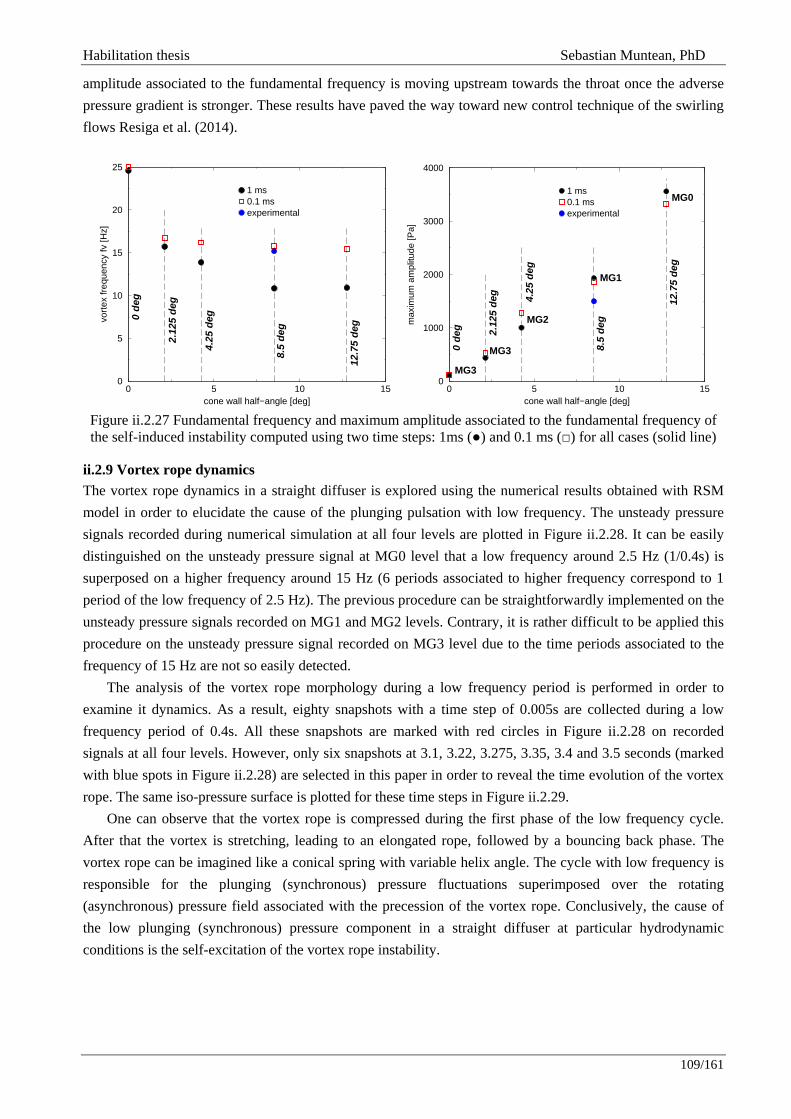
Habilitation thesis Sebastian Muntean, PhD
109/161
amplitude associated to the fundamental frequency is moving upstream towards the throat once the adverse pressure gradient is stronger. These results have paved the way toward new control technique of the swirling flows Resiga et al. (2014).
Figure ii.2.27 Fundamental frequency and maximum amplitude associated to the fundamental frequency of the self-induced instability computed using two time steps: 1ms () and 0.1 ms () for all cases (solid line)
ii.2.9 Vortex rope dynamics The vortex rope dynamics in a straight diffuser is explored using the numerical results obtained with RSM model in order to elucidate the cause of the plunging pulsation with low frequency. The unsteady pressure signals recorded during numerical simulation at all four levels are plotted in Figure ii.2.28. It can be easily distinguished on the unsteady pressure signal at MG0 level that a low frequency around 2.5 Hz (1/0.4s) is superposed on a higher frequency around 15 Hz (6 periods associated to higher frequency correspond to 1 period of the low frequency of 2.5 Hz). The previous procedure can be straightforwardly implemented on the unsteady pressure signals recorded on MG1 and MG2 levels. Contrary, it is rather difficult to be applied this procedure on the unsteady pressure signal recorded on MG3 level due to the time periods associated to the frequency of 15 Hz are not so easily detected.
The analysis of the vortex rope morphology during a low frequency period is performed in order to examine it dynamics. As a result, eighty snapshots with a time step of 0.005s are collected during a low frequency period of 0.4s. All these snapshots are marked with red circles in Figure ii.2.28 on recorded signals at all four levels. However, only six snapshots at 3.1, 3.22, 3.275, 3.35, 3.4 and 3.5 seconds (marked with blue spots in Figure ii.2.28) are selected in this paper in order to reveal the time evolution of the vortex rope. The same iso-pressure surface is plotted for these time steps in Figure ii.2.29.
One can observe that the vortex rope is compressed during the first phase of the low frequency cycle. After that the vortex is stretching, leading to an elongated rope, followed by a bouncing back phase. The vortex rope can be imagined like a conical spring with variable helix angle. The cycle with low frequency is responsible for the plunging (synchronous) pressure fluctuations superimposed over the rotating (asynchronous) pressure field associated with the precession of the vortex rope. Conclusively, the cause of the low plunging (synchronous) pressure component in a straight diffuser at particular hydrodynamic conditions is the self-excitation of the vortex rope instability.
0 5 10 15cone wall half−angle [deg]
0
5
10
15
20
25
vort
ex fr
eque
ncy
fv [H
z]
1 ms0.1 msexperimental
2.12
5 d
eg
0 d
eg
4.25
deg
8.5
deg
12.7
5 d
eg
0 5 10 15cone wall half−angle [deg]
0
1000
2000
3000
4000
max
imum
am
plitu
de [P
a]
1 ms0.1 msexperimental
2.12
5 d
eg
0 d
eg
4.25
deg
8.5
deg
12.7
5 d
eg
MG3
MG3
MG2
MG1
MG0

Habilitation thesis Sebastian Muntean, PhD
110/161
Figure ii.2.28 Unsteady pressure signals recorded at all four levels on the cone (from MG0 to MG3, see
Figure ii.2.6) based on 3D numerical simulation with RSM model.
Figure ii.2.29 Morphology of the vortex rope at several time steps obtained from 3D numerical simulation
using iso-pressure surface. The snapshots correspond to six time steps (3.1, 3.22, 3.275, 3.35, 3.4 and 3.5 s) marked with blue spots in Figure ii.2.23.
ii.2.10 Magneto-rheological break (MRB) flow control As was mentioned before in a first configuration the runner rotates freely at the runaway speed of 1020 rpm. In order to increase the operating regimes from the experimental test rig, a magneto-rheological brake (MRB) system was designed and installed in order to control the runner speed. As a result, the runner speed is slow down up to 35% using the MRB system providing several swirling flow configurations at the discharge cone inlet covering a wide range (from part load to full load conditions). This solution was chosen because have some advantages as: small and robust, no mechanical parts, fast response time in order to control and low power consuming. In our case, all system was especially designed to be adapted to our

Habilitation thesis Sebastian Muntean, PhD
111/161
geometric constraints. As a working principle, a magneto-rheological (MR) fluid is mounted between one rotating part and other fixed part. The MR fluid is changing it viscosity when a magnetic field (usually generated by a coil) is applied. Depending by the intensity of the magnetic field the viscosity is changing which makes that the rotating part to slow down the speed. A sketch with the MRB system and assembled components are presented in Figure ii.2.30.
Figure ii.2.30 Sketch of the MRB system (left) and picture with mounted pieces (right) The runner was manufactured so that to be mounted the MRB system. The MRB system consists in iron
housing, a coil, seals and bearings and the MR fluid. The housing is made of iron and was design in order to close the magnetic field in the area where MR fluid is mounted. The coil is made by cupper wires and a custom program was used to choose the number of wires and the wire thickness. A series of seals were used to keep the MR fluid separated by water (all system is surrounded by water), also these seals were used as bearings. The most important component by all system is the MR fluid. It was chosen a concentrated ferrofluid based MR fluid produced in our laboratory with 35% micro sized Fe particles concentration, Susan-Resiga and Vekas (2016). For the MR brake controlling the speed of the runner a quantity of 20 ml of MR fluid was necessary. The gap between rotating and fixed part is 1 mm and time response of the entire system is lower than 0.1 sec. Because the MRB system is working in water, no cooling system is necessary. A DC power supply with a maximum electrical voltage of 30V and a maximum electrical current of 5 A was used in order to control the magnetic field of the MR brake. Experimental setup The investigated regimes are presented in Table ii.2.3.
Table ii.2.3 Discharge fraction through the outlet channels
Main characteristic Speed [rpm] Flow Rate [l/sec]
1020, 990, 960, 924, 900, 870, 840, 810, 780, 690 30 In our investigations a nominal discharge of 30 l/s is selected. In this case, the swirling flow configuration provided by the stay vanes leads to a free runner speed of 1020 rpm. With the MRB, the speed is slow down up to 690 rpm, with a step size of 30 rpm. Accordingly the speed is reduced with 35%. Results At the runaway speed (1020 rpm), the vortex rope is a vortex sheet which rolls-up as a helical vortex around a central stagnant region; the vortex rope is the source of pressure pulsations from the draft tube cone. At 600 rpm, the flow in the draft tube cone has an axisymmetric form, while the pressure pulsations have a
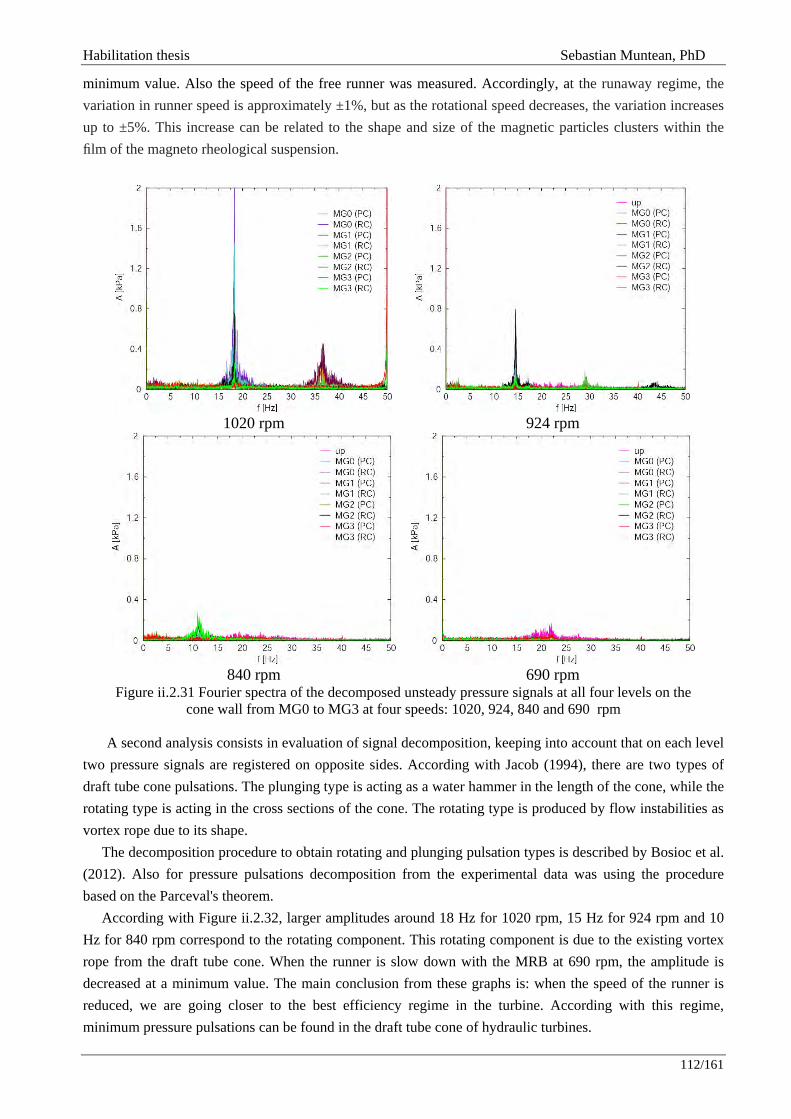
Habilitation thesis Sebastian Muntean, PhD
112/161
minimum value. Also the speed of the free runner was measured. Accordingly, at the runaway regime, the variation in runner speed is approximately ±1%, but as the rotational speed decreases, the variation increases up to ±5%. This increase can be related to the shape and size of the magnetic particles clusters within the film of the magneto rheological suspension.
1020 rpm
924 rpm
840 rpm
690 rpm
Figure ii.2.31 Fourier spectra of the decomposed unsteady pressure signals at all four levels on the cone wall from MG0 to MG3 at four speeds: 1020, 924, 840 and 690 rpm
A second analysis consists in evaluation of signal decomposition, keeping into account that on each level
two pressure signals are registered on opposite sides. According with Jacob (1994), there are two types of draft tube cone pulsations. The plunging type is acting as a water hammer in the length of the cone, while the rotating type is acting in the cross sections of the cone. The rotating type is produced by flow instabilities as vortex rope due to its shape.
The decomposition procedure to obtain rotating and plunging pulsation types is described by Bosioc et al. (2012). Also for pressure pulsations decomposition from the experimental data was using the procedure based on the Parceval's theorem.
According with Figure ii.2.32, larger amplitudes around 18 Hz for 1020 rpm, 15 Hz for 924 rpm and 10 Hz for 840 rpm correspond to the rotating component. This rotating component is due to the existing vortex rope from the draft tube cone. When the runner is slow down with the MRB at 690 rpm, the amplitude is decreased at a minimum value. The main conclusion from these graphs is: when the speed of the runner is reduced, we are going closer to the best efficiency regime in the turbine. According with this regime, minimum pressure pulsations can be found in the draft tube cone of hydraulic turbines.
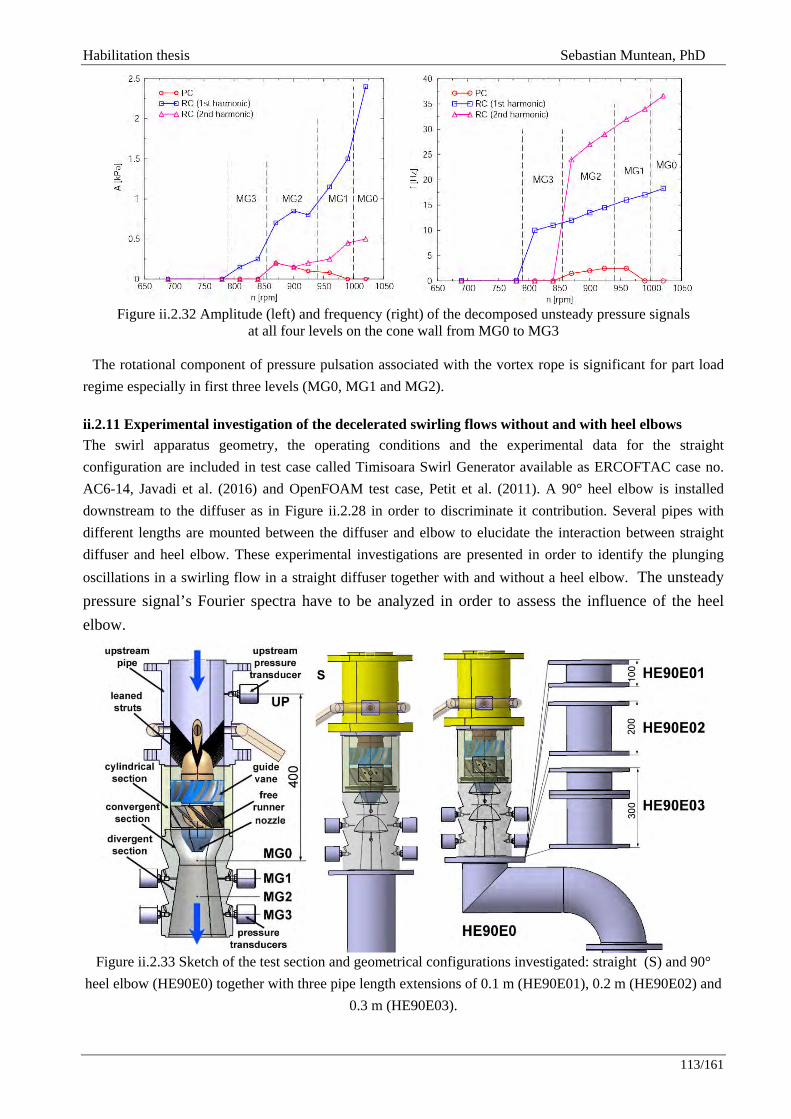
Habilitation thesis Sebastian Muntean, PhD
113/161
Figure ii.2.32 Amplitude (left) and frequency (right) of the decomposed unsteady pressure signals at all four levels on the cone wall from MG0 to MG3
The rotational component of pressure pulsation associated with the vortex rope is significant for part load
regime especially in first three levels (MG0, MG1 and MG2).
ii.2.11 Experimental investigation of the decelerated swirling flows without and with heel elbows The swirl apparatus geometry, the operating conditions and the experimental data for the straight configuration are included in test case called Timisoara Swirl Generator available as ERCOFTAC case no. AC6-14, Javadi et al. (2016) and OpenFOAM test case, Petit et al. (2011). A 90° heel elbow is installed downstream to the diffuser as in Figure ii.2.28 in order to discriminate it contribution. Several pipes with different lengths are mounted between the diffuser and elbow to elucidate the interaction between straight diffuser and heel elbow. These experimental investigations are presented in order to identify the plunging oscillations in a swirling flow in a straight diffuser together with and without a heel elbow. The unsteady pressure signal’s Fourier spectra have to be analyzed in order to assess the influence of the heel elbow.
Figure ii.2.33 Sketch of the test section and geometrical configurations investigated: straight (S) and 90°
heel elbow (HE90E0) together with three pipe length extensions of 0.1 m (HE90E01), 0.2 m (HE90E02) and 0.3 m (HE90E03).

Habilitation thesis Sebastian Muntean, PhD
114/161
Figure ii.2.34 Photos of the test section with two geometrical configurations: straight (S) and 90° heel elbow
together with pipe length extensions of 0.2 m (HE90E02). The unsteady pressure is measured using eight transducers mounted on four levels of the conical
diffuser’s wall. Each set corresponds to an acquisition time interval of 32 seconds at a sampling rate of 256 samples/second. The unsteady pressure signals acquired on each level are processed discriminating both synchronous (plunging) and asynchronous (rotating) components on the Fourier spectra.
Firstly, the influence of the 90° hell elbow on the decelerated swirling flow is quantified. Therefore, the experimental data for a straight configuration (denote S in Figure ii.2.33) and the geometrical configuration with 90° heel elbow installed downstream to the conical diffuser (labelled HE90E0 in Figure ii.2.34) are presented in Figure ii.2.34. The rotating component frequency around18 Hz associated to the self induced instability is distinguished in both cases. This rotating component is not so dangerous due to it is trapped in the conical section Wu et al. (2013).
However, the plunging component with frequency around 7 Hz is only identified in the geometrical configuration with 90° heel elbow at all levels. As a result, this frequency is associated to the interaction between the decelerated swirling flow in the diffuser and 90° heel elbow.
Secondly, the interaction between decelerated swirling flow developed in the conical diffuser and 90° heel elbow is investigated. This study is performed installing three pipe extensions with different lengths (0.1 m – HE90E01, 0.2 m - HE90E02 and 0.3 m - HE90E03) between the conical diffuser and 90° heel elbow as in Figures iii.2.36. Consequently, the Fourier spectra with discriminated components (plunging and rotating) on all levels for cases with 90° heel elbow are plotted in Figure ii.2.36. One can observe that all frequencies indentified in the spectra associated to 90° heel elbow case (HE90E0) are recovered for the cases with pipe extensions. However, the amplitude value associated to the plunging component of 7 Hz increases with the pipe length extension. This amplitude grows up over four times for the configuration with the largest pipe extension of 0.3 m (HE90E03 case) considered in our investigation with respect to the configuration without any extension (HE90E0 case), respectively. This observation suggests that a compact geometrical configuration should be selected for the hydraulic turbines in order to diminish the amplitudes associated to the plunging components.

Habilitation thesis Sebastian Muntean, PhD
115/161
Figure ii.2.35 Fourier spectra with discriminated components (plunging and rotating) corresponding to the unsteady pressure levels from MG0 to MG3 levels associated to two geometrical configurations: straight (S)
and 90° heel elbow (HE90E0)

Habilitation thesis Sebastian Muntean, PhD
116/161
Figure ii.2.36 Fourier spectra with discriminated signals associated to the unsteady pressure levels from
MG0 to MG3 for geometrical configurations investigated: straight (S) and 90° heel elbow (HE90E0) together with three pipe length extensions of 0.1 m (HE90E01), 0.2 m (HE90E02) and 0.3 m (HE90E03).
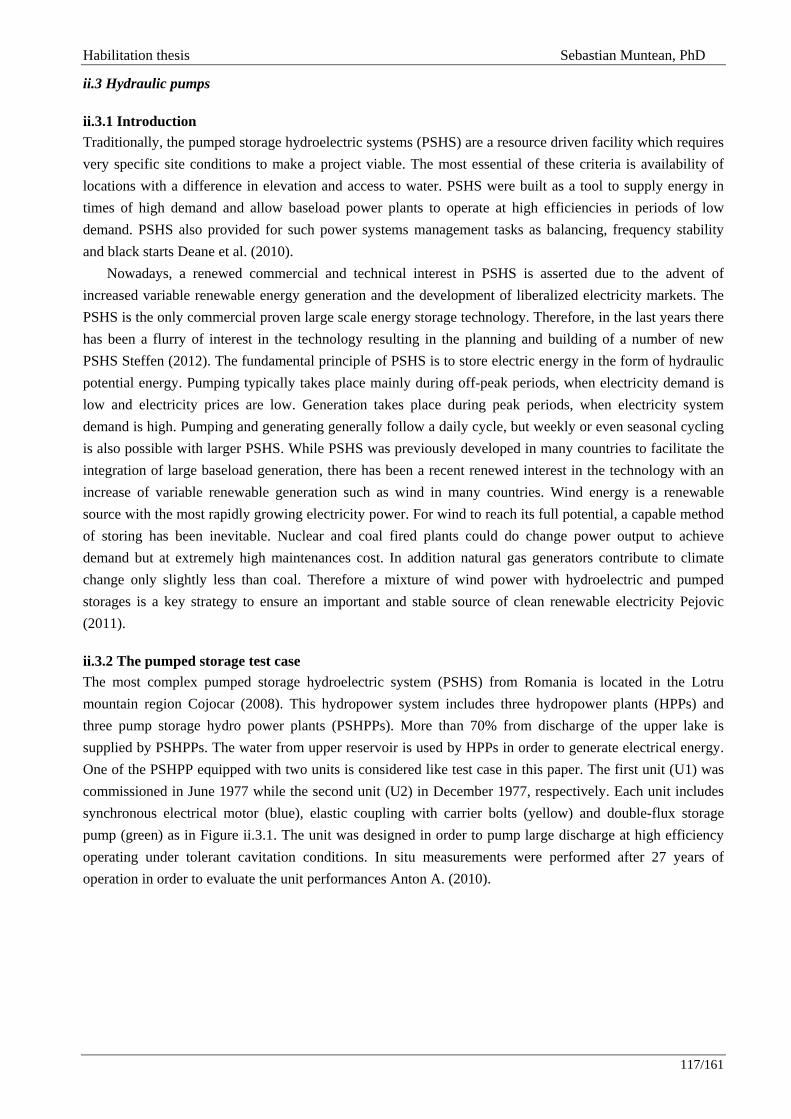
Habilitation thesis Sebastian Muntean, PhD
117/161
ii.3 Hydraulic pumps
ii.3.1 Introduction Traditionally, the pumped storage hydroelectric systems (PSHS) are a resource driven facility which requires very specific site conditions to make a project viable. The most essential of these criteria is availability of locations with a difference in elevation and access to water. PSHS were built as a tool to supply energy in times of high demand and allow baseload power plants to operate at high efficiencies in periods of low demand. PSHS also provided for such power systems management tasks as balancing, frequency stability and black starts Deane et al. (2010).
Nowadays, a renewed commercial and technical interest in PSHS is asserted due to the advent of increased variable renewable energy generation and the development of liberalized electricity markets. The PSHS is the only commercial proven large scale energy storage technology. Therefore, in the last years there has been a flurry of interest in the technology resulting in the planning and building of a number of new PSHS Steffen (2012). The fundamental principle of PSHS is to store electric energy in the form of hydraulic potential energy. Pumping typically takes place mainly during off-peak periods, when electricity demand is low and electricity prices are low. Generation takes place during peak periods, when electricity system demand is high. Pumping and generating generally follow a daily cycle, but weekly or even seasonal cycling is also possible with larger PSHS. While PSHS was previously developed in many countries to facilitate the integration of large baseload generation, there has been a recent renewed interest in the technology with an increase of variable renewable generation such as wind in many countries. Wind energy is a renewable source with the most rapidly growing electricity power. For wind to reach its full potential, a capable method of storing has been inevitable. Nuclear and coal fired plants could do change power output to achieve demand but at extremely high maintenances cost. In addition natural gas generators contribute to climate change only slightly less than coal. Therefore a mixture of wind power with hydroelectric and pumped storages is a key strategy to ensure an important and stable source of clean renewable electricity Pejovic (2011).
ii.3.2 The pumped storage test case The most complex pumped storage hydroelectric system (PSHS) from Romania is located in the Lotru mountain region Cojocar (2008). This hydropower system includes three hydropower plants (HPPs) and three pump storage hydro power plants (PSHPPs). More than 70% from discharge of the upper lake is supplied by PSHPPs. The water from upper reservoir is used by HPPs in order to generate electrical energy. One of the PSHPP equipped with two units is considered like test case in this paper. The first unit (U1) was commissioned in June 1977 while the second unit (U2) in December 1977, respectively. Each unit includes synchronous electrical motor (blue), elastic coupling with carrier bolts (yellow) and double-flux storage pump (green) as in Figure ii.3.1. The unit was designed in order to pump large discharge at high efficiency operating under tolerant cavitation conditions. In situ measurements were performed after 27 years of operation in order to evaluate the unit performances Anton A. (2010).
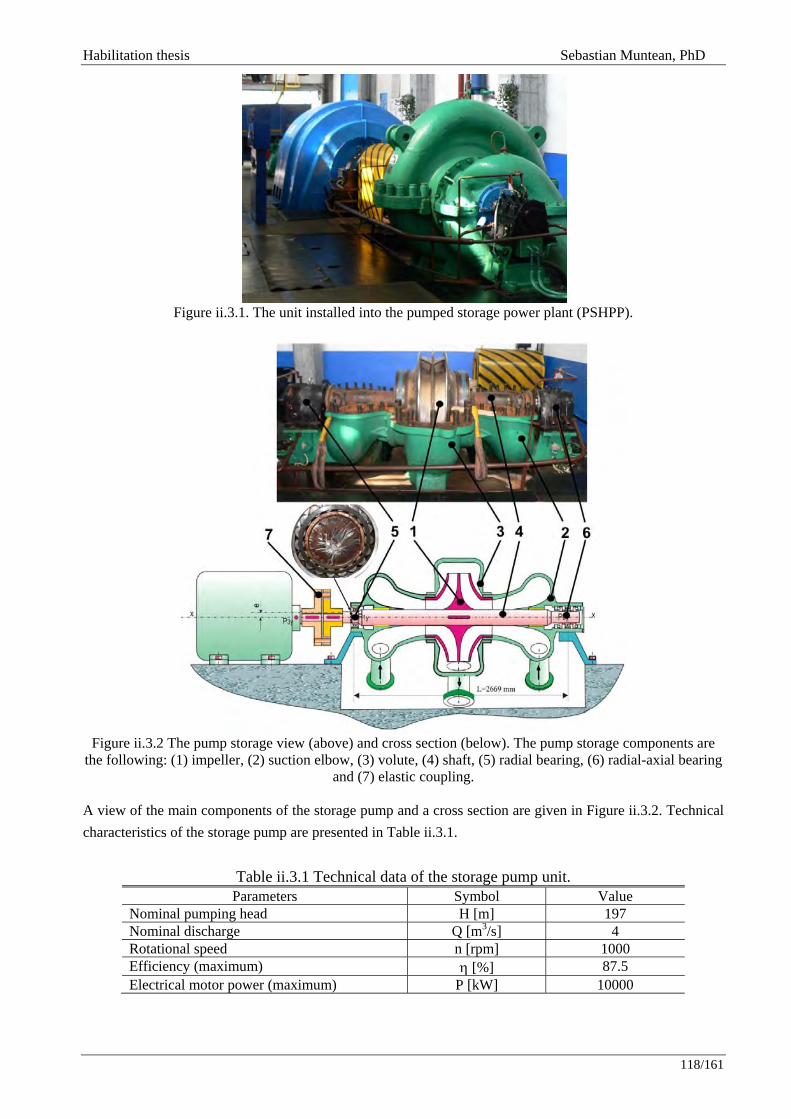
Habilitation thesis Sebastian Muntean, PhD
118/161
Figure ii.3.1. The unit installed into the pumped storage power plant (PSHPP).
Figure ii.3.2 The pump storage view (above) and cross section (below). The pump storage components are
the following: (1) impeller, (2) suction elbow, (3) volute, (4) shaft, (5) radial bearing, (6) radial-axial bearing and (7) elastic coupling.
A view of the main components of the storage pump and a cross section are given in Figure ii.3.2. Technical characteristics of the storage pump are presented in Table ii.3.1.
Table ii.3.1 Technical data of the storage pump unit. Parameters Symbol Value
Nominal pumping head H [m] 197 Nominal discharge Q [m3/s] 4 Rotational speed n [rpm] 1000 Efficiency (maximum) η [%] 87.5 Electrical motor power (maximum) P [kW] 10000
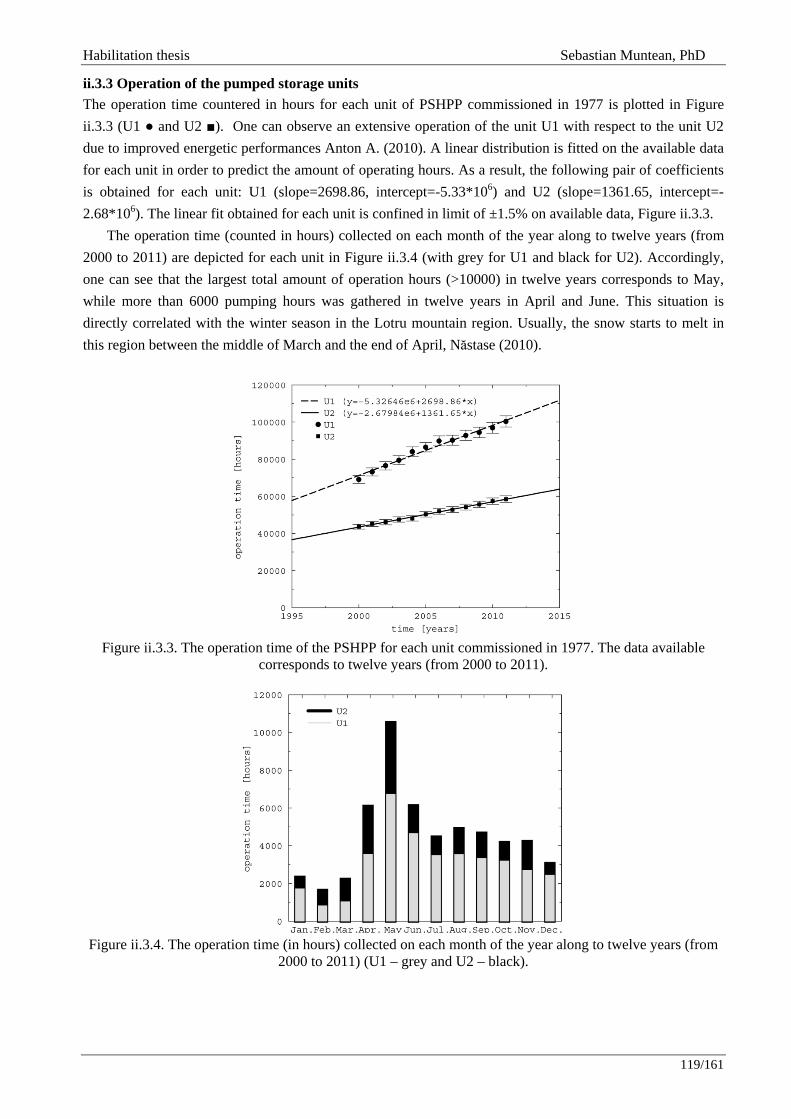
Habilitation thesis Sebastian Muntean, PhD
119/161
ii.3.3 Operation of the pumped storage units The operation time countered in hours for each unit of PSHPP commissioned in 1977 is plotted in Figure ii.3.3 (U1 and U2 ). One can observe an extensive operation of the unit U1 with respect to the unit U2 due to improved energetic performances Anton A. (2010). A linear distribution is fitted on the available data for each unit in order to predict the amount of operating hours. As a result, the following pair of coefficients is obtained for each unit: U1 (slope=2698.86, intercept=-5.33*106) and U2 (slope=1361.65, intercept=-2.68*106). The linear fit obtained for each unit is confined in limit of ±1.5% on available data, Figure ii.3.3.
The operation time (counted in hours) collected on each month of the year along to twelve years (from 2000 to 2011) are depicted for each unit in Figure ii.3.4 (with grey for U1 and black for U2). Accordingly, one can see that the largest total amount of operation hours (>10000) in twelve years corresponds to May, while more than 6000 pumping hours was gathered in twelve years in April and June. This situation is directly correlated with the winter season in the Lotru mountain region. Usually, the snow starts to melt in this region between the middle of March and the end of April, Năstase (2010).
Figure ii.3.3. The operation time of the PSHPP for each unit commissioned in 1977. The data available
corresponds to twelve years (from 2000 to 2011).
Figure ii.3.4. The operation time (in hours) collected on each month of the year along to twelve years (from
2000 to 2011) (U1 – grey and U2 – black).
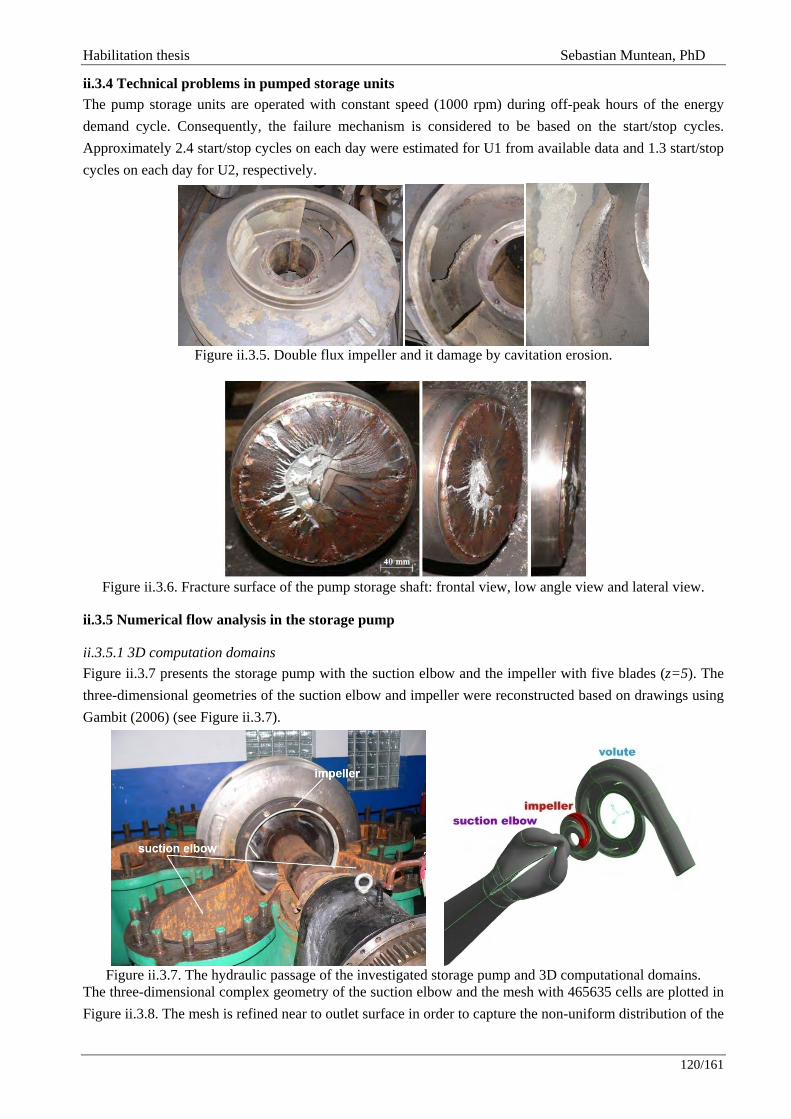
Habilitation thesis Sebastian Muntean, PhD
120/161
ii.3.4 Technical problems in pumped storage units The pump storage units are operated with constant speed (1000 rpm) during off-peak hours of the energy demand cycle. Consequently, the failure mechanism is considered to be based on the start/stop cycles. Approximately 2.4 start/stop cycles on each day were estimated for U1 from available data and 1.3 start/stop cycles on each day for U2, respectively.
Figure ii.3.5. Double flux impeller and it damage by cavitation erosion.
Figure ii.3.6. Fracture surface of the pump storage shaft: frontal view, low angle view and lateral view.
ii.3.5 Numerical flow analysis in the storage pump
ii.3.5.1 3D computation domains Figure ii.3.7 presents the storage pump with the suction elbow and the impeller with five blades (z=5). The three-dimensional geometries of the suction elbow and impeller were reconstructed based on drawings using Gambit (2006) (see Figure ii.3.7).
Figure ii.3.7. The hydraulic passage of the investigated storage pump and 3D computational domains.
The three-dimensional complex geometry of the suction elbow and the mesh with 465635 cells are plotted in Figure ii.3.8. The mesh is refined near to outlet surface in order to capture the non-uniform distribution of the

Habilitation thesis Sebastian Muntean, PhD
121/161
flow. In this case, one interblade channel of the impeller is considered as computational domain. The 3D computational domain and mesh with 590268 cells for the interblade channel are plotted in Figure ii.3.9.
Figure ii.3.8. The suction elbow domain: 3D computational domain and the mesh.
Figure ii.3.9 The interblade impeller channel: 3D computational domain and the mesh.
ii.3.5.2 Mixing interface method The technological development in PC hardware and CFD technologies made possible the 3D analysis of the flow in turbomachines, Keck and Sick (2008). A simplified numerical simulation method has been achieved, called mixing interface in order to couple the steady absolute flow from suction elbow with the steady relative flow from pump impeller, Figure ii.3.10.
Figure ii.3.10 Mixing interface algorithm for this particular case.
The 3D computational domains correspond to suction elbow and inteblade channel of the pump. In order to couple the steady absolute suction elbow flow field with the impeller steady relative flow, a mixing

Habilitation thesis Sebastian Muntean, PhD
122/161
technique is developed and employed on suction elbow-impeller interface. This mixing algorithm removes the circumferential variation of velocity components, pressure and turbulence quantities using a piecewise polynomial least squares algorithm, Muntean et al. (2004). For this particular case the mixing interface algorithm is presented in Figure ii.3.10. The 3D turbulent flow is computed using FLUENT (2006).
Velocity field is prescribed on the inflow section for both suction-elbow and impeller domains. The uniform velocity prescribed on the suction-elbow inlet section is computed to satisfy the flow rate according to the operating point. The mixed velocity profile on the suction elbow outlet section is imposed on the impeller inlet section, due to mixing algorithm. Turbulence quantities (turbulence intensity and turbulence length scale) are prescribed on the inflow section for both suction elbow and impeller domains. The turbulence intensity of 3% and turbulence length scale of 0.1 is imposed on the suction elbow inlet section. Pressure distribution is imposed on outlet section of suction elbow. A constant pressure is considered on the outlet section of suction elbow like first guess in order to initialize the iterative process. Constant pressure is imposed on the outlet surface of the impeller. Periodic conditions regarding the pressure, velocity and turbulence parameters are imposed on the periodic boundaries of the impeller. Wall condition is imposed for suction-elbow walls, as well for the impeller hub, shroud and blade. Water liquid is selected as a working material.
ii.3.5.3 Numerical results Numerical analysis was performed for three operating points (0.8Qn, Qn and 1.35Qn) with parameters presented in Table ii.3.2.
Table ii.3.2 Parameters of the storage pump operating points Operating point Flow rate (m3/s) Pumping head (m) Speed (rpm)
0.8Qn 1.71 274 1000 Qn 2.14 247
1.35Qn 2.89 209 In order to evaluate the non-uniformity flow generated by the suction elbow, the velocity coefficients eq. (ii.3.1), are plotted on the annular section located upstream to the impeller.
2x
xv
cgH
= , 2
rr
vcgH
= , 2
uu
vc
gH= (ii.3.1)
In order to evaluate the velocity and pressure coefficients non-uniformities are figured out for three circles (near to hub labeled r=15%, in the middle r=50%, and near to shroud, r=85%) located on the suction-elbow annular outlet surface. The distribution of the axial velocity coefficient for the investigated operating points is shown in Figure ii.3.11. One can observe that the maximum value of the axial velocity coefficient is at r=85% at 1.35Qn while in r=15% near to hub, the axial velocity reaches the smallest values (see Figure ii.3.12). At 0.8Qn the distribution of axial velocity is quite uniform, however for Qn and 1.35Qn one observe that the axial velocity is divided in two regions between section r=15% and r=50% with smaller values and between r=50% and r=85% with higher values than the average one. The maximum non-uniformity of axial velocity has an average deviation ±5% near to hub for all investigated points.
Distributions of radial velocity coefficient on outlet section of the suction elbow are presented in Figure ii.3.13. In all operating points the radial velocity distribution is alike. One can see two regions with large radial velocity behind the shaft (red spots in Figure ii.3.13). The maximum non-uniformity of radial velocity is reached at 1.35Qn on r=15% near to hub (see Figure ii.3.14).
In Figure ii.3.15 is plotted the distribution of tangential velocity coefficient for all investigated points. It can be seen two regions where the extreme values of the tangential velocity are reached (orange spot near to

Habilitation thesis Sebastian Muntean, PhD
123/161
hub at 270° and blue spot near to hub at 90°). In this two regions two contra-rotating flows are generates by the complex shape of the suction elbow. The maximum values are found at the highest value of flow rate, 1.35Qn, near to hub at r=15% (see Figure ii.3.15). The non-uniformity of the tangential velocity is low near to shroud.
Figure ii.3.11 Distribution of axial velocity coefficient on the outlet section of the elbow-shaped inlet pipe:
0.8Qn (left), Qn (middle), 1.35Qn (right).
Figure ii.3.12 Distribution of axial velocity coefficient on the outlet section of the elbow-shaped inlet pipe: 0.8Qn (left), Qn (middle), 1.35Qn (right).
Figure ii.3.13 Distribution of radial velocity coefficient on the outlet section of the elbow-shaped inlet pipe:
0.8Qn (left), Qn (middle), 1.35Qn (right)
Figure ii.3.14 Distribution of radial velocity coefficient on the outlet section of the elbow-shaped inlet pipe:
0.8Qn (left), Qn (middle), 1.35Qn (right)
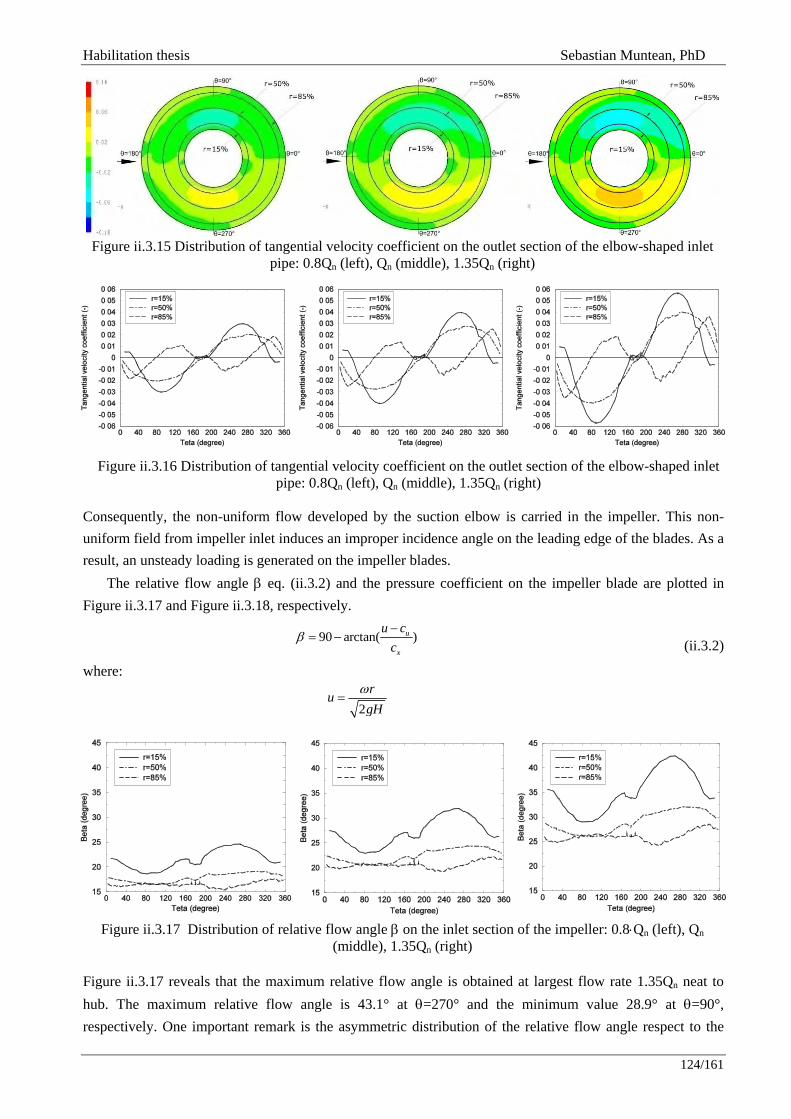
Habilitation thesis Sebastian Muntean, PhD
124/161
Figure ii.3.15 Distribution of tangential velocity coefficient on the outlet section of the elbow-shaped inlet
pipe: 0.8Qn (left), Qn (middle), 1.35Qn (right)
Figure ii.3.16 Distribution of tangential velocity coefficient on the outlet section of the elbow-shaped inlet
pipe: 0.8Qn (left), Qn (middle), 1.35Qn (right) Consequently, the non-uniform flow developed by the suction elbow is carried in the impeller. This non-uniform field from impeller inlet induces an improper incidence angle on the leading edge of the blades. As a result, an unsteady loading is generated on the impeller blades.
The relative flow angle β eq. (ii.3.2) and the pressure coefficient on the impeller blade are plotted in Figure ii.3.17 and Figure ii.3.18, respectively.
90 arctan( )u
x
u cc
β−
= − (ii.3.2)
where:
2rugHω
=
Figure ii.3.17 Distribution of relative flow angle β on the inlet section of the impeller: 0.8⋅Qn (left), Qn
(middle), 1.35Qn (right) Figure ii.3.17 reveals that the maximum relative flow angle is obtained at largest flow rate 1.35Qn neat to hub. The maximum relative flow angle is 43.1° at θ=270° and the minimum value 28.9° at θ=90°, respectively. One important remark is the asymmetric distribution of the relative flow angle respect to the
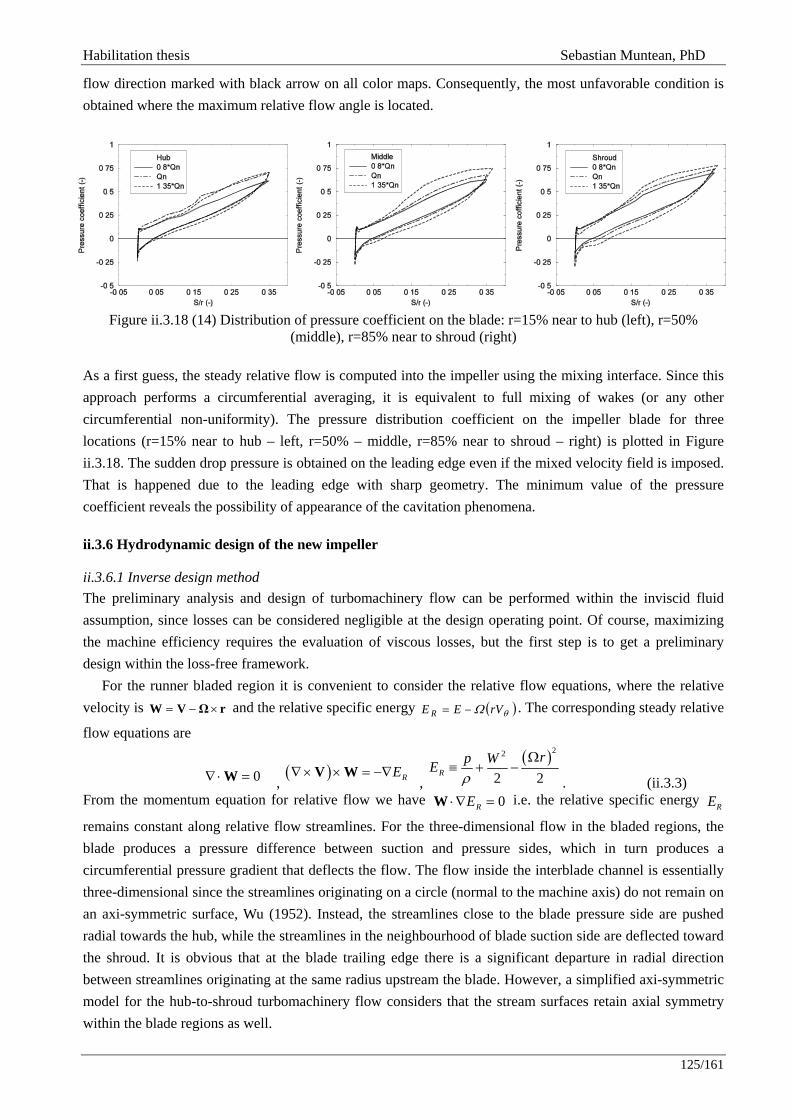
Habilitation thesis Sebastian Muntean, PhD
125/161
flow direction marked with black arrow on all color maps. Consequently, the most unfavorable condition is obtained where the maximum relative flow angle is located.
Figure ii.3.18 (14) Distribution of pressure coefficient on the blade: r=15% near to hub (left), r=50%
(middle), r=85% near to shroud (right) As a first guess, the steady relative flow is computed into the impeller using the mixing interface. Since this approach performs a circumferential averaging, it is equivalent to full mixing of wakes (or any other circumferential non-uniformity). The pressure distribution coefficient on the impeller blade for three locations (r=15% near to hub – left, r=50% – middle, r=85% near to shroud – right) is plotted in Figure ii.3.18. The sudden drop pressure is obtained on the leading edge even if the mixed velocity field is imposed. That is happened due to the leading edge with sharp geometry. The minimum value of the pressure coefficient reveals the possibility of appearance of the cavitation phenomena.
ii.3.6 Hydrodynamic design of the new impeller
ii.3.6.1 Inverse design method The preliminary analysis and design of turbomachinery flow can be performed within the inviscid fluid assumption, since losses can be considered negligible at the design operating point. Of course, maximizing the machine efficiency requires the evaluation of viscous losses, but the first step is to get a preliminary design within the loss-free framework.
For the runner bladed region it is convenient to consider the relative flow equations, where the relative velocity is = − ×W V Ω r and the relative specific energy ( )θΩ rVEE R −= . The corresponding steady relative
flow equations are
0∇⋅ =W , ( ) RE∇× × = −∇V W
,
( )22
2 2R
rp WEρ
Ω≡ + −
. (ii.3.3) From the momentum equation for relative flow we have 0RE⋅∇ =W i.e. the relative specific energy RE remains constant along relative flow streamlines. For the three-dimensional flow in the bladed regions, the blade produces a pressure difference between suction and pressure sides, which in turn produces a circumferential pressure gradient that deflects the flow. The flow inside the interblade channel is essentially three-dimensional since the streamlines originating on a circle (normal to the machine axis) do not remain on
an axi-symmetric surface, Wu (1952). Instead, the streamlines close to the blade pressure side are pushed radial towards the hub, while the streamlines in the neighbourhood of blade suction side are deflected toward the shroud. It is obvious that at the blade trailing edge there is a significant departure in radial direction between streamlines originating at the same radius upstream the blade. However, a simplified axi-symmetric model for the hub-to-shroud turbomachinery flow considers that the stream surfaces retain axial symmetry within the blade regions as well.
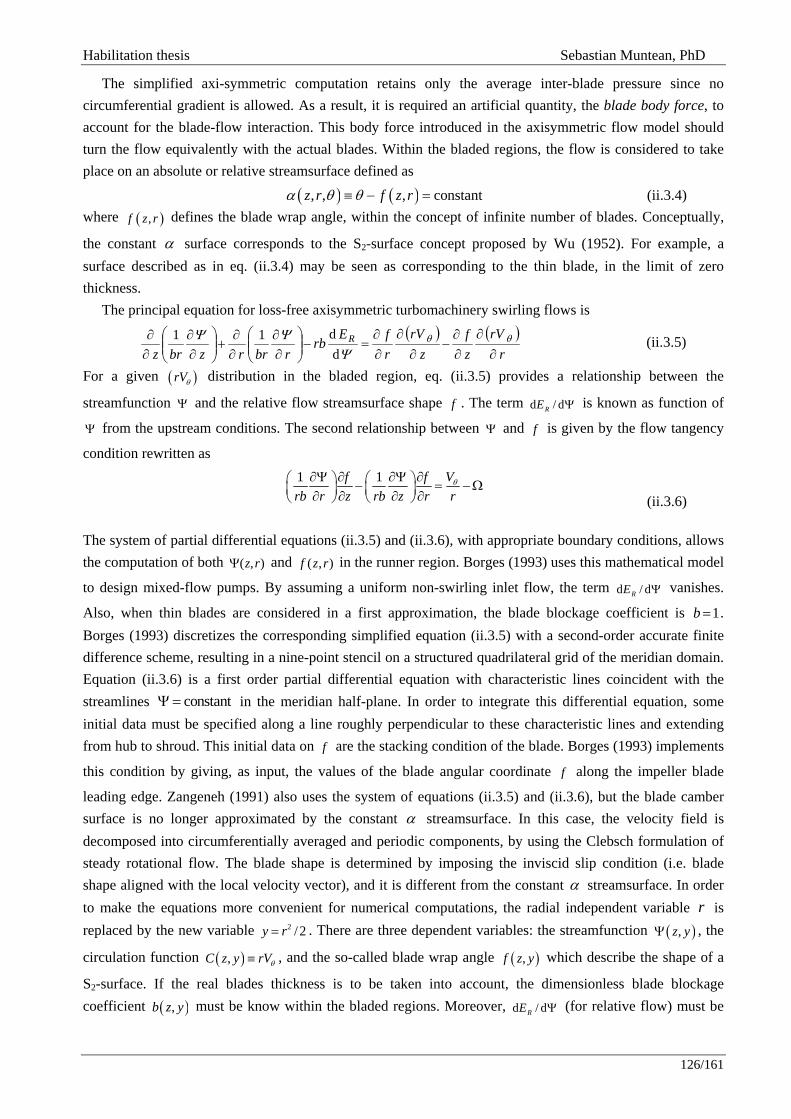
Habilitation thesis Sebastian Muntean, PhD
126/161
The simplified axi-symmetric computation retains only the average inter-blade pressure since no circumferential gradient is allowed. As a result, it is required an artificial quantity, the blade body force, to account for the blade-flow interaction. This body force introduced in the axisymmetric flow model should turn the flow equivalently with the actual blades. Within the bladed regions, the flow is considered to take place on an absolute or relative streamsurface defined as
( ) ( ), , , constantz r f z rα θ θ≡ − = (ii.3.4) where ( ),f z r defines the blade wrap angle, within the concept of infinite number of blades. Conceptually,
the constant α surface corresponds to the S2-surface concept proposed by Wu (1952). For example, a surface described as in eq. (ii.3.4) may be seen as corresponding to the thin blade, in the limit of zero thickness.
The principal equation for loss-free axisymmetric turbomachinery swirling flows is ( ) ( )
rrV
zf
zrV
rfE
rbrbrrzbrz
R
∂∂
∂∂
−∂
∂∂∂
=−⎟⎟⎠
⎞⎜⎜⎝
⎛∂∂
∂∂
+⎟⎟⎠
⎞⎜⎜⎝
⎛∂∂
∂∂ θθ
ΨΨΨ
dd11 (ii.3.5)
For a given ( )rVθ distribution in the bladed region, eq. (ii.3.5) provides a relationship between the
streamfunction Ψ and the relative flow streamsurface shape f . The term d / dRE Ψ is known as function of
Ψ from the upstream conditions. The second relationship between Ψ and f is given by the flow tangency
condition rewritten as
1 1f f Vrb r z rb z r r
θ∂Ψ ∂ ∂Ψ ∂⎛ ⎞ ⎛ ⎞− = −Ω⎜ ⎟ ⎜ ⎟∂ ∂ ∂ ∂⎝ ⎠ ⎝ ⎠ (ii.3.6) The system of partial differential equations (ii.3.5) and (ii.3.6), with appropriate boundary conditions, allows the computation of both ( , )z rΨ and ( , )f z r in the runner region. Borges (1993) uses this mathematical model
to design mixed-flow pumps. By assuming a uniform non-swirling inlet flow, the term d / dRE Ψ vanishes.
Also, when thin blades are considered in a first approximation, the blade blockage coefficient is 1b = . Borges (1993) discretizes the corresponding simplified equation (ii.3.5) with a second-order accurate finite difference scheme, resulting in a nine-point stencil on a structured quadrilateral grid of the meridian domain. Equation (ii.3.6) is a first order partial differential equation with characteristic lines coincident with the streamlines constantΨ= in the meridian half-plane. In order to integrate this differential equation, some initial data must be specified along a line roughly perpendicular to these characteristic lines and extending from hub to shroud. This initial data on f are the stacking condition of the blade. Borges (1993) implements
this condition by giving, as input, the values of the blade angular coordinate f along the impeller blade
leading edge. Zangeneh (1991) also uses the system of equations (ii.3.5) and (ii.3.6), but the blade camber surface is no longer approximated by the constant α streamsurface. In this case, the velocity field is decomposed into circumferentially averaged and periodic components, by using the Clebsch formulation of steady rotational flow. The blade shape is determined by imposing the inviscid slip condition (i.e. blade shape aligned with the local velocity vector), and it is different from the constant α streamsurface. In order to make the equations more convenient for numerical computations, the radial independent variable r is replaced by the new variable 2 /2y r= . There are three dependent variables: the streamfunction ( ),z yΨ , the
circulation function ( ),C z y rVθ≡ , and the so-called blade wrap angle ( ),f z y which describe the shape of a
S2-surface. If the real blades thickness is to be taken into account, the dimensionless blade blockage coefficient ( ),b z y must be know within the bladed regions. Moreover, d / dRE Ψ (for relative flow) must be
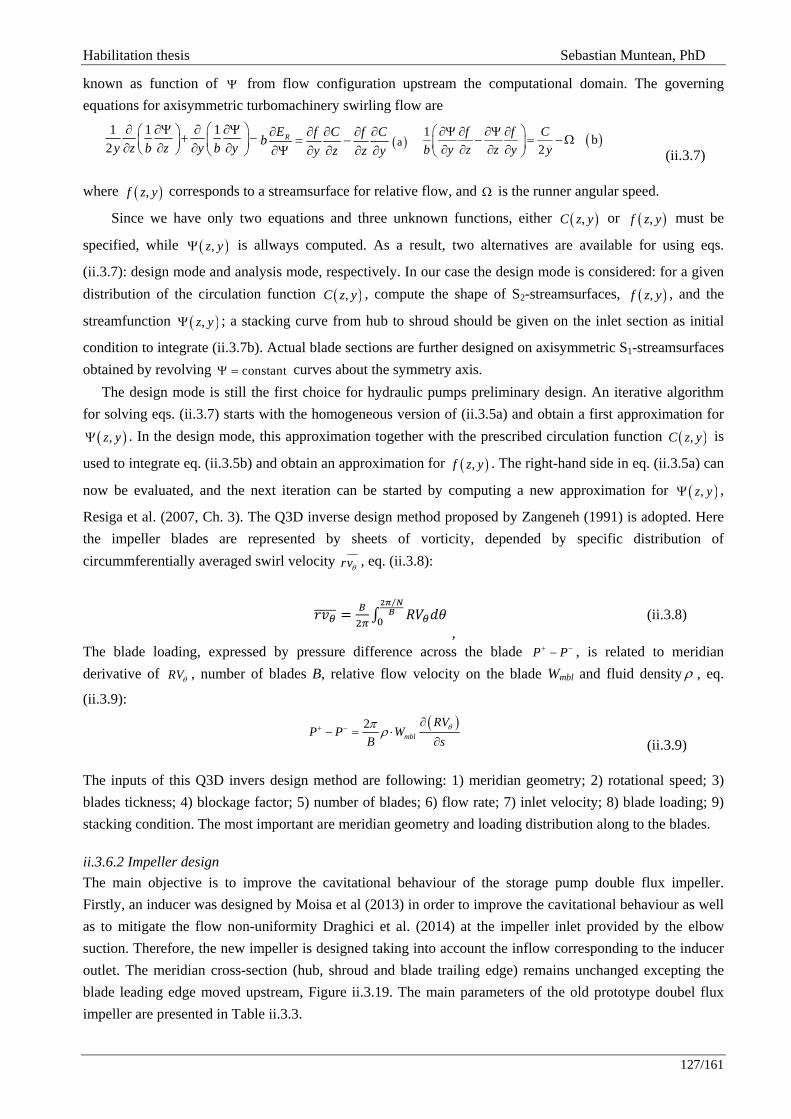
Habilitation thesis Sebastian Muntean, PhD
127/161
known as function of Ψ from flow configuration upstream the computational domain. The governing equations for axisymmetric turbomachinery swirling flow are
1 1 12y z b z y b y
⎛ ⎞∂ ∂Ψ ∂ ∂Ψ⎛ ⎞ + −⎜ ⎟ ⎜ ⎟∂ ∂ ∂ ∂⎝ ⎠ ⎝ ⎠RE f C f Cb
y z z y∂ ∂ ∂ ∂ ∂
− = −∂Ψ ∂ ∂ ∂ ∂
( )a
( )1 b2
f f Cb y z z y y⎛ ⎞∂Ψ ∂ ∂Ψ ∂
− = −Ω⎜ ⎟∂ ∂ ∂ ∂⎝ ⎠ (ii.3.7) where ( ),f z y corresponds to a streamsurface for relative flow, and Ω is the runner angular speed.
Since we have only two equations and three unknown functions, either ( ),C z y or ( ),f z y must be
specified, while ( ),z yΨ is allways computed. As a result, two alternatives are available for using eqs.
(ii.3.7): design mode and analysis mode, respectively. In our case the design mode is considered: for a given distribution of the circulation function ( ),C z y , compute the shape of S2-streamsurfaces, ( ),f z y , and the
streamfunction ( ),z yΨ ; a stacking curve from hub to shroud should be given on the inlet section as initial
condition to integrate (ii.3.7b). Actual blade sections are further designed on axisymmetric S1-streamsurfaces obtained by revolving constantΨ = curves about the symmetry axis.
The design mode is still the first choice for hydraulic pumps preliminary design. An iterative algorithm for solving eqs. (ii.3.7) starts with the homogeneous version of (ii.3.5a) and obtain a first approximation for
( ),z yΨ . In the design mode, this approximation together with the prescribed circulation function ( ),C z y is
used to integrate eq. (ii.3.5b) and obtain an approximation for ( ),f z y . The right-hand side in eq. (ii.3.5a) can
now be evaluated, and the next iteration can be started by computing a new approximation for ( ),z yΨ ,
Resiga et al. (2007, Ch. 3). The Q3D inverse design method proposed by Zangeneh (1991) is adopted. Here the impeller blades are represented by sheets of vorticity, depended by specific distribution of circummferentially averaged swirl velocity rvθ , eq. (ii.3.8):
⁄ , (ii.3.8)
The blade loading, expressed by pressure difference across the blade P P+ −− , is related to meridian derivative of RVθ , number of blades B, relative flow velocity on the blade Wmbl and fluid density ρ , eq.
(ii.3.9):
( )2
mbl
RVP P W
B sθπ ρ+ − ∂
− = ⋅∂ (ii.3.9)
The inputs of this Q3D invers design method are following: 1) meridian geometry; 2) rotational speed; 3) blades tickness; 4) blockage factor; 5) number of blades; 6) flow rate; 7) inlet velocity; 8) blade loading; 9) stacking condition. The most important are meridian geometry and loading distribution along to the blades.
ii.3.6.2 Impeller design The main objective is to improve the cavitational behaviour of the storage pump double flux impeller. Firstly, an inducer was designed by Moisa et al (2013) in order to improve the cavitational behaviour as well as to mitigate the flow non-uniformity Draghici et al. (2014) at the impeller inlet provided by the elbow suction. Therefore, the new impeller is designed taking into account the inflow corresponding to the inducer outlet. The meridian cross-section (hub, shroud and blade trailing edge) remains unchanged excepting the blade leading edge moved upstream, Figure ii.3.19. The main parameters of the old prototype doubel flux impeller are presented in Table ii.3.3.
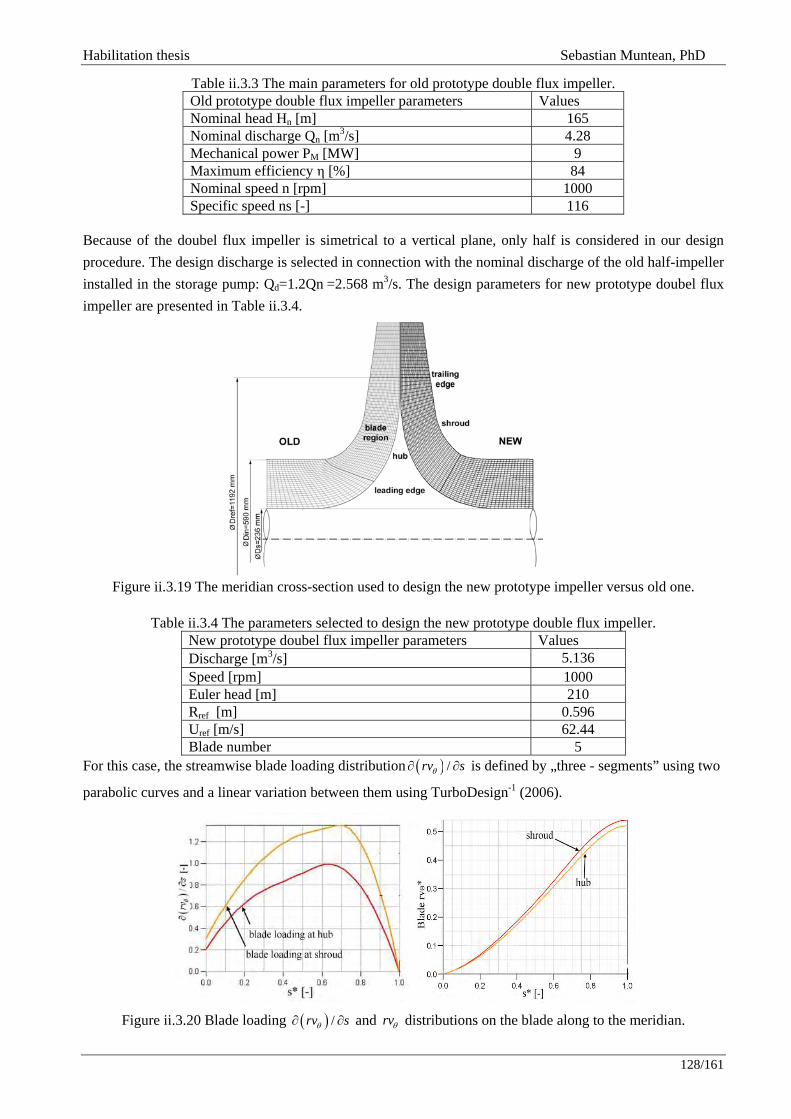
Habilitation thesis Sebastian Muntean, PhD
128/161
Table ii.3.3 The main parameters for old prototype double flux impeller. Old prototype double flux impeller parameters Values Nominal head Hn [m] 165 Nominal discharge Qn [m3/s] 4.28 Mechanical power PM [MW] 9 Maximum efficiency η [%] 84 Nominal speed n [rpm] 1000 Specific speed ns [-] 116
Because of the doubel flux impeller is simetrical to a vertical plane, only half is considered in our design procedure. The design discharge is selected in connection with the nominal discharge of the old half-impeller installed in the storage pump: Qd=1.2Qn =2.568 m3/s. The design parameters for new prototype doubel flux impeller are presented in Table ii.3.4.
Figure ii.3.19 The meridian cross-section used to design the new prototype impeller versus old one.
Table ii.3.4 The parameters selected to design the new prototype double flux impeller. New prototype doubel flux impeller parameters Values
Discharge [m3/s] 5.136 Speed [rpm] 1000 Euler head [m] 210 Rref [m] 0.596 Uref [m/s] 62.44 Blade number 5
For this case, the streamwise blade loading distribution ( ) /rv sθ∂ ∂ is defined by „three - segments” using two
parabolic curves and a linear variation between them using TurboDesign-1 (2006).
Figure ii.3.20 Blade loading ( ) /rv sθ∂ ∂ and rvθ distributions on the blade along to the meridian.
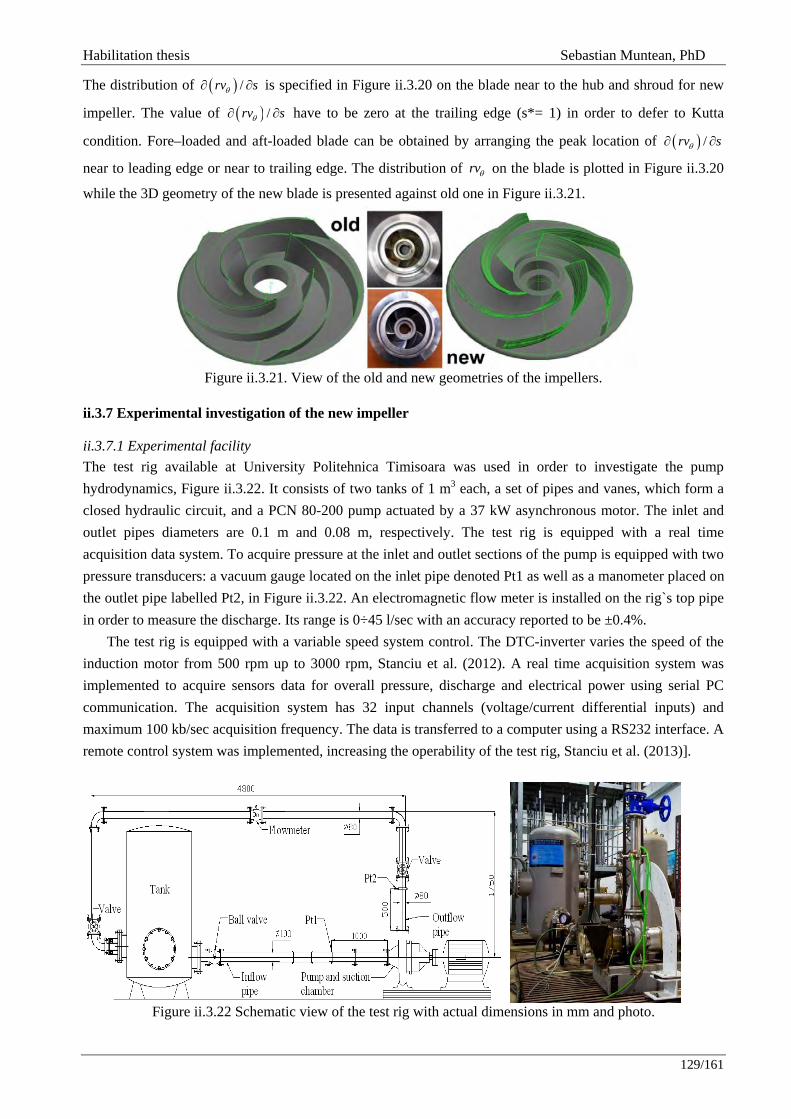
Habilitation thesis Sebastian Muntean, PhD
129/161
The distribution of ( ) /rv sθ∂ ∂ is specified in Figure ii.3.20 on the blade near to the hub and shroud for new
impeller. The value of ( ) /rv sθ∂ ∂ have to be zero at the trailing edge (s*= 1) in order to defer to Kutta
condition. Fore–loaded and aft-loaded blade can be obtained by arranging the peak location of ( ) /rv sθ∂ ∂ near to leading edge or near to trailing edge. The distribution of rvθ on the blade is plotted in Figure ii.3.20
while the 3D geometry of the new blade is presented against old one in Figure ii.3.21.
Figure ii.3.21. View of the old and new geometries of the impellers.
ii.3.7 Experimental investigation of the new impeller
ii.3.7.1 Experimental facility The test rig available at University Politehnica Timisoara was used in order to investigate the pump hydrodynamics, Figure ii.3.22. It consists of two tanks of 1 m3 each, a set of pipes and vanes, which form a closed hydraulic circuit, and a PCN 80-200 pump actuated by a 37 kW asynchronous motor. The inlet and outlet pipes diameters are 0.1 m and 0.08 m, respectively. The test rig is equipped with a real time acquisition data system. To acquire pressure at the inlet and outlet sections of the pump is equipped with two pressure transducers: a vacuum gauge located on the inlet pipe denoted Pt1 as well as a manometer placed on the outlet pipe labelled Pt2, in Figure ii.3.22. An electromagnetic flow meter is installed on the rig`s top pipe in order to measure the discharge. Its range is 0÷45 l/sec with an accuracy reported to be ±0.4%.
The test rig is equipped with a variable speed system control. The DTC-inverter varies the speed of the induction motor from 500 rpm up to 3000 rpm, Stanciu et al. (2012). A real time acquisition system was implemented to acquire sensors data for overall pressure, discharge and electrical power using serial PC communication. The acquisition system has 32 input channels (voltage/current differential inputs) and maximum 100 kb/sec acquisition frequency. The data is transferred to a computer using a RS232 interface. A remote control system was implemented, increasing the operability of the test rig, Stanciu et al. (2013)].
Figure ii.3.22 Schematic view of the test rig with actual dimensions in mm and photo.
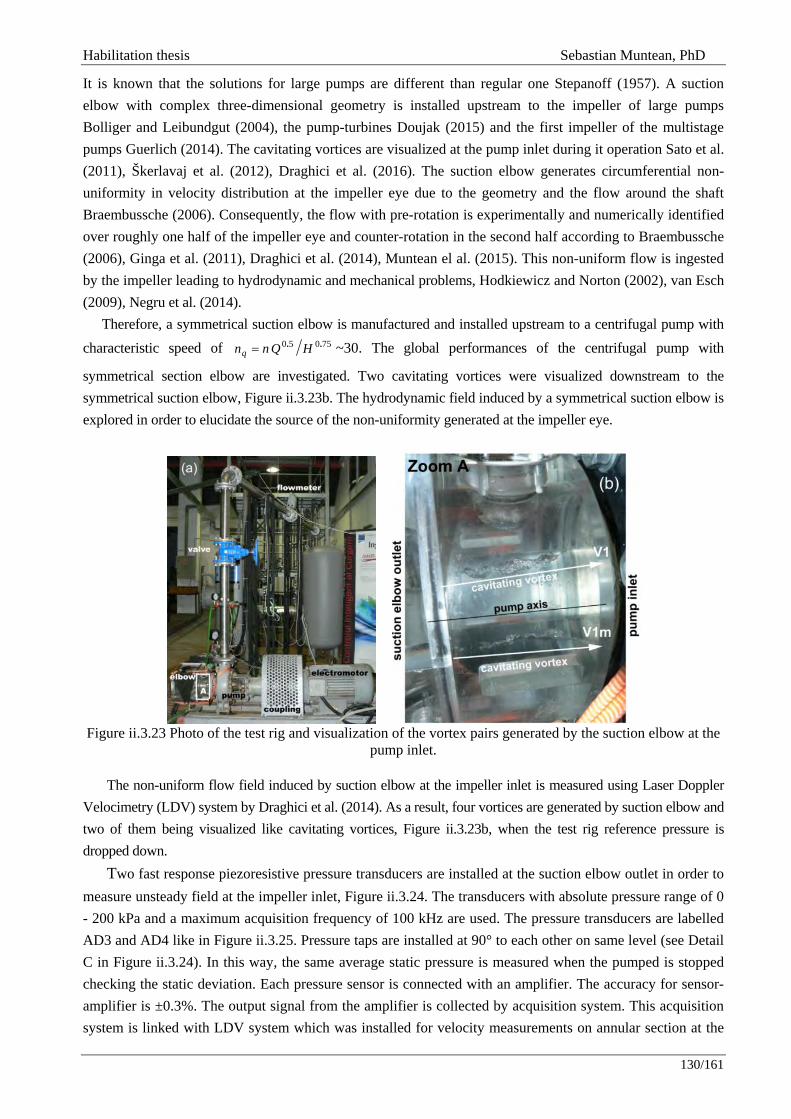
Habilitation thesis Sebastian Muntean, PhD
130/161
It is known that the solutions for large pumps are different than regular one Stepanoff (1957). A suction elbow with complex three-dimensional geometry is installed upstream to the impeller of large pumps Bolliger and Leibundgut (2004), the pump-turbines Doujak (2015) and the first impeller of the multistage pumps Guerlich (2014). The cavitating vortices are visualized at the pump inlet during it operation Sato et al. (2011), Škerlavaj et al. (2012), Draghici et al. (2016). The suction elbow generates circumferential non-uniformity in velocity distribution at the impeller eye due to the geometry and the flow around the shaft Braembussche (2006). Consequently, the flow with pre-rotation is experimentally and numerically identified over roughly one half of the impeller eye and counter-rotation in the second half according to Braembussche (2006), Ginga et al. (2011), Draghici et al. (2014), Muntean el al. (2015). This non-uniform flow is ingested by the impeller leading to hydrodynamic and mechanical problems, Hodkiewicz and Norton (2002), van Esch (2009), Negru et al. (2014).
Therefore, a symmetrical suction elbow is manufactured and installed upstream to a centrifugal pump with characteristic speed of 75050 .. HQnnq = ~30. The global performances of the centrifugal pump with
symmetrical section elbow are investigated. Two cavitating vortices were visualized downstream to the symmetrical suction elbow, Figure ii.3.23b. The hydrodynamic field induced by a symmetrical suction elbow is explored in order to elucidate the source of the non-uniformity generated at the impeller eye.
Figure ii.3.23 Photo of the test rig and visualization of the vortex pairs generated by the suction elbow at the
pump inlet.
The non-uniform flow field induced by suction elbow at the impeller inlet is measured using Laser Doppler Velocimetry (LDV) system by Draghici et al. (2014). As a result, four vortices are generated by suction elbow and two of them being visualized like cavitating vortices, Figure ii.3.23b, when the test rig reference pressure is dropped down.
Two fast response piezoresistive pressure transducers are installed at the suction elbow outlet in order to measure unsteady field at the impeller inlet, Figure ii.3.24. The transducers with absolute pressure range of 0 - 200 kPa and a maximum acquisition frequency of 100 kHz are used. The pressure transducers are labelled AD3 and AD4 like in Figure ii.3.25. Pressure taps are installed at 90° to each other on same level (see Detail C in Figure ii.3.24). In this way, the same average static pressure is measured when the pumped is stopped checking the static deviation. Each pressure sensor is connected with an amplifier. The accuracy for sensor-amplifier is ±0.3%. The output signal from the amplifier is collected by acquisition system. This acquisition system is linked with LDV system which was installed for velocity measurements on annular section at the
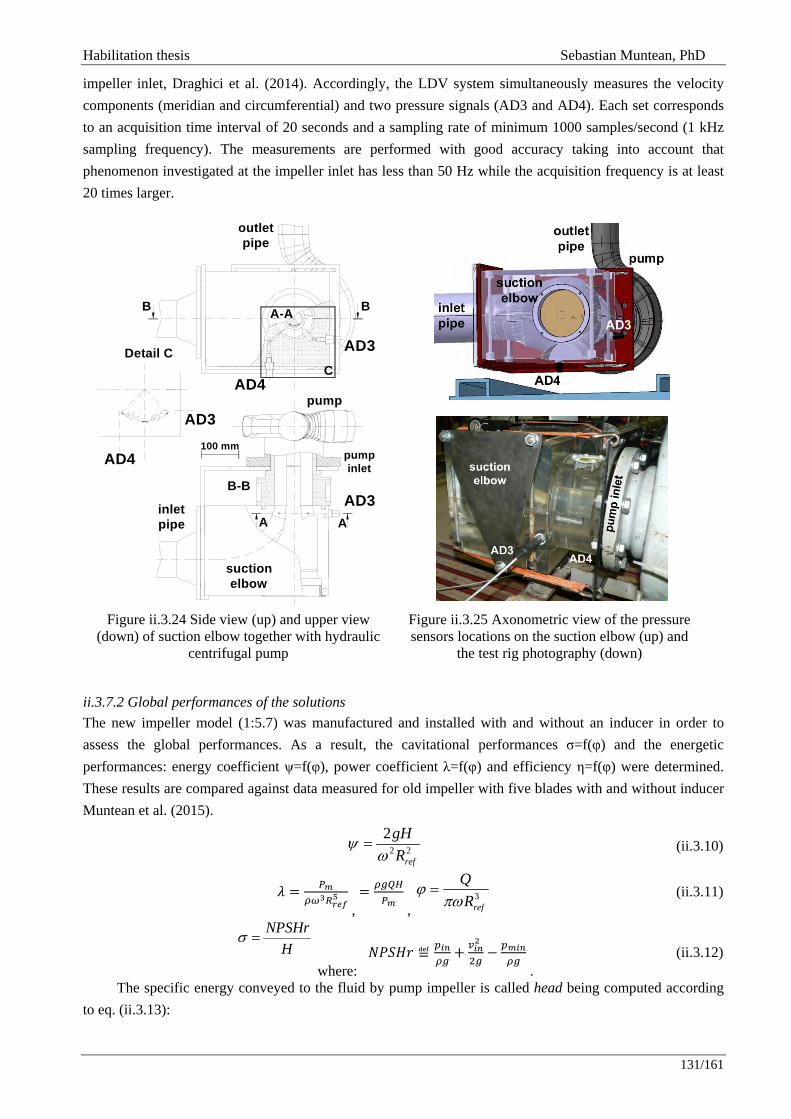
Habilitation thesis Sebastian Muntean, PhD
131/161
impeller inlet, Draghici et al. (2014). Accordingly, the LDV system simultaneously measures the velocity components (meridian and circumferential) and two pressure signals (AD3 and AD4). Each set corresponds to an acquisition time interval of 20 seconds and a sampling rate of minimum 1000 samples/second (1 kHz sampling frequency). The measurements are performed with good accuracy taking into account that phenomenon investigated at the impeller inlet has less than 50 Hz while the acquisition frequency is at least 20 times larger.
AD3
AD4
A A
BB
AD3B-B
A-A
suctionelbow
pump
inletpipe
outletpipe
100 mmpumpinlet
AD3
AD4
Detail CC
Figure ii.3.24 Side view (up) and upper view (down) of suction elbow together with hydraulic
centrifugal pump
Figure ii.3.25 Axonometric view of the pressure sensors locations on the suction elbow (up) and
the test rig photography (down)
ii.3.7.2 Global performances of the solutions The new impeller model (1:5.7) was manufactured and installed with and without an inducer in order to assess the global performances. As a result, the cavitational performances σ=f(φ) and the energetic performances: energy coefficient ψ=f(φ), power coefficient λ=f(φ) and efficiency η=f(φ) were determined. These results are compared against data measured for old impeller with five blades with and without inducer Muntean et al. (2015).
2 22
ref
gHR
ψω
=
(ii.3.10)
,
, 3
ref
QR
ϕπω
= (ii.3.11)
NPSHrH
σ = where:
.
(ii.3.12)
The specific energy conveyed to the fluid by pump impeller is called head being computed according to eq. (ii.3.13):
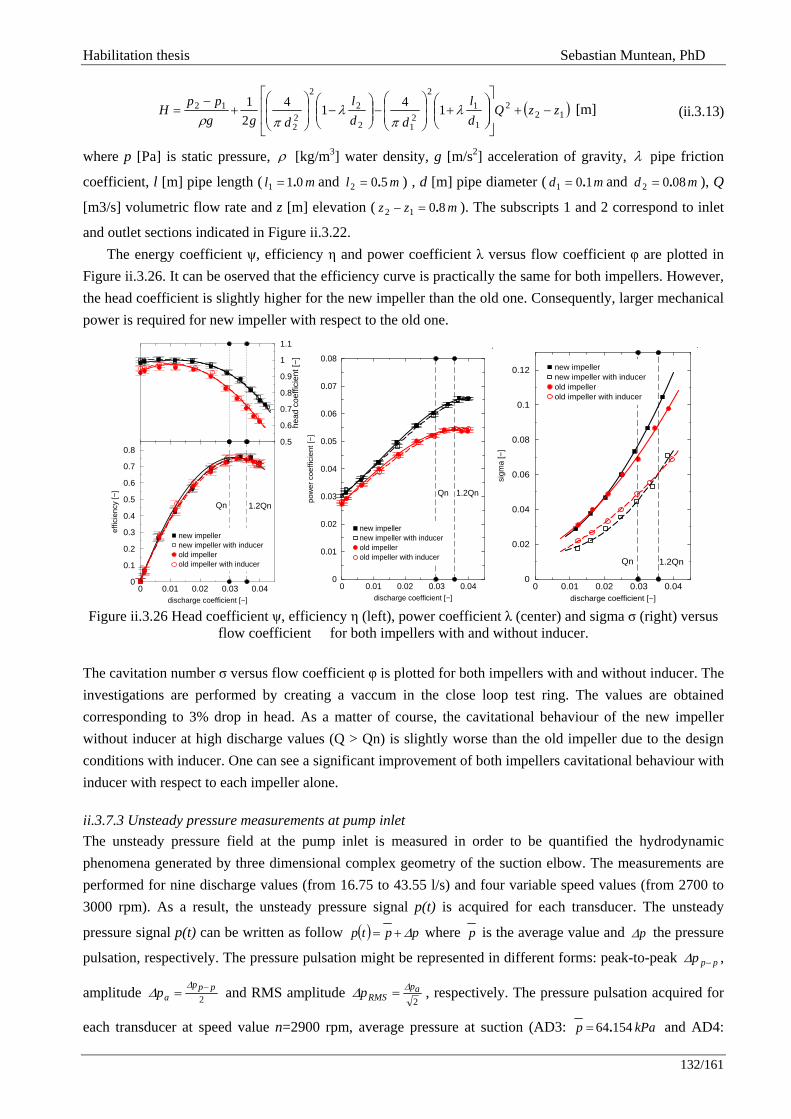
Habilitation thesis Sebastian Muntean, PhD
132/161
( )122
1
12
212
22
22
12 141421 zzQ
dl
ddl
dggpp
H −+⎥⎥
⎦
⎤
⎢⎢
⎣
⎡
⎟⎟⎠
⎞⎜⎜⎝
⎛+⎟
⎟⎠
⎞⎜⎜⎝
⎛−⎟⎟
⎠
⎞⎜⎜⎝
⎛−⎟
⎟⎠
⎞⎜⎜⎝
⎛+
−= λ
πλ
πρ [m] (ii.3.13)
where p [Pa] is static pressure, ρ [kg/m3] water density, g [m/s2] acceleration of gravity, λ pipe friction
coefficient, l [m] pipe length ( ml 011 .= and ml 502 .= ) , d [m] pipe diameter ( md 101 .= and md 0802 .= ), Q
[m3/s] volumetric flow rate and z [m] elevation ( mzz 8012 .=− ). The subscripts 1 and 2 correspond to inlet
and outlet sections indicated in Figure ii.3.22. The energy coefficient ψ, efficiency η and power coefficient λ versus flow coefficient φ are plotted in
Figure ii.3.26. It can be oserved that the efficiency curve is practically the same for both impellers. However, the head coefficient is slightly higher for the new impeller than the old one. Consequently, larger mechanical power is required for new impeller with respect to the old one.
Figure ii.3.26 Head coefficient ψ, efficiency η (left), power coefficient λ (center) and sigma σ (right) versus
flow coefficient for both impellers with and without inducer.
The cavitation number σ versus flow coefficient φ is plotted for both impellers with and without inducer. The investigations are performed by creating a vaccum in the close loop test ring. The values are obtained corresponding to 3% drop in head. As a matter of course, the cavitational behaviour of the new impeller without inducer at high discharge values (Q > Qn) is slightly worse than the old impeller due to the design conditions with inducer. One can see a significant improvement of both impellers cavitational behaviour with inducer with respect to each impeller alone.
ii.3.7.3 Unsteady pressure measurements at pump inlet The unsteady pressure field at the pump inlet is measured in order to be quantified the hydrodynamic phenomena generated by three dimensional complex geometry of the suction elbow. The measurements are performed for nine discharge values (from 16.75 to 43.55 l/s) and four variable speed values (from 2700 to 3000 rpm). As a result, the unsteady pressure signal p(t) is acquired for each transducer. The unsteady
pressure signal p(t) can be written as follow ( ) pptp Δ+= where p is the average value and pΔ the pressure
pulsation, respectively. The pressure pulsation might be represented in different forms: peak-to-peak ppp −Δ ,
amplitude 2ppp
ap −=Δ
Δ and RMS amplitude 2ap
RMSp ΔΔ = , respectively. The pressure pulsation acquired for
each transducer at speed value n=2900 rpm, average pressure at suction (AD3: kPap 15464.= and AD4:
0 0.01 0.02 0.03 0.04discharge coefficient [−]
0
0.1
0.2
0.3
0.4
0.5
0.6
0.7
0.8
effic
ienc
y [−
]
new impellernew impeller with inducerold impellerold impeller with inducer
0.5
0.6
0.7
0.8
0.9
1
1.1
head
coe
ffici
ent [
−]
Qn 1.2Qn
0 0.01 0.02 0.03 0.04discharge coefficient [−]
0
0.01
0.02
0.03
0.04
0.05
0.06
0.07
0.08
pow
er c
oeffi
cien
t [−
]
new impellernew impeller with inducerold impellerold impeller with inducer
Qn 1.2Qn
.
0 0.01 0.02 0.03 0.04discharge coefficient [−]
0
0.02
0.04
0.06
0.08
0.1
0.12
sigm
a [−
]
new impellernew impeller with inducerold impellerold impeller with inducer
Qn 1.2Qn
.
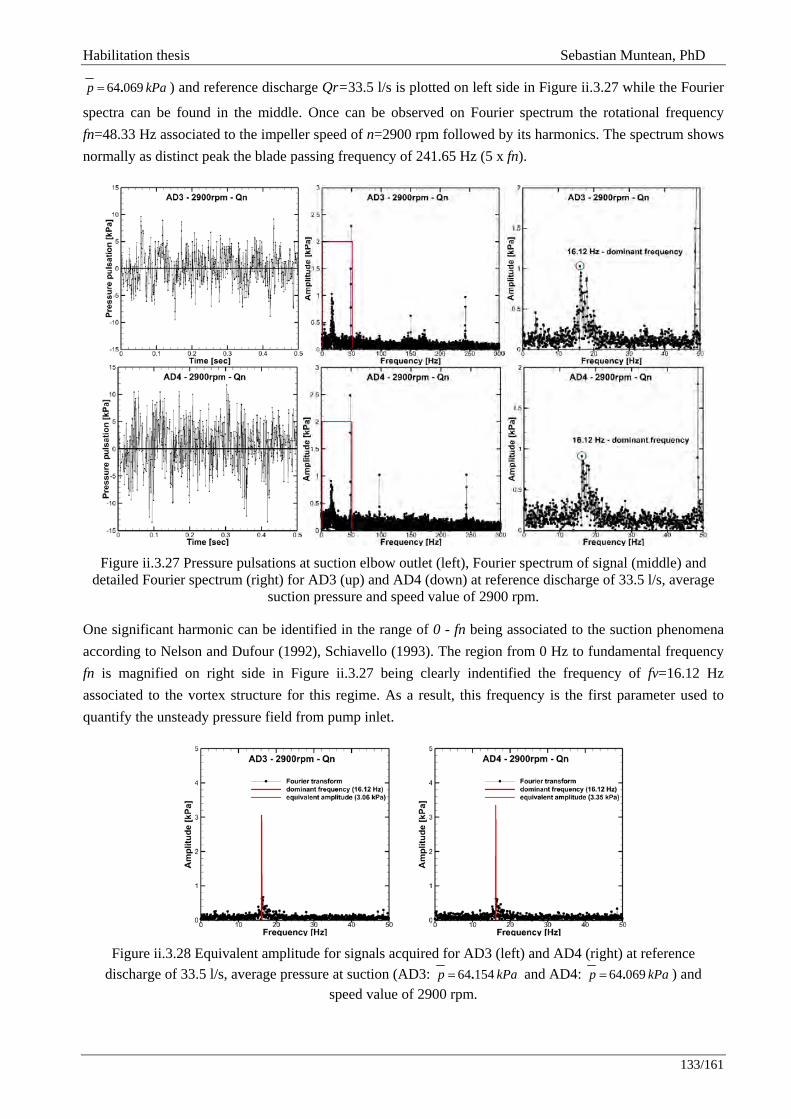
Habilitation thesis Sebastian Muntean, PhD
133/161
kPap 06964.= ) and reference discharge Qr=33.5 l/s is plotted on left side in Figure ii.3.27 while the Fourier
spectra can be found in the middle. Once can be observed on Fourier spectrum the rotational frequency fn=48.33 Hz associated to the impeller speed of n=2900 rpm followed by its harmonics. The spectrum shows normally as distinct peak the blade passing frequency of 241.65 Hz (5 x fn).
Figure ii.3.27 Pressure pulsations at suction elbow outlet (left), Fourier spectrum of signal (middle) and detailed Fourier spectrum (right) for AD3 (up) and AD4 (down) at reference discharge of 33.5 l/s, average
suction pressure and speed value of 2900 rpm.
One significant harmonic can be identified in the range of 0 - fn being associated to the suction phenomena according to Nelson and Dufour (1992), Schiavello (1993). The region from 0 Hz to fundamental frequency fn is magnified on right side in Figure ii.3.27 being clearly indentified the frequency of fv=16.12 Hz associated to the vortex structure for this regime. As a result, this frequency is the first parameter used to quantify the unsteady pressure field from pump inlet.
Figure ii.3.28 Equivalent amplitude for signals acquired for AD3 (left) and AD4 (right) at reference
discharge of 33.5 l/s, average pressure at suction (AD3: kPap 15464.= and AD4: kPap 06964.= ) and speed value of 2900 rpm.
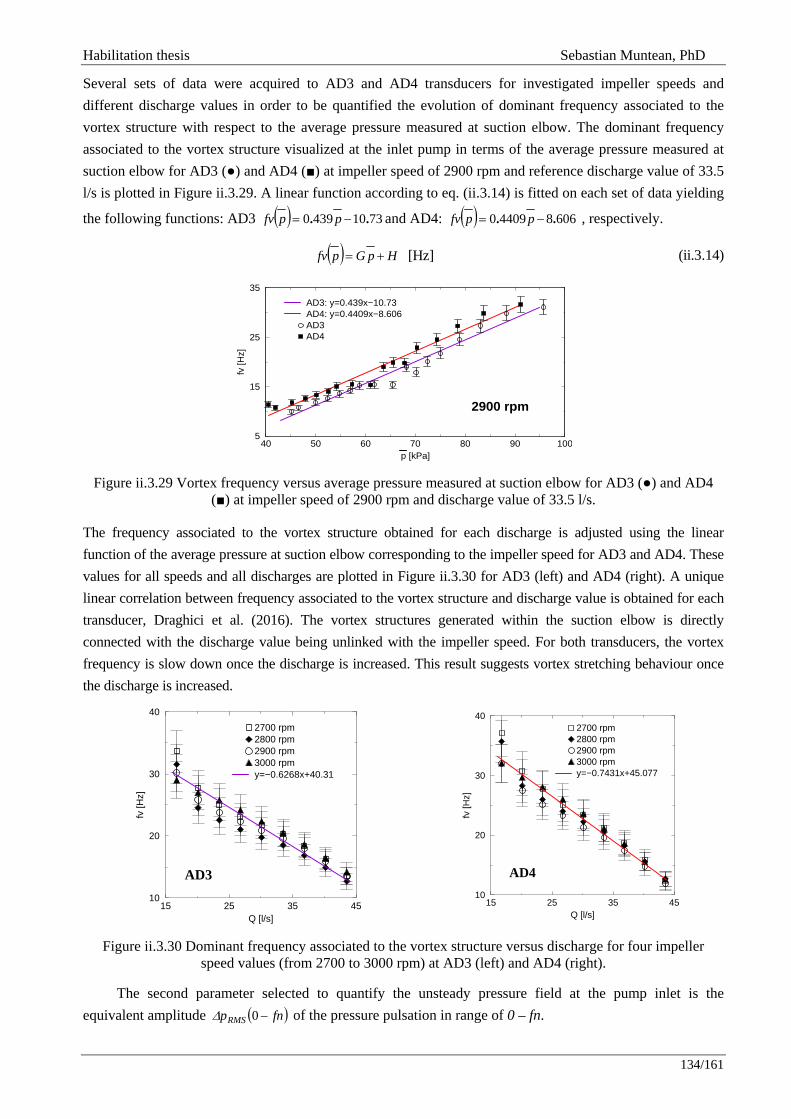
Habilitation thesis Sebastian Muntean, PhD
134/161
Several sets of data were acquired to AD3 and AD4 transducers for investigated impeller speeds and different discharge values in order to be quantified the evolution of dominant frequency associated to the vortex structure with respect to the average pressure measured at suction elbow. The dominant frequency associated to the vortex structure visualized at the inlet pump in terms of the average pressure measured at suction elbow for AD3 () and AD4 () at impeller speed of 2900 rpm and reference discharge value of 33.5 l/s is plotted in Figure ii.3.29. A linear function according to eq. (ii.3.14) is fitted on each set of data yielding
the following functions: AD3 ( ) 73104390 .. −= ppfv and AD4: ( ) 606844090 .. −= ppfv , respectively.
( ) HpGpfv += [Hz] (ii.3.14)
Figure ii.3.29 Vortex frequency versus average pressure measured at suction elbow for AD3 () and AD4
() at impeller speed of 2900 rpm and discharge value of 33.5 l/s.
The frequency associated to the vortex structure obtained for each discharge is adjusted using the linear function of the average pressure at suction elbow corresponding to the impeller speed for AD3 and AD4. These values for all speeds and all discharges are plotted in Figure ii.3.30 for AD3 (left) and AD4 (right). A unique linear correlation between frequency associated to the vortex structure and discharge value is obtained for each transducer, Draghici et al. (2016). The vortex structures generated within the suction elbow is directly connected with the discharge value being unlinked with the impeller speed. For both transducers, the vortex frequency is slow down once the discharge is increased. This result suggests vortex stretching behaviour once the discharge is increased.
Figure ii.3.30 Dominant frequency associated to the vortex structure versus discharge for four impeller speed values (from 2700 to 3000 rpm) at AD3 (left) and AD4 (right).
The second parameter selected to quantify the unsteady pressure field at the pump inlet is the equivalent amplitude ( )fnpRMS −0Δ of the pressure pulsation in range of 0 – fn.
40 50 60 70 80 90 100p [kPa]
5
15
25
35
fv [H
z]
AD3: y=0.439x−10.73AD4: y=0.4409x−8.606AD3AD4
2900 rpm
15 25 35 45Q [l/s]
10
20
30
40
fv [H
z]
2700 rpm2800 rpm2900 rpm3000 rpmy=−0.6268x+40.31
AD3
15 25 35 45Q [l/s]
10
20
30
40
fv [H
z]
2700 rpm2800 rpm2900 rpm3000 rpmy=−0.7431x+45.077
AD4
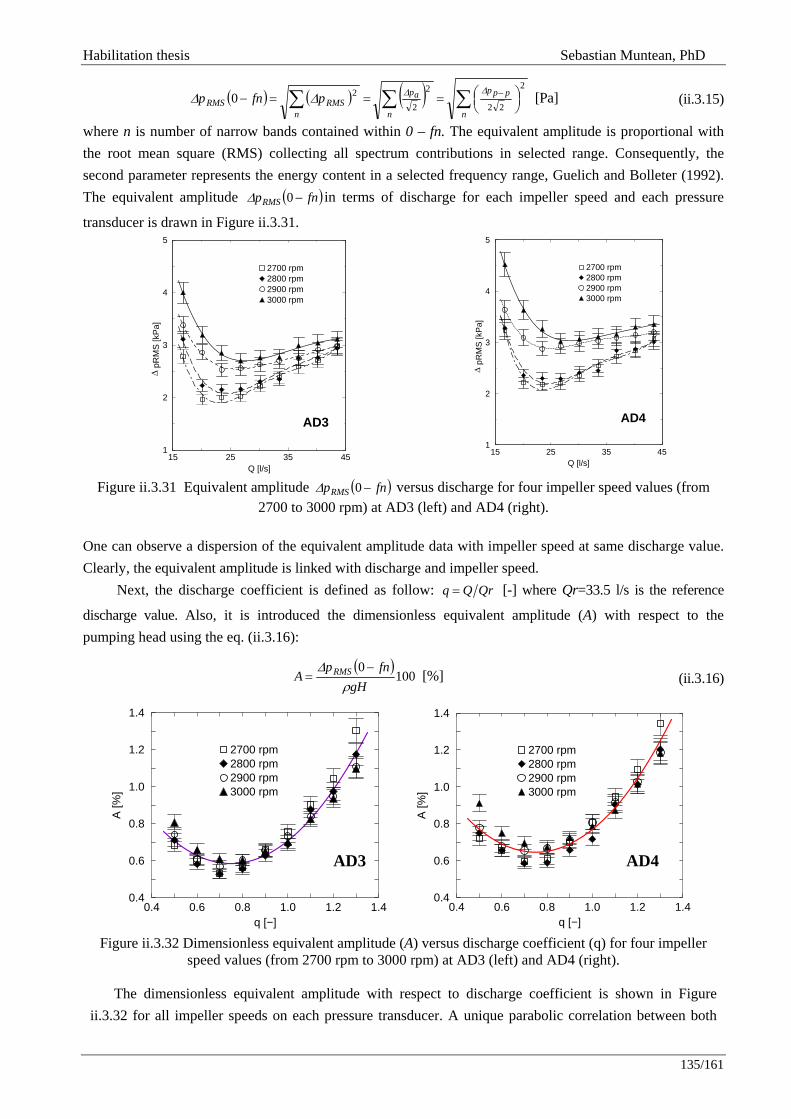
Habilitation thesis Sebastian Muntean, PhD
135/161
( ) ( ) ( ) ∑∑∑ ⎟⎠⎞⎜
⎝⎛===− −
n
ppp
n
ap
nRMSRMS pfnp
2
22
2
220
ΔΔΔΔ [Pa] (ii.3.15)
where n is number of narrow bands contained within 0 – fn. The equivalent amplitude is proportional with the root mean square (RMS) collecting all spectrum contributions in selected range. Consequently, the second parameter represents the energy content in a selected frequency range, Guelich and Bolleter (1992). The equivalent amplitude ( )fnpRMS −0Δ in terms of discharge for each impeller speed and each pressure
transducer is drawn in Figure ii.3.31.
Figure ii.3.31 Equivalent amplitude ( )fnpRMS −0Δ versus discharge for four impeller speed values (from
2700 to 3000 rpm) at AD3 (left) and AD4 (right). One can observe a dispersion of the equivalent amplitude data with impeller speed at same discharge value. Clearly, the equivalent amplitude is linked with discharge and impeller speed. Next, the discharge coefficient is defined as follow: QrQq = [-] where Qr=33.5 l/s is the reference
discharge value. Also, it is introduced the dimensionless equivalent amplitude (A) with respect to the pumping head using the eq. (ii.3.16):
( )100
0gH
fnpA RMS
ρΔ −
= [%] (ii.3.16)
Figure ii.3.32 Dimensionless equivalent amplitude (A) versus discharge coefficient (q) for four impeller speed values (from 2700 rpm to 3000 rpm) at AD3 (left) and AD4 (right).
The dimensionless equivalent amplitude with respect to discharge coefficient is shown in Figure
ii.3.32 for all impeller speeds on each pressure transducer. A unique parabolic correlation between both
15 25 35 45Q [l/s]
1
2
3
4
5
pRM
S [k
Pa]
2700 rpm2800 rpm2900 rpm3000 rpm
AD3
Δ
15 25 35 45Q [l/s]
1
2
3
4
5
pRM
S [k
Pa]
2700 rpm2800 rpm2900 rpm3000 rpm
AD4
Δ
0.4 0.6 0.8 1.0 1.2 1.4q [−]
0.4
0.6
0.8
1.0
1.2
1.4
A [%
]
2700 rpm2800 rpm2900 rpm3000 rpm
AD3
0.4 0.6 0.8 1.0 1.2 1.4q [−]
0.4
0.6
0.8
1.0
1.2
1.4
A [%
]
2700 rpm2800 rpm2900 rpm3000 rpm
AD4
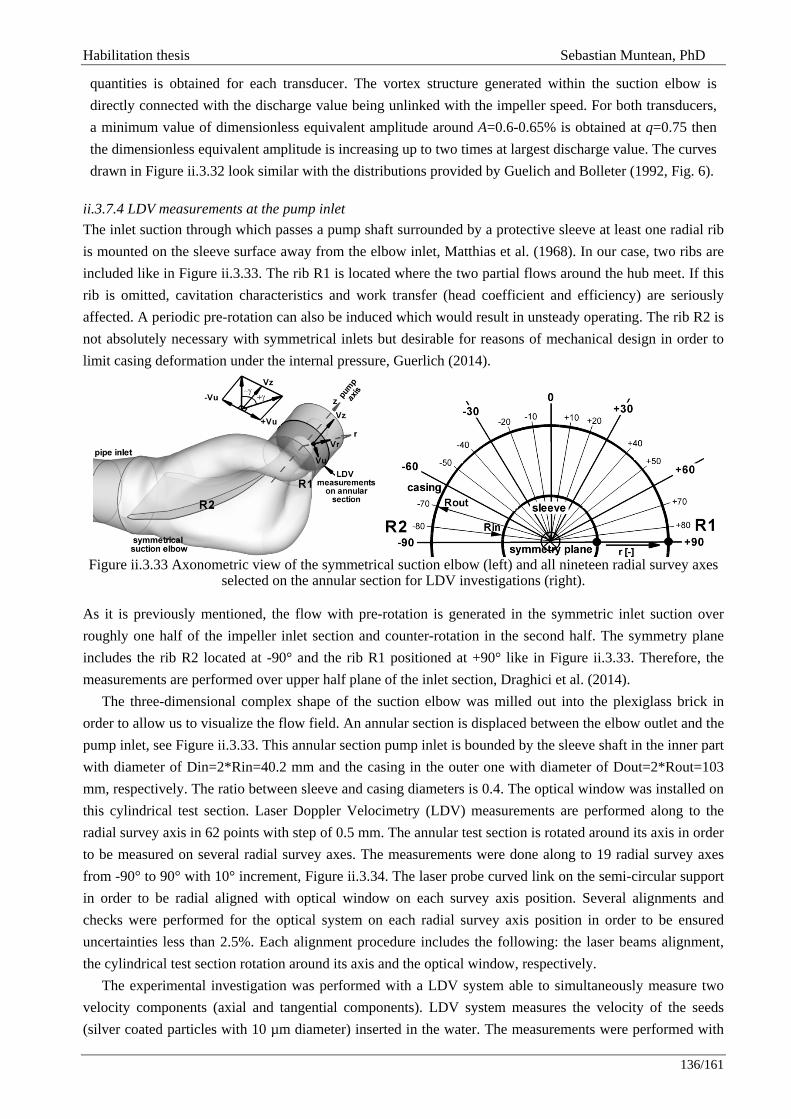
Habilitation thesis Sebastian Muntean, PhD
136/161
quantities is obtained for each transducer. The vortex structure generated within the suction elbow is directly connected with the discharge value being unlinked with the impeller speed. For both transducers, a minimum value of dimensionless equivalent amplitude around A=0.6-0.65% is obtained at q=0.75 then the dimensionless equivalent amplitude is increasing up to two times at largest discharge value. The curves drawn in Figure ii.3.32 look similar with the distributions provided by Guelich and Bolleter (1992, Fig. 6).
ii.3.7.4 LDV measurements at the pump inlet The inlet suction through which passes a pump shaft surrounded by a protective sleeve at least one radial rib is mounted on the sleeve surface away from the elbow inlet, Matthias et al. (1968). In our case, two ribs are included like in Figure ii.3.33. The rib R1 is located where the two partial flows around the hub meet. If this rib is omitted, cavitation characteristics and work transfer (head coefficient and efficiency) are seriously affected. A periodic pre-rotation can also be induced which would result in unsteady operating. The rib R2 is not absolutely necessary with symmetrical inlets but desirable for reasons of mechanical design in order to limit casing deformation under the internal pressure, Guerlich (2014).
Figure ii.3.33 Axonometric view of the symmetrical suction elbow (left) and all nineteen radial survey axes
selected on the annular section for LDV investigations (right). As it is previously mentioned, the flow with pre-rotation is generated in the symmetric inlet suction over roughly one half of the impeller inlet section and counter-rotation in the second half. The symmetry plane includes the rib R2 located at -90° and the rib R1 positioned at +90° like in Figure ii.3.33. Therefore, the measurements are performed over upper half plane of the inlet section, Draghici et al. (2014).
The three-dimensional complex shape of the suction elbow was milled out into the plexiglass brick in order to allow us to visualize the flow field. An annular section is displaced between the elbow outlet and the pump inlet, see Figure ii.3.33. This annular section pump inlet is bounded by the sleeve shaft in the inner part with diameter of Din=2*Rin=40.2 mm and the casing in the outer one with diameter of Dout=2*Rout=103 mm, respectively. The ratio between sleeve and casing diameters is 0.4. The optical window was installed on this cylindrical test section. Laser Doppler Velocimetry (LDV) measurements are performed along to the radial survey axis in 62 points with step of 0.5 mm. The annular test section is rotated around its axis in order to be measured on several radial survey axes. The measurements were done along to 19 radial survey axes from -90° to 90° with 10° increment, Figure ii.3.34. The laser probe curved link on the semi-circular support in order to be radial aligned with optical window on each survey axis position. Several alignments and checks were performed for the optical system on each radial survey axis position in order to be ensured uncertainties less than 2.5%. Each alignment procedure includes the following: the laser beams alignment, the cylindrical test section rotation around its axis and the optical window, respectively.
The experimental investigation was performed with a LDV system able to simultaneously measure two velocity components (axial and tangential components). LDV system measures the velocity of the seeds (silver coated particles with 10 µm diameter) inserted in the water. The measurements were performed with

Habilitation thesis Sebastian Muntean, PhD
137/161
minimum 1000 samples/second (1 kHz sampling frequency). LDV system consists in an argon-ion source with 300 mW power and an optical fibber who guide the beams to the flow. The main characteristics of the LDV system are as follow: focal length of the probe 400 mm; beam diameter 2.2 mm; beam spacing 39.2 mm. For the probe positioning on radial survey axis, 1D traversing system is used with 0.01 mm accuracy. It was established that for each point is necessary to measure 50000 particles in 20 seconds in order to be ensured uncertainties less than 2.5%.
Figure ii.3.34 LDV system installed on test rig: frontal view and side view.
Experimental data LDV measurements are performed along to nineteen radial survey axes (see Figure ii.3.33) for nine discharge values from 0.5Qn to 1.3Qn with increment of 0.1Qn. The average absolute velocity profiles (Vz axial and Vu circumferential velocity components) versus radial coordinate were measured on all radial survey axes. Both dimensionless velocity components are obtained taking into account the average velocity value Vm=Q/A according to the following equations:
[ ]−⎟⎟⎠
⎞⎜⎜⎝
⎛=⎟⎟
⎠
⎞⎜⎜⎝
⎛=
AQV
vAQ
Vv uu
zz ,
(ii.3.17)
where Q corresponds to the discharge value for each regime and the area A of the annular surface is computed as follow: A=π(Rout
2-Rin2).
The average dimensionless velocity profiles along to six radial survey axes are plotted in Figure ii.3.35. One can observe that average dimensionless absolute velocity profiles are discharge independent. However, from +10° to +30° near to the sleeve is remarked a small variation of the circumferential velocity component with discharge value. Also, a larger root mean square value is associated to each experimental point located in this separation region. Nevertheless, the average dimensionless absolute velocity profiles can be considered discharge independent even if the circumferential component of the velocity is slightly modified with the discharge value in this particular region.
The discharge value is computed based on LDV measurements using next equation in order to check the accuracy:
( ) dθdrrθr,VQ2π
2π
R
Rzv
out
in∫ ∫
−= 2 (ii.3.18)
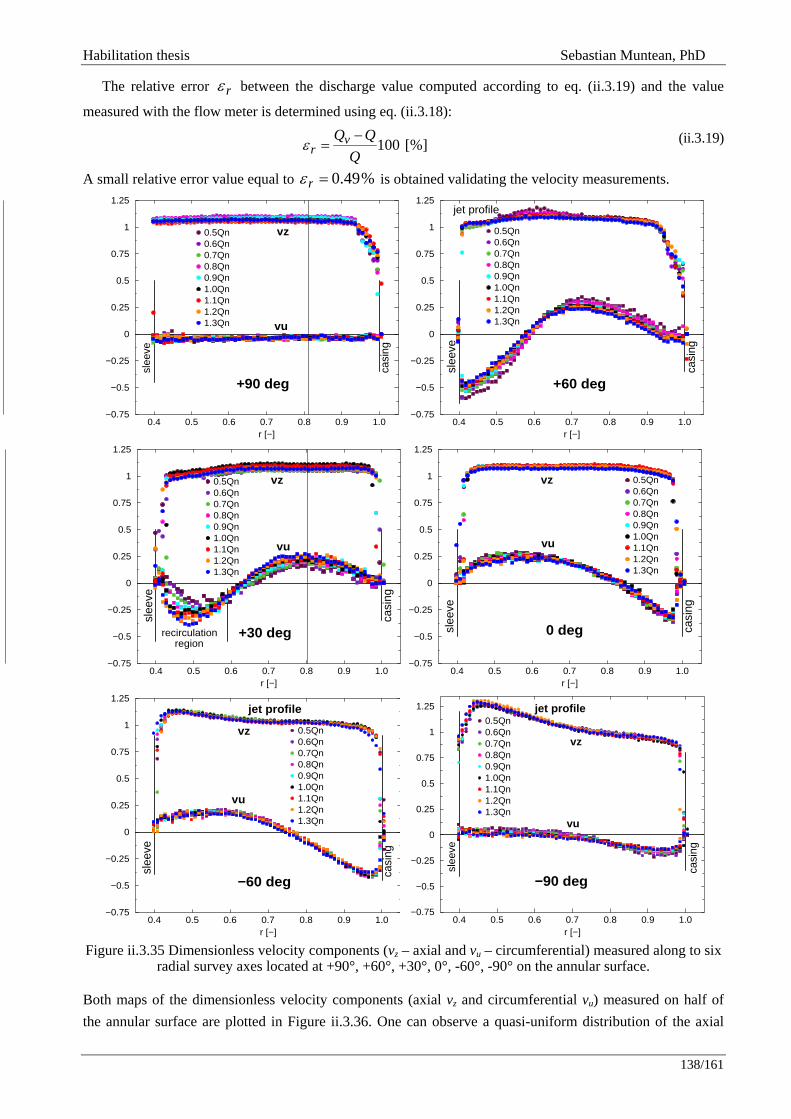
Habilitation thesis Sebastian Muntean, PhD
138/161
The relative error rε between the discharge value computed according to eq. (ii.3.19) and the value
measured with the flow meter is determined using eq. (ii.3.18):
[%]100Q
QQvr
−=ε (ii.3.19)
A small relative error value equal to %0.49=rε is obtained validating the velocity measurements.
Figure ii.3.35 Dimensionless velocity components (vz – axial and vu – circumferential) measured along to six
radial survey axes located at +90°, +60°, +30°, 0°, -60°, -90° on the annular surface. Both maps of the dimensionless velocity components (axial vz and circumferential vu) measured on half of the annular surface are plotted in Figure ii.3.36. One can observe a quasi-uniform distribution of the axial
0.4 0.5 0.6 0.7 0.8 0.9 1.0r [−]
−0.75
−0.5
−0.25
0
0.25
0.5
0.75
1
1.25
0.5Qn0.6Qn0.7Qn0.8Qn0.9Qn1.0Qn1.1Qn1.2Qn1.3Qn
slee
ve
casi
ng+90 deg
vz
vu
0.4 0.5 0.6 0.7 0.8 0.9 1.0r [−]
−0.75
−0.5
−0.25
0
0.25
0.5
0.75
1
1.25
0.5Qn0.6Qn0.7Qn0.8Qn0.9Qn1.0Qn1.1Qn1.2Qn1.3Qn
slee
ve
casi
ng
+60 deg
jet profile
0.4 0.5 0.6 0.7 0.8 0.9 1.0r [−]
−0.75
−0.5
−0.25
0
0.25
0.5
0.75
1
1.25
0.5Qn0.6Qn0.7Qn0.8Qn0.9Qn1.0Qn1.1Qn1.2Qn1.3Qn
slee
ve
casi
ng
+30 deg
vz
vu
recirculationregion
0.4 0.5 0.6 0.7 0.8 0.9 1.0r [−]
−0.75
−0.5
−0.25
0
0.25
0.5
0.75
1
1.25
0.5Qn0.6Qn0.7Qn0.8Qn0.9Qn1.0Qn1.1Qn1.2Qn1.3Qn
slee
ve
casi
ng
0 deg
vz
vu
0.4 0.5 0.6 0.7 0.8 0.9 1.0r [−]
−0.75
−0.5
−0.25
0
0.25
0.5
0.75
1
1.25
0.5Qn0.6Qn0.7Qn0.8Qn0.9Qn1.0Qn1.1Qn1.2Qn1.3Qn
slee
ve
casi
ng
−60 deg
vz
vu
jet profile
0.4 0.5 0.6 0.7 0.8 0.9 1.0r [−]
−0.75
−0.5
−0.25
0
0.25
0.5
0.75
1
1.25
0.5Qn0.6Qn0.7Qn0.8Qn0.9Qn1.0Qn1.1Qn1.2Qn1.3Qn
slee
ve
casi
ng
vz
vu
−90 deg
jet profile
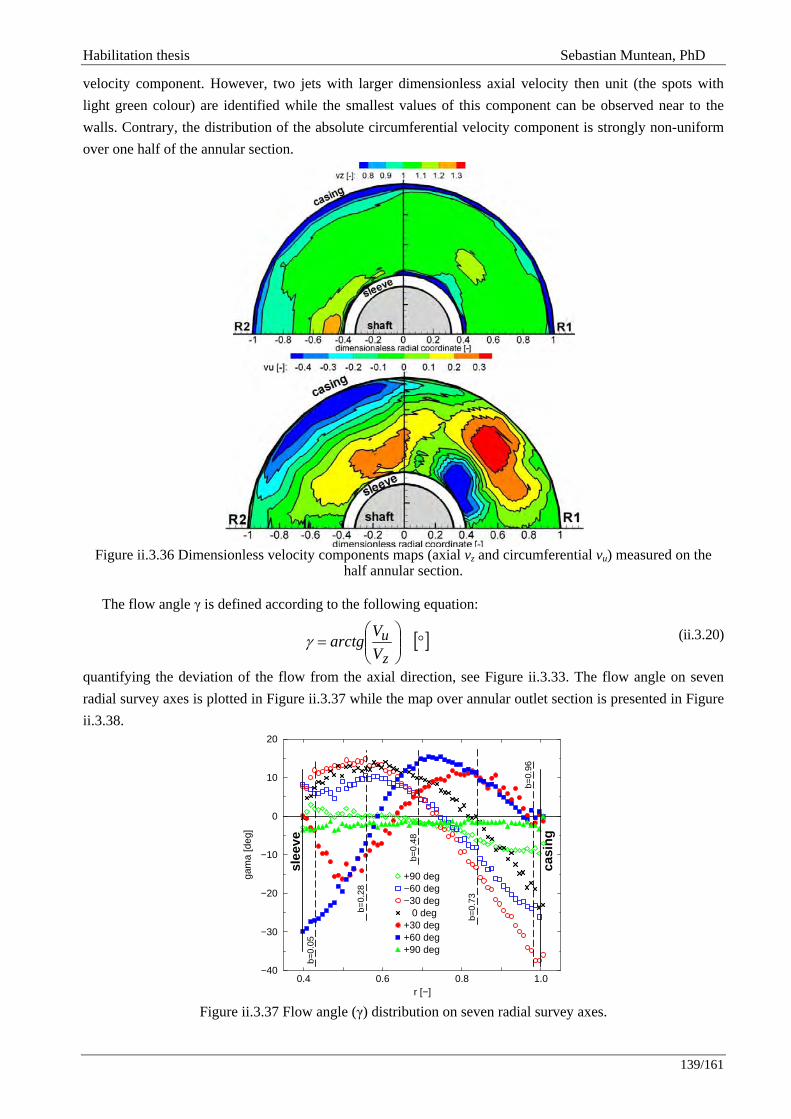
Habilitation thesis Sebastian Muntean, PhD
139/161
velocity component. However, two jets with larger dimensionless axial velocity then unit (the spots with light green colour) are identified while the smallest values of this component can be observed near to the walls. Contrary, the distribution of the absolute circumferential velocity component is strongly non-uniform over one half of the annular section.
Figure ii.3.36 Dimensionless velocity components maps (axial vz and circumferential vu) measured on the
half annular section. The flow angle γ is defined according to the following equation:
[ ]°⎟⎟⎠
⎞⎜⎜⎝
⎛=
zu
VVarctgγ (ii.3.20)
quantifying the deviation of the flow from the axial direction, see Figure ii.3.33. The flow angle on seven radial survey axes is plotted in Figure ii.3.37 while the map over annular outlet section is presented in Figure ii.3.38.
Figure ii.3.37 Flow angle (γ) distribution on seven radial survey axes.
0.4 0.6 0.8 1.0r [−]
−40
−30
−20
−10
0
10
20
gam
a [d
eg]
+90 deg−60 deg−30 deg 0 deg+30 deg+60 deg+90 deg
slee
ve
casi
ng
b=0.
05
b=0.
28
b=0.
48
b=0.
73
b=0.
96
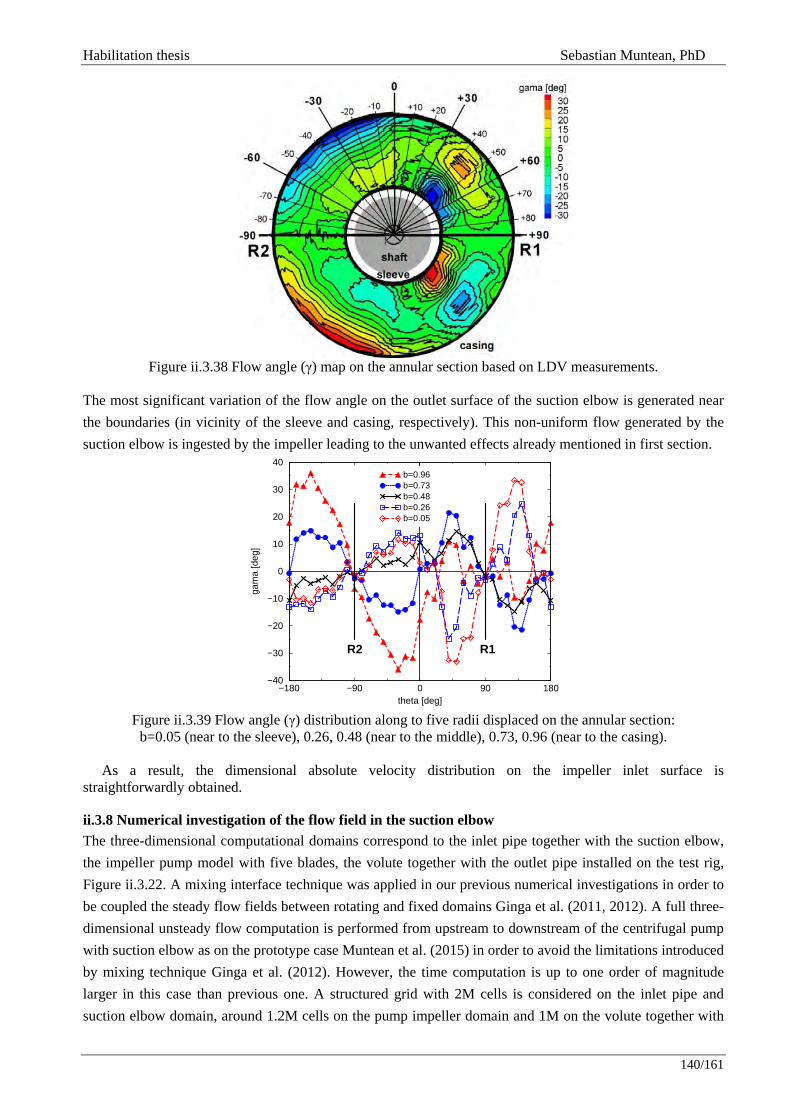
Habilitation thesis Sebastian Muntean, PhD
140/161
Figure ii.3.38 Flow angle (γ) map on the annular section based on LDV measurements.
The most significant variation of the flow angle on the outlet surface of the suction elbow is generated near the boundaries (in vicinity of the sleeve and casing, respectively). This non-uniform flow generated by the suction elbow is ingested by the impeller leading to the unwanted effects already mentioned in first section.
Figure ii.3.39 Flow angle (γ) distribution along to five radii displaced on the annular section:
b=0.05 (near to the sleeve), 0.26, 0.48 (near to the middle), 0.73, 0.96 (near to the casing).
As a result, the dimensional absolute velocity distribution on the impeller inlet surface is straightforwardly obtained.
ii.3.8 Numerical investigation of the flow field in the suction elbow The three-dimensional computational domains correspond to the inlet pipe together with the suction elbow, the impeller pump model with five blades, the volute together with the outlet pipe installed on the test rig, Figure ii.3.22. A mixing interface technique was applied in our previous numerical investigations in order to be coupled the steady flow fields between rotating and fixed domains Ginga et al. (2011, 2012). A full three-dimensional unsteady flow computation is performed from upstream to downstream of the centrifugal pump with suction elbow as on the prototype case Muntean et al. (2015) in order to avoid the limitations introduced by mixing technique Ginga et al. (2012). However, the time computation is up to one order of magnitude larger in this case than previous one. A structured grid with 2M cells is considered on the inlet pipe and suction elbow domain, around 1.2M cells on the pump impeller domain and 1M on the volute together with
−180 −90 0 90 180theta [deg]
−40
−30
−20
−10
0
10
20
30
40
gam
a [d
eg]
b=0.96b=0.73b=0.48b=0.26b=0.05
R2 R1
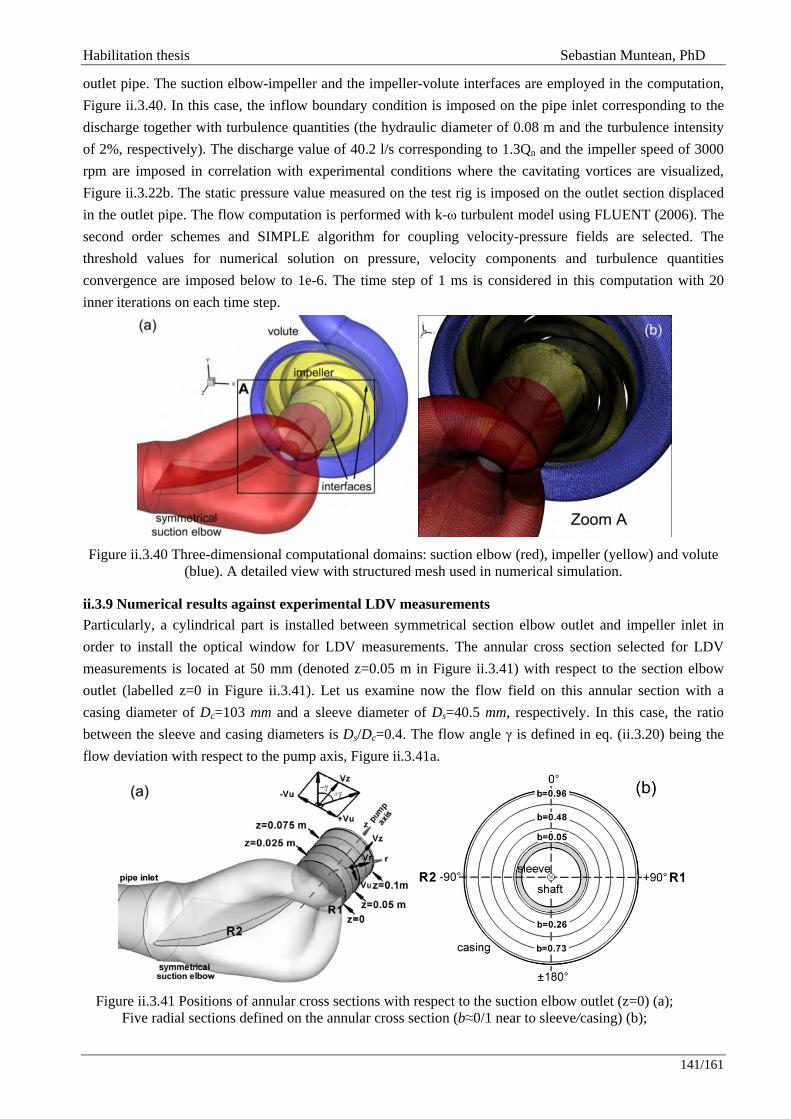
Habilitation thesis Sebastian Muntean, PhD
141/161
outlet pipe. The suction elbow-impeller and the impeller-volute interfaces are employed in the computation, Figure ii.3.40. In this case, the inflow boundary condition is imposed on the pipe inlet corresponding to the discharge together with turbulence quantities (the hydraulic diameter of 0.08 m and the turbulence intensity of 2%, respectively). The discharge value of 40.2 l/s corresponding to 1.3Qn and the impeller speed of 3000 rpm are imposed in correlation with experimental conditions where the cavitating vortices are visualized, Figure ii.3.22b. The static pressure value measured on the test rig is imposed on the outlet section displaced in the outlet pipe. The flow computation is performed with k-ω turbulent model using FLUENT (2006). The second order schemes and SIMPLE algorithm for coupling velocity-pressure fields are selected. The threshold values for numerical solution on pressure, velocity components and turbulence quantities convergence are imposed below to 1e-6. The time step of 1 ms is considered in this computation with 20 inner iterations on each time step.
Figure ii.3.40 Three-dimensional computational domains: suction elbow (red), impeller (yellow) and volute
(blue). A detailed view with structured mesh used in numerical simulation.
ii.3.9 Numerical results against experimental LDV measurements Particularly, a cylindrical part is installed between symmetrical section elbow outlet and impeller inlet in order to install the optical window for LDV measurements. The annular cross section selected for LDV measurements is located at 50 mm (denoted z=0.05 m in Figure ii.3.41) with respect to the section elbow outlet (labelled z=0 in Figure ii.3.41). Let us examine now the flow field on this annular section with a casing diameter of Dc=103 mm and a sleeve diameter of Ds=40.5 mm, respectively. In this case, the ratio between the sleeve and casing diameters is Ds/Dc=0.4. The flow angle γ is defined in eq. (ii.3.20) being the flow deviation with respect to the pump axis, Figure ii.3.41a.
Figure ii.3.41 Positions of annular cross sections with respect to the suction elbow outlet (z=0) (a);
Five radial sections defined on the annular cross section (b≈0/1 near to sleeve/casing) (b);
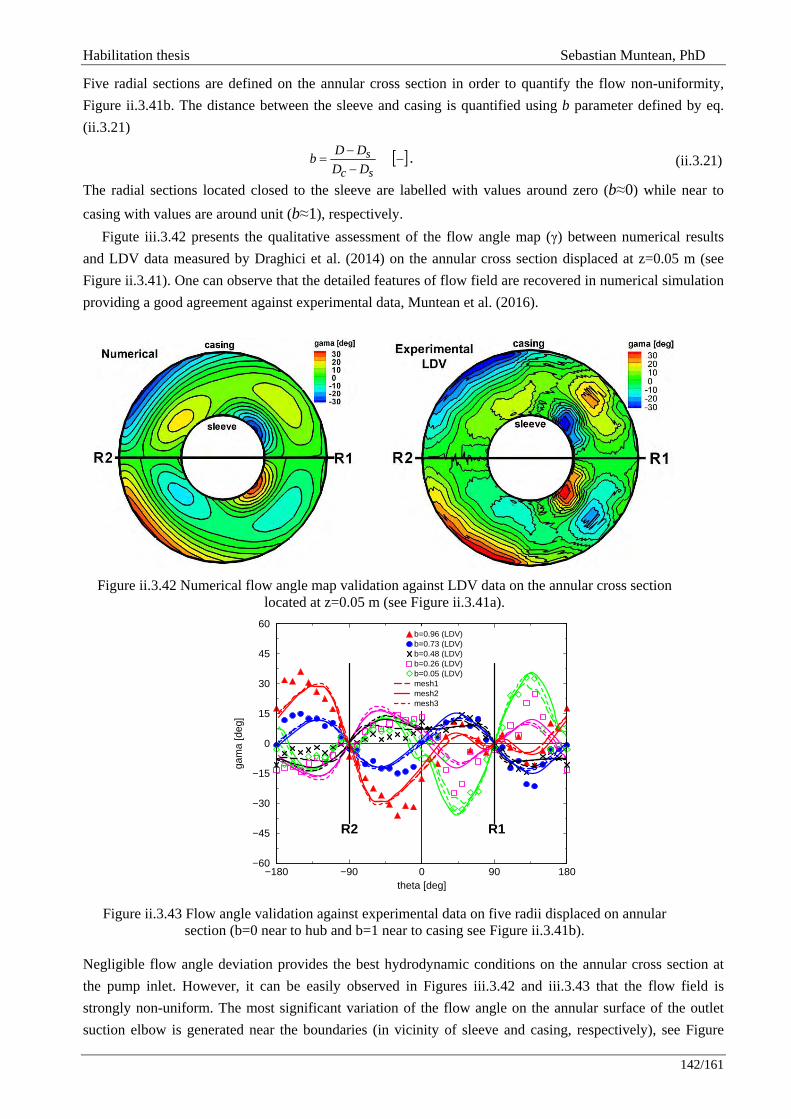
Habilitation thesis Sebastian Muntean, PhD
142/161
Five radial sections are defined on the annular cross section in order to quantify the flow non-uniformity, Figure ii.3.41b. The distance between the sleeve and casing is quantified using b parameter defined by eq. (ii.3.21)
[ ]−−−
=scs
DDDDb . (ii.3.21)
The radial sections located closed to the sleeve are labelled with values around zero (b≈0) while near to casing with values are around unit (b≈1), respectively.
Figute iii.3.42 presents the qualitative assessment of the flow angle map (γ) between numerical results and LDV data measured by Draghici et al. (2014) on the annular cross section displaced at z=0.05 m (see Figure ii.3.41). One can observe that the detailed features of flow field are recovered in numerical simulation providing a good agreement against experimental data, Muntean et al. (2016).
Figure ii.3.42 Numerical flow angle map validation against LDV data on the annular cross section located at z=0.05 m (see Figure ii.3.41a).
Figure ii.3.43 Flow angle validation against experimental data on five radii displaced on annular
section (b=0 near to hub and b=1 near to casing see Figure ii.3.41b). Negligible flow angle deviation provides the best hydrodynamic conditions on the annular cross section at the pump inlet. However, it can be easily observed in Figures iii.3.42 and iii.3.43 that the flow field is strongly non-uniform. The most significant variation of the flow angle on the annular surface of the outlet suction elbow is generated near the boundaries (in vicinity of sleeve and casing, respectively), see Figure
−180 −90 0 90 180theta [deg]
−60
−45
−30
−15
0
15
30
45
60
gam
a [d
eg]
b=0.96 (LDV)b=0.73 (LDV)b=0.48 (LDV)b=0.26 (LDV)b=0.05 (LDV)mesh1mesh2mesh3
R2 R1
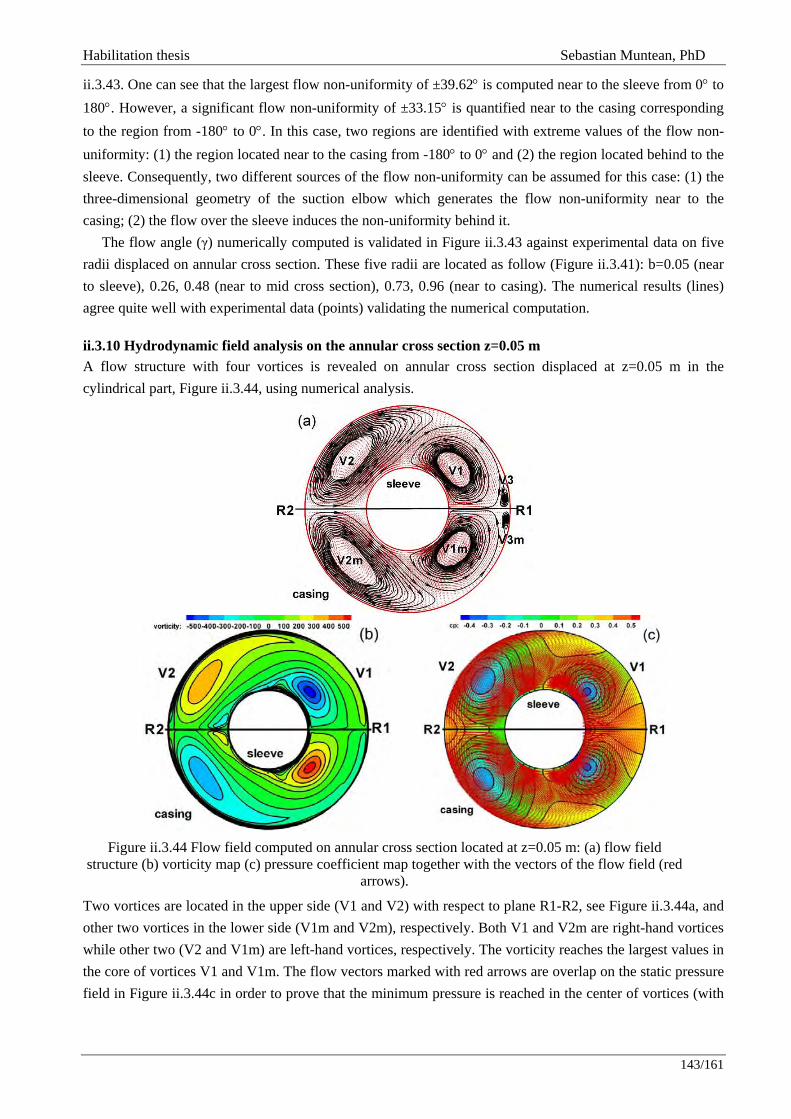
Habilitation thesis Sebastian Muntean, PhD
143/161
ii.3.43. One can see that the largest flow non-uniformity of ±39.62° is computed near to the sleeve from 0° to 180°. However, a significant flow non-uniformity of ±33.15° is quantified near to the casing corresponding to the region from -180° to 0°. In this case, two regions are identified with extreme values of the flow non-uniformity: (1) the region located near to the casing from -180° to 0° and (2) the region located behind to the sleeve. Consequently, two different sources of the flow non-uniformity can be assumed for this case: (1) the three-dimensional geometry of the suction elbow which generates the flow non-uniformity near to the casing; (2) the flow over the sleeve induces the non-uniformity behind it.
The flow angle (γ) numerically computed is validated in Figure ii.3.43 against experimental data on five radii displaced on annular cross section. These five radii are located as follow (Figure ii.3.41): b=0.05 (near to sleeve), 0.26, 0.48 (near to mid cross section), 0.73, 0.96 (near to casing). The numerical results (lines) agree quite well with experimental data (points) validating the numerical computation.
ii.3.10 Hydrodynamic field analysis on the annular cross section z=0.05 m A flow structure with four vortices is revealed on annular cross section displaced at z=0.05 m in the cylindrical part, Figure ii.3.44, using numerical analysis.
Figure ii.3.44 Flow field computed on annular cross section located at z=0.05 m: (a) flow field
structure (b) vorticity map (c) pressure coefficient map together with the vectors of the flow field (red arrows).
Two vortices are located in the upper side (V1 and V2) with respect to plane R1-R2, see Figure ii.3.44a, and other two vortices in the lower side (V1m and V2m), respectively. Both V1 and V2m are right-hand vortices while other two (V2 and V1m) are left-hand vortices, respectively. The vorticity reaches the largest values in the core of vortices V1 and V1m. The flow vectors marked with red arrows are overlap on the static pressure field in Figure ii.3.44c in order to prove that the minimum pressure is reached in the center of vortices (with

Habilitation thesis Sebastian Muntean, PhD
144/161
blue spots). Moreover, the lowest pressure coefficient values are obtained in the center of V1 and V1m vortices in agreement with flow visualization on the test rig.
ii.3.11 Hydrodynamic field analysis in three-dimensional geometry of the section elbow The flow structure with four vortices is identified along to the cylindrical part. This flow structure is plotted on four annular sections displaced at 0.025 m, 0.05 m, 0.075 m and 0.1 m with respect to the outlet section of the suction elbow denoted z=0 in Figure ii.3.41a. Further, the analysis is focused on two vortices (V1 and V2) located in upper side. Both centers of these vortices are marked with red spots in Figure ii.3.45. Each center is located on a strip with negligible tangential component marked with blue color. Clearly, one can observe a modification of each vortex center position from one section to another. Two geometrical parameters (e.g. radial and angular coordinates) associated to each vortex center are introduced to quantify the position distribution along to the suction elbow and cylindrical part, respectively.
Figure ii.3.45 Flow field structure on four annular sections located along to the cylindrical part (see Figure ii.3.41): (a) z=0.025m (b) z=0.05m (c) z=0.075m (d) z=0.1m. The blue lines correspond to the negligible
tangential velocity component.
The vorticity maps are plotted on all five annular cross sections displaced on the cylindrical part, Figure ii.3.46. Also, the vortex core filaments associated to V1 (blue) and V1m (red) generated by the symmetrical section elbow are visualized on the cylindrical part. One can observe a very good qualitative agreement between the distributions of both vortex cores filaments (V1 - blue and V1m - red) along to the cylindrical part plotted in Figure ii.3.48 and the cavitating vortices visualized on the test rig in Figure ii.3.41.
The vortices can be automatically detected using a technique developed by Haimes and Kenwright (1999, 2000) or Sadlo et al. (2006). As a result, the vortex core identification technique presented by Stuparu and Susan-Resiga (2015) is employed using the visualization expert software TECPLOT (2003) on numerical data provided by FLUENT (2006). The algorithm returns a set of vortex core segments with
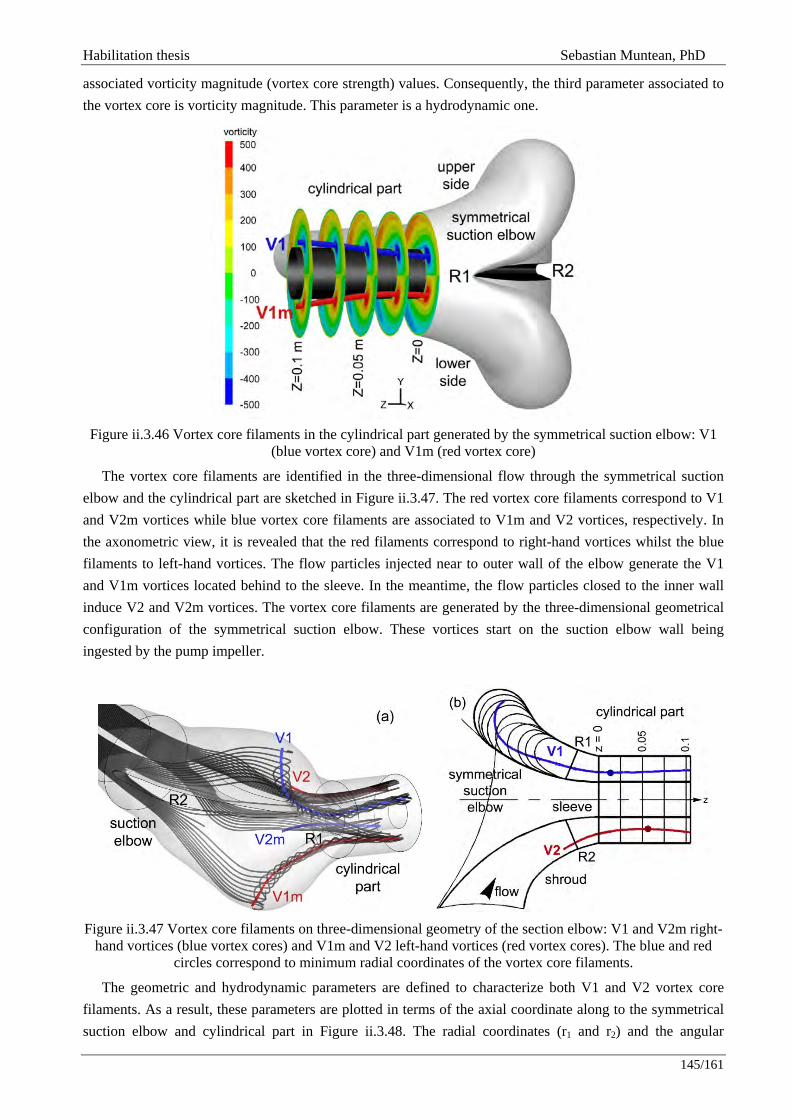
Habilitation thesis Sebastian Muntean, PhD
145/161
associated vorticity magnitude (vortex core strength) values. Consequently, the third parameter associated to the vortex core is vorticity magnitude. This parameter is a hydrodynamic one.
Figure ii.3.46 Vortex core filaments in the cylindrical part generated by the symmetrical suction elbow: V1
(blue vortex core) and V1m (red vortex core)
The vortex core filaments are identified in the three-dimensional flow through the symmetrical suction elbow and the cylindrical part are sketched in Figure ii.3.47. The red vortex core filaments correspond to V1 and V2m vortices while blue vortex core filaments are associated to V1m and V2 vortices, respectively. In the axonometric view, it is revealed that the red filaments correspond to right-hand vortices whilst the blue filaments to left-hand vortices. The flow particles injected near to outer wall of the elbow generate the V1 and V1m vortices located behind to the sleeve. In the meantime, the flow particles closed to the inner wall induce V2 and V2m vortices. The vortex core filaments are generated by the three-dimensional geometrical configuration of the symmetrical suction elbow. These vortices start on the suction elbow wall being ingested by the pump impeller.
Figure ii.3.47 Vortex core filaments on three-dimensional geometry of the section elbow: V1 and V2m right-
hand vortices (blue vortex cores) and V1m and V2 left-hand vortices (red vortex cores). The blue and red circles correspond to minimum radial coordinates of the vortex core filaments.
The geometric and hydrodynamic parameters are defined to characterize both V1 and V2 vortex core filaments. As a result, these parameters are plotted in terms of the axial coordinate along to the symmetrical suction elbow and cylindrical part in Figure ii.3.48. The radial coordinates (r1 and r2) and the angular
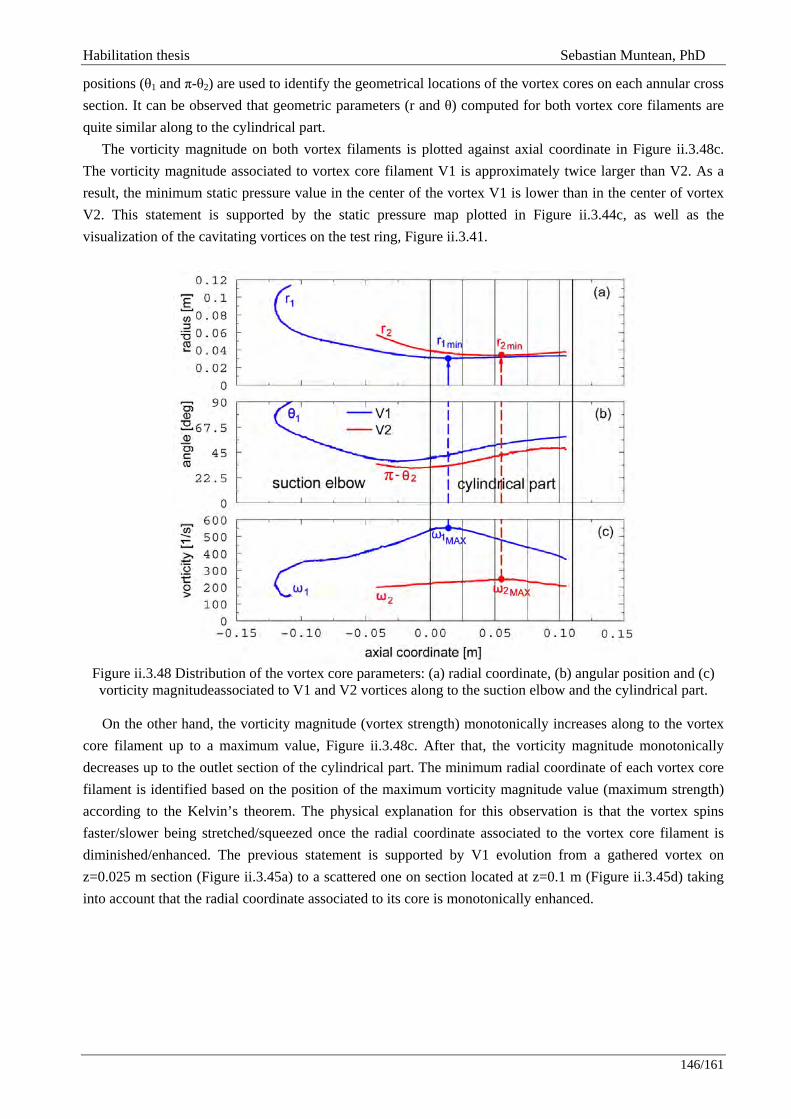
Habilitation thesis Sebastian Muntean, PhD
146/161
positions (θ1 and π-θ2) are used to identify the geometrical locations of the vortex cores on each annular cross section. It can be observed that geometric parameters (r and θ) computed for both vortex core filaments are quite similar along to the cylindrical part.
The vorticity magnitude on both vortex filaments is plotted against axial coordinate in Figure ii.3.48c. The vorticity magnitude associated to vortex core filament V1 is approximately twice larger than V2. As a result, the minimum static pressure value in the center of the vortex V1 is lower than in the center of vortex V2. This statement is supported by the static pressure map plotted in Figure ii.3.44c, as well as the visualization of the cavitating vortices on the test ring, Figure ii.3.41.
Figure ii.3.48 Distribution of the vortex core parameters: (a) radial coordinate, (b) angular position and (c) vorticity magnitudeassociated to V1 and V2 vortices along to the suction elbow and the cylindrical part.
On the other hand, the vorticity magnitude (vortex strength) monotonically increases along to the vortex
core filament up to a maximum value, Figure ii.3.48c. After that, the vorticity magnitude monotonically decreases up to the outlet section of the cylindrical part. The minimum radial coordinate of each vortex core filament is identified based on the position of the maximum vorticity magnitude value (maximum strength) according to the Kelvin’s theorem. The physical explanation for this observation is that the vortex spins faster/slower being stretched/squeezed once the radial coordinate associated to the vortex core filament is diminished/enhanced. The previous statement is supported by V1 evolution from a gathered vortex on z=0.025 m section (Figure ii.3.45a) to a scattered one on section located at z=0.1 m (Figure ii.3.45d) taking into account that the radial coordinate associated to its core is monotonically enhanced.
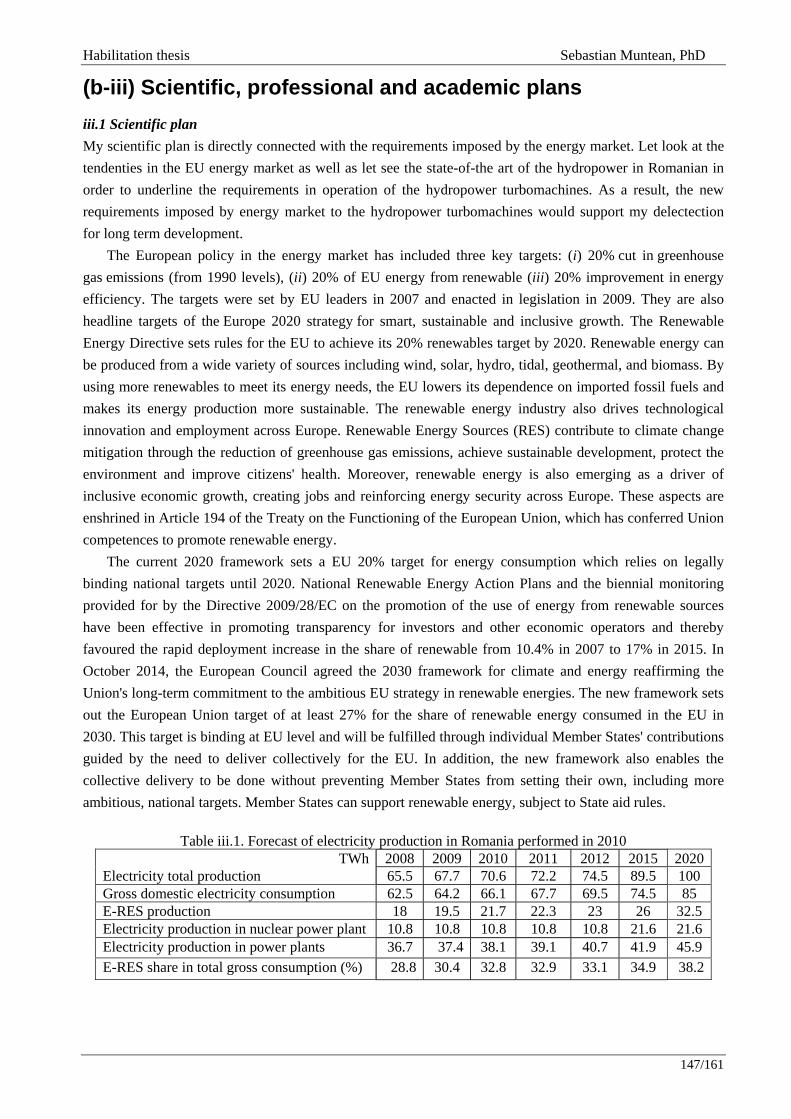
Habilitation thesis Sebastian Muntean, PhD
147/161
(b-iii) Scientific, professional and academic plans iii.1 Scientific plan My scientific plan is directly connected with the requirements imposed by the energy market. Let look at the tendenties in the EU energy market as well as let see the state-of-the art of the hydropower in Romanian in order to underline the requirements in operation of the hydropower turbomachines. As a result, the new requirements imposed by energy market to the hydropower turbomachines would support my delectection for long term development.
The European policy in the energy market has included three key targets: (i) 20% cut in greenhouse gas emissions (from 1990 levels), (ii) 20% of EU energy from renewable (iii) 20% improvement in energy efficiency. The targets were set by EU leaders in 2007 and enacted in legislation in 2009. They are also headline targets of the Europe 2020 strategy for smart, sustainable and inclusive growth. The Renewable Energy Directive sets rules for the EU to achieve its 20% renewables target by 2020. Renewable energy can be produced from a wide variety of sources including wind, solar, hydro, tidal, geothermal, and biomass. By using more renewables to meet its energy needs, the EU lowers its dependence on imported fossil fuels and makes its energy production more sustainable. The renewable energy industry also drives technological innovation and employment across Europe. Renewable Energy Sources (RES) contribute to climate change mitigation through the reduction of greenhouse gas emissions, achieve sustainable development, protect the environment and improve citizens' health. Moreover, renewable energy is also emerging as a driver of inclusive economic growth, creating jobs and reinforcing energy security across Europe. These aspects are enshrined in Article 194 of the Treaty on the Functioning of the European Union, which has conferred Union competences to promote renewable energy.
The current 2020 framework sets a EU 20% target for energy consumption which relies on legally binding national targets until 2020. National Renewable Energy Action Plans and the biennial monitoring provided for by the Directive 2009/28/EC on the promotion of the use of energy from renewable sources have been effective in promoting transparency for investors and other economic operators and thereby favoured the rapid deployment increase in the share of renewable from 10.4% in 2007 to 17% in 2015. In October 2014, the European Council agreed the 2030 framework for climate and energy reaffirming the Union's long-term commitment to the ambitious EU strategy in renewable energies. The new framework sets out the European Union target of at least 27% for the share of renewable energy consumed in the EU in 2030. This target is binding at EU level and will be fulfilled through individual Member States' contributions guided by the need to deliver collectively for the EU. In addition, the new framework also enables the collective delivery to be done without preventing Member States from setting their own, including more ambitious, national targets. Member States can support renewable energy, subject to State aid rules.
Table iii.1. Forecast of electricity production in Romania performed in 2010 TWh 2008 2009 2010 2011 2012 2015 2020
Electricity total production 65.5 67.7 70.6 72.2 74.5 89.5 100 Gross domestic electricity consumption 62.5 64.2 66.1 67.7 69.5 74.5 85 E-RES production 18 19.5 21.7 22.3 23 26 32.5 Electricity production in nuclear power plant 10.8 10.8 10.8 10.8 10.8 21.6 21.6 Electricity production in power plants 36.7 37.4 38.1 39.1 40.7 41.9 45.9 E-RES share in total gross consumption (%) 28.8 30.4 32.8 32.9 33.1 34.9 38.2
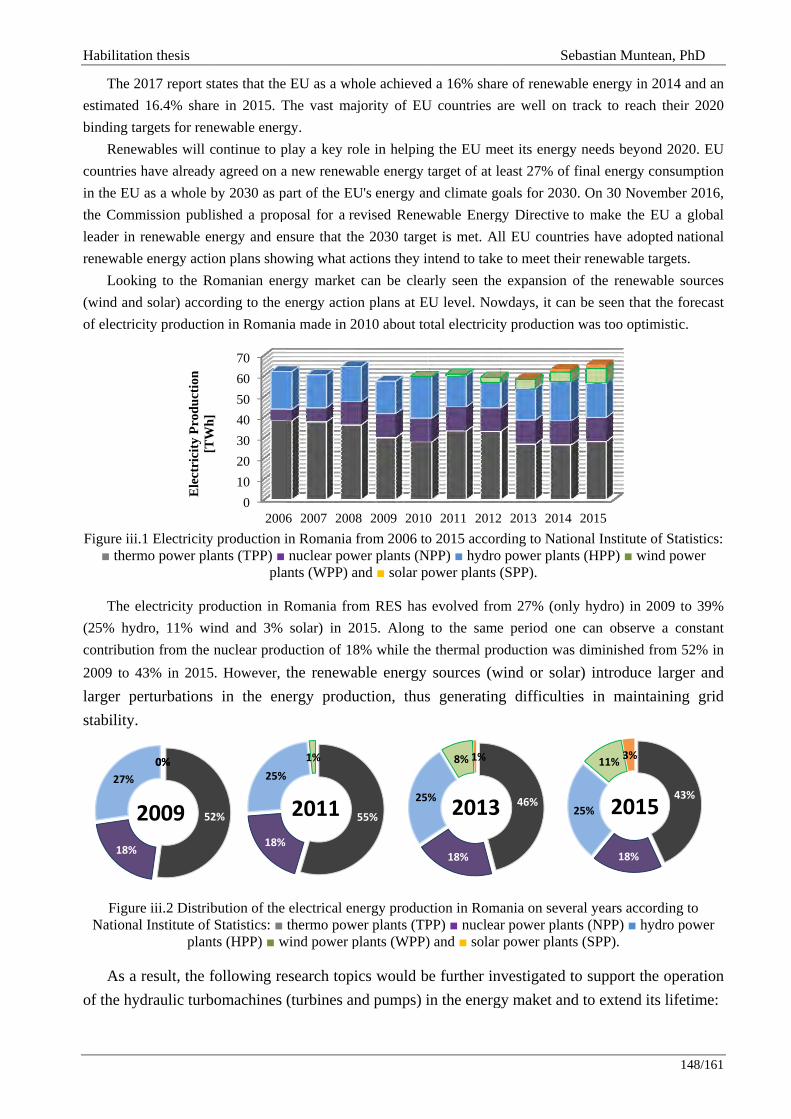
Habilitatio
The 20estimated binding tar
Renewcountries hin the EU the Commleader in rrenewable
Lookin(wind and of electrici
Figure iii. therm
The el
(25% hydcontributio2009 to 43larger pestability.
Figure
National
As a rof the hyd
18%
27%
2
on thesis
017 report st16.4% sharergets for rene
wables will chave alreadyas a whole b
mission publirenewable en energy actiong to the Rosolar) accor
ity productio
1 Electricity mo power pla
lectricity prodro, 11% winon from the n3% in 2015
erturbations
e iii.2 DistribInstitute of
plant
result, the fdraulic turbo
Ele
ctri
city
Pro
duct
ion
[TW
h]
52
0%0%
2009
tates that thee in 2015. Tewable energ
continue to py agreed on aby 2030 as pished a propnergy and enon plans showomanian enerding to the eon in Romani
production iants (TPP)
pla
oduction in Rnd and 3% nuclear prod. However, in the en
bution of the Statistics: ts (HPP) w
following reomachines
010203040506070
2006
[]
2%
18%
25%
EU as a whThe vast majgy. play a key roa new renewaart of the EU
posal for a rensure that thwing what acergy market energy actioia made in 2
in Romania fnuclear pow
ants (WPP) a
Romania frosolar) in 20
duction of 18the renewaergy produ
electrical enthermo pow
wind power p
esearch topi(turbines an
6 2007 2008
1%
2011
hole achievedjority of EU
ole in helpingable energy tU's energy anevised Renewhe 2030 targections they incan be clean plans at EU010 about to
from 2006 tower plants (Nand solar po
om RES has 015. Along 8% while theable energy uction, thus
nergy producer plants (TP
plants (WPP)
ics would bnd pumps) i
8 2009 2010
55%
25%
d a 16% sharU countries a
g the EU metarget of at lend climate gowable Energet is met. Alntend to take
arly seen theU level. Now
otal electricity
o 2015 accorNPP) hydro
ower plants (
evolved froto the same
e thermal prosources (w
s generating
ction in RomaPP) nuclear) and solar
e further inin the energ
0 2011 2012
18%
%
8% 1%
2013
Se
re of renewabare well on
eet its energyeast 27% of oals for 2030
gy Directive ll EU countre to meet thee expansion wdays, it cany production
ding to Natioo power plant(SPP).
m 27% (onle period oneoduction was
wind or solag difficultie
ania on sever power planpower plant
nvestigated tgy maket and
2 2013 2014
46%
ebastian Mun
ble energy intrack to reac
y needs beyofinal energy
0. On 30 Novto make the
ries have adoir renewableof the renew
n be seen than was too opt
onal Institutets (HPP) w
ly hydro) in e can observs diminishedar) introduces in main
ral years accnts (NPP) hts (SPP).
to support td to extend
2015
18%
25%
11% 3%
201
ntean, PhD
148/16
n 2014 and ach their 202
ond 2020. EUy consumptiovember 2016
e EU a globaopted nationae targets. wable sourceat the forecastimistic.
e of Statisticswind power
2009 to 39%ve a constan
d from 52% ice larger anntaining gri
cording to hydro power
the operatioits lifetime
43%15
61
an 20
U on 6, al al
es st
s:
% nt in
nd id
on :
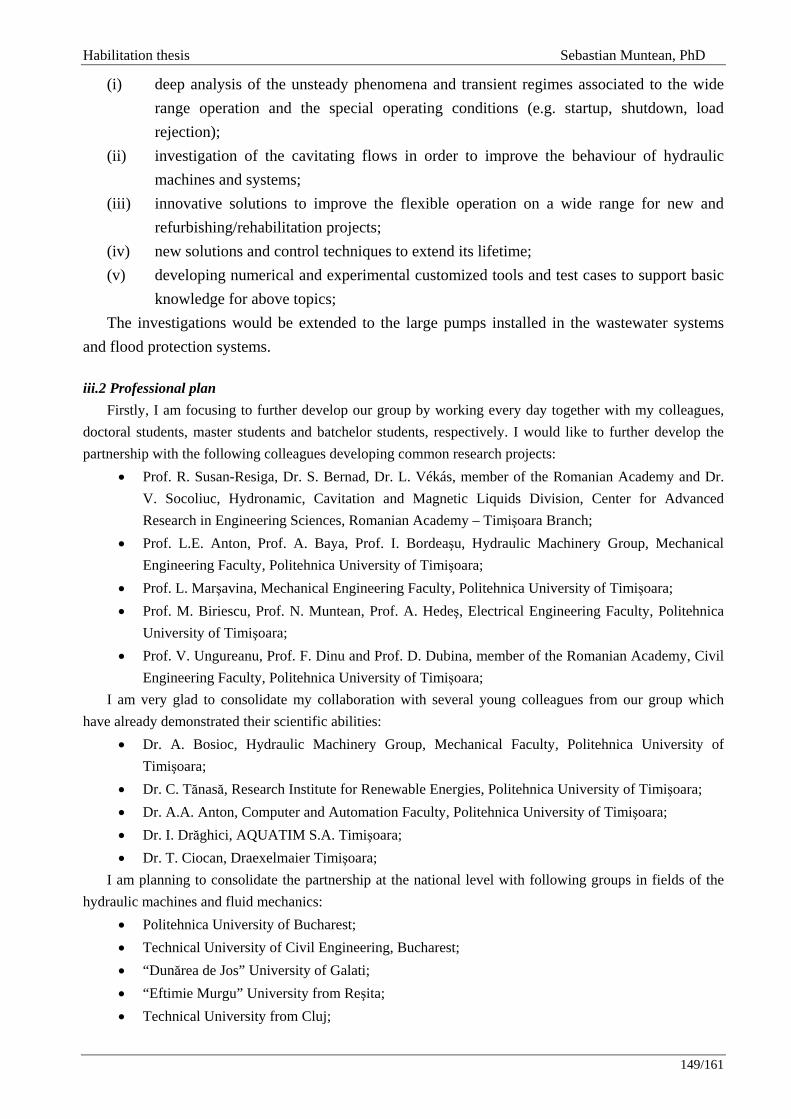
Habilitation thesis Sebastian Muntean, PhD
149/161
(i) deep analysis of the unsteady phenomena and transient regimes associated to the wide range operation and the special operating conditions (e.g. startup, shutdown, load rejection);
(ii) investigation of the cavitating flows in order to improve the behaviour of hydraulic machines and systems;
(iii) innovative solutions to improve the flexible operation on a wide range for new and refurbishing/rehabilitation projects;
(iv) new solutions and control techniques to extend its lifetime; (v) developing numerical and experimental customized tools and test cases to support basic
knowledge for above topics; The investigations would be extended to the large pumps installed in the wastewater systems
and flood protection systems. iii.2 Professional plan
Firstly, I am focusing to further develop our group by working every day together with my colleagues, doctoral students, master students and batchelor students, respectively. I would like to further develop the partnership with the following colleagues developing common research projects:
• Prof. R. Susan-Resiga, Dr. S. Bernad, Dr. L. Vékás, member of the Romanian Academy and Dr. V. Socoliuc, Hydronamic, Cavitation and Magnetic Liquids Division, Center for Advanced Research in Engineering Sciences, Romanian Academy – Timişoara Branch;
• Prof. L.E. Anton, Prof. A. Baya, Prof. I. Bordeaşu, Hydraulic Machinery Group, Mechanical Engineering Faculty, Politehnica University of Timişoara;
• Prof. L. Marşavina, Mechanical Engineering Faculty, Politehnica University of Timişoara; • Prof. M. Biriescu, Prof. N. Muntean, Prof. A. Hedeş, Electrical Engineering Faculty, Politehnica
University of Timişoara; • Prof. V. Ungureanu, Prof. F. Dinu and Prof. D. Dubina, member of the Romanian Academy, Civil
Engineering Faculty, Politehnica University of Timişoara; I am very glad to consolidate my collaboration with several young colleagues from our group which
have already demonstrated their scientific abilities: • Dr. A. Bosioc, Hydraulic Machinery Group, Mechanical Faculty, Politehnica University of
Timişoara; • Dr. C. Tănasă, Research Institute for Renewable Energies, Politehnica University of Timişoara; • Dr. A.A. Anton, Computer and Automation Faculty, Politehnica University of Timişoara; • Dr. I. Drăghici, AQUATIM S.A. Timişoara; • Dr. T. Ciocan, Draexelmaier Timişoara;
I am planning to consolidate the partnership at the national level with following groups in fields of the hydraulic machines and fluid mechanics:
• Politehnica University of Bucharest; • Technical University of Civil Engineering, Bucharest; • “Dunărea de Jos” University of Galati; • “Eftimie Murgu” University from Reşita; • Technical University from Cluj;
Habilitation thesis Sebastian Muntean, PhD
150/161
• Transilvania University from Braşov; • S.C. Hidroelectrica S.A. and it subsidiaries; • AQUATIM S.A. Timişoara; • UCM Reşita; • S.C. ROSEAL S.A. Odorheiul Secuiesc; • ANIF Timişoara;
and at the international level with the following groups in the same fields: • Stuttgart University, Germany; • École Polytechnique Fédérale de Lausanne, Switzerland; • Chalmers Univesity of Technology, Goetenburg, Sweden; • Norwegian University of Science and Technology, Trodheim, Norway; • Luleå University of Technology, Sweden; • Brno University of Technology, Czech Republic; • Russian Academy of Science - Siberian Branch, Kutateladze Institute of Thermophysics,
Novosibirsk, Russia; • Laval University, Canada; • Vienna University of Technology, Austria; • Grenoble Institute of Technology, France; • HES-SO Valais-Wallis, Sion, Switzerland; • Ecole Technique Supérieure de Montreal, Canada; • China Agricultural University, Beijing, China; • GE Hydro (former Alstom Hydro), Grenoble, France; • Turboinstitut, Ljubljana, Slovenia; • Andritz Hydro (former GE Hydro), Montreal, Canada; • Andritz Hydro (former VA TECH Hydro), Zuerich, Switzerland; • IREQ, HydroQubec, Canada; • Power Vision Engineering, Switzerland.
Several national and international projects covering the scientific topics detailed in the previous section would be further developed. Also, my professional plan for next decade is linked with developing two further infrastructures to support the scientific research plan detailed in previous section. First one is extending the HPC infrastructure (both hardware and software) available at Parallel Computing and Numerical Simulation Laboratory from National Research Center for Engineering with Complex Fluids, Politehnica University of Timisoara. This infrastructure targets two issues: (i) a numerical platform available for PhD/master/Batchelor students (ANSYS Academic Multiphysics Campus Solution (50/500) with 50 serial licences and 500 teaching licences) from Politehnica University of Timisoara and (ii) high parallel computing software platform (ANSYS Academic Multiphysics Campus Solution with 256 cores) for PhD/master students and postdoctoral researchers togheter with an extension of the HPC hardware platform (IBM Blade supercomputer) available at UPT. In doing so, the numerical tools can be available on large scale at all levels.
The second research infrastructure is reffering to a turbine test rig (e.g. Francis/Kaplan turbines and pump-turbines). This infrastructure targets global performances (efficiency and cavitation behaviour) and special capabilities for the flow investigations (e.g. unsteady pressure field, LDV) in hydraulic turbines in order to assess innovative solutions for its operation on a wide operation range (e.g. axial water injection, air-
Habilitation thesis Sebastian Muntean, PhD
151/161
water control tehnique) and during special operating conditions (e.g. startup, shutdown, load rejection), respectively. This infrastructure would be a key element to develop the knowledge and human resource in the fluid engineering and hydropower fields being crucial at national level. Several national and international projects would be developed using this infrastructure to support the partnerships mentioned above. iii.3 Academic plan
First of all, I would like to emphasize once again my membership to Timişoara School on Hydraulic Machines and Cavitation. I was formed in this school and I continued to develop the research directions with my colleagues based on what we inherited. New research developments have been outlined in my habilitation thesis. Obviously, it is teamwork like it has done so far. Therefore, my vision is structured on three levels (local, national and international) being based on my academic acitivities developed up to now. I am summarizing these academic activities at each level. Then I am underlying my plan based on these previous activities.
I have collaborated with several PhD students during their doctoral programs: o Dr. D.I. Balint, Dr. A. Stuparu, Dr. A.A. Anton, Dr. A. Bosioc, Dr. T. Tănasă, Dr. Gh. Gînga, Dr.
I.G. Moisă, Dr. T. Ciocan, Dr. C. Ighişan, Dr. N. Paşca from Politehnica University of Timişoara; o Dr. C. Mărculescu, Dr. G. Dunca from Politehnica University of Bucharest; o Dr. B. Bedelean from Transilvania University from Braşov; o Dr. D. Štefan, Brno University of Technology, Czech Republic; o Dr. A. Javadi, Chalmers Univesity of Technology, Goetenburg, Sweden. Each person mentioned above (exccepting Dr. A. Javadi) has worked at his doctoral thesis at least a time
period together with me in Timisoara. In my opinion, this is a mutual bilateral cooperation with benefits for both sides. I am planning to offer this opportunity to my PhD students based on my partnerships at the local, national and international levels.
The national PhD School in Hydraulic Machinery and Fluid Engineering is a valuable idea promoted by several professors from our community (e.g. Prof. A. Anton, Prof. C. Balan and Prof. R. Susan-Resiga). This idea can be developed based on previous succesful projects: ACCORD-Fluid and Fluids Engineering Information Platform - PiiF projects. I will contribute with my knowledges to implement this idea.
A bilateral partnership was developed with Institute of Hydraulic Machinery and Fluid Mechanics from Stuttgart University, Germany during 2005 – 2014. I initiated this bilateral partnership together with Dr. A. Ruprecht after my HPC project implemented at Stuttgart University in 2005. The partnership was developed together with Prof. R. Susan-Resiga and valuable support of Prof. L.E. Anton and Prof. A. Baya from Romanian side and Prof. E. Goede from German side, respectively. This partnership has included the following:
o one German-Romanian Workshop on Turbomachiney Hydrodynamics (GRoWTH) organized every year (one in Timisoara and next in Stuttgart);
o one common technical visit at industrial partner each year (e.g. hydropower plant, pumping stations, research infrastructures, wastewater stations, and so on );
o a fruitful and stimulating environment for young colleagues (e.g. postdoctorands, PhD, master and Batchelor students) from both groups. The following young colleagues from our group was benefits by this partnership: Dr. D.I. Balint, Dr. A. Stuparu, Dr. A. Bosioc, Dr. V. Hasmatuchi, Dr. T. Tănasă, Dr. G. Gînga, Dr. I.G. Moisă, Dr. T. Ciocan, Dr. C. Ighişan, Dr. A.-F. Totorean, Dr. I. Dragomirescu, Dr. N. Paşca, ing. S. Constantin.
o joint researches to design and investigate the fluid flows in the new swirl generators;
Habilitation thesis Sebastian Muntean, PhD
152/161
o joint researches to design new tehnical solutions for hydropower plants (e.g. Bradisor HPP) and testing/assesing new flow control techniques on turbine models (e.g. axial water jet);
o support for HPC projects implemented at Institute of Hydraulic Machinery and Fluid Mechanics (e.g. Dr. D.I. Balint and Dr. A.A. Anton).
I will capitalize on any chance of this kind for future bilateral cooperation on the basis of the experience gained previously. It is a fruitful environment for all members of the group but especially for the young colleagues. I am planning to enrich my experience developing a bilateral cooperation with other group in field of the hydraulic machinery (e.g. Austria or Serbia).
My participation to the events (workshops, symposia, conferences) organized by International Association on Hydraulic Research, Section: Hydraulic Machinery and Systems is a priority. The IAHR: Section on Hydraulic Machinery and Systems is the community dealing with the advancement of technology associated with the understanding of steady and unsteady flow characteristics in hydraulic machinery and conduit systems connected to the machinery. The technology elements include the fluid behaviour within machine components, hydro behaviour of machine components, cavitation in turbines and pumps and hydraulic machine and plant control systems.
I have developed several international partnerships based on the participation to these events valorized in common publications. Please find below enumerated these colleagues from the international community:
o Prof. E. Goede, Dr. A. Ruprecht, Prof. S. Riedelbauch, Dr. O. Kirschner, Dr. R. Neubauer, Stuttgart University, Germany;
o Dr. G.D. Ciocan, Laval University, Quebec, Canada; o Prof. F. Avellan, École Polytechnique Fédérale de Lausanne, Switzerland; o Dr. V. Hasmatuchi, HES-SO Valais-Wallis, Sion, Switzerland; o Prof. H. Nilsson, Dr. O. Petit, Dr. A. Javadi, Chalmers Univesity of Technology, Goetenburg,
Sweden; o Prof. M. Cervantes, Luleå University of Technology, Sweden; o Prof. P. Rudolf, Dr. D. Štefan, Brno University of Technology, Czech Republic; o Prof. P.A. Kuibin, Prof. V.L. Okulov, Russian Academy of Science - Siberian Branch,
Kutateladze Institute of Thermophysics, Novosibirsk, Russia; o Dr. P. Stein, Andritz Hydro (former VA TECH Hydro), Zuerich, Switzerland; o Dr. A. Skerlavaj, Turboinštitut, Ljubljana, Slovenia; o Dr. T.C. Vu, Dr. B. Nennemann, Andritz Hydro (former GE Hydro), Canada; o Dr. P. Leroy, Dr. E. Joubarne, Dr. L. Bornard, Dr. T. de Colombel, GE Hydro (former Alstom
Hydro), Grenoble, France; Therefore, I will encourage and support my younger colleagues (e.g. PhD/master/Batchelor students) to
participate to the events organized by IAHR community in order to develop a solid connection with peoples from international community.
I have approached problems raised by industrial partners such as the Hidroelectrica (Romanian Hydropower Company), ALSTOM Hydro France, AQUATIM S.A. Timişoara and others. It is clear that in order for the engineering research to achieve significant impact, the problems to be addressed must originate from the current practice in companies. As a result, the subjects of the PhD theses I am planning to supervise would be closely related to the fundamental aspects of the complex flow phenomena occurring in practice. Moreover, the PhD students would interact with the industrial environment, with important benefits for their professional career development (e.g. better perceive the conditions in which machines and equipment work, interact with engineers with vast experience).

Habilitation thesis Sebastian Muntean, PhD
153/161
(c) REFERENCES Adane K.K., Ormiston S.J., Tachie M.F. (2008) Numerical investigation of flow recirculation in a draft tube.
Journal of Hydraulic Research, 46(1), pp. 15-20. Advanced Design Technology (2006) TurboDesign-1User’s guide V.3.1, London, UK. Alekseenko S. V., Kuibin P.A., Okulov V. L. (2007) Theory of concentrated vortices, Springer-Verlag Berlin
Heidelberg. Amtec Engineering Inc. (2003) TECPLOT User’s guide V.10, Bellevue, WA. Ansys Inc. (2015) FLUENT User’s Guide V.16.1, Canonsburg, PA, USA. Anton A. (2010) In situ performance curves measurements of large pumps, IOP Conf. Series: Earth and
Environmental Science, 12, 012090, pp. 1-10. Anton I. (1979) Hydraulic turbines, Facla Publishing House, Timisoara, Romania. (in Romanian) Anton I. (1984) 1, (1985) 2, Cavitation, Romanian Academy Publishing House, Bucharest, Romania. (in
Romanian) Avellan F., Dupont P., Farhat M., Gindroz B., Henry P., Hussain M., Parkinson E., Santal O. (1990) Flow
Survey and blade pressure measurements in a Francis turbine model. In Proc. XVth IAHR Symposium on Modern Technology in Hydraulic Energy Production, Belgrade, Yugoslavia, 2, Paper No. I4, pp. 1-14.
Avellan F., Dupont P., Farhat M., Gindroz B., Henry P., Hussain M. (1993) Experimental flow study of the GAMM turbine model. In Sottas G. and Ryhming I.L., (eds.), 3D-computation of incompressible internal flows, NNFM 39, Vieweg Verlag, Braunschweig. pp.33-53.
Avellan F. (2000) Flow investigations in a Francis draft tube: the FLINDT project, In Proc. of the 20th IAHR Symposium on Hydraulic Machinery and Cavitation, Charlotte, USA.
Avellan F. (2004) Introduction to Cavitation in Hydraulic Machinery, Resiga R., Bernad S., Muntean S., Popoviciu M. (eds.) Proc. of 6th International Conference on Hydraulic Machinery and Hydrodynamics, October 21-22, 2004, Timisoara, Romania. (Invited lecture), pp. 11-22
Baya A., Muntean S., Câmpian V.C., Cuzmoş A., Diaconescu M., Bălan Gh., (2010) Experimental investigations of the unsteady flow in a Francis turbine draft tube cone, IoP Conf. Series: Earth and Environmental Science, 12, 012007 pp. 1-9
Bergström J. (1999) Approximations of numerical errors and boundary conditions in a draft tube, Proc. Turbine 99 – Workshop on Draft Tube Flow, Porjus, Sweden, pp. 1-13.
Bolliger W., Leibundgut E. (2004) Selection of Large Water Transport Pumps and Field Experiences, Proc. 21st Int. Pump Users Symposium, Texas A&M University, Texas, USA. pp. 48-61.
Borges J. E. (1993) A Proposed Through-Flow Inverse Method for the Design of Mixed-Flow Pumps, Int. J. for Numerical Methods in Fluids, 17, pp. 1097-1114.
Bosioc A., Susan-Resiga R., Muntean S. (2008) Design and manufacturing of a convergent-divergent test section for swirling flow apparatus Proc. of the 4th German-Romanian Workshop on Turbomachinery Hydrodynamics, Stuttgart, Germany. pp. 1 – 15.
Bosioc A., Susan-Resiga R., Muntean S., Tănasă C. (2012) Unsteady pressure analysis of a swirling flow with vortex rope and axial water injection in a discharge cone, ASME Journal of Fluids Engineering 134(8), 081104, pp. 1-11.
Bosioc A., Muntean S., Tănasă C., Susan-Resiga R., Vékás L. (2014) Unsteady pressure measurements of decelerated swirling flow in a draft tube cone at lower runner speeds, IOP Conf. Series: Earth and Environmental Science, 22, 032008.
Habilitation thesis Sebastian Muntean, PhD
154/161
Bosman C., El-Shaarawi M.A.I. (1977) Quasi-three-dimensional numerical solution of flow in turbomachines. ASME Journal of Fluids Engineering, 99(1), pp. 132-140.
Bovet T. (1961) Contribution to the study of Francis turbine runner design, ASME Paper 61-WA-155. Braembussche R.A. (2006) Flow and Loss Mechanisms in Volutes of Centrifugal Pumps, Design and
analysis of high speed pumps RTO-EN-AVT, Neuilly-sur-Seime, France. pp. 1-26 Carpinteri A., Brighenti R., Huth H.-J., Vantadori S. (2005) Fatigue growth of a surface crack in a welded T-
joint International Journal of Fatigue 27(1) pp. 59–69. Carpinteri A., Ronchei C., Scorza, D.,Vantadori S. (2015) Fracture mechanics based approach to fatigue
analysis of welded joints, Engineering Failure Analysis, 49, pp. 67-78. Casanova F. (2009) Failure analysis of the draft tube connecting bolts of a Francis-type hydroelectric power
plant, Engineering Failure Analysis, 16(7), pp. 2202-2208. Cervantes M. J., Gustavsson H. (2007) On the use of the Squire-Long equation to estimate radial velocities
in swirling flows. ASME Journal of Fluids Engineering, 129(2), pp. 209-217. Ciocan G.D., Iliescu M., Vu T.C., Nennemann B., Avellan F. (2007) Experimental study and numerical
simulation of the FLINDT draft tube rotating vortex, ASME Journal of Fluids Engineering, 129, pp. 146-158.
Ciocan G.D., Iliescu M.S. (2007) Vortex rope investigation by 3D PIV method, Proc. 2nd IAHR International Meeting of the Workgroup on Cavitation and Dynamic Problems in Hydraulic Machinery and Systems, Timişoara, Romania, pp. 159 – 172.
Ciocan T., Muntean S., Susan-Resiga R.F. (2012) Self-induced unsteadiness of the GAMM Francis turbine draft tube at partial discharge, Proc. Int. Conference on Modelling Fluid Flow, Budapest, Hungary, 2, pp. 764-772.
Ciocan T., Susan-Resiga R.F., Muntean S. (2014) Improving draft tube hydrodynamics over a wide operating range, Proc. of the Romanian Academy Series A: Mathematics, Physics, Technical Sciences, Information Sciences, 15(2), pp.182-190.
Ciocan T., Susan-Resiga R., Muntean S. (2016) Modelling and optimization of the velocity profiles at the draft tube inlet of a Francis turbine within an operating range, Journal of Hydraulic Research, 1, pp. 74 - 86.
Cojocar M. (2008) Hidroconstructia: Hydropower constructions, 2nd edition, 1, Bucharest, Romania. Deane J.P., Gallachóir B.P., McKeogh E.J. (2010) Technico-economic review of existing and new pumped
hydro energy storage plant, Renewable and Sustainable Energy Review, 14(4), pp. 1293-1302. Derakhshan S., Mostafavi A. (2011) Optimization of GAMM Francis turbine runner, International Scholarly
and Scientific Research & Innovation, 5(11), pp. 428-434. Doerfler P.L., Sick M., Coutou A. (2013) Flow – Induced Pulsation and Vibation in Hydroelectric
Machinery. Ch. 2 Low-Frequency Phenomena in Swirling Flow, Springer Verlag, London, UK. Doujak E. (2015) Draft tube design and multiple performance of a pump turbine WasserWirtschaft Extra, 1,
pp. 38 – 42. Drăghici I., Muntean S., Bosioc A.I., Anton L.E. (2014) LDV measurements of the velocity field on the
inlet section of a pumped storage equipped with a symmetrical suction elbow for variable discharge values, IOP Conf. Series: Earth and Environmental Science, 22, 032017, pp. 1-9.
Drăghici I.A., Muntean S., Bosioc A.I., Gînga G., Anton L.E. (2016) Unsteady pressure field analysis at pump inlet equipped with a symmetrical suction elbow, Proc. of the Romanian Academy Series A: Mathematics, Physics, Technical Sciences, Information Sciences, 17(3), pp. 237-244.
Habilitation thesis Sebastian Muntean, PhD
155/161
Eisinger R., Ruprecht A. (2001). Automatic shape optimization of hydro turbine components based on CFD, Seminar on CFD for Turbomachinery Applications, Gdansk, Poland. In Task Quaterly 6(1), pp. 101-111.
Fan H. Y. (1998) An inverse design method of diffuser blades by genetic algorithms, Proc. of the Institution of Mechanical Engineers Part A: Journal of Power and Energy, 212(4), pp. 261–267.
Fluent Inc (2006) FLUENT User’s guide V.6.3, Lebanon, NH, USA. Fluent Inc (2006) Gambit User’s guide V.2.4, Lebanon, NH, USA. Frunzăverde D., Muntean S., Mǎrginean G., Câmpian V.C., Marşavina L., (2010) Failure analysis of a
Francis turbine runner, IOP Conf. Series: Earth and Environmental Science, 12(1), 012115 pp. 1-9. Gagnon M., Tahan A., Bocher P., Thibault D. (2012) On the stohastic simulation of hydrolectric turbine
blades transient response, Mechanical System and Signal Processing, 32, pp. 178-187. Gagnon M., Tahan A., Bocher P., Thibault D. (2014) Influence of load spectrum assumptions on the
expected reliability of hydroelectric turbines: A case study, Structural Safety, 50, pp. 1-8. Galván S., Page M., Guibault F., Reggio M. (2005) Numerical validation of different CFD k-ε turbulent
models using FLUENT code, Cervantes M. J., Engström T. F., Gustavsson L. H. (Eds.) Proc. Turbine-99 III IAHR/ERCOFTAC Workshop on the Draft Tube Flow, Porjus, Sweden, 57-66.
Galván S. (2007) Optimization of the inlet velocity profile of the Turbine 99 draft tube. PhD Thesis, École Polytechnique de Montréal, Montréal.
Galván S., Reggio M., Guibault F. (2011) Assessment study of k−ε turbulence models and near-wall modeling for steady state swirling flow analysis in draft tube using Fluent, Engineering Applications of Computational Fluid Mechanics, 5(4), pp. 459–478.
Galván S., Rubio C., Pacheco J., Mendoza C., Toledo M. (2013a) Optimization methodology assessment for the inlet velocity profile of a hydraulic turbine draft tube. Part I: computer optimization techniques. Journal of Global Optimization, 55(1), pp. 53–72.
Galván S., Rubio C., Pacheco J., Gildardo S., Georgina G. (2013b) Optimization methodology assessment for the inlet velocity profile of a hydraulic turbine draft tube. Part II: performance evaluation of draft tube model. Journal of Global Optimization, 55(4), pp. 729–749.
Gînga G., Stuparu A., Bosioc A., Anton L.E., Muntean S. (2011) 3D Numerical simulation of the flow into the suction elbow and impeller of a storage pump, Proc. of the 4th IAHR Int. Meeting of the Workgroup on Cavitation and Dynamic Problems in Hydraulic Machinery and Systems, Belgrade, Serbia. pp. 151-160
Gînga G., Stanciu I.R., Muntean S., Baya A., Anton L.E. (2012) 3D numerical flow analysis and experimental validation into a model impeller of a storage pump, Proc. 15th Int. Conf. on Fluid Flow Technologies, Budapest, Hungary, pp. 804 – 811.
Goede E., Ruprecht A., Lippold F. (2006) On the part load vortex in draft tubes of hydro electric power plants. In E. Krause, Y. Shokin, M. Resch & N. Shokina (Eds.), Notes on Numerical Fluid Mechanics and Multidisciplinary Design: Computational Science and High Performance Computing II, 91, Berlin, Springer. pp. 217-231
Goede E. (2009) Performance upgrading of hydraulic machinery with the help of CFD, Notes on Numerical Fluid Mechanics and Multidisciplinary Design, 100, pp. 299-310.
Gros L., Kueny J.-L., Avellan F., Bellet L. (1998) Numerical flow analysis of the GAMM turbine at nominal and off-design operating conditions, Proc. XIXth IAHR Symposium on Hydraulic Machinery and Cavitation, Singapore, Republic of Singapore, 1, pp. 121-128.
Gubin M.F., Volshanik V.V., Kazennov V.V. (1974). Investigations of curved draft tubes with long exit cones. Hydrotechnical Construction, 8(10), pp. 949-956.
Habilitation thesis Sebastian Muntean, PhD
156/161
Guelich J.F., Bolleter U. (1992) Pressure Pulsations in Centrifugal Pumps, ASME J. Vib. Acoust., 114(2), pp. 272–279.
Guelich J.F. (2014) Centrifugal pumps, Springer Verlag, Berlin, 3rd ed. Haimes R., Kenwright D. (1999) On the Velocity Gradient Tensor and Fluid Feature Extraction, AIAA Paper
No. 99-3288, Norfolk, VA. Haimes R., Kenwright D. (2000) FX Programer’s Guide, MIT, USA. Henry P., (1993) Calcul et trace de l’aubage de la turbine Francis, IMHEF Publishing House, Lausanne,
Switzerland. Hodkiewicz M.R., Norton M.P. (2002) The effect of change in flow rate on the vibration of the double-
suction centrifugal pumps, Proc. of the Institution of Mechanical Engineers Part E: Journal of Process Mechanical Engineering, 216, pp. 47–58.
Huth H.-J. (2005) Fatigue Design of Hydraulic Turbine Runners, PhD thesis, Norwegian University of Science and Technology (NTNU), Trondheim, Norway,
IEC 60193 (1999). Hydraulic Turbines. Storage Pumps and Pump-Turbines—Model Acceptance Tests. International Electrotechnical Commission (2nd ed.) Geneva, Switzerlan.
Javadi A., Bosioc A., Nilsson H., Muntean S., Susan-Resiga R. (2014) Velocity and pressure fluctuations induced by the precessing helical vortex in a conical diffuser IOP Conf. Series: Earth and Environmental Science, 22, 032009, pp. 1-10
Javadi A., Nilsson H. (2015a) LES and DES of strongly swirling turbulent flow through a suddenly expanding circular pipe, Computer & Fluids, 107, pp. 301-313
Javadi A., Nilsson H. (2015b) Time-accurate numerical simulations of swirling flow with rotor-stator interaction, Flow Turbul. Combus, 95(4), pp. 755-774.
Javadi A., Bosioc A., Nilsson H., Muntean S., Susan-Resiga R. (2016) Experimental and numerical investigation of the precessing helical vortex in a conical diffuser with rotor-stator interaction, ASME Journal of Fluids Engineering, 138(8), 081106, pp. 1-13.
Jones T.L., (2011) Handbook of Reliability Prediction Procedures for Mechanical Equipments, Maryland, USA.
Karassik I.J., Messina J.P., Cooper P., Heald C.C. (2000) Pump Handbook, 3rd edition, McGraw-Hill, New York, USA.
Keck, H., Sick, M. (2008) Thirty years of numerical flow simulation in hydraulic turbomachines, Acta Mechanica, 201(1), pp. 211-229.
Kleijnen J.P.C. (2009) Kriging metamodeling in simulation: A review. European Journal of Operational Research, 192(3), pp. 707-716.
Lindgren, M. (2002) Automatic shape optimization of hydropower flows: the draft tube. Master’s Thesis, Luleå University of Technology, Luleå.
Lipej A., Poloni C. (2000) Design of Kaplan runner using multiobjective genetic algorithm optimization, Journal of Hydraulic Research, 38(1), pp. 73-79.
Luna-Ramirez A., Campos-Amezcua A., Dorantes-Gomez O., Mazur-Czerwiec Z., Munoz-Quezada R., (2016) Failure analysis of runner blades in a Francis hydraulic turbine – Case study, Engineering Failure Analysis, 59, pp. 314-325.
Lyutov A.E., Chirkov D.V., Skorospelov V.A., Turuk P.A., Cherny S.G. (2015) Coupled Multipont Shape Optimization of Runner and Draft Tube of Hydraulic Turbines, ASME Journal of Fluids Engineering, 137(11), 111302, pp. 1-11.
Habilitation thesis Sebastian Muntean, PhD
157/161
Marjavaara D., Lundström T. (2005) Redesign of a sharp heel draft tube by a validated CFD-optimization. International Journal for Numerical Methods in Fluids, 50(8), pp. 911–924.
Matthias H.-B., Schramek W., Strscheletzly M., (1968) Centrifugal Pump Inlet Elbow, US Patent No. 3411451
Mauri S., Kueny J.-L., Avellan F. (2004) Werlé–Legendre separation in a hydraulic machine draft tube, ASME Journal of Fluids Engineering, 126(6), pp. 976-980.
Menter, F. R. (1994). Two-equation eddy-viscosity turbulence models for engineering applications. AIAA Journal, 32(8), pp. 1598-1605.
Moisă I.G., Susan-Resiga R., Muntean S. (2013) Pump inducer optimization based on cavitation criterion, Proc. of the Romanian Academy Series A: Mathematics, Physics, Technical Sciences, Information Sciences, 14(4), pp. 317-325.
Muntean S., Susan-Resiga R.F., Anton I. (2004) Mixing interface algorithm for 3D turbulent flow analysis of the GAMM Francis turbine, Vad J., Lajos T., Schilling R. (Eds.) Modelling Fluid Flow, Springer. pp. 359-372.
Muntean S., Ruprecht A., Susan-Resiga R. F. (2005a). A numerical investigation of the 3D swirling flow in a pipe with constant diameter Part 1: Inviscid computation, Proc. 1st Workshop on Vortex Dominated Flows. Achievements and Open Problems, Timişoara, Romania. pp. 77-86.
Muntean S., Buntic I., Ruprecht A., Susan-Resiga R. F. (2005b). A numerical investigation of the 3D swirling flow in a pipe with constant diameter Part 2: Turbulent computation, Proc. 1st Workshop on Vortex Dominated Flows. Achievements and Open Problems, Timişoara, Romania. pp. 87-96.
Muntean S., (2008) Numerical flow analysis in hydraulic Francis turbines, Orizonturi Universitare Publishing House, Timisoara, Romania. (in Romanian)
Muntean S., Nilsson H., Susan-Resiga R. (2009) 3D numerical analysis of the unsteady turbulent swirling flow in a conical diffuser using Fluent and OpenFoam, Proc. 3rd IAHR Int. Meeting of the Workgroup on Cavitation and Dynamic Problems in Hydraulic Machinery and Systems, Brno, Czech Republic. pp. 155-165.
Muntean S., Ninaci I., Susan-Resiga R., Baya A., Anton I. (2010) Numerical analysis of the flow in the old Francis runner in order to define the refurbishment strategy, UPB Scientific Bulletin, Series D: Mechanical Engineering, 72(1) pp. 117-124
Muntean S., Bosioc I.A., Stanciu R., Tanasa C., Resiga R. (2011) 3D numerical analysis of a swirling ow generator, Proc. 4th International Meeting on Cavitation and Dynamic Problems in Hydraulic Machinery and Systems, Belgrade, Serbia. pp. 115-125
Muntean S., Ciocan T., Susan-Resiga R., Cervantes M., Nilsson H. (2012) Mathematical, numerical, experimental analysis of the swirling flow at a Kaplan runner outlet, IoP Conference Series: Earth and Environmental Science, 15, 032001, pp. 1-10.
Muntean S., Susan-Resiga R., Câmpian V.C., Dumbravă C., Cuzmoş A. (2014) In situ unsteady pressure measurements on the draft tube cone of the Francis turbine with air injection over an extended operating range, UPB Scientific Bulletin, Series D: Mechanical Engineering, 6(3), pp. 173-180.
Muntean S., Drăghici I., Gînga G., Anton L.E., Baya A. (2015) Hydrodynamic design of a storage pump impeller using inverse method and experimental investigation of the global performances, WasserWirtschaft Extra, 1, pp. 28 – 32.
Muntean S., Škerlavaj A., Drăghici I., Anton L.E. (2015) Numerical analysis of the flow non-uniformity generated by symetrical suction elbows of the large storage pumps, Proc. 6th IAHR Int. Meeting of the
Habilitation thesis Sebastian Muntean, PhD
158/161
Workgroup on Cavitation and Dynamic Problems in Hydraulic Machinery and Systems, Ljubljana, Slovenia. pp. 1-8.
Muntean S., Tănasă C., Resiga R., Bosioc A. (2015) Influence of the adverse pressure gradient on the swirling flow, Proc. of the Conference Modelling Fluid Flow (CMFF’15), Budapest, Hungary. pp. 1 – 8.
Muntean S., Bosioc A.I., Drăghici I., Anton L.E. (2016) Hydrodynamic analysis of the flow field induced by a symmetrical suction elbow at the pump inlet, IOP Conference Series - Earth and Environmental Science, 49(3), 032014.
Muntean S., Susan-Resiga R., Goede E., Baya A., Terzi R., Tîrşi C. (2016) Scenarios for refurbishment of a hydropower plant equipped with Francis turbines, Renewable Energy and Environmental Sustainability, 1, 30, pp. 1- 6.
Năstase E.A. (2010) Olt river gorge between Turnu Roşu and Cozia – climatic study, PhD Thesis, Oradea University. (in Romanian)
Negru R., Muntean S., Pasca N., Marsavina L. (2014) Failure assessment of the shaft of a pumped storage unit., Fatigue & Fractigue Engineering Materials and Systems, 37, pp. 807-820.
Nelder J.A., Mead R. (1965). A simplex method function minimization. Computer J., 7(4), pp. 308-313. Nelson W.E., Dufour J.W., (1992) Pump Vibrations, Proc. of the 9th International Pump Users Symposium,
Texas A&M University, Houston, Texas, USA. pp. 137–147. Nishi M., Matsunaga S., Okamoto M., Uno M., Nishitani K. (1988) Measurement of three-dimensional
periodic flow on a conical draft tube at surging condition. in Rohatgi U.S. et al., (eds.) Flows in Non-Rotating Turbomachinery Components FED 69. pp. 81-88.
Nishi M., Kubota T., Matsunaga S., Senoo Y. (1984) Surging characteristics of conical and elbow-type draft tubes, Proc. 12th IAHR Symp. Section on Hydraulic Machinery, Equipment and Cavitation, Stirling, UK. pp 272–283.
Nishi M., Liu S.-H. (2013) An Outlook on the Draft-Tube-Surge Study, International Journal of Fluid Machinery and Systems, 6, pp. 33-48.
Oyama A., Liou M., Obayashi S. (2002) Transonic axial-flow blade shape optimization using evolutionary algorithm and three-dimensional Navier-Stokes solver, Proc. 9th AIAA/ISSMO Symposium on Multidisciplinary Analysis and Optimization, Atlanta, Georgia, AIAA 2002-5642.
Papillon B., Kirejczyk J., Sabourin M. (2000) Atmospheric air admission in hydro turbines, HydroVision, Charlotte, North Carolina, USA. paper no. 3C
Papillon B., Gagne J.-L., Giroux S., Sabourin M. (2002) Turbine rehabilitation: Chute-des-Passes case study, HydroVision, Portland, Oregon.
Pasca N., Marsavita L., Negru R., Muntean S. (2013) Estimation of the Stress Intensity Factor for 3D Cracked T – Joint. In: Jármai K., Farkas J. (eds) Design, Fabrication and Economy of Metal Structures, pp. 273-280.
Pejovic S. (2011) White paper on Hydro Energy Storage, Technical Report, Toronto, Canada. Peng G., Cao S., Ishizuca M., Hayama S. (2002) Design optimization of axial flow hydraulic turbine runner:
Part II - multi - objective constrained optimization method. International Journal for Numerical Methods in Fluids, 39(6), pp. 533–548.
Petit O., Nilsson H., Muntean S., Susan-Resiga R., (2011) Unsteady simulations of the flow in a swirl generator using OpenFOAM, International Journal of Fluid Machinery and Systems, 4, pp. 199–208.
Press W.H., Teukolsky S.A., Vetterling W.T., Flannery B.P. (1996) Numerical Recipes in FORTRAN77: The Art of Scientific Computing. (2nd. ed.), New York: Cambridge University Press.

Habilitation thesis Sebastian Muntean, PhD
159/161
R.H. Thicke, (1981) Practical Solutions for Draft Tube Instability, Water Power & Dam Construction, 33, pp. 31-37.
Radha Krishna H.C. (ed.), (1997) Hydraulic Design of Hydraulic Machinery, Avebury Publishing House. Resiga R., Bernad S., Muntean S., Anton I. (2003) Analysis and Development of Cavitating Flow Models
and FLUENT Implementation, I. Anton et al. (eds.) Proc. of the Workshop on Numerical Methos in Fluid Mechanics and FLUENT Applications, May 22-23, 2003, Timişoara, Romania.
Resiga R., Muntean S., Bosioc A.I., Stuparu A., Milos T., Baya A. (2007) Swirling flow appratus and test rig for flow control in hydraulic turbines discharge cone, Proc. 2nd IAHR International Meeting of the Workgroup on Cavitation and Dynamic Problems in Hydraulic Machinery and Systems, Timisoara, Romania.
Rheingans W.J. (1940) Power swings in hydroelectric power plants, Trans ASME, 62, pp. 171-184. Sadlo F., Peikert R., Sick M., (2006) Visulatisation Tools for Vorticity Transport Analysis in Incompressible
Flow, IEEE Trans on Visualization and Computer Graphics, 12(5), pp. 949-956 Sallaberger M., Michaud Ch., Born H., Winkler St. and Peron M. (2001) Design and Manufacturing of
Francis Runners for Rehabilitation Projects, Hydro 2001, Riva del Garda Sato T., Nagahara T., Tanaka K., Fuchiwaki M., Shimizu F., Inoue A. (2011) Vortex cavitation from baffle
plateand pump vabration in a double-suction volute pump, International Journal of Fluid Machinery and Systems, 4(1), pp. 76 – 83.
Schiavello B. (1993) Cavitation and recirculation troubleshooting methodology, Proc. 10th International Pump Users Symposium, Huston, USA. pp. 133–156.
Singh P., Nestmann F. (2010) Exit blade geometry and part-load performance of small axial flow propeller turbines: An experimental investigation. Experimental Thermal and and Fluid Science, 34(6), 798-811.
Singh P., Nestmann F. (2011) Experimental investigation of the influence of blade height and blade number on the performance of low head axial flow turbines, Renewable Energy, 36(1), pp. 272-281.
Škerlavaj A., Titzschkau M., Pavlin R., Vehar F., Mežnar P., Lipej A. (2012) Cavitation improvement of double suction centrifugal pump HPP Fuhren, IOP Conf. Series: Earth and Environ. Sci., 15, 022009, pp. 1 – 8.
Sotnikov A.A. (2001) Water Turbines at Bratsk HES: Design, Use and Upgrading, Hydrotechnical Construction, 35(10), pp. 507-511.
Sottas G., Ryhming I.L. (eds.) (1993) 3D - computation of incompressible internal flows, Proceedings of the GAMM Workshop, Notes Numerical Fluid Mechanics (NNFM) 39, Vieweg Verlag, Braunschweig.
Stanciu I.R., Gînga Gh., Muntean S., Anton L.E. (2012) Low-speed-small-load direct torque control ripples filtering, Proc. of the Romanian Academy Series A: Mathematics, Physics, Technical Sciences, Information Sciences, 13(2), pp. 125-132.
Stanciu I.R., Turcin I., Muntean S., Anton L.E. (2013) Cellular wind-power integration using remotely controlled pump hydro energy storage, Proc. of the Romanian Academy Series A: Mathematics, Physics, Technical Sciences, Information Sciences, 14(3), pp. 242-249.
Steffen B. (2012) Prospects for pumped-hydro storage in Germany, Energy Policy, 45, pp. 420-429. Stepanoff A.J. (1957) Centrifugal and Axial Flow Pumps. Theory, Design and Application, 2nd ed., New
York, John Wiley & Sons Stuparu A., Susan-Resiga R. (2015) The origin of the plunging pressure fluctuations for a swirling flow with
precessing vortex rope in a straight diffuser, Proc. 6th IAHR Int. Meeting of the Workgroup on Cavitation and Dynamic Problems in Hydraulic Machinery and Systems Ljubljana, Slovenia. pp. 1-8

Habilitation thesis Sebastian Muntean, PhD
160/161
Susan-Resiga D., Vekas L. (2016) Ferrofluid-based magnetorheological fluids: tuning the properties by varying the composition at two hierarchical levels, Rheologica Acta, 55(7), pp: 581-595.
Susan-Resiga R., Ciocan G.D., Anton I., Avellan F. (2006) Analysis of the swirling flow downstream a Francis turbine runner, ASME Journal of Fluids Engineering, 128(1), pp. 177-189.
Susan-Resiga R., Muntean S., Baya A., Anton L.E., Milos T., Stuparu A. (2007) Chapter 3. Mathematical and Numerical Analysis of Axisymmetric Swirling Flow, Susan-Resiga R., Bernad S., Muntean S. (Eds) Vortex Hydrodynamics and Applications, Eurostampa Publishing House, Timisoara, Romania.
Susan-Resiga R., Muntean S., Bosioc A. (2008) Blade design for swirling flow generator, Proc. 4th German-Romanian Workshop on Turbomachinery Hydrodynamics, Stuttgart, Germany. pp. 1–16.
Susan-Resiga R., Muntean S. (2009) Decelerated Swirling Flow Control in the Discharge Cone of Francis Turbines. In: Xu J., Wu Y., Zhang Y., Zhang J. (eds) Fluid Machinery and Fluid Mechanics, Springer. pp. 89-96.
Susan-Resiga R., Muntean S., Stein P., Avellan, F. (2009) Axisymmetric swirling flow simulation of the draft tube vortex in Francis turbines at partial discharge, International Journal of Fluid Machinery and Systems, 2(4), pp. 295–302.
Susan-Resiga R., Muntean S., Hasmatuchi V., Anton I., Avellan F. (2010) Analysis and prevention of vortex breakdown in the simplified discharge cone of a Francis turbine, ASME Journal of Fluids Engineering, 132(5), 051102, pp. 1-15.
Susan-Resiga R.F., Muntean S., Avellan F., Anton I. (2011) Mathematical modelling of swirling flow in hydraulic turbines for the full operating range, Applied Mathematical Modelling, 35 pp. 4759-4773.
Susan-Resiga R.F., Muntean S., Ciocan T., Joubarne E., Leroy P., Bornard L. (2012) Influence of the velocity field at the inlet of a Francis turbine draft tube on performance over an operating range, IOP Conf. Series: Earth and Environmental Science, 15, 032008.
Susan-Resiga R.F., Muntean S., Ciocan T., de Colombel T., Leroy P. (2014) Surrogate runner model for draft tube lossescomputation within a wide range of operating points, IOP Conf. Series: Earth and Environmental Science, 22, 012022 pp. 1-11.
Susan-Resiga R. F., Tanasa C., Bosioc A. I., Ciocan T., Stuparu A., Muntean S. (2014) Method and equipment for swirling flow control from conical diffuser of hydraulic turbines, Patent Application no. A/00621.
Susan-Resiga R., Ighişan C., Muntean S. (2015) A Mathematical Model for the Swirling Flow Ingested by the Draft Tube of Francis Turbines, WasserWirtshchaft Extra, 1, pp. 23-27.
Susan-Resiga R., Muntean S., Stuparu A., Bosioc A.I., Tănasă C., Ighişan C. (2016) A variational model for swirling flow states with stagnant region, European Journal of Mechanics B-Fluids, 55(1), pp. 104-115.
Stein P., Sick M., Doerfler P., White P., Braune A. (2006) Numerical Simulation of the Cavitating Draft Tube Vortex in a Francis Turbine, Proc. of the 23rd IAHR Symposium on Hydraulic Machinery and Systems, Yokohama, Japan, paper F228.
Swiderski J., Martin J. (1999) High Power Francis runner – upgrade with a new design runner, Norcan Hydraulic Turbine Inc. report.
Tănasă C., Susan-Resiga R., Muntean S., Bosioc A. (2013) Flow-feedback method for mitigating the vortex rope in decelerated swirling flows, ASME Journal of Fluids Engineering, 135(6), 061304, pp. 1-12.
Tănasă C., Muntean S., Bosioc A., Susan-Resiga R., Ciocan T. (2016) Influence of the air admission on the unsteady pressure field in a decelerated swirling flow, UPB Scientific Bulletin, Series D: Mechanical Engineering, 78(3), pp. 161 – 170.
Habilitation thesis Sebastian Muntean, PhD
161/161
Tridon S., Barre S., Ciocan G.D., Tomas L. (2010) Experimental analysis of the swirling flow in a Francis turbine draft tube: Focus on radial velocity component determination. European Journal of Mechanics - B/Fluids, 29(4), pp. 321-335.
Tridon S., Barres S., Ciocan G.D., Segoufin C., Leroy P. (2012) Discharge imbalance mitigation in Francis turbine draft-tube bays, ASME Journal of Fluids Engineering, 134(4), 041102, pp. 1-8.
Trivedi C., Gandhi B., Cervantes M.J. (2013) Effect of transients on Francis turbine runner life: a review, Journal of Hydraulic Research, 51(2), pp. 121-132.
Van Esch B.P.M. (2009) Performance and Radial Loading of a Mixed-Flow Pump under Non-Uniform Suction Flow, ASME Journal of Fluids Engineering, 131(5), 051101, pp. 1-7.
Visual Numerics (1994). IMSL MATH/LIBRARY: FORTRAN Subroutines for Mathematical Applications, Houston, TX.
Vu T.C., Retieb S. (2002) Accuracy assessment of current CFD tools to predict hydraulic turbine efficiency hill chart, Proc. XXIst IAHR Symposium on Hydraulic Machinery and Systems, Lausanne, Switzerland, 1, pp. 193–198.
Wilcox D.C. (1988) Reassessment of the scale-determining equation for advanced turbulence models. AIAA Journal, 26(11), pp.1299-1310.
Wu C.-H., (1952) A general theory of three-dimensional flow in subsonic and supersonic turbomachines of axial-, radial-, and mixed-flow types. NACA Technical Note, 2604.
Wu J., Shimmei K., Tani K., Niikura K., Sato J. (2007) CFD-based design optimization for hydro turbines. ASME Journal of Fluids Engineering, 129(2), pp. 159-168.
Wu Y.-L., Li S., Liu S.-H., Dou H.-S., Qian Z.-D. (2013) Vibration of Hydraulic Machinery. Ch. 6 Vibration Induced by Hydraulic Excitation, Dordrecht, Springer Verlag.
Yamamoto K., Mueller A., Favrel A., Landry C., Avellan F. (2015) Guide vanes embedded visualization technique for investigating Francis runner inter-blade vortices at deep part load operation, Proc. 6th IAHR International Meeting of the Workgroup on Cavitation and Dynamic Problems in Hydraulic Machinery and Systems, Ljubljana, Slovenia.
Yamamoto K., Mueller A., Favrel A., Landry C., Avellan F., (2016) Numerical and experimental evidence of the inter-blade cavitation vortex development at deep part load operation of a Francis turbine, Proc. 28th IAHR symposium on Hydraulic Machinery and Systems (IAHR2016), IOP Conf. Series: Earth and Environmental Science, 49, 082005.
Yiu K.F.C., Zangeneh M. (2000) Three-dimensional automatic optimization method for turbomachinery blade design, Jorunal Propulsion and Power, 16(6), pp. 1174-1181.
Zangeneh M. (1991) A compressible three-dimensional design method for radial and mixed flow turbomachinery blades. International Journal for Numerical Methods in Fluids, 13(5), pp. 599-624.
Zangeneh M., Goto A., Harada H. (1999) On the role of three-dimensional inverse design methods in turbomachinery shape optimization. Proceedings of the Institution of Mechanical Engineers Part C: Journal of Mechanical Engineering Science, 213(1), pp. 27–42.