Embed Size (px)
Citation preview

Report Submitted to:
Professor Dominic Golding
Professor John Zeugner
Puerto Rico, Project Center
By
__________________________ __________________________
Elizabeth Carey Rafael Jaimes
__________________________ __________________________
Francis Song Meghan Woods
In Cooperation With
Rafael Lama, Technical Assistant to the President
Puerto Rico Water and Sewer Authority
EXPANSION OF THE WATER DISTRIBUTION SYSTEM IN THE RIO PRIETO REGION
April 28, 2008
This project report is submitted in partial fulfillment of the degree requirements of Worcester
Polytechnic Institute. The views and opinions expressed herein are those of the authors and do
not necessarily reflect the positions or opinions of PRASA or Worcester Polytechnic Institute.
This report is the product of an education program, and is intended to serve as partial
documentation for the evaluation of academic achievement. The report should not be construed
as a working document by the reader.
i
Abstract
Sponsored by the Puerto Rico Aqueduct and Sewer Authority, this project provides a
hydraulic model for the expansion and optimization of water to the Rio Prieto region in the
southwest of Puerto Rico. The technical and social-economic-political aspects of the expansion
were examined through interviews, site visits, mapping and digitizing infrastructure, and
determining population demand. Upon analysis of the hydraulic model, population predictions,
and supply and demand data, the project team provided recommendations in order to aid in the
expansion of the water distribution network.
ii
Acknowledgements
We would like to acknowledge our PRASA liaison and CSA Group liaison for their
support throughout the project:
Rafael Lama, Technical Assistant to the President, PRASA
Mauricio Olaya, Ph. D., Project Manager, CSA Group
We would also like to acknowledge and thank our project advisors for their guidance and
support for this project:
Professor Dominic Golding
Professor John F. Zeugner
It is also our pleasure to thank the following people who helped us by sharing their time
and information:
Carlos J. Vizcarrondo Acosta Director de Servicios al cliente, PRASA
Juan Pérez Bofill, PE Director Auxiliar, Cumplimiento y Control de Calidad,
PRASA
Osvaldo Collado Distribution System Operator, Yauco, PRASA
Ana A. Cruz Environmental Engineer, CSA Group
Esteban Fuentes Special Assistant to the President, PRASA
Andres Garcia Vice President Administration, PRASA
Mercedes Guzman Especialista Ambiental Directorado Cumplimiento- Región
Metro, PRASA
Irma Lopez Director of Potable Water Compliance, PRASA
Ing. Hugo Delgado Machado Director Auxiliar IV,Area de Yauco, PRASA
Elena Vázquez Moyet GIS Department, CSA Group
Ronald Perez Technical Regional Manager, Yauco Area, PRASA
Adamaris Quinones Planning Director
Ariel Rosa Compliance Official, Aqueduct Department, Compliance and
Quality Control Directorate, PRASA
José Sanchez Distribution System Operator, Yauco, PRASA
Felix Semidei Engineer-in-training, PRASA
Carlos Solis Operations Director, PRASA South Region
iii
Executive Summary
Sponsored by the Puerto Rico Aqueduct and Sewer Authority (PRASA), this project
sought to examine and optimize the planned expansion of the water distribution infrastructure in
the Rio Prieto region. The region is located in southwest Puerto Rico in the northern part of the
Yauco municipality. Currently a main supply line provides permanent water from the PRASA
distribution network to part of the region, but a substantial population in the region resides out of
the reach of the main line. PRASA provides some of the population with water through periodic
tanker truck deliveries of water, but others obtain their water through jury-rigged pipe networks
from local streams, rivers, and other sources. The goal of the project was to design an optimized
model that will aid in the expansion of the PRASA water distribution network in order to provide
permanent flowing water to as many people as possible in the Rio Prieto region.
PRASA is the major agency responsible for delivering potable water to the whole island
of Puerto Rico, with a customer base consisting of 98% of the island’s population. The Rio
Prieto region is a remote mountainous region with a population of approximately 4430. About
898 of these residents will be connected to the expanded distribution system. The majority of the
population in the region lives off of various crops catered to the dry climate of the region such as
coffee. Rio Prieto is among the regions of greatest poverty levels throughout the entire island.
The technical aspects of the expansion were examined primarily through a hydraulic
model. The project team used the hydraulic modeling software, EPANET, to model the existing
supply lines and examine the ramifications of expanding the supply network. First, the current
main line was digitized and operational parameters of the current network components were
entered in the model. Hypothetical extensions to the network were built into the model,
including two additional storage tanks and two pump stations. The pipeline extensions were
assumed to follow the existing road network and elevation data were taken from Google Earth.
Demand was calculated for each expansion zone based on ward population data taken from the
2000 US Census. The tables constructed included both current and projected demands. Mass
balance was also calculated using the tables, by taking into consideration the single supply of
water to the region, the Rio Prieto Reservoir and Water Treatment Plant. The calculations show
that the expanded system requires a supply much greater than the current output. The plant was
originally designed to operate at a capacity of 0.25 million gallons per day (MGD), however
currently the average production of the plant is well beyond its capacity at 0.41 MGD. In order to
iv
accommodate the new expansions and projected population growth, PRASA is planning to
expand the plant to produce approximately 1.5 MGD. Not only is the plant operating at a much
higher capacity than intended, but because of the overburden of the system, the plant operates
only 80% of the time. This means that water supply in the existing system is frequently
interrupted. Analysis of the daily average water production data indicate that the filtration plant
operates inconsistently and intermittently in the production of filtered, potable water for the
region. The expanded system model in EPANET was balanced and analyzed for optimization
using the new production value of 1.5 MGD, resulting in a working configuration proposal of the
entire water distribution network for the Rio Prieto region.
In order to have a properly functioning system, the pressure throughout the network must
be maintained. Pressure is sustained throughout the system through pressure management tanks
and pressure reducing valves. Pressure can be controlled from a tank by adjusting the minimum
level limit for water in the tank. When the minimum level of water in the tank is reached, the
valve opens and allows the tank to be filled. The effect on the system is caused by the pressure
that the water in the tank exerts on the water in the pipes downward of the tank. The minimum
level settings were optimized for all of the pressure management tanks throughout the system as
part of the final configuration proposal. Pump station performance can also have an effect on the
system. For the optimization of the system, the optimal pump station power output was also
found.
The proposed expanded infrastructure and operational parameters provide an efficient
and accurate representation of what can be implemented in the Rio Prieto region to provide the
residents with permanent and efficient potable water. Before the system is constructed, accuracy
improvements to the model should be made. PRASA should consider precise GPS measurements
at site in order to model more accurately the elevation change throughout the system. Currently
some of the expanded pipelines are installed, but their exact locations are not known. During the
expansion project, if PRASA finds already installed pipes then the model will have to be
adjusted.
Expanding water supplies into regions not previously served is a complex social and
political process faced by PRASA and other water suppliers throughout the world. Through
interviews with officials of PRASA, EPA, and CSA Group, and an analysis of the 2000 National
Census Data, the team gathered information to determine the impact of the expansion on the Rio
v
Prieto population. Analysis of similar connection projects revealed the different areas PRASA
needs to focus on throughout the duration of the project as well as after its completion. Based on
these sources, a conclusive set of recommendations was proposed to PRASA in order to bring
the Rio Prieto system online as efficiently and smoothly as possible.
Finally, the conversion of non-PRASA to PRASA systems has been shown in the past to
be a difficult process with resistance of conversion from the public. The social analysis should
aid PRASA in converting the system to their control as smoothly as possible. In order to
minimize any adverse impact on the society from the transition, the report advocates that
PRASA develop the following tools to aid in the process: 1) a payment grace period so that
skeptical villagers can begin to accept a new process of getting their water; 2) a proactive public
education system aimed directly at converting villagers to the new process; 3) with each water
bill, a survey of the local inhabitants so as to gauge, on a continuous basis, their acceptance of
the new system. Through these methodologies, the conversion of the non-PRASA to PRASA
system should run as smoothly as possible.
vi
Authorship Page
This report was a unified effort from contributors Elizabeth Carey, Rafael Jaimes, Francis
Song, and Meghan Woods. The tasks completed for this study were divided as follows:
Hydraulic Model- Rafael Jaimes
Supply and Demand with Zone Configuration- Elizabeth Carey and Meghan Woods
Societal Analysis- Francis Song
vii
Table of Contents Abstract ............................................................................................................................................ i
Acknowledgements ......................................................................................................................... ii
Executive Summary ....................................................................................................................... iii
Authorship Page ............................................................................................................................. vi
List of Tables ................................................................................................................................. ix
List of Figures ................................................................................................................................ ix
1. Introduction ............................................................................................................................. 1
2. Background ............................................................................................................................. 3
2.1 PRASA’s Role.................................................................................................................. 3
2.2 PRASA: Internal Operations ............................................................................................ 5
2.3 Puerto Rico Regions of Interest ....................................................................................... 7
2.4 Essential Components of a Water Distribution System ................................................. 13
2.5 Standards & Laws .......................................................................................................... 15
2.6 Case Studies from Other Water Distribution Systems ................................................... 16
2.7 Socio-Economic Impact of Water Usage ....................................................................... 18
2.8 Problems Arising of Newly Installed Water Distribution Systems ............................... 20
2.9 Non-PRASA Systems .................................................................................................... 21
2.9.1 Villa Verde, Guyama ............................................................................................ 21
2.9.2 Rosario Penon, San German ................................................................................. 22
2.9.3 La Sapia, Orocovis ............................................................................................... 22
2.9.4 La Espancita and Saltos Caguana, Utuado ........................................................... 22
2.9.5 Rancho Grande/Maizales, Naguabo ..................................................................... 22
3. Methodology and Preliminary Illustrative Results ............................................................... 23
3.1 Understanding the Rio Prieto Region Water Supply ..................................................... 23
3.2 Establishing Tables of Information ................................................................................ 26
3.3 Hydraulic Modeling ....................................................................................................... 27
3.3.1 Quantifying the current system ............................................................................ 27
3.3.2 Expanding the System .......................................................................................... 38
viii
3.4 Determining the Nature of Public Need ......................................................................... 40
4. Results and Analysis ............................................................................................................. 41
4.1 Expansion Zones ............................................................................................................ 41
4.2 Demand Calculations ..................................................................................................... 42
4.3 Supply Calculations........................................................................................................ 44
4.4 Rio Prieto Filtration Plant Production ............................................................................ 47
4.5 Hydraulic Modeling ....................................................................................................... 49
4.6 Social, Economic, Cultural, and Political Concerns ...................................................... 51
5. Conclusions and Recommendations ..................................................................................... 52
References ..................................................................................................................................... 59
Appendix A: Sponsor Information................................................................................................ 62
Appendix B: Interview Questionnaires ......................................................................................... 68
Appendix C: Sample Mini-Survey................................................................................................ 70
Appendix D: 2000 National Census Data on Affected Barrios of Yauco .................................... 72
ix
List of Tables
Table 1: Financial Summary of PRASA. ...................................................................................... 5
Table 2: Tank data taken from internal CSA Group map. .......................................................... 33
Table 3: Converted and calculated tank data for entry to EPANET. .......................................... 34
Table 4: Pipe characteristics throughout the Rio Prieto water distribution network. ................. 37
Table 5: Demand Calculations for Service Areas ....................................................................... 43
Table 6: Supply of existing system ............................................................................................. 46
Table 7: Initial tank and pump parameters. ................................................................................ 52
Table 8: Final configuration proposals. ...................................................................................... 54
List of Figures
Figure 1: Map of aquifer locations in Puerto Rico ....................................................................... 8
Figure 2: Map depicting the five regions of PRASA .................................................................... 9
Figure 3: Comparison of households above and below the poverty line .................................... 10
Figure 4: Highest Level of Education Attained .......................................................................... 11
Figure 5: Comparison of Household Income .............................................................................. 12
Figure 6: Area of focus for project ............................................................................................. 13
Figure 7: Shillong water distribution model zone 3.................................................................... 18
Figure 8: Map of Puerto Rico municipalities with project areas shaded .................................... 21
Figure 9: Rio Prieto Region depicting existing system and expansion zones. ........................... 25
Figure 10: Currently installed and functioning infrastructure for Rio Prieto Region. .................. 28
Figure 11: Currently installed and functioning infrastructure for Yauco. .................................... 29
Figure 12: New digitized version of water distribution system. ................................................... 31
Figure 13: Existing pipe distribution network. ............................................................................. 32
Figure 14: Example tank data entry box. ...................................................................................... 35
Figure 15: Automated bulb controlled valve on a tank. ................................................................ 35
Figure 16: Google Earth® screenshot of system components. ..................................................... 39
Figure 17: Expansion Zones and Existing System ....................................................................... 41
Figure 18: The percentage of demand each zone would put on the existing system .................... 44
Figure 20: Average production of Rio Prieto Water Filtration Plant for 2007 ............................. 49

x
Figure 19: Water production by month for Rio Prieto Water Filtration Plant .............................. 48
Figure 21: Final proposed model for Rio Prieto Region's Water Distribution Network .............. 50
Figure 22: Final expanded pipe network proposal. ....................................................................... 50
Figure 23: Simplified elevation throughout the region. ................................................................ 55
Figure 24: Pressure throughout final proposed system ................................................................. 56
1
1. Introduction
It is a fact that water is necessary for life. Dependable, reliable, efficient water service is
extremely important for a high standard of living for any community. When a community faces
frequent interruptions in service or no service at all, it can have a substantial negative effect on
the quality of life. The Puerto Rico water distribution has evolved over the years in an ad hoc
manner under the control of numerous water providers. Parts of Puerto Rico, in particular rural
areas, suffer from interruptions in supply and variable water quality. Puerto Rico’s primary water
distributor, the Autoridad de Acueductos y Alcantarillados (AAA) also know as Puerto Rico
Water and Sewer Authority (PRASA), serves 98% of the island’s population, totaling about 3.8
million people (Autoridad de Acueductos y Alcantarillados de Puerto Rico, 2008) and
consuming approximately 750 million gallons of water a day (McPhaul, 2004). The remaining
2% of the population is served by non-PRASA systems operated independently of PRASA’s
control.
PRASA is currently in the process of eliminating all non-PRASA water distribution
systems. The non-PRASA systems can mainly be found in more remote rural areas across the
island. Through the guidance of the Environmental Protection Agency (EPA), PRASA has been
directed to complete the conversion of systems in order to give everyone on the island the
opportunity to receive water that meets drinking water quality standards. In order to complete
the task, PRASA is looking into expanding systems, renovating systems, and building new
systems. There are currently 12 projects in progress that involve updating small community
systems in order to improve the island wide water distribution network. The project team
undertook a focus on one of the smaller systems, located in the Rio Prieto region.
The main focus of the project in collaboration with PRASA and the CSA Group was to
analyze the system currently in place in the Rio Prieto region in southwest Puerto Rico and
determine what actions must be taken in order to expand the water distribution network to those
who are not presently connected to the main PRASA pipeline. Calculations and analysis of the
current and future demand and supply were made to determine if the system was capable of
serving the expanded areas or if there would be a need to upgrade the facilities. With the
information obtained, a hydraulic model was created to be used to run scenarios to determine the
efficiency of the system. The project team also looked at the positive and negative effects of the
2
expansion on the surrounding community. Using census and other data on the Rio Prieto region,
the project team explored some of the potential societal impacts, including water pricing,
economic status and stability, and other problems that may occur when connecting the region to
the system. The goal of this project was to create an accurate hydraulic model that can be used
and to run various scenarios and optimize the operation of the system in the future.
3
2. Background
The process of delivering water from natural sources to a household is an extensive and
complicated process. In the early 1900s not much was known about clean water. Sewage was
dumped in the rivers resulting in a number of waterborne diseases including cholera, typhoid
fever, and dysentery within their clean water source. The diseases killed approximately 25 of
every 100,000 people in the United States. During that time, the United States was a growing
country, but without clean water, life would not be sustainable. The first municipality to institute
chlorination was Jersey City, New Jersey in 1908. Soon after, cities were taking note and
following their efforts. The United States’ Public Health Service created the first regulations of
drinking water in 1914 (Gale, 2006). By the end of World War II waterborne diseases were
virtually nonexistent. California was in dire need of an established water purification system in
the early 1900s. In 1902 Los Angeles, CA formed an official water department and made huge
efforts into the renovation and expansion of their current system. These efforts were not keeping
up with the demand, so further measures were taken, including the Hoover Dam project and the
Colorado River Aqueduct. With large projects all over the United States, water distribution
systems were continuously developing as they still are today (National Academy of Engineering,
2008).
The collection, purification, and distribution of clean water to the Commonwealth of
Puerto Rico each follow an important system of procedures necessary to sustain life and maintain
socio-economic stability. Through the research of various journals and an interview with
officials of the Worcester Department of Public Works, the team has compiled a list of necessary
items and issues that pertain to the project. They cover topics such as PRASA’s position and
unique role in water supply to Puerto Rico, the essential components of a water distribution
network, standards that must be maintained, problems with water distribution networks, and the
social and economic implications of the quality of water service to its consumers.
2.1 PRASA’s Role
PRASA maintains, services, and distributes 98% of freshwater throughout the island
totaling a surface area of around 3,500 square miles. Its network includes: 129 water treatment
plants which produce 541 millions of gallons per day (MGD), 61 wastewater treatment plants
4
which receive and treat 307 MGD of sewage, 7,700 miles of drinking water pipes, 3,900 miles of
sewer pipe lines, and 1,677 pump stations throughout the main island and islands of Vieques and
Culebra. (Autoridad de Acueductos y Alcantarillados de Puerto Rico, 2008)
PRASA’s mission is to plan, build, and maintain a high quality, reliable, and efficient
water supply and sewage system for Puerto Rico and thereby promote ―healthy quality of life
and a strong economy‖ (Autoridad de Acueductos y Alcantarillados de Puerto Rico, 2008).
PRASA is currently undergoing dramatic changes and renovations throughout its infrastructure.
In order for PRASA to achieve its mission, it has set three goals. These goals include (PRASA,
2006):
Obtaining the trust of the Puerto Rico residents;
Modernizing the corporation’s organizational structure; and,
Creating a financially successful corporation.
―Agua Para Todos‖, Water for All, was a project initiated by PRASA in the mid-1990’s
to identify and eliminate all non-PRASA water distribution systems for the Commonwealth of
Puerto Rico. Non-PRASA systems are defined as any water distribution system that is operated
and maintained independently by a local government or community and/or not integrated into
PRASA’s water distribution network. The Rio Prieto connection project was one such effort
under Agua Para Todos. PRASA has indicated that there are currently 240 Non-PRASA water
distribution systems servicing over 100,000 people throughout the Commonwealth of Puerto
Rico. (United States Department of Justice, 2008)
PRASA intends to improve and expand its infrastructure to accomplish the previously
stated goals while reducing and preventing any adverse affects on the environment. According to
the PRASA website and internal documents (YORK, 2006) the utility has spent around $3.2
billion in renovations in the past five years and plans on spending an additional $2.4 billion in
the next ten years. The allotted funds are intended for the upgrade and extension of the water
distribution network.
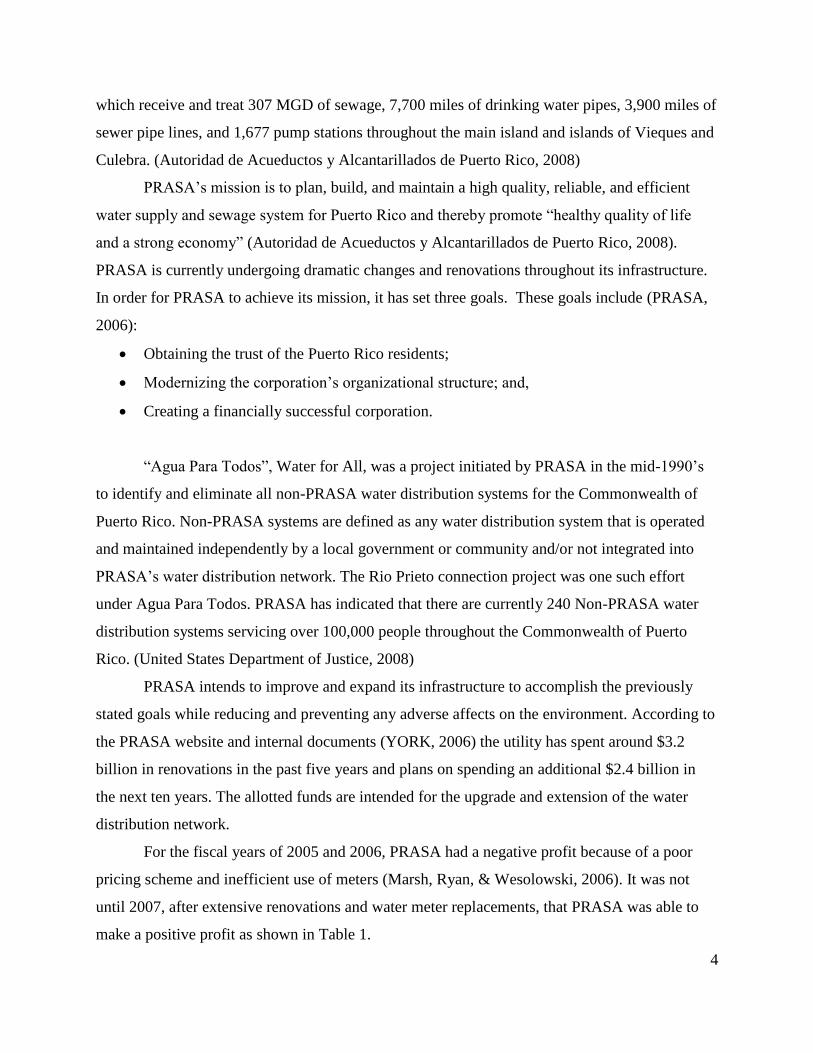
For the fiscal years of 2005 and 2006, PRASA had a negative profit because of a poor
pricing scheme and inefficient use of meters (Marsh, Ryan, & Wesolowski, 2006). It was not
until 2007, after extensive renovations and water meter replacements, that PRASA was able to
make a positive profit as shown in Table 1.
5
Fiscal
Year
Revenues Operating
Expenses
Profit
2005 $328.70 $558.00 -$229.30
2006 $484.70 $581.30 -$96.60
2007 $760.90 $593.00 $167.90
Table 1: Financial Summary of PRASA (Currency is in U.S. dollars expressed in millions) (Source: PRASA, 2006).
2.2 PRASA: Internal Operations
Through our introduction to PRASA, we have learned the different measures the agency
takes in order to run efficiently and what its plan are to continue doing so in the future. We have
learned about the telemetry, the current preventative maintenance program, the emergency
program, and the QAAA (Complaints of AAA). These are all important aspects in the
operations of PRASA.
In order to monitor and optimize the water distribution backbone, PRASA has
implemented a telemetry network produced by ArchestrA®. ArchestrA® is a generic, telemetric-
based application that can be customized for specific applications; in the case of PRASA the
specific applications are monitoring water level, pressure, and flow rate. ArchestrA® can be
suited to work with most types of transducers and can be coded to use each as required. PRASA
currently uses pressure transducers, among many others, to monitor water flow throughout
selected components of the metro region. It is not yet implemented throughout the water
distribution pipes; transducers are only present throughout a selected series of tanks, reservoirs,
and filtration and treatment plants. The transducers allow personnel to monitor the fluid level and
pressure up until the point where water exits the facilities and moves on throughout the
distribution pipelines.
In addition to monitoring, ArchestrA® also gives personnel the ability to turn on and off
plants, and gives other basic operational controls. Being a telemetric system, ArchestrA® allows
authorized personnel to access the system from anywhere there is an internet connection.
ArchestrA® is currently only implemented in the essential components of the Metro region, but
PRASA plans on expanding the telemetry network to the other regions and also to pipes
throughout the distribution aspect of the water network.
6
PRASA has developed a preventative maintenance program to improve their operations
and efficiency of the entire water distribution system. The purpose of the preventative
maintenance program is to anticipate areas in need of improvement before problems arise. The
program is split up into three phases; PRASA is currently starting phase two. One aspect of the
program is having a well stocked warehouse that is linked with the preventative maintenance that
is planned or underway. If the necessary materials and equipment are on hand in the warehouse,
jobs can be done sooner. PRASA is now keeping track of every item and piece of equipment so
they will know when something is running low or missing.
As a recent addition, the preventative maintenance program also considers the PRASA
vehicles. PRASA relies on their vehicles in order to get to wherever necessary to perform the
work. In order to respond to emergencies as quickly as possible, the vehicles condition is well
maintained. A regularly performed checklist of items is followed on a schedule. The checklist
ensures that PRASA knows of any problems with the vehicles so they can keep them reliable.
The preventative maintenance program has created more jobs within PRASA. There are
positions to make sure that the program is being followed and is being effective. There are
managerial positions that other employees report to. Overseeing the entire preventative
maintenance program allows for an inter-agency improvement as well as an operational
improvement. Preventative maintenance will improve the efficiency of PRASA, make service
more reliable, and hopefully improve customer satisfaction by preventing any problems that may
occur.
The project team met with the emergency group and received information on how
PRASA deals with events such as loss of service for customers and natural disasters. The
emergency group is open 24 hours a day, 7 days a week to enable a faster response to clients
without water. The CAR report is updated twice daily and contains information on the location
of a break, the number of clients that are out of service from that specific break, and the total
number of clients that are out of service. The report breaks down the problems into the 5 regions
and then graphically depicts the numbers combined. In the meeting with the emergency group
the project team was told that each client represents approximately 4 people because the client is
only the person who is on the bill for water. There are an expected number of clients that will be
out of service for each region due to an ongoing problem that has come to the attention of the
emergency group. When water is out for a long period of time, there are services that are used to
7
aid those without water. For example large trucks containing water can give water to clients
without service until the issue is resolved and water is back online. The emergency group also
has weather technology that helps the PRASA prepare for storms that may be destructive to
water services.
QAAA is a program in use by PRASA to track the various complaints that customers
may report. The database collects complaint reports from PRASA’s customer hotline that
services all five regions of the island. Each report records the time, location, and priority level of
each incident, and is then sent to the proper department to handle the situation while a copy is
sent to EPA for review. Based on an MS-DOS platform, QAAA is slated to be replaced by a new
program, Activo, which would incorporate work orders and customer complaints into a central
database. One of Activo’s advantages is that the program would be able to check for redundant
reports of customers complaining about the same problem.
Although it is certainly an important database of information, Mercedes Guzman, the
operator to whom our team was introduced, stated that complaints pipe bursts, contamination of
the water supply, and overflow were the common types of complaints seen in QAAA’s database.
Mercedes also mentioned that Activo would have the capability to integrate other databases into
its central database.
2.3 Puerto Rico Regions of Interest
Puerto Rico receives its raw water from the surface as well as underground. The surface
water sources are dams, lakes, and rivers and the underground water sources are aquifers. The
main aquifers can be divided into major and minor aquifers, most of which overlap each other
(Figure 1). Limestone formations make up the north and south coasts and they supply
approximately 16 percent of the water used by the population and by the industries throughout
the island. The North Coast limestone aquifer system accounts for about 680 square miles of the
island, covering about 19 percent of Puerto Rico. (Repetto, 2004)

8
Figure 1: Map of aquifer locations in Puerto Rico (Source: Ground Water Atlas of the United States, 1987)
9
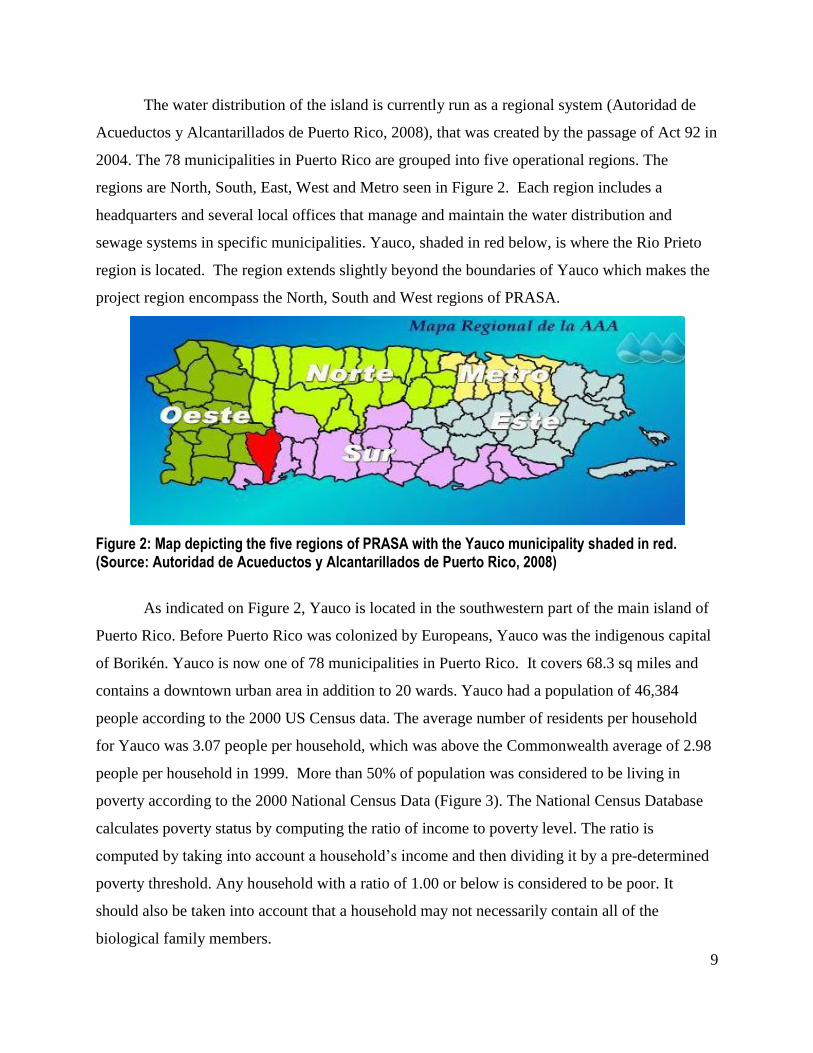
The water distribution of the island is currently run as a regional system (Autoridad de
Acueductos y Alcantarillados de Puerto Rico, 2008), that was created by the passage of Act 92 in
2004. The 78 municipalities in Puerto Rico are grouped into five operational regions. The
regions are North, South, East, West and Metro seen in Figure 2. Each region includes a
headquarters and several local offices that manage and maintain the water distribution and
sewage systems in specific municipalities. Yauco, shaded in red below, is where the Rio Prieto
region is located. The region extends slightly beyond the boundaries of Yauco which makes the
project region encompass the North, South and West regions of PRASA.
Figure 2: Map depicting the five regions of PRASA with the Yauco municipality shaded in red. (Source: Autoridad de Acueductos y Alcantarillados de Puerto Rico, 2008)
As indicated on Figure 2, Yauco is located in the southwestern part of the main island of
Puerto Rico. Before Puerto Rico was colonized by Europeans, Yauco was the indigenous capital
of Borikén. Yauco is now one of 78 municipalities in Puerto Rico. It covers 68.3 sq miles and
contains a downtown urban area in addition to 20 wards. Yauco had a population of 46,384
people according to the 2000 US Census data. The average number of residents per household
for Yauco was 3.07 people per household, which was above the Commonwealth average of 2.98
people per household in 1999. More than 50% of population was considered to be living in
poverty according to the 2000 National Census Data (Figure 3). The National Census Database
calculates poverty status by computing the ratio of income to poverty level. The ratio is
computed by taking into account a household’s income and then dividing it by a pre-determined
poverty threshold. Any household with a ratio of 1.00 or below is considered to be poor. It
should also be taken into account that a household may not necessarily contain all of the
biological family members.

10
Figure 3: Comparison of households above and below the poverty line (Source: United States
Census Bureau)
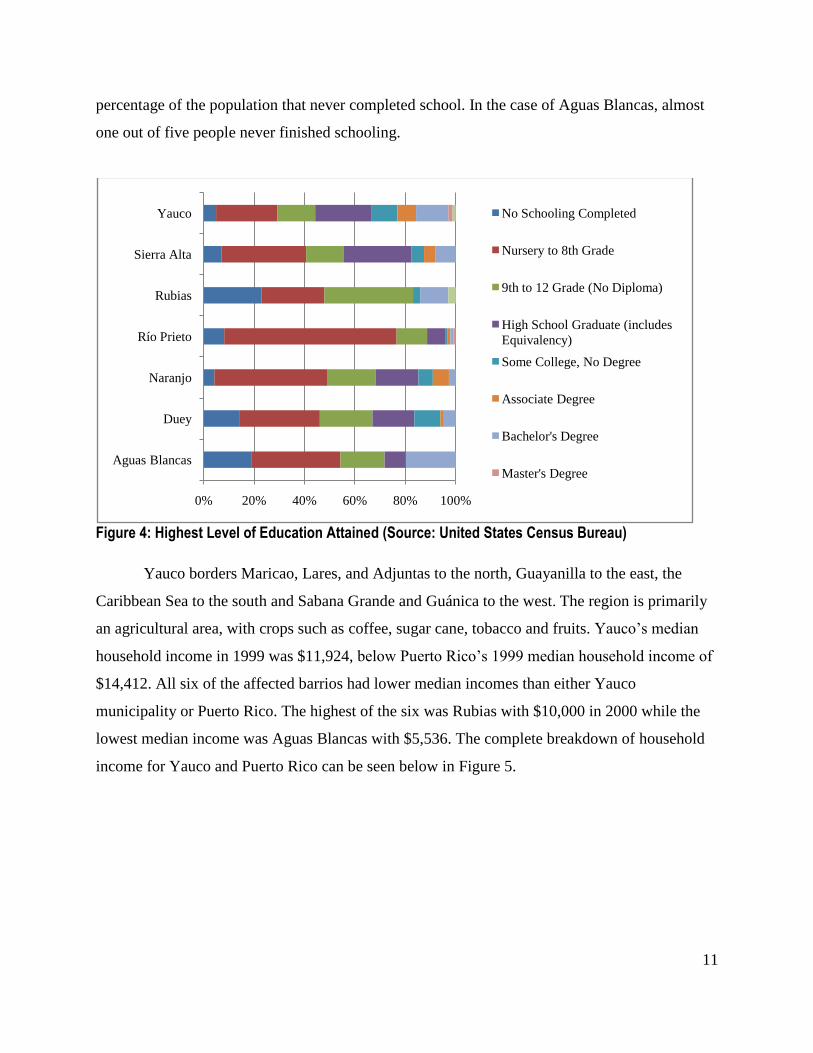
Those with high school diplomas or higher (6,057) made up about 13% of the population
of Yauco in 1999 which can be seen in
Figure 4. All of the barrios affected by the expansion project in Yauco have a considerable
0%10%20%30%40%50%60%70%80%90%
100%P
erce
nta
ge
of
Ho
use
ho
lds
Poverty Status
Above Poverty
Below Poverty
0% 20% 40% 60% 80% 100%
Aguas Blancas
Duey
Naranjo
Río Prieto
Rubias
Sierra Alta
Yauco No Schooling Completed
Nursery to 8th Grade
9th to 12 Grade (No Diploma)
High School Graduate (includes
Equivalency)
Some College, No Degree
Associate Degree
Bachelor's Degree
Master's Degree
11
percentage of the population that never completed school. In the case of Aguas Blancas, almost
one out of five people never finished schooling.
Figure 4: Highest Level of Education Attained (Source: United States Census Bureau)
Yauco borders Maricao, Lares, and Adjuntas to the north, Guayanilla to the east, the
Caribbean Sea to the south and Sabana Grande and Guánica to the west. The region is primarily
an agricultural area, with crops such as coffee, sugar cane, tobacco and fruits. Yauco’s median
household income in 1999 was $11,924, below Puerto Rico’s 1999 median household income of
$14,412. All six of the affected barrios had lower median incomes than either Yauco
municipality or Puerto Rico. The highest of the six was Rubias with $10,000 in 2000 while the
lowest median income was Aguas Blancas with $5,536. The complete breakdown of household
income for Yauco and Puerto Rico can be seen below in Figure 5.
0% 20% 40% 60% 80% 100%
Aguas Blancas
Duey
Naranjo
Río Prieto
Rubias
Sierra Alta
Yauco No Schooling Completed
Nursery to 8th Grade
9th to 12 Grade (No Diploma)
High School Graduate (includes
Equivalency)
Some College, No Degree
Associate Degree
Bachelor's Degree
Master's Degree

12
Figure 5: Comparison of Household Income for the Affected Barrios, Yauco and Puerto Rico (Source: United States Census Bureau)
Yauco is part of the Southern Coastal Plain and the northern territory is situated in the
southern area of the Central Mountain Range (Yauco...Land of Coffee). There are nine mountain
peaks in Yauco, three which are in the Rio Prieto region of focus. There are two main rivers
running through Yauco, Rio Loco and Rio Yauco. Rio Yauco has three tributaries and three
creeks throughout the municipality. Located in its watershed is the Lucchetti Reservoir. The
reservoir has a height of 173 meters and a capacity of 20 million cubic meters. Rio Loco has 4
tributaries and a secondary river, Rio Prieto. Rio Prieto is located in the Rio Prieto ward, and is
the water source for the filtration plant. The Loco Reservoir is located in the watershed of the
Rio Loco. Its capacity is 2.5 million cubic meters, with a height of 70 meters. (Black & Veatch
PMC Team, 2006)
Also located in the Yauco region are two forests. Bosque de Guilarte has elevations
ranging from 760 meters to 1205 meters while Bosque de Susua ranges from 80 meters to 470
meters. Bosques de Guilarte and Susua have average rainfalls of 2,244 mm and 1,413 mm,
respectively. The soils in Yauco are classified as slightly leached volcanic rock. The soil is
clayey and loamy which is sticky. The well drained and moderately permeable soil is underlain
0% 20% 40% 60% 80% 100%
Aguas Blancas
Duey
Naranjo
Río Prieto
Rubias
Sierra Alta
Yauco
Puerto Rico
Percentage of Households
Breakdown of Household Income
Less than $10,000
$10,000 to $14,999
$15,000 to $19,999
$20,000 to $24,999
$25,000 to $29,999
$30,000 to $34,999
$35,000 to $39,999
$40,000 to $44,999
$45,000 to $99,999
$100,000 or more
13
by hardened unweathered rock 30 inches deep or less. Yauco is a very mountainous dry area,
supporting coffee farms and small communities. (Black & Veatch PMC Team, 2006)
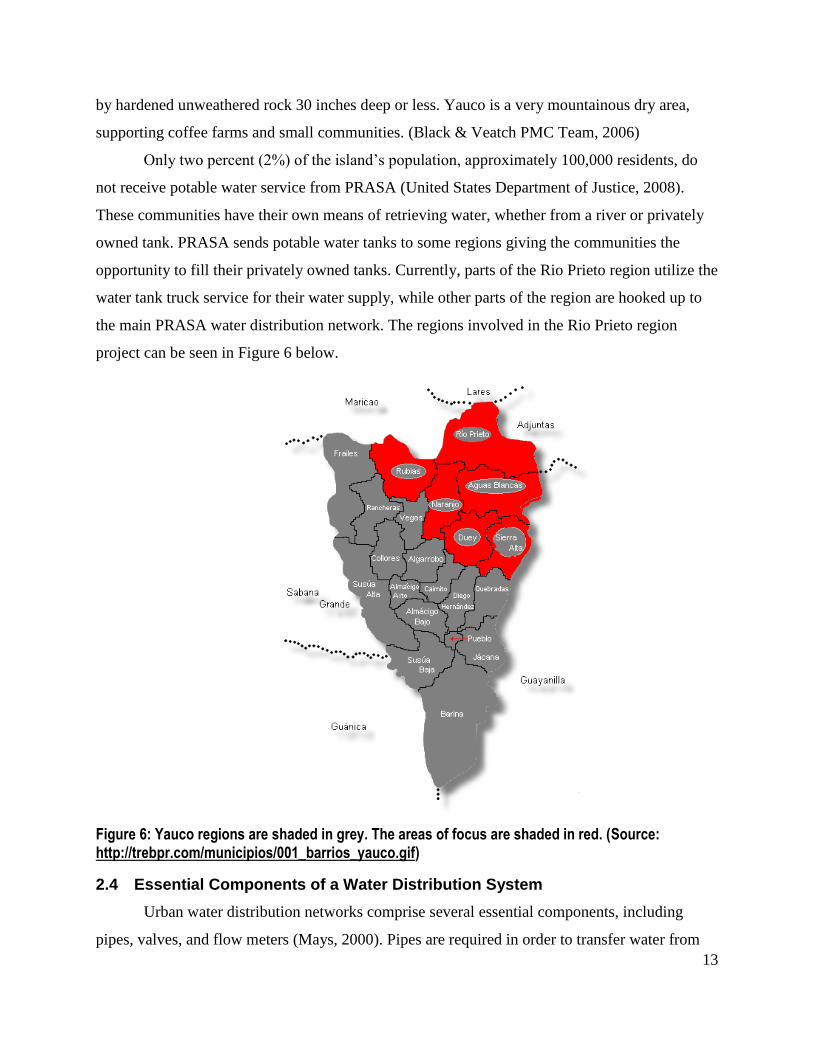
Only two percent (2%) of the island’s population, approximately 100,000 residents, do
not receive potable water service from PRASA (United States Department of Justice, 2008).
These communities have their own means of retrieving water, whether from a river or privately
owned tank. PRASA sends potable water tanks to some regions giving the communities the
opportunity to fill their privately owned tanks. Currently, parts of the Rio Prieto region utilize the
water tank truck service for their water supply, while other parts of the region are hooked up to
the main PRASA water distribution network. The regions involved in the Rio Prieto region
project can be seen in Figure 6 below.
Figure 6: Yauco regions are shaded in grey. The areas of focus are shaded in red. (Source: http://trebpr.com/municipios/001_barrios_yauco.gif)
2.4 Essential Components of a Water Distribution System
Urban water distribution networks comprise several essential components, including
pipes, valves, and flow meters (Mays, 2000). Pipes are required in order to transfer water from
14
one region to another. The composing material of the pipe must be chosen wisely, and lengths,
degree of approaches, and diameter all determine water pressure and efficiency. In Puerto Rico,
PRASA used cast iron pipes in the past. However, the newer pipes being installed are PVC.
Puerto Rico’s main lines are generally 6‖ in diameter. The smaller pipes connected to the main
line that bring water to certain areas are usually 2‖ to 4‖ in diameter. (Perez, 2008)
Valves allow manual or automatic restriction of water flow through the pipes. The use of
an array of valves can reroute water where necessary. Flow meters monitor the flow and rate
through particular pipes, and give the operators or distributors an idea of where water is lacking
or too copious. Flow meters also allow distributors to monitor the water usage of their customers
and are a fundamental component of billing. Based on observations of current systems, many
water distribution companies around the world use a telemetry system to gather flow meter data,
including places such as Worcester, Korea, and Malaysia. According to the Worcester
Department of Public Works, telemetry is the emerging technology and makes water reading
much more efficient and accurate (Daigneault & Guerin, 2008). The hydraulic model that will
be produced will include valves in various locations to observe how the system responds.
Filtration systems are another important component which aid in the quality of service.
Through efficient filtration systems, the best possible service and the cleanest, healthiest water
possible can be provided. The Safe Water Drinking Act of 1974 regulates the level of filtration
each water service provider must adhere to for its water supply. All of these components need to
be serviced and maintained properly in order for a water distribution network to function
effectively and efficiently. The Rio Prieto water filtration plant is the only filtration plant serving
the Rio Prieto water distribution system. The Rio Prieto Plant operates 24 hours a day, 7 days a
week. Its capacity of production is 0.25 MGD but currently it has an average production of 0.40
MGD possibly forcing the plant to compromise filtration steps to keep up with the water demand
(Olaya, 2008). In the year 2007, it was out of operation for approximately 1591hours, about 66
days. Therefore, it was only reliable nearly 80% of the time. The filtration plant uses methods of
sedimentation of the Rio Prieto river water to clean and distribute it.
All components of a water distribution system are necessary in a hydraulic model in order
to evaluate it. A simple way of evaluating a hydraulic model is by comparing the supply to the
demand. The comparison is then used to create different water usage scenarios. These scenarios
include maximum day, average day, reservoir refill, and peak hour. The total demand is then

15
analyzed for the existing system. Using the total demand, the pipes, pumps, and valves can be
evaluated to determine if they are adequate enough for the system. The adequacy is determined
using the hydraulic modeling program.
2.5 Standards & Laws
The Environmental Protection Agency (EPA) is the governing agency of water
regulations throughout the United States, including Puerto Rico. Puerto Rico is under the
jurisdiction of EPA Region 2, which also includes New York, New Jersey, the U.S. Virgin
Islands, and the Tribal Nations. The two primary laws concerning water are the Clean Water Act
and Safe Drinking Water Act. The basis of the Clean Water Act was enacted in 1948, but was
called the Federal Water Pollution Act at the time. The Act was significantly reorganized and
expanded in 1972, but its title was not changed to the Clean Water Act until 1977. The emphasis
of the Clean Water Act is to establish ―the basic structure for regulating discharges of pollutants
into the waters of the United States and regulating quality standards for surface waters‖. (Clean
Water Act, 2007)
The other governing act is the Safe Drinking Water Act. The Safe Drinking Water Act
was enacted in 1974 to protect the public health by regulating the nation’s public drinking water
supply. The Safe Drinking Water Act controls the actual content and purity of the water that is
distributed to the home. By definition, all water that enters the home should be safe to drink. The
Safe Drinking Water Act controls improperly disposed chemicals, animal wastes, pesticides,
human wastes, and naturally-occurring substances.
In June 2006, PRASA violated the Clean Water Act resulting in 15 felony counts. Nine
sanitary wastewater treatment plants and five potable water treatment plants were guilty of
discharging pollutants. The punishment included a $9 million fine, a mandated $1.7 billion
improvement plan over the next 15 years, and five years probation. Some of these improvements
include short, mid, and long term projects. Installing dechlorination equipment and flow
proportional equipment, repairing and replacing equipment, and implementing a chemical
treatment program for the removal of certain elements are examples of improvement projects.
The indictment charging PRASA seeks to improve the company, its customer service, and the
16
surrounding environment. The fines against PRASA are the largest of any utility company
violating the Clean Water Act. (United States Department of Justice, 2008)
When PRASA is charged with a felony they must agree to, and comply with, a consent
decree. If the consent decree is not in compliance with PRASA’s actions, then the federal court
can extend the probation and increase the monetary fines. When the probation ends on April 19,
2012 the EPA will re-evaluate the operations of PRASA and decide whether further punishment
is necessary. PRASA has a probation officer from the EPA to monitor the company and be sure
they are taking steps toward improvement. The EPA visits each filtration plant approximately
four times a year to make sure that all processes are abiding by the regulations. There are also
two types of inspections they perform, compliance evaluation and reconnaissance. The
compliance evaluation is a more thorough inspection compared to the reconnaissance. (Perez,
2008)
In addition to the most recent consent decree, PRASA is complying with another decree
to map out the entire system since 2003 due to illegal discharges from 471 pump stations. In the
2003 decree, PRASA was to eliminate 185 sewage pump stations that were not in compliance
with the EPA regulations. The estimated value of improvement projects was $300 million and
another $1 million in civil penalties. In addition to the stated agreements, PRASA decided to
spend another $1 million on a supplemental environmental project. The project is aimed at
improving the drinking water quality in rural communities where the residents are not hooked up
to the distribution system, like the Rio Prieto Region. (United States Department of Justice,
2008)
According to Juan Carlos Perez, Director of Auxiliar Alcantarillado, PRASA and the
EPA had an unfriendly relationship in the past. However, he expressed that the relationship has
changed completely. PRASA understands that the EPA is there to help and improve the entire
water and wastewater system. EPA is helpful for determining what areas need to be improved
and in suggesting means of improvement.
2.6 Case Studies from Other Water Distribution Systems
The Worcester Department of Public Works (DPW) supplies water to Worcester,
Auburn, Paxton, and a majority of Holden. All of the water mains are mapped with Geographic
17
Information System (GIS). Worcester does not analyze any data for societal effects or to track
trends. In terms of system maintenance, the Worcester DPW takes a proactive stance and tries to
replace components of the distribution system before they break. Currently they are working on a
long term project started in 1949 of replacing the aged pipes of the city since a number of them
date back to the 1870s. An example of their preventative maintenance is to dig up sections,
remove the build-up on the inside of the pipes, and then place cement lining to the pipes to act as
a chemical barrier. The department wants to be proactive in order to reduce damages and losses
that can arise. Also, if the DPW were to wait for problems to occur it would take time and money
out of the regularly scheduled improvement plan to respond to the customer call of the problem.
(Daigneault & Guerin, 2008)
A study was performed on a water distribution system in Shillong, India by Ingeduld, et
al (Ingeduld, Svitak, Pradhan, & Tarai, August 2006). Shillong is located in north-eastern India,
and is the capital of the Meghalaya, one of the least populous Indian states. It is considered a
large rural city which utilizes an intermittent supply system. The water is provided by Shillong
Water Supply Scheme and by Shillong Municipality Board. The network and its attributes were
imported from a GIS database to a similar water modeling package known as MIKE NET. Tank
attributes were entered such as tank diameter, tank capacity, and tank shape. The operation
protocols were then entered into the system based on what was said by the operators of the water
system.
Due to the inherent low pressure and intermittent service, rural systems are usually very
difficult to model (Ingeduld, Svitak, Pradhan, & Tarai, August 2006). In rural areas, population
growth and high water losses from the distribution network may lead to an excess demand from
the system. To limit total demand and provide high quality water, intermittent water supplies
with reduced system pressures are often introduced. Hours are assigned throughout the day or
week when water is enabled or disabled, depending on the situation. As a result, consumers are
forced to collect as much water as possible during the limited supply hours. Households are
recommended to have storage tanks in order to collect water to use during off hours.
The investigators of the case study assumed 15% leakage for the hours with supply. The
hydraulic model was performed and part of it can be seen in Figure 7 below.
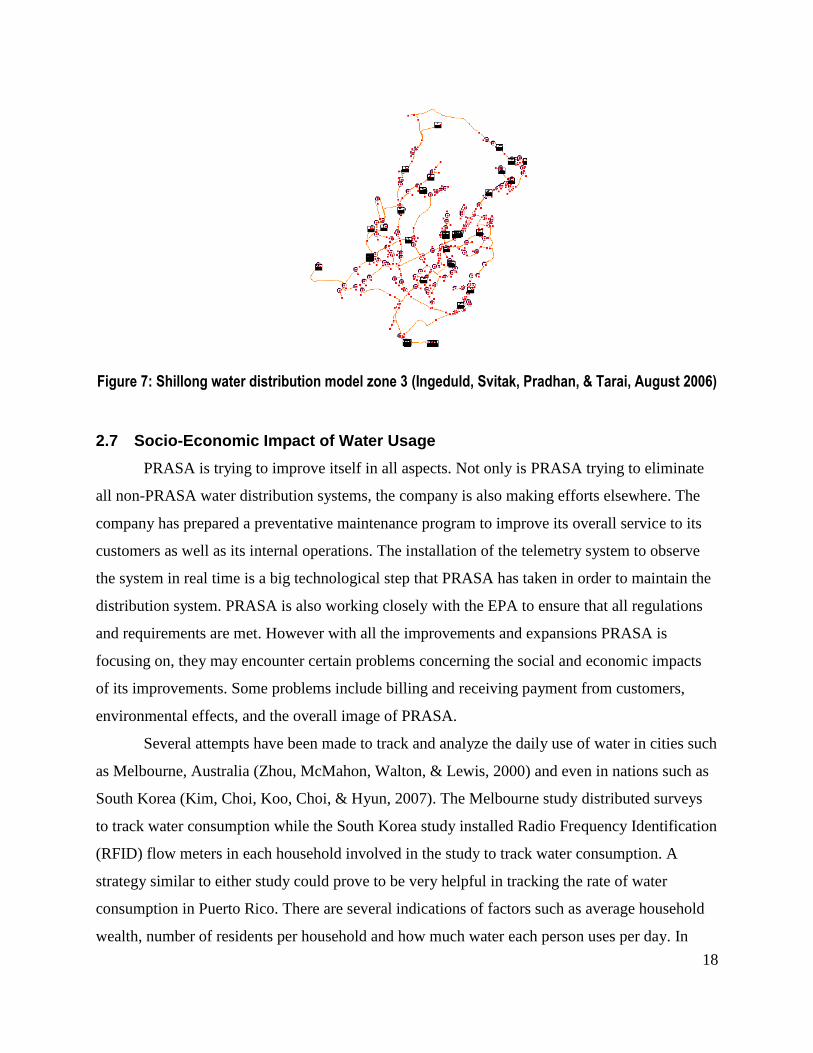
18
Figure 7: Shillong water distribution model zone 3 (Ingeduld, Svitak, Pradhan, & Tarai, August 2006)
2.7 Socio-Economic Impact of Water Usage
PRASA is trying to improve itself in all aspects. Not only is PRASA trying to eliminate
all non-PRASA water distribution systems, the company is also making efforts elsewhere. The
company has prepared a preventative maintenance program to improve its overall service to its
customers as well as its internal operations. The installation of the telemetry system to observe
the system in real time is a big technological step that PRASA has taken in order to maintain the
distribution system. PRASA is also working closely with the EPA to ensure that all regulations
and requirements are met. However with all the improvements and expansions PRASA is
focusing on, they may encounter certain problems concerning the social and economic impacts
of its improvements. Some problems include billing and receiving payment from customers,
environmental effects, and the overall image of PRASA.
Several attempts have been made to track and analyze the daily use of water in cities such
as Melbourne, Australia (Zhou, McMahon, Walton, & Lewis, 2000) and even in nations such as
South Korea (Kim, Choi, Koo, Choi, & Hyun, 2007). The Melbourne study distributed surveys
to track water consumption while the South Korea study installed Radio Frequency Identification
(RFID) flow meters in each household involved in the study to track water consumption. A
strategy similar to either study could prove to be very helpful in tracking the rate of water
consumption in Puerto Rico. There are several indications of factors such as average household
wealth, number of residents per household and how much water each person uses per day. In
19
Korea, a study also indicated the number of times a household ate out at restaurants as also being
a factor for increased water consumption (Kim, Choi, Koo, Choi, & Hyun, 2007).
Bill collection itself has recently been an interesting undertaking for PRASA. Water
companies experience a lag of time from the time a bill is issued to the customer to the time it is
collected (Ruijs, Zimmermann, & van den Berg, 2007). To streamline the transaction and receive
payments faster, PRASA has come up with several ideas such as enabling online bill payment
through its website and even installing payment kiosks in several malls. But the poorest
customers, and surely those in the Rio Prieto region, may not even have access to computers or
frequent malls; paper payments are the only option left.
Studies that have analyzed water usage in cities in Korea and Brazil have come to a
baseline conclusion that higher income households will always use more water in a given time
period than smaller income households. Other commonly accepted factors that would lead to an
increase in water consumption included higher number of residents in a household, warmer
weather, and less precipitation (Kim, Choi, Koo, Choi, & Hyun, 2007).
The Sao Paulo study came to the realization that one of the greatest factors for increased
water usage occurred when water bills became a certain percentage of a household’s disposable
income. Households in the wealthiest 20% of the population spent only 0.52% of its income on
water utility bills while the poorest 20% would spend as much as 4.71% of its income on the
same bills. For any household, water is a significant utility to pay. Adjusting water prices could
lead to an increase or decrease in water usage. Statistics indicated increasing prices by as little as
1% would lead to an observable decrease in water consumption of 0.5%. In turn, decreasing
water prices by 1% led to a 0.4% increase in water consumption (Kayaga & Franceys, 2006).
According to the data accessed in the 2000 National Census Database, our team
discovered that the affected barrios of Yauco all had relatively high-density households. The
highest average was Aguas Blancas with 3.72 people per household (pph) while the lowest of the
affected barrios was Naranjo with 3.11 pph. In comparison, Puerto Rico’s average was 2.98 pph
and Yauco Municipality was only 3.07 pph. PRASA should take the higher density of population
per household into account for future analyses of the Rio Prieto area because of the increased
demand it would face. The affected population of the Rio Prieto area consistently has greater
household density, lower household income, and tend to live in rural areas (as opposed to urban
areas) when compared to Yauco municipality or Puerto Rico as a whole island. Although its

20
effects have yet to be conclusive, PRASA should note these differences when pursuing future
rural connection projects similar in scope and size to the Rio Prieto project.
One journal article looked at the social and economic impacts of availability of potable
water service on a global scale. The study created its own index number system, Social Water
Stress/Scarcity Index (SWSI), which measured a country’s ability to match its population’s
supply and demand of water. 145 countries were labeled with a SWSI number. The study was
written with figures from 1995 but predicted water shortages or abundances for countries up until
2025. It noted that water service had the ability to affect socio-economic issues of countries such
as major shifts in population, scarcity of jobs, or even ransom another country by restricting
water flow.
Water service may become the newest global crisis, on level with global warming or
energy shortage. The results of our study on rural water distribution systems and reliable service
may become the topic of many more case studies or analyses in the future (Ohlsson, 2000).
2.8 Problems Arising of Newly Installed Water Distribution Systems
A case study completed in 1991 of the socio-economic impact of improved wells in
Sierra Leone noted that the improved wells had very little impact on enhancing the quality of life
of the local population in two different chiefdoms. Having just the opposite effect, a majority of
the residents avoided using the improved wells for various reasons and preferred to use
traditional sources of water such as traditional wells or swamp pits. Reasons for not using the
improved wells included: bad taste of water from the improved wells, broken or missing
equipment, long distances from the improved wells to home, and the belief that the well was
contaminated with evil spirits. One interesting reason for not using the wells was that the
villagers only cooperated with the construction of the improved wells in the hopes that their
sponsors would return to build schools or health clinics (Bah et al, 1991).
Similar water distribution projects completed in Mali and Iran stressed the importance of
listening to the population and understanding its cultural, social, and physical needs for water
before a plan is enacted (Gleitsmann et al, 2007, Asadi-Lari et al, 2005). Case studies done of
water connection projects completed in Africa noted customers complaining about high costs,
often because the customers did not understand the breakdown of fees (Kayaga & Franceys,

21
2006). Although the locations of Africa and Puerto Rico may seem very different, the problems
arising in the rural areas in regards to water system integration are similar.
2.9 Non-PRASA Systems
As previously mentioned, non-PRASA systems are defined to be water distribution
systems that are operated independently and outside of PRASA’s jurisdiction. These water
distribution systems are located mostly along the interior of the island, where the rugged,
mountainous terrain with deep ravines and isolated communities make it difficult for PRASA to
deliver water through its pipe network. The municipalities that these projects are located in can
be seen below in Figure 8. Non-PRASA systems are allowed to function and remain operational
as long as they meet the health standards imposed by the EPA and Puerto Rico Department of
Health. When a system fails to meet these standards, PRASA is either forced to become the
community’s principal water supplier or work with EPA to make sure the non-PRASA system
can meet all compliance standards. The communities dependent on non-PRASA systems are
typically small, with an average affected population of about 500 people. The connection
projects usually take several years, with most projects being completed in around 5 years but
some taking over 10 years for connections to finish and the system to be brought online
(Maldonado, 2008).
Figure 8: Map of Puerto Rico municipalities with project areas shaded, Source: (Cai, 2007)
2.9.1 Villa Verde, Guyama
The non-PRASA system in Villa Verde was completed recently and all of the 260
residents affected (except for one family) agreed to accept PRASA as their water supplier.
22
Connection fees were lowered so that the newly activated customers could have an easier time
adjusting to having to pay PRASA for the water.
2.9.2 Rosario Penon, San German
Rosario Penon was similar to the Villa Verde connection project. The population of about
300 residents in Rosario Penon was also initially hostile of PRASA’s efforts at first but gradually
came to accept the water and services.
2.9.3 La Sapia, Orocovis
The community of La Sapia in Orocovis had a non-PRASA water distribution system that
was forced to convert to a PRASA system through a Supplemental Environmental Project (SEP)
mandated by the EPA. SEPs are public works projects that are mandated by EPA in lieu of a
fine so that money owed by PRASA can go to improving the lives of a population. The
population affected here was also about 300 people.
2.9.4 La Espancita and Saltos Caguana, Utuado
Another EPA SEP, the twin communities of La Espancita and Saltos Caguana in Utuado,
originally had non-PRASA systems that serviced a combined total population of about 600
residents. The connection project lasted a little over ten years due to high tension between
PRASA officials and the community.
2.9.5 Rancho Grande/Maizales, Naguabo
The Rancho Grande (Maizales) community represents a non-PRASA system conversion
that ultimately backfired. The community initially agreed to have a PRASA system installed for
potable water service and PRASA applied for Drinking Water State Revolving Funds (DWSRF).
The DWSRF is a federal fund allocated by EPA for water utility companies to use toward the
improvement of potable drinking water. Sometimes PRASA uses the funds for smaller projects.
The Rancho Grande project ended up taking over twenty years to reach a conclusion, finally
ending with the non-PRASA system being reinstalled and PRASA working with the EPA to
meet health and compliance standards. Among the issues raised over the PRASA conversion was
the fact that the non-PRASA system would have to be dismantled, which was a source of
convenience for the residents. (Maldonado, 2008)
23
3. Methodology and Preliminary Illustrative Results
The goal of PRASA is to provide the people of Puerto Rico with the best possible water
service and expand to those who currently don’t have water service. The corporation is in the
process of modernizing, upgrading, and expanding its facilities and water distribution pipes in
order to meet the demand of the people. The goal of our project was to create an accurate
hydraulic model that will be used and analyzed for various scenarios and adjusted to provide a
functional model of the expanded system. The model will be used to aid PRASA in expanding
and optimizing the water distribution network. The team’s objectives include the understanding
of the water distribution network of the Rio Prieto region, creation of supply and demand data
tables, implementation of a hydraulic model of the current and the optimized water distribution
system, analysis of the needs of the surrounding communities and the determination of the
benefits of the optimized system. The team accomplished these objectives with the following
tasks: obtaining and organizing field data, conducting interviews for socio-economic-cultural
background on Rio Prieto, performing trend analysis, and mastering hydraulic modeling.
3.1 Understanding the Rio Prieto Region Water Supply
The first task was to meet with CSA Group workers on the project to understand the
current system in place as best as possible. To accomplish this, the project team performed in-
depth qualitative interviews on site. The project meeting allowed the team to ask questions in a
small setting where we had the chance to look only at the existing water distribution system. The
team used maps to help focus on the exact region. The qualitative interviews were appropriate
for the PRASA employees in control of the distribution system in the Rio Prieto region. We
interviewed Ronald Perez and Hugo Delgado. Our goal was to obtain more information about
the history of the region and the water supply, what measures were being taken for those without
clean water, and how the expansion will affect the community once it was working. Lists of our
initial questions are presented in Appendix B.
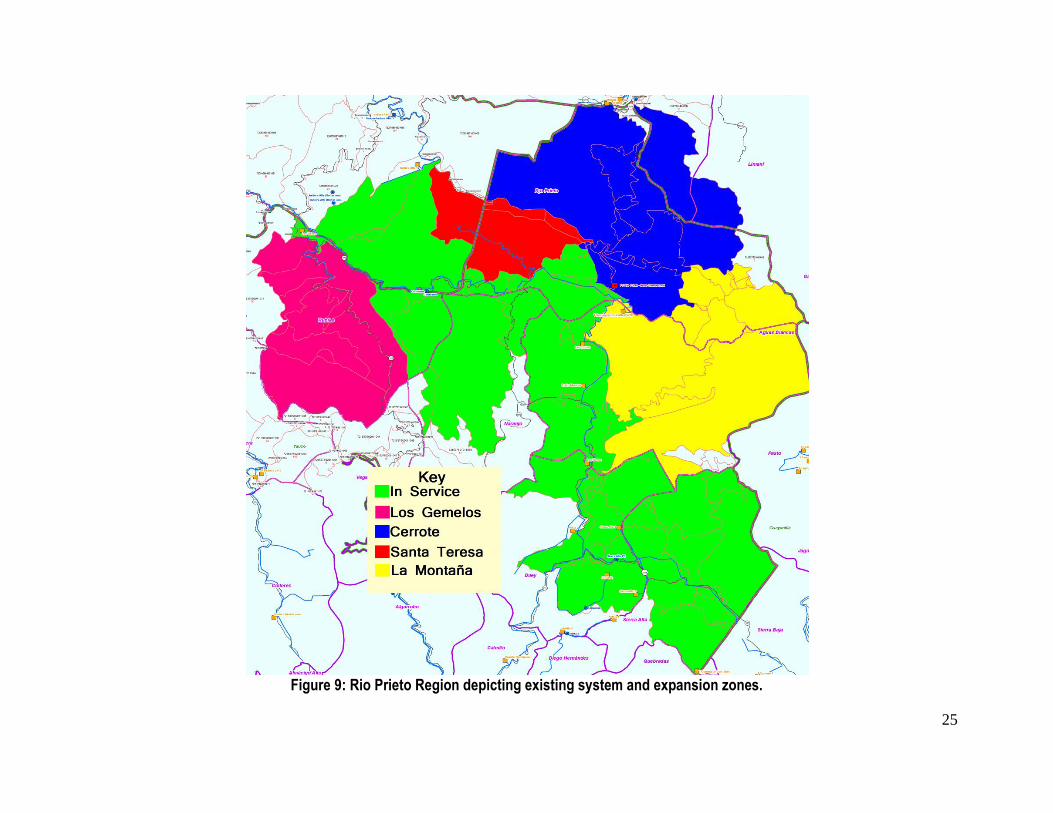
The involved municipalities of Yauco, Maricao, and Lares were distributed into 5 service
areas seen in
Figure 9. Currently, there is a main section that is part of the PRASA water distribution network
which is highlighted in green below. The other 4 sections have water pipes installed capable of

24
being part of the water distribution network but are not currently connected to the main section
therefore not receiving water from PRASA.
25
Figure 9: Rio Prieto Region depicting existing system and expansion zones.
26
3.2 Establishing Tables of Information
The first table of information is based on the demand on the water system. The demand
table was used first to make the demand calculations for the whole Yauco region and then for the
5 service zones in the Rio Prieto region. The zones are the area currently in service, Los
Gemelos, La Montaña, Cerrote, and Santa Teresa. The water demand for Yauco was calculated
by summing the gallons per day demanded from single and multiple family residential houses
and also taking into consideration the unaccounted water. The water demand per capita was then
calculated by dividing the year 2000 water demand by the population from the 2000 census. The
water demand per capita for the Yauco region was then used to estimate the average and
maximum demand for each of the service zones.
The year 2000 census data was used to determine the number of people living in the Rio
Prieto region. The population of each zone was determined by summing the population in the US
Census Bureau census tracks in each of the service zones. The populations were then used to
calculate the demand of each zone using the previously calculated water demand per capita in the
Yauco region. With the current population calculated, population predictions for every five years
until 2025 were made. Demand predictions were also made based on the population predictions
for the regions. The total demand put on the system by the area that is in service and those that
are not in service was then calculated to be used in the supply table.
Another table created contains information on the water supply and production capacity
for the future. The only supply source for the area is the Rio Prieto filtration plant which has a
capacity of 0.40 MGD which is being upgraded to a 1.5 MGD plant within the next 2 to 3 years
(Black & Veatch PMC Team, 2006). The average and maximum demand calculated from the
previous demand table was used to determine the average and maximum surplus or deficiency.
The predictions of supply along with predictions of demand were used to create scenarios which
help in the planning of the connections of the disconnected zones to the main line.
The final table created illustrates the efficiency and consistency of the Rio Prieto
Filtration Plant. The project team received information pertaining to the production of the
filtration plant. The information presented included daily production, hours of service, chemical
levels, the turbidity level, filter operations, and more. All the information was presented in a
monthly table. It was recorded by hand and is not transferred into any type of database. The
project team used the daily production information to analyze the competence of the plant. With

27
the use of Microsoft Excel®, the project team transferred the specific data into a spreadsheet.
Once all the data was inputted, average production for the month was calculated. Graphs were
made for each month to represent the consistency and/or inconsistency of the production of the
Rio Prieto Filtration Plant. Another table was then created to focus on the entire year. The
averages for each month were used. A graph was created to then illustrate the plant production
over the entire 2007 year. Another graph was created to compare the average production for each
month.
3.3 Hydraulic Modeling
Before an existing water distribution network can be expanded, a model must first be
developed to ensure that the new connections will result in a successful, functioning system with
sufficient supply and operating pressures to meet predicted demands. In this project we used the
hydraulic modeling software, EPANET, to build a model for the Rio Prieto region. EPANET
hydraulic modeling software is distributed freely from The U.S. Environmental Protection
Agency. It is a program that performs extended-period simulation of water quality behavior of
pressurized pipe networks (Environmental Protection Agency, 2008). H2OMAP™ is another
hydraulic modeling package distributed by MWH Soft® and is used at CSA Group but was not
utilized by the project team.
3.3.1 Quantifying the current system
The project team was given an H2OMAP™ hydraulic modeling network file (*.NET)
from CSA Group representing the currently installed, functioning and digitized infrastructure
throughout the entire Yauco municipality. The file was imported and viewed in EPANET which
can be seen in Figure 10. Due to incompatibilities, the tanks were read as reservoirs. As a result
this file was not used for analysis, but it did prove to be useful for node placement information,
elevation data, and other component parameters that were later needed. The majority of the
components were not relevant because the file was for the entire Yauco municipality and the
project is focused on only the northern region of Yauco. The data below the red curve was not of
concern to the project and was deleted, resulting in the existing system of interest shown in
Figure 11.
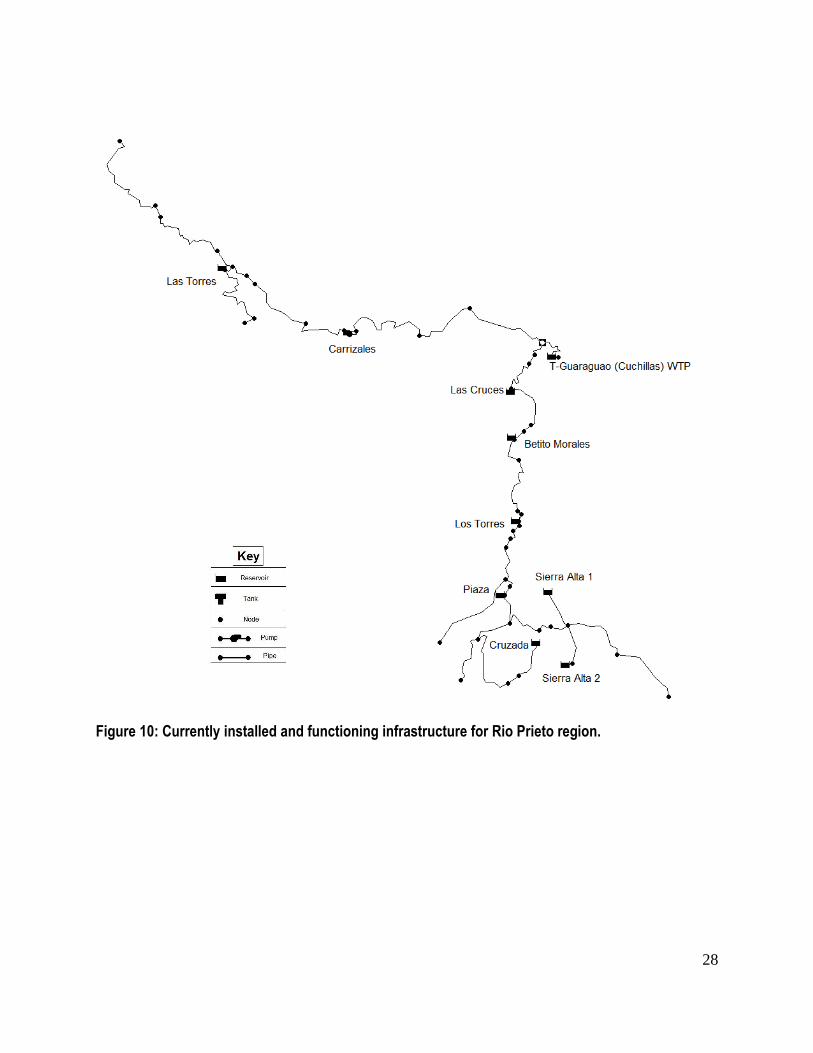
28
Figure 10: Currently installed and functioning infrastructure for Rio Prieto region.
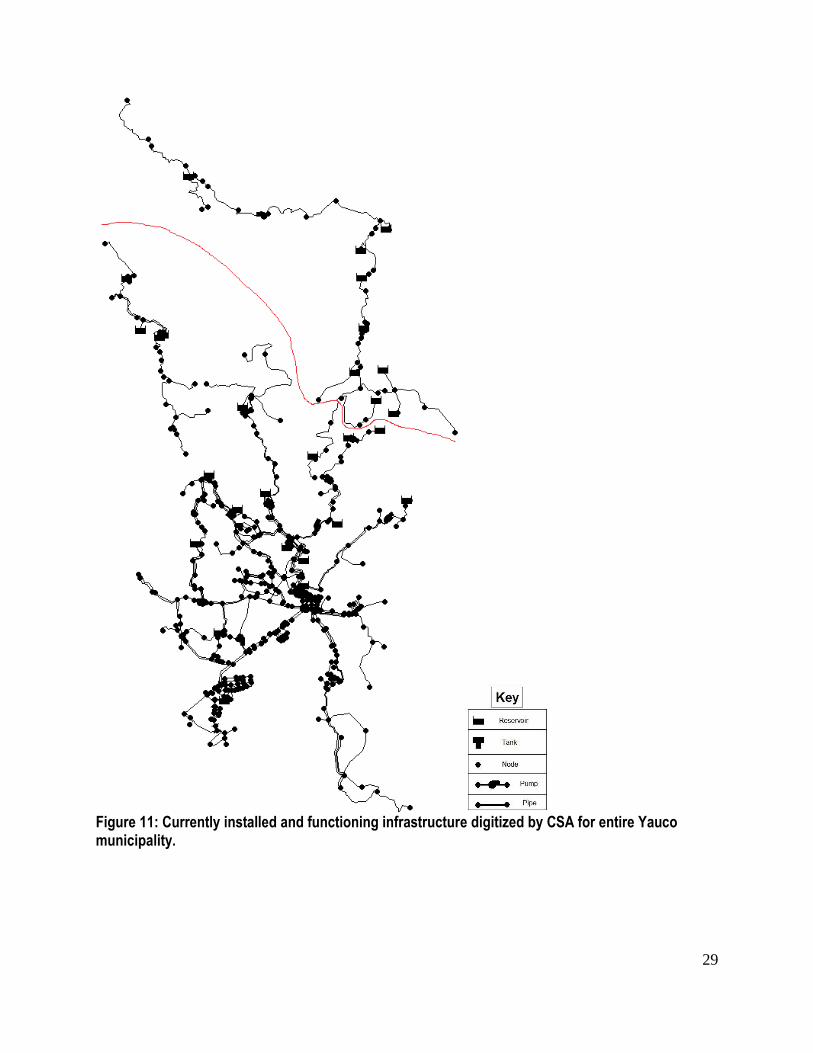
29
Figure 11: Currently installed and functioning infrastructure digitized by CSA for entire Yauco municipality.
30
The first step of the hydraulic digitizing included graphically depicting components.
Components include tanks, reservoirs, pumps, valves, and pipes. Digitizing can be performed in
a variety of ways. For the purposes of the project it was performed by importing a backdrop
bitmapped image showing the infrastructure components and overlaying the image with digital
components in EPANET. The project team acquired the bitmap image of the infrastructure in the
Rio Prieto region from CSA Group consultants working with PRASA. In addition to water
distribution infrastructure, CSA Group extracted information on the census blocks and roads
from the relevant ArcGIS data layers and included them in the bitmap output.
After all of the components were digitized, parameters were entered for each. Elevation
with respect to sea level was entered as well as operational specifications such as volume for
tanks, diameter for pipes, and power for pumps. Nodes are also an important feature in a
hydraulic model. They can be added anywhere throughout the system and are used to simulate
the elevation change along a pipe, as well as function as junctions for multiple pipes. The
locations of the nodes for the existing system were used from the original H20MAP™ file for
accuracy. Demand data can also be inputted to a node. Demand nodes were placed strategically
for each assigned population aggregate. The final digitized system for the existing network is in
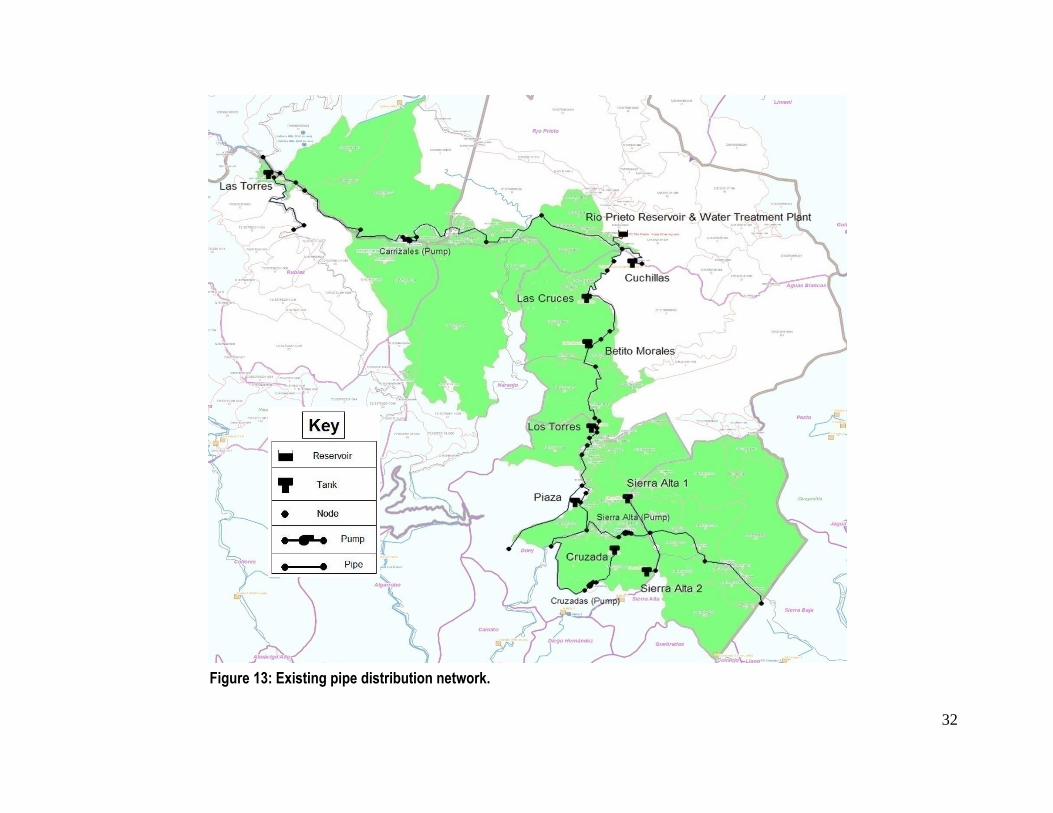
Figure 12 and is shown with the backdrop in place in Figure 13.
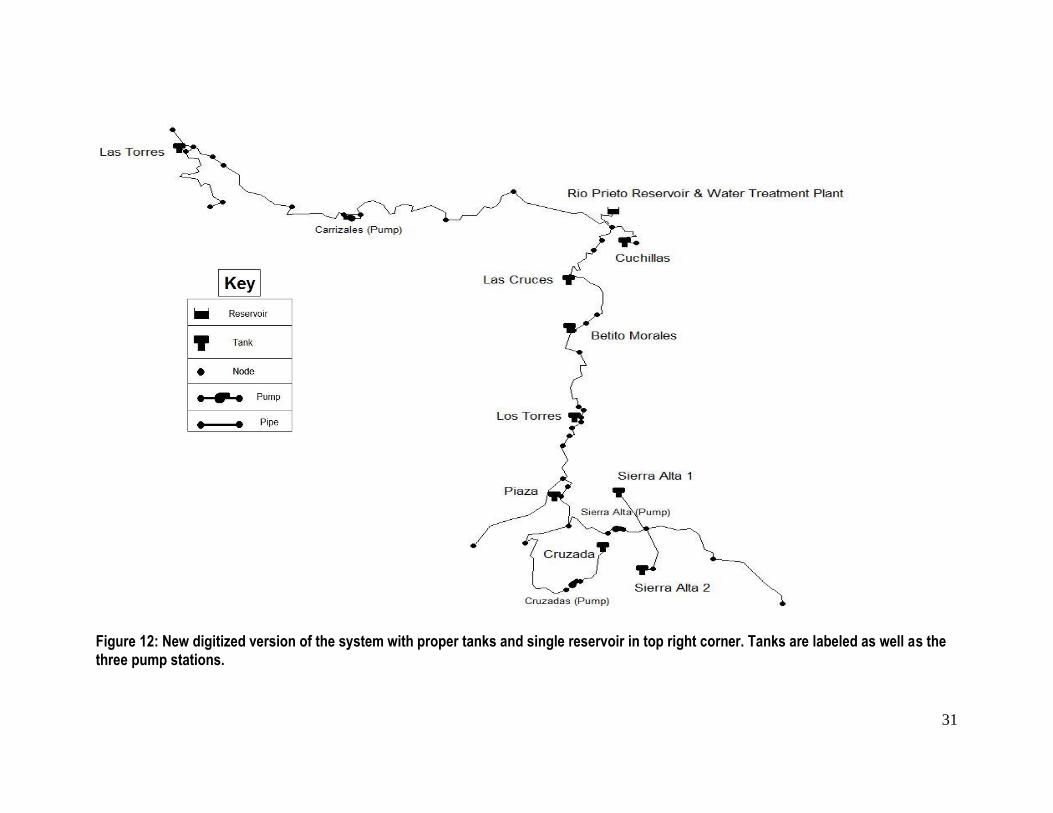
31
Figure 12: New digitized version of the system with proper tanks and single reservoir in top right corner. Tanks are labeled as well as the three pump stations.
32
Figure 13: Existing pipe distribution network.
33
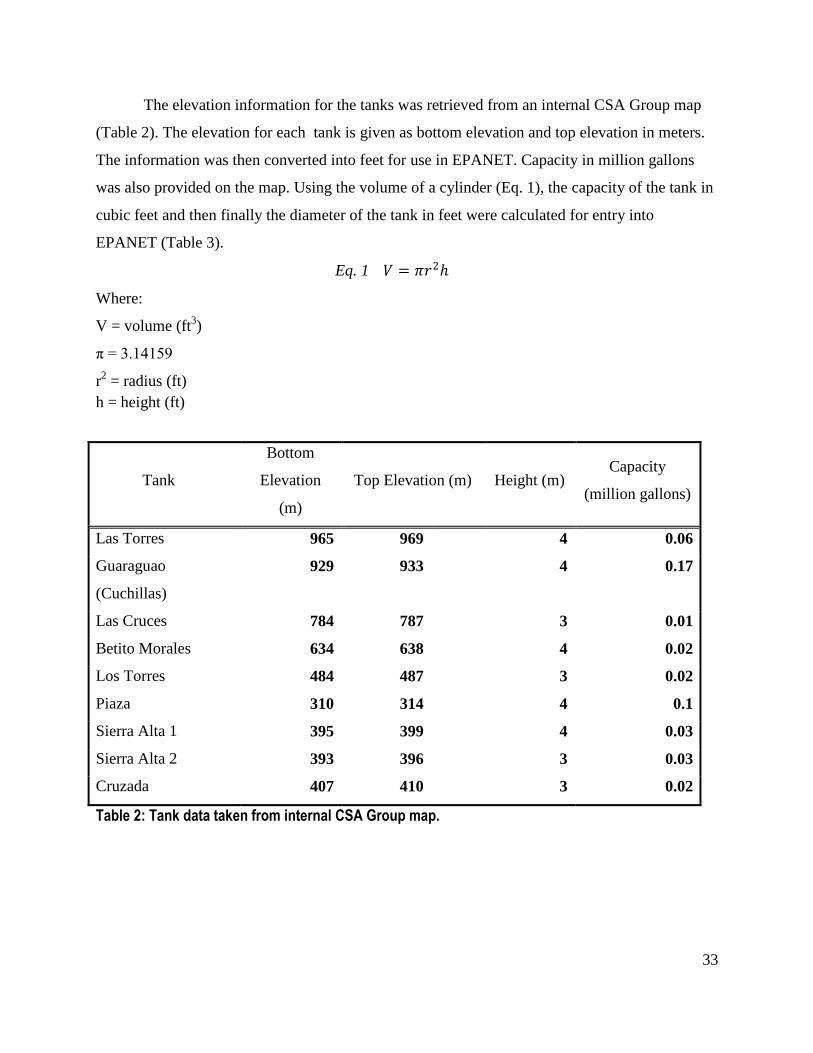
The elevation information for the tanks was retrieved from an internal CSA Group map
(Table 2). The elevation for each tank is given as bottom elevation and top elevation in meters.
The information was then converted into feet for use in EPANET. Capacity in million gallons
was also provided on the map. Using the volume of a cylinder (Eq. 1), the capacity of the tank in
cubic feet and then finally the diameter of the tank in feet were calculated for entry into
EPANET (Table 3).
Eq. 1 𝑉 = 𝜋𝑟2ℎ
Where:
V = volume (ft3)
π = 3.14159
r2 = radius (ft)
h = height (ft)
Tank
Bottom
Elevation
(m)
Top Elevation (m) Height (m) Capacity
(million gallons)
Las Torres 965 969 4 0.06
Guaraguao
(Cuchillas)
929 933 4 0.17
Las Cruces 784 787 3 0.01
Betito Morales 634 638 4 0.02
Los Torres 484 487 3 0.02
Piaza 310 314 4 0.1
Sierra Alta 1 395 399 4 0.03
Sierra Alta 2 393 396 3 0.03
Cruzada 407 410 3 0.02
Table 2: Tank data taken from internal CSA Group map.
34
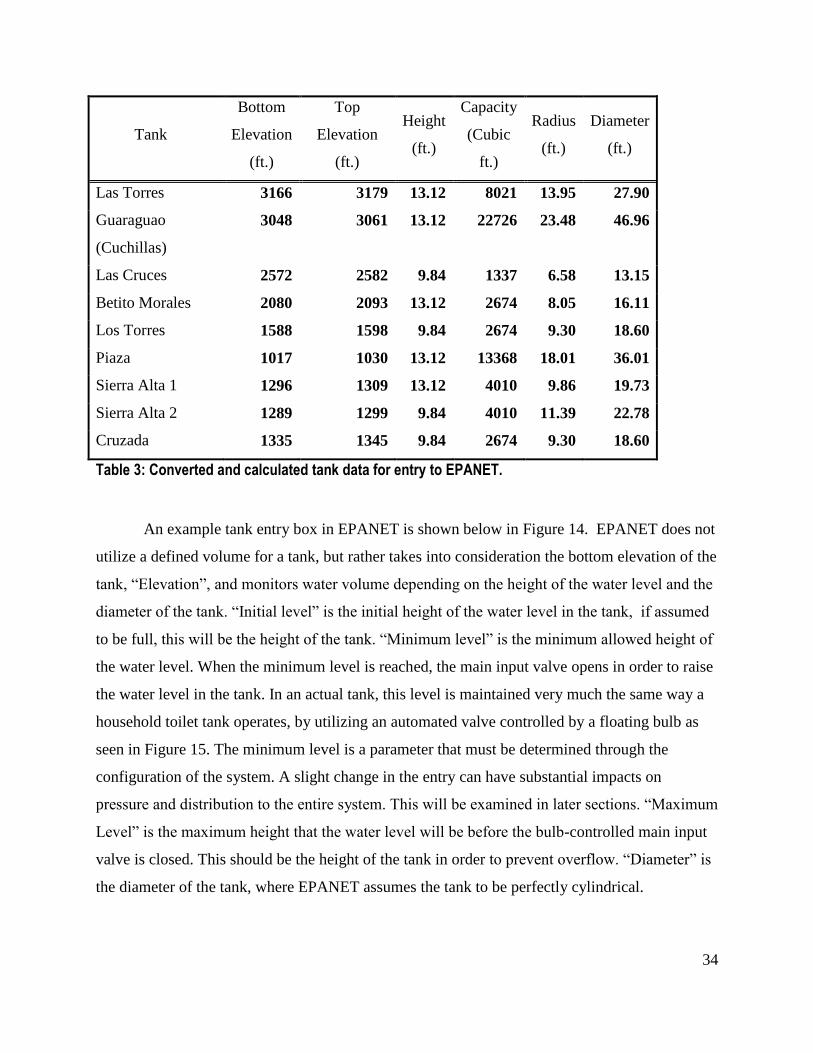
Tank
Bottom
Elevation
(ft.)
Top
Elevation
(ft.)
Height
(ft.)
Capacity
(Cubic
ft.)
Radius
(ft.)
Diameter
(ft.)
Las Torres 3166 3179 13.12 8021 13.95 27.90
Guaraguao
(Cuchillas)
3048 3061 13.12 22726 23.48 46.96
Las Cruces 2572 2582 9.84 1337 6.58 13.15
Betito Morales 2080 2093 13.12 2674 8.05 16.11
Los Torres 1588 1598 9.84 2674 9.30 18.60
Piaza 1017 1030 13.12 13368 18.01 36.01
Sierra Alta 1 1296 1309 13.12 4010 9.86 19.73
Sierra Alta 2 1289 1299 9.84 4010 11.39 22.78
Cruzada 1335 1345 9.84 2674 9.30 18.60
Table 3: Converted and calculated tank data for entry to EPANET.
An example tank entry box in EPANET is shown below in Figure 14. EPANET does not
utilize a defined volume for a tank, but rather takes into consideration the bottom elevation of the
tank, ―Elevation‖, and monitors water volume depending on the height of the water level and the
diameter of the tank. ―Initial level‖ is the initial height of the water level in the tank, if assumed
to be full, this will be the height of the tank. ―Minimum level‖ is the minimum allowed height of
the water level. When the minimum level is reached, the main input valve opens in order to raise
the water level in the tank. In an actual tank, this level is maintained very much the same way a
household toilet tank operates, by utilizing an automated valve controlled by a floating bulb as
seen in Figure 15. The minimum level is a parameter that must be determined through the
configuration of the system. A slight change in the entry can have substantial impacts on
pressure and distribution to the entire system. This will be examined in later sections. ―Maximum
Level‖ is the maximum height that the water level will be before the bulb-controlled main input
valve is closed. This should be the height of the tank in order to prevent overflow. ―Diameter‖ is
the diameter of the tank, where EPANET assumes the tank to be perfectly cylindrical.
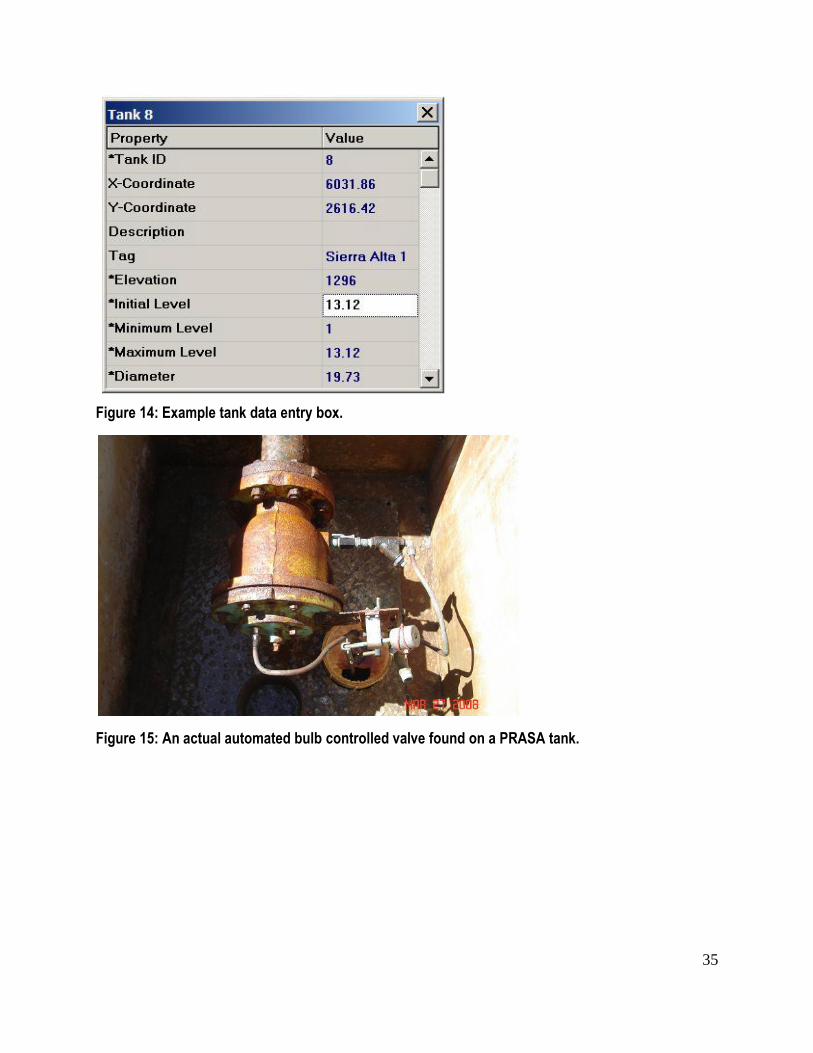
35
Figure 14: Example tank data entry box.
Figure 15: An actual automated bulb controlled valve found on a PRASA tank.
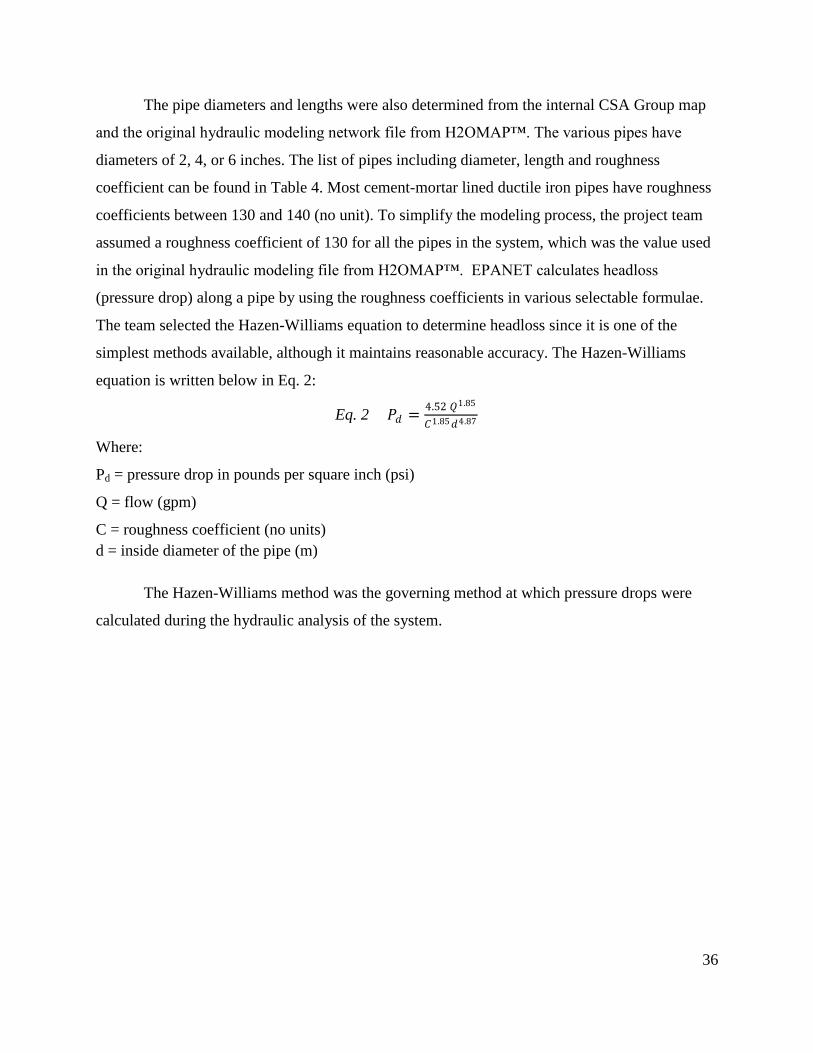
36
The pipe diameters and lengths were also determined from the internal CSA Group map
and the original hydraulic modeling network file from H2OMAP™. The various pipes have
diameters of 2, 4, or 6 inches. The list of pipes including diameter, length and roughness
coefficient can be found in Table 4. Most cement-mortar lined ductile iron pipes have roughness
coefficients between 130 and 140 (no unit). To simplify the modeling process, the project team
assumed a roughness coefficient of 130 for all the pipes in the system, which was the value used
in the original hydraulic modeling file from H2OMAP™. EPANET calculates headloss
(pressure drop) along a pipe by using the roughness coefficients in various selectable formulae.
The team selected the Hazen-Williams equation to determine headloss since it is one of the
simplest methods available, although it maintains reasonable accuracy. The Hazen-Williams
equation is written below in Eq. 2:
Eq. 2 𝑃𝑑 =4.52 𝑄1.85
𝐶1.85𝑑4.87
Where:
Pd = pressure drop in pounds per square inch (psi)
Q = flow (gpm)
C = roughness coefficient (no units)
d = inside diameter of the pipe (m)
The Hazen-Williams method was the governing method at which pressure drops were
calculated during the hydraulic analysis of the system.
37
Table 4: Pipe characteristics throughout the Rio Prieto water distribution network.
38
3.3.2 Expanding the System
Once the existing system was fully digitized, the team expanded the system in order to
model the expansion zones. PRASA and CSA Group know that many of the main pipes
necessary to expand the distribution network to the outlying regions of the Rio Prieto area are
already in place. Unfortunately, the precise locations and operational parameters such as pipe
diameters, and tank and valve configurations are unknown. The extended network was
constructed in an ad hoc fashion over many years and precise records were not maintained.
Consequently, in order to complete the modeling process, the project team had to make
assumptions about the location and extent of the network. The team assumed that most of the
pipes would be located along the routes followed by the local roads. Typically, these roads are
located in the valleys and often mark the boundaries of the different wards or barrios. Google
Earth® was utilized for this analysis, marking nodes along the roads for elevation data (Figure
16). The nodes were placed along the pipe routes in EPANET, and the remainder of the system
was digitized by overlaying pipes with the road and barrio boundaries from the original bitmap
backdrop acquired from CSA Group. The final expanded system was used later for analysis of
the system.

39
Figure 16: Google Earth® screenshot including node placements, new tanks, and dam and filtration plant locations.
40
3.4 Determining the Nature of Public Need
One important objective we assisted PRASA with was observing how their new
customers viewed the company’s services and capabilities. Integrating the pipelines into
PRASA’s infrastructure would mean the CAR Report and QAAA databases would need to be
integrated as well. PRASA needs to ensure that from the day water is being serviced to residents
in the Rio Prieto region, customer feedback and telemetry data will be transmitted
simultaneously.
Conducting interviews with officials and employees of PRASA gave the project team an
idea of how the upper management viewed the importance and priority of our project in relation
to all the other projects PRASA was currently involved with. Our project team also gained
insight as to the direction PRASA was going in and if any more water pipeline connection
projects similar to ours were being planned and/or executed. To attain insight on the project, the
team conducted interviews with our sponsor, Rafael Lama, as well as Ronald Perez and Hugo
Delgado, two upper management officials of the affected areas in the East and South Regions,
respectively.
In addition to the interviews with PRASA officials, information from the US Census
Bureau was accessed. Our project team received a map from CSA Group of the different census
blocks that were affected by the unconnected pipelines. For each municipality, different social,
economic, and cultural factors were obtained, such as median age, median household income,
average household size, and how many families were at the poverty level. Based on these
different characteristics, our project team reported to PRASA the facts and figures of the new
customers. The team was able to notify PRASA of the benefits that the customers could expect
once the connections were complete based on the analysis of several similar projects of rural
water pipeline connections.
Our project team also decided to look at the environmental and social impact of our
project on the residents of the Rio Prieto region. While it was important that the water pipes
supplied water from PRASA’s network improved the lifestyles of the affected residents, our
team wanted to ensure that any benefits to the connection of the pipelines did not come at the
expense of damage done to the environment or unfair costs to the customers.
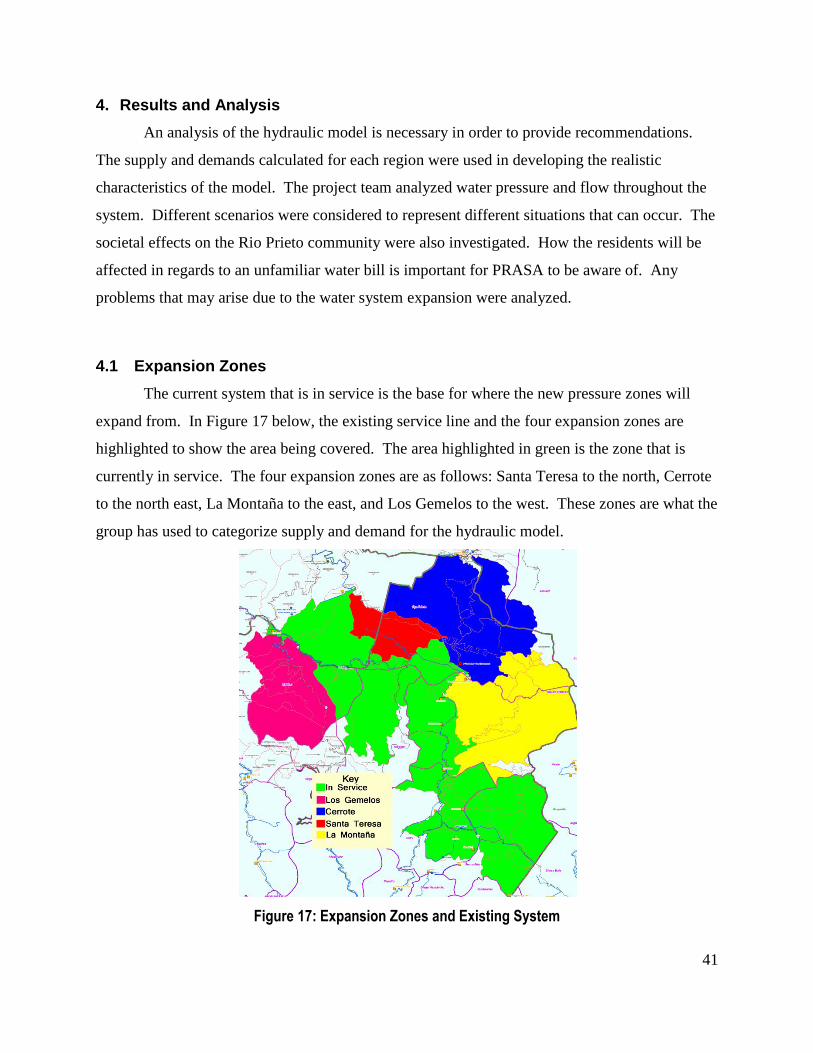
41
4. Results and Analysis
An analysis of the hydraulic model is necessary in order to provide recommendations.
The supply and demands calculated for each region were used in developing the realistic
characteristics of the model. The project team analyzed water pressure and flow throughout the
system. Different scenarios were considered to represent different situations that can occur. The
societal effects on the Rio Prieto community were also investigated. How the residents will be
affected in regards to an unfamiliar water bill is important for PRASA to be aware of. Any
problems that may arise due to the water system expansion were analyzed.
4.1 Expansion Zones
The current system that is in service is the base for where the new pressure zones will
expand from. In Figure 17 below, the existing service line and the four expansion zones are
highlighted to show the area being covered. The area highlighted in green is the zone that is
currently in service. The four expansion zones are as follows: Santa Teresa to the north, Cerrote
to the north east, La Montaña to the east, and Los Gemelos to the west. These zones are what the
group has used to categorize supply and demand for the hydraulic model.
Figure 17: Expansion Zones and Existing System
42
4.2 Demand Calculations
Through the creation of tables and graphs, the project team found the current and
predicted water demands per person. Table 5 below shows the population for each service area,
and the average and maximum demand for those areas for every five years between 2000 and
2025. The demand is in million gallons per day (MGD). The table shows that the additions of
the four service zones will slightly increase the current demand for the lines in place.
Based on the 2000 census data, the population of approximately 3,500 people presently
served in this region consumes about 0.41 MGD of water. Demand is expected to increase to
0.59 MGD by 2025 assuming a steady increase in population, as indicated, and no changes in the
average per capita consumption. Demand for the other four areas was calculated in the same
way, assuming base populations from the 2000 census data. Thus, the total population for the
expansion area will increase from 4,400 in 2000 to 4,900 in 2025, and water demands will
increase from 0.410 MGD in 2000 to 0.744 MGD in 2025.
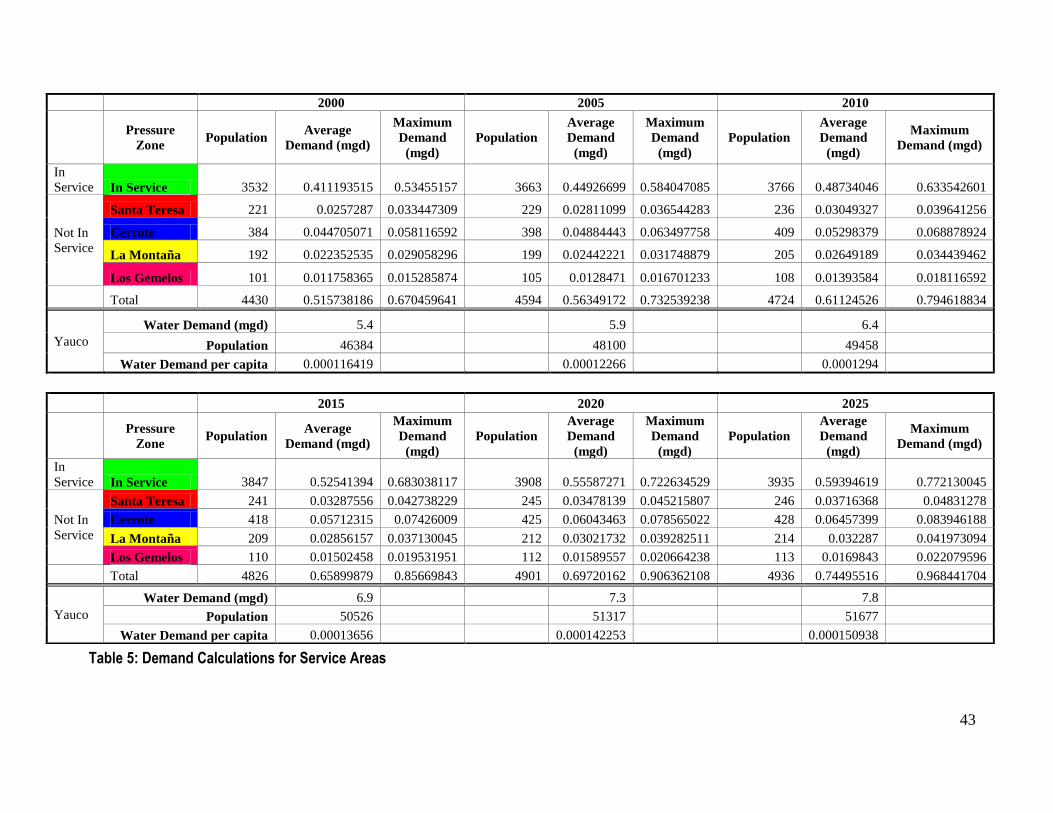
43
2000 2005 2010
Pressure
Zone Population
Average
Demand (mgd)
Maximum
Demand
(mgd)
Population
Average
Demand
(mgd)
Maximum
Demand
(mgd)
Population
Average
Demand
(mgd)
Maximum
Demand (mgd)
In
Service In Service 3532 0.411193515 0.53455157 3663 0.44926699 0.584047085 3766 0.48734046 0.633542601
Not In
Service
Santa Teresa 221 0.0257287 0.033447309 229 0.02811099 0.036544283 236 0.03049327 0.039641256
Cerrote 384 0.044705071 0.058116592 398 0.04884443 0.063497758 409 0.05298379 0.068878924
La Montaña 192 0.022352535 0.029058296 199 0.02442221 0.031748879 205 0.02649189 0.034439462
Los Gemelos 101 0.011758365 0.015285874 105 0.0128471 0.016701233 108 0.01393584 0.018116592
Total 4430 0.515738186 0.670459641 4594 0.56349172 0.732539238 4724 0.61124526 0.794618834
Yauco
Water Demand (mgd) 5.4
5.9
6.4
Population 46384
48100
49458
Water Demand per capita 0.000116419
0.00012266
0.0001294
2015 2020 2025
Pressure
Zone Population
Average
Demand (mgd)
Maximum
Demand
(mgd)
Population
Average
Demand
(mgd)
Maximum
Demand
(mgd)
Population
Average
Demand
(mgd)
Maximum
Demand (mgd)
In
Service In Service 3847 0.52541394 0.683038117 3908 0.55587271 0.722634529 3935 0.59394619 0.772130045
Not In
Service
Santa Teresa 241 0.03287556 0.042738229 245 0.03478139 0.045215807 246 0.03716368 0.04831278
Cerrote 418 0.05712315 0.07426009 425 0.06043463 0.078565022 428 0.06457399 0.083946188
La Montaña 209 0.02856157 0.037130045 212 0.03021732 0.039282511 214 0.032287 0.041973094
Los Gemelos 110 0.01502458 0.019531951 112 0.01589557 0.020664238 113 0.0169843 0.022079596
Total 4826 0.65899879 0.85669843 4901 0.69720162 0.906362108 4936 0.74495516 0.968441704
Yauco
Water Demand (mgd) 6.9 7.3 7.8
Population 50526 51317 51677
Water Demand per capita 0.00013656 0.000142253 0.000150938
Table 5: Demand Calculations for Service Areas

44
The percentage of demand that would be put on the system from each expansion zone is
depicted in Figure 18. The current system, shown in green, makes up a majority of the demand
put on the system. Even though the other four zones may make up a relatively small percentage
of demand there are still other factors that need to be taken into account such as elevation and
pressure. These factors are addressed in the hydraulic model that follows.
Figure 18: The percentage of demand each zone would put on the existing system
4.3 Supply Calculations
Through an interview with Ronald Perez, the project team learned that the average water
supplied by the Rio Prieto Filtration Plant is 0.40 MGD. Table 6 below illustrates the supply
available and the average demand on the system. Future supply and demand predictions are
given to see if the system is functional in the future. The future supply is based on any plans to
increase the water supply by expanding a filtration plant or building a new one. According to
Adamaris Quiñones, there is a plan to improve the Rio Prieto Filtration Plant by expanding the
plant to supply 1.5 MGD. The expansion was taken into account starting in the year 2010. The
demands were taken from those calculated in Table 5. The Rio Prieto system is very simple in
that there are no other water supplies for it. Normally there are wells, other filtration plants, or
transfers that send extra water to the system. The demand is subtracted from the supply to show
the difference. The average difference is calculated using the average daily demand and the
In Service
80%
Santa Teresa
5%
Cerrote
9%
La Montaña
4%
Los Gemelos
2%
Percentage of Water Demand By
Zones

45
maximum difference is calculated using the maximum day demand. It is clear that currently
there is more demand than supply. The negative difference means that some people may not
receive the water they need.

46
Municipal Supply Sources Production 2007
(mgd)
Production
Capacity
2005 (mgd)
Production
Capacity
2010 (mgd)
Production
Capacity
2015 (mgd)
Production
Capacity
2020 (mgd)
Production
Capacity
2025
(mgd)
Production
Capacity 2025
with 15%
Reduction of
Losses (mgd)
Yauco Rio Prieto PF 0.40 0.40 1.50 1.50 1.50 1.50 1.28
Subtotal Supply 0.40 0.40 1.50 1.50 1.50 1.50 1.28
Average Demand 0.52 0.56 0.61 0.66 0.70 0.74 0.74
Totals Maximum Day
Demand 0.67 0.73 0.79 0.86 0.91 0.97 0.97
Total Supply 0.40 0.4 1.50 1.50 1.50 1.50 1.28
Average Demand 0.52 0.56 0.61 0.66 0.70 0.74 0.74
Maximum Day
Demand
0.67 0.73 0.79 0.86 0.91 0.97 0.97
Average
Surplus/Deficiency
-0.12 -0.16 0.89 0.84 0.80 0.76 0.53
Maximum
Surplus/Deficiency
-0.27 -0.33 0.71 0.64 0.59 0.53 0.31
Table 6: Supply of Existing System
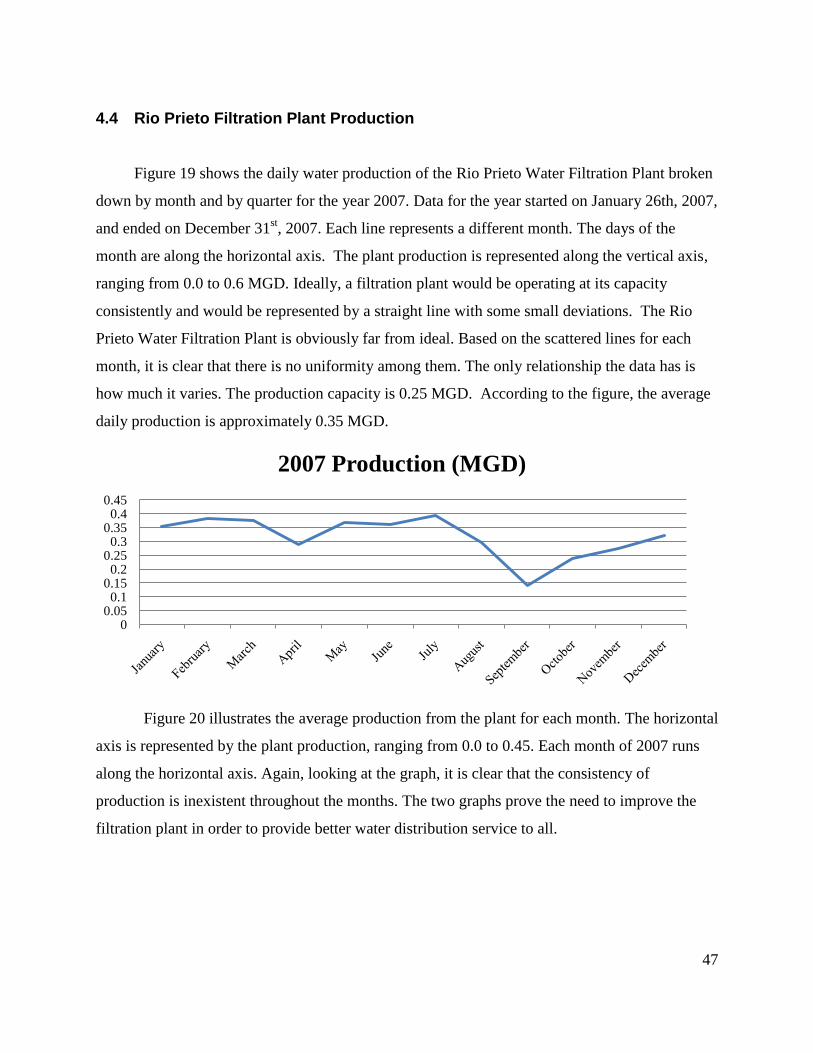
47
4.4 Rio Prieto Filtration Plant Production
Figure 19 shows the daily water production of the Rio Prieto Water Filtration Plant broken
down by month and by quarter for the year 2007. Data for the year started on January 26th, 2007,
and ended on December 31st, 2007. Each line represents a different month. The days of the
month are along the horizontal axis. The plant production is represented along the vertical axis,
ranging from 0.0 to 0.6 MGD. Ideally, a filtration plant would be operating at its capacity
consistently and would be represented by a straight line with some small deviations. The Rio
Prieto Water Filtration Plant is obviously far from ideal. Based on the scattered lines for each
month, it is clear that there is no uniformity among them. The only relationship the data has is
how much it varies. The production capacity is 0.25 MGD. According to the figure, the average
daily production is approximately 0.35 MGD.
Figure 20 illustrates the average production from the plant for each month. The horizontal
axis is represented by the plant production, ranging from 0.0 to 0.45. Each month of 2007 runs
along the horizontal axis. Again, looking at the graph, it is clear that the consistency of
production is inexistent throughout the months. The two graphs prove the need to improve the
filtration plant in order to provide better water distribution service to all.
00.05
0.10.15
0.20.25
0.30.35
0.40.45
2007 Production (MGD)

48
Figure 19: Water production by month for each quarter for Rio Prieto Water Filtration Plant
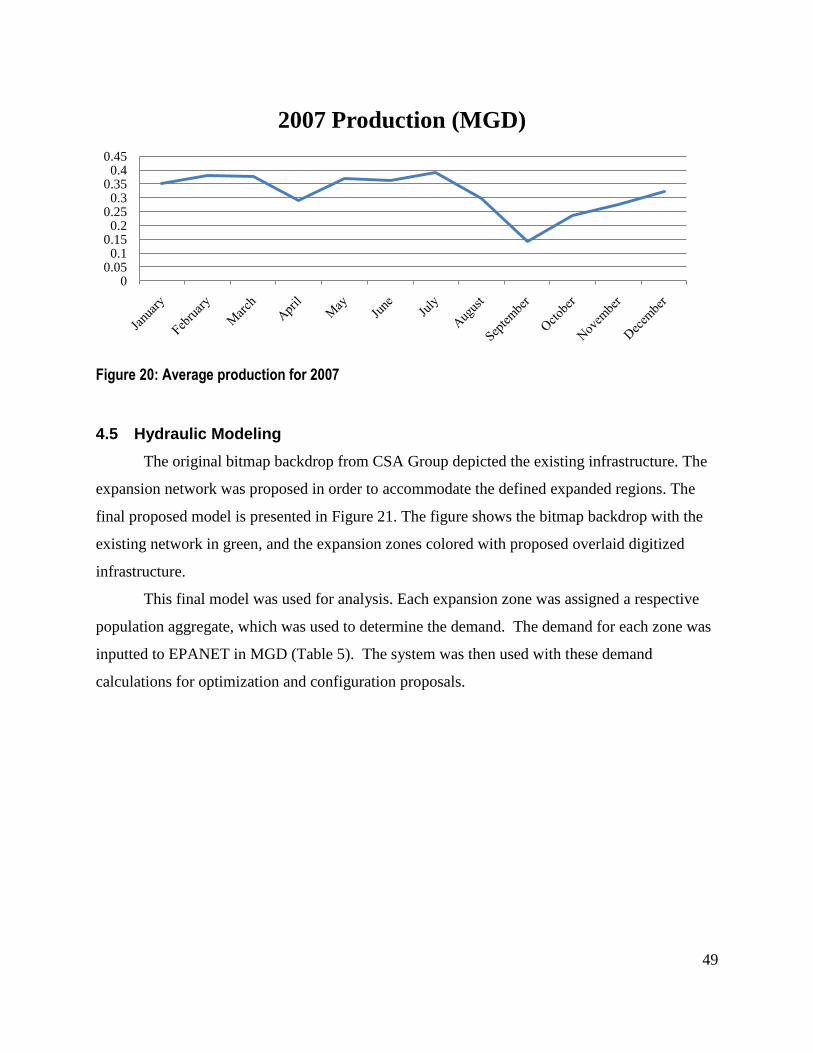
49
Figure 20: Average production for 2007
4.5 Hydraulic Modeling
The original bitmap backdrop from CSA Group depicted the existing infrastructure. The
expansion network was proposed in order to accommodate the defined expanded regions. The
final proposed model is presented in Figure 21. The figure shows the bitmap backdrop with the
existing network in green, and the expansion zones colored with proposed overlaid digitized
infrastructure.
This final model was used for analysis. Each expansion zone was assigned a respective
population aggregate, which was used to determine the demand. The demand for each zone was
inputted to EPANET in MGD (Table 5). The system was then used with these demand
calculations for optimization and configuration proposals.
00.05
0.10.15
0.20.25
0.30.35
0.40.45
2007 Production (MGD)
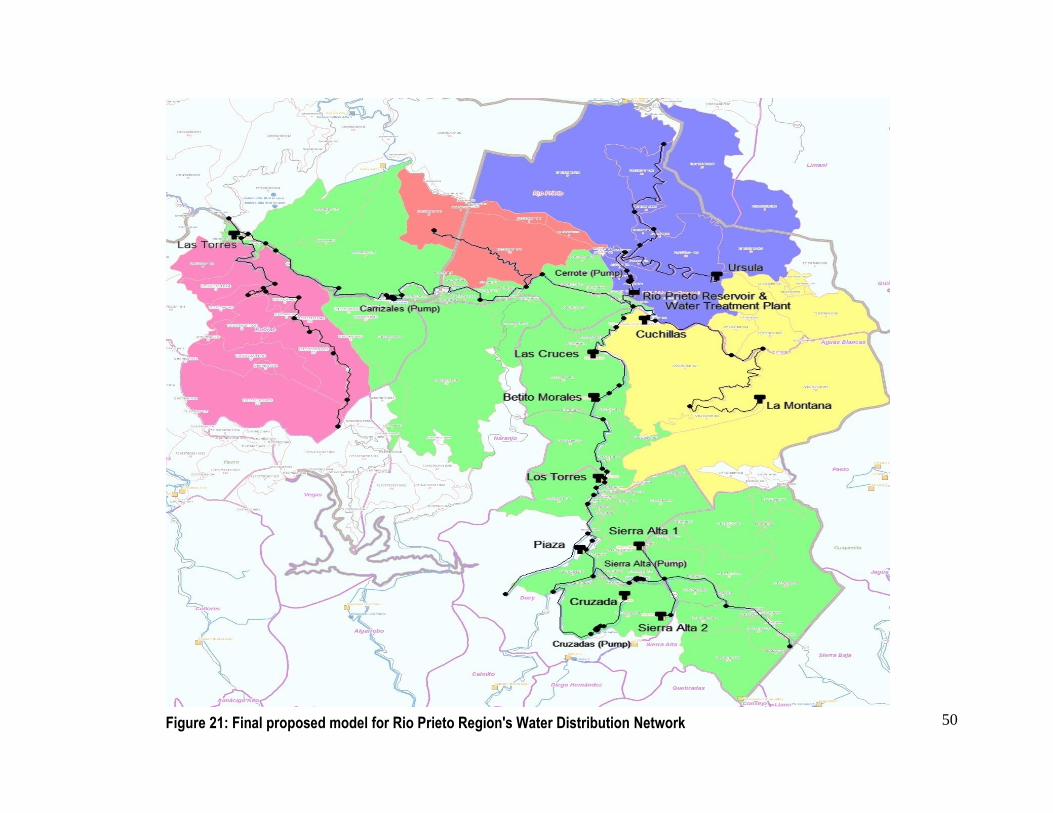
50
Figure 21: Final proposed model for Rio Prieto Region's Water Distribution Network
51
4.6 Social, Economic, Cultural, and Political Concerns
Given the history, PRASA expects that there may be a variety of socioeconomic, cultural,
and political issues in addition to the likely technical issues. The obstacles will need to be
overcome in the process of expanding the Rio Prieto distribution network.
The Census information indicated the expansion area near Rio Prieto to have a higher
household density when compared to Yauco or Puerto Rico but have lower household incomes.
The affected population also has a high percentage of people that never completed schooling,
and most of the affected population lives in rural areas separated by long distances and high
altitudes on hillsides. PRASA needs to take all of these factors into account when considering
how to complete its water supply expansion and water service connection project. Many of the
non-PRASA system conversion projects failed in the past mostly due to a lack of
communication. Communication between the community and PRASA was the single greatest
obstacle as the population often did not understand what PRASA’s intentions were and why it
was eliminating their non-PRASA system. Because PRASA needed to physically dismantle or
destroy the community’s connection to the non-PRASA system, the community also felt attacked
and could not understand why a system that had been in place for generations now had to be
abandoned. PRASA will finally need to ensure rates, fees, charges, and billing information are
all conveyed clearly and without confusion. Some of the communities never had to pay for
water before and were understandably upset when a free commodity suddenly came at a cost.
PRASA has long had an uneasy history in its efforts to bring water for all and while the
Agua Para Todos (APT) project was a good initiative, it lacked the political force to remain
effective over the long term. With the changeover in administrations at both the State and
Municipal level, many forgot the efforts of APT or simply abandoned them (Maldonado, 2008;
Perez, 2008). To ensure long-term projects are not abandoned in such a manner, it is important
for PRASA to apply steady pressure in keeping the local governments informed about their
efforts to bring water service into a region within a municipality. Projects such as the Rio Prieto
expansion through APT are great things that improve a community’s lifestyle but without the
sufficient funds, clear communication, and political backing, these projects come to a standstill
and pipes that are ready to start deliver water to all simply remain dry.
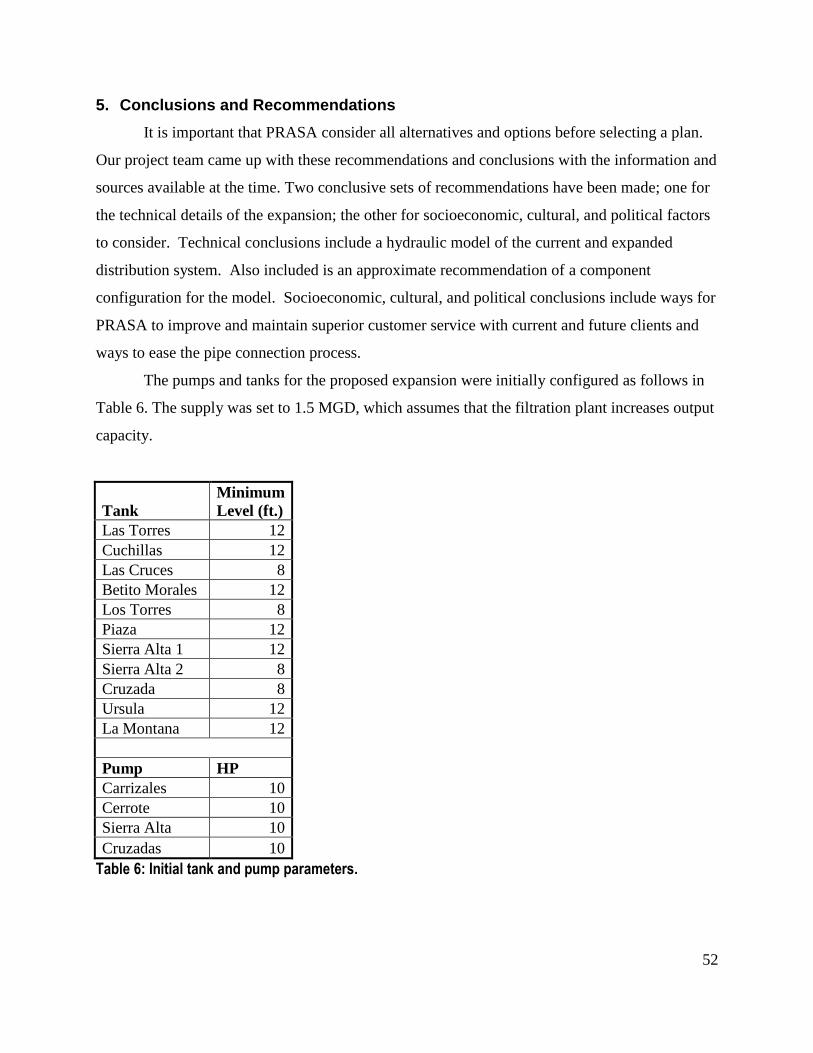
52
5. Conclusions and Recommendations
It is important that PRASA consider all alternatives and options before selecting a plan.
Our project team came up with these recommendations and conclusions with the information and
sources available at the time. Two conclusive sets of recommendations have been made; one for
the technical details of the expansion; the other for socioeconomic, cultural, and political factors
to consider. Technical conclusions include a hydraulic model of the current and expanded
distribution system. Also included is an approximate recommendation of a component
configuration for the model. Socioeconomic, cultural, and political conclusions include ways for
PRASA to improve and maintain superior customer service with current and future clients and
ways to ease the pipe connection process.
The pumps and tanks for the proposed expansion were initially configured as follows in
Table 6. The supply was set to 1.5 MGD, which assumes that the filtration plant increases output
capacity.
Tank
Minimum
Level (ft.)
Las Torres 12
Cuchillas 12
Las Cruces 8
Betito Morales 12
Los Torres 8
Piaza 12
Sierra Alta 1 12
Sierra Alta 2 8
Cruzada 8
Ursula 12
La Montana 12
Pump HP
Carrizales 10
Cerrote 10
Sierra Alta 10
Cruzadas 10
Table 6: Initial tank and pump parameters.
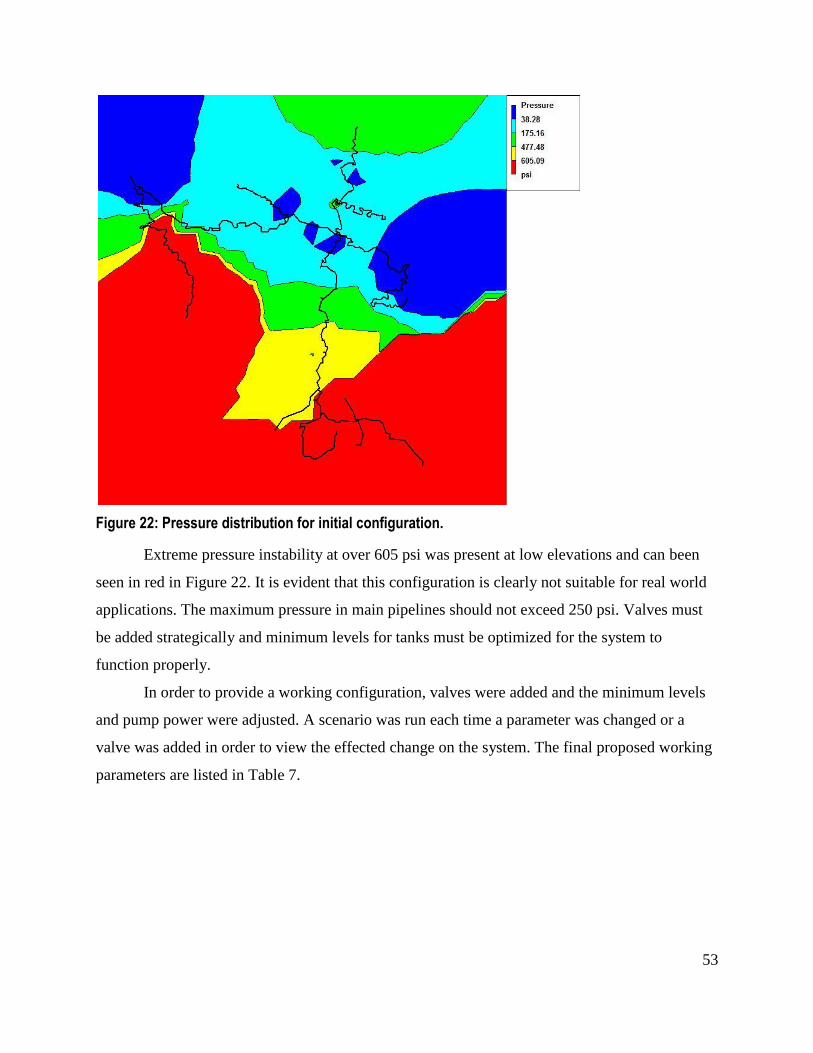
53
Figure 22: Pressure distribution for initial configuration.
Extreme pressure instability at over 605 psi was present at low elevations and can been
seen in red in Figure 22. It is evident that this configuration is clearly not suitable for real world
applications. The maximum pressure in main pipelines should not exceed 250 psi. Valves must
be added strategically and minimum levels for tanks must be optimized for the system to
function properly.
In order to provide a working configuration, valves were added and the minimum levels
and pump power were adjusted. A scenario was run each time a parameter was changed or a
valve was added in order to view the effected change on the system. The final proposed working
parameters are listed in Table 7.
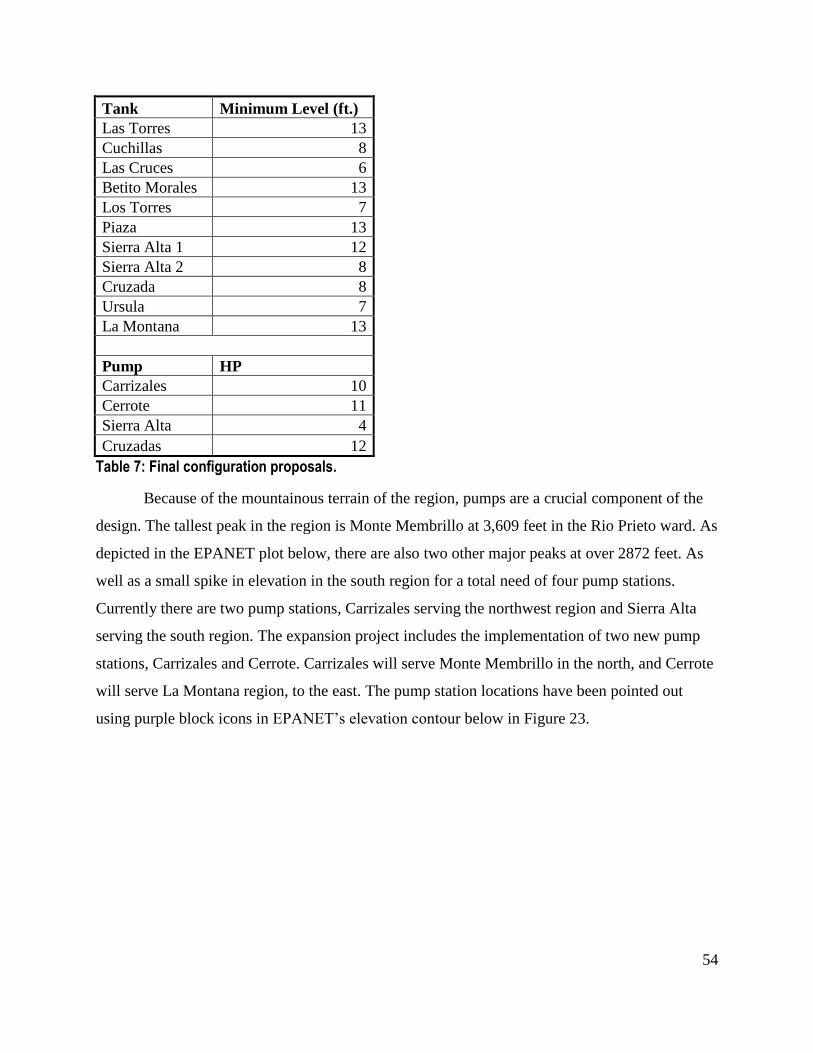
54
Tank Minimum Level (ft.)
Las Torres 13
Cuchillas 8
Las Cruces 6
Betito Morales 13
Los Torres 7
Piaza 13
Sierra Alta 1 12
Sierra Alta 2 8
Cruzada 8
Ursula 7
La Montana 13
Pump HP
Carrizales 10
Cerrote 11
Sierra Alta 4
Cruzadas 12
Table 7: Final configuration proposals.
Because of the mountainous terrain of the region, pumps are a crucial component of the
design. The tallest peak in the region is Monte Membrillo at 3,609 feet in the Rio Prieto ward. As
depicted in the EPANET plot below, there are also two other major peaks at over 2872 feet. As
well as a small spike in elevation in the south region for a total need of four pump stations.
Currently there are two pump stations, Carrizales serving the northwest region and Sierra Alta
serving the south region. The expansion project includes the implementation of two new pump
stations, Carrizales and Cerrote. Carrizales will serve Monte Membrillo in the north, and Cerrote
will serve La Montana region, to the east. The pump station locations have been pointed out
using purple block icons in EPANET’s elevation contour below in Figure 23.
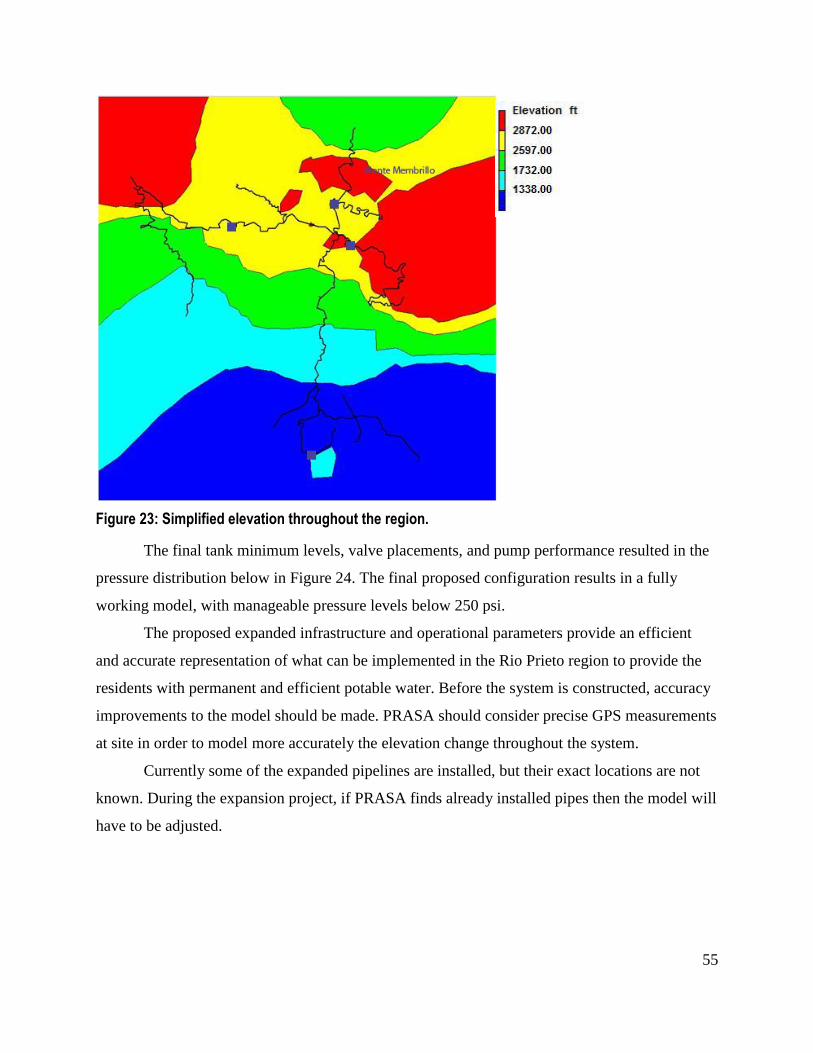
55
Figure 23: Simplified elevation throughout the region.
The final tank minimum levels, valve placements, and pump performance resulted in the
pressure distribution below in Figure 24. The final proposed configuration results in a fully
working model, with manageable pressure levels below 250 psi.
The proposed expanded infrastructure and operational parameters provide an efficient
and accurate representation of what can be implemented in the Rio Prieto region to provide the
residents with permanent and efficient potable water. Before the system is constructed, accuracy
improvements to the model should be made. PRASA should consider precise GPS measurements
at site in order to model more accurately the elevation change throughout the system.
Currently some of the expanded pipelines are installed, but their exact locations are not
known. During the expansion project, if PRASA finds already installed pipes then the model will
have to be adjusted.
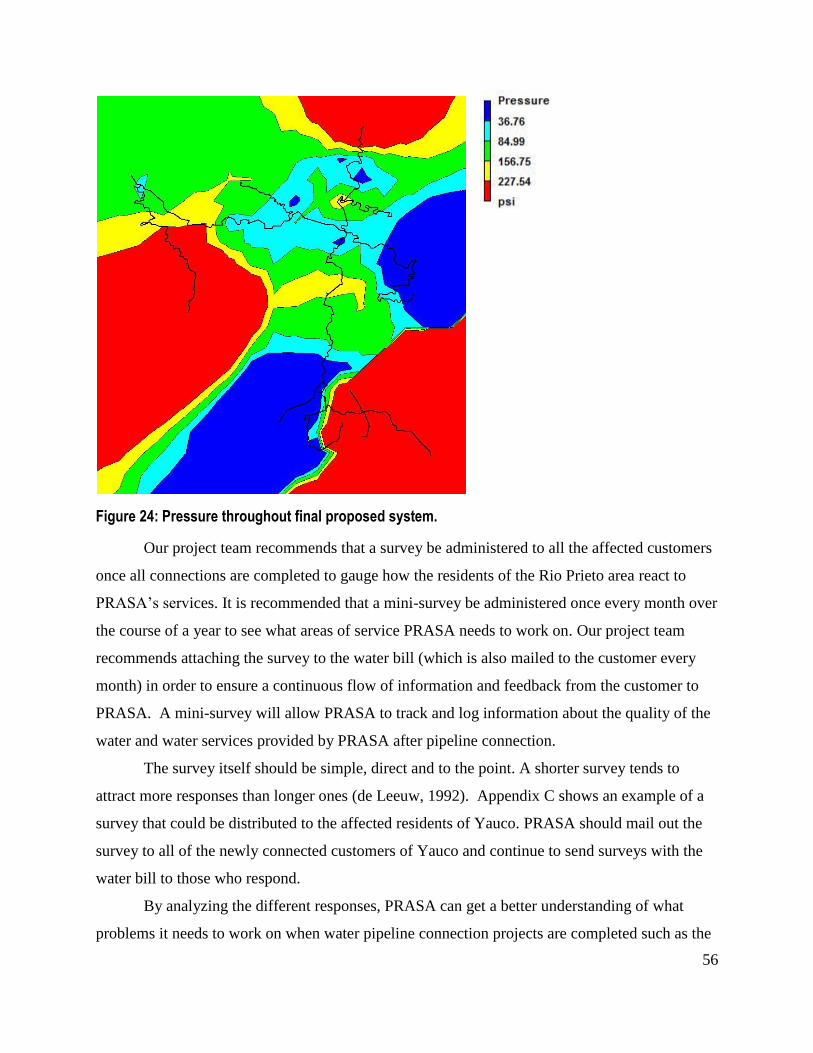
56
Figure 24: Pressure throughout final proposed system.
Our project team recommends that a survey be administered to all the affected customers
once all connections are completed to gauge how the residents of the Rio Prieto area react to
PRASA’s services. It is recommended that a mini-survey be administered once every month over
the course of a year to see what areas of service PRASA needs to work on. Our project team
recommends attaching the survey to the water bill (which is also mailed to the customer every
month) in order to ensure a continuous flow of information and feedback from the customer to
PRASA. A mini-survey will allow PRASA to track and log information about the quality of the
water and water services provided by PRASA after pipeline connection.
The survey itself should be simple, direct and to the point. A shorter survey tends to
attract more responses than longer ones (de Leeuw, 1992). Appendix C shows an example of a
survey that could be distributed to the affected residents of Yauco. PRASA should mail out the
survey to all of the newly connected customers of Yauco and continue to send surveys with the
water bill to those who respond.
By analyzing the different responses, PRASA can get a better understanding of what
problems it needs to work on when water pipeline connection projects are completed such as the
57
one being done in Rio Prieto. PRASA can also use the available information to tailor its services
to the problems that have highest priority for the customers in the Rio Prieto area. Because
repairs and maintenance will be limited by PRASA’s capabilities and time constraints, survey
responses, along with information from QAAA and the CAR Reports can give PRASA an
overall picture of the problems that are affecting the newly connected customers as well as ones
that can arise in the future. The residents of the Rio Prieto area might have a more vested
interest in the quality of their water and the services provided by PRASA if the residents feel that
their opinions are being heard and considered by PRASA.
PRASA should also consider implementing a ―grace period‖. Our project team was
advised by Rafael Lama that several municipal governments paid the water bill for some of its
residents because water meters were not installed or not reliable. According to 2000 National
Census Data, more than 70% of the households in the affected barrios of Rio Prieto are
considered to be ―at poverty level or lower.‖ Because of poverty status, the customers of the Rio
Prieto area might not understand the water bill and its breakdown, and PRASA should take great
care to convey water fees as clearly as possible through posters or flyers throughout the affected
areas. PRASA bills its customers by reading the water meter every two months and then dividing
the water bill so that the customer is billed for half the first month and the other half the second
month (Acosta, 2008). A grace period of two months, where the affected customer is allowed to
defer payments for two months, would be advisable for PRASA to implement. Two months
would allow the customer to get adjusted to PRASA’s billing cycle while simultaneously setting
a clear deadline for the customer to follow.
Unless the community specifically wants PRASA to stay out, PRASA can and should
take the initiative to eliminate as many non-PRASA water distribution systems as possible.
Doing so will allow PRASA to implement a safer water supply by tracking and controlling the
different sources of water available. Filtration, decontamination and purification can all be
standardized and integrated into PRASA’s network. Elimination of non-PRASA water
distribution systems can simultaneously avoid discrepancies in the treatment of water and allow
PRASA to retain a better control of water supply on the residents of Puerto Rico.
PRASA has an important position in Puerto Rico as the main water distributor. One of its
most important missions for the residents is equally important for water utility companies around
the world: to safeguard and secure a reliable and dependable source of potable water for human

58
consumption. PRASA can project an image of a positive, active water utility company—one that
is going out of its way to help the residents of Puerto Rico maintain access to a safe and reliable
water supply.
59
References
(2008). Retrieved January 21, 2008, from Autoridad de Acueductos y Alcantarillados de Puerto
Rico: http://www.acueductospr.com/index.htm
Adults are from Earth; Children are from the Moon. (2004). Retrieved February 2008, from
White Hutchinson Leisure & Learning Group:
http://www.whitehutchinson.com/children/articles/earthmoon.shtml
Black & Veatch PMC Team. (2006). Rio Prieto Filtration Plant, Raw Water and Distribution
System: Preliminary Engineering Report. Yauco, Puerto Rico.
Cai, A. (2007, August 5). Map of the 78 municipalities of Puerto Rico. Retrieved April 26, 208,
from
http://commons.wikimedia.org/wiki/Image:Map_of_the_78_municipalities_of_Puerto_Ri
co.png
Clean Water Act. (2007, September). Retrieved February 2008, from United States
Environmental Protection Agency: http://www.epa.gov/r5water/cwa.htm
Cornell, R. A., & Dunphy, J. (2005). Water Distribution System Asset Management. Retrieved
January 2008, from American Water Works Association:
http://www.hatchmott.com/documents/adobe/Cornell%20-
%20Water%20Distribution%20System%20Asset%20Management.pdf
Daigneault, M., & Guerin, P. (2008, January 28). Worcester DPW. (E. Carey, R. Jaimes, F.
Song, & M. Woods, Interviewers)
de Leeuw, E. D. (1992). Data Quality in Mail, Telephone and Face to Face Surveys.
Amsterdam: T. T. Publikaties.
Environmental Protection Agency. (2008, March). Retrieved March 2008, from
http://www.epa.gpv/nrmrl/wswrd/dw/epanet.html
Gale, T. (2006). History Of Water Treatment. Retrieved February 2008, from Water Treatment:
http://www.pollutionissues.com/Ve-Z/Water-Treatment.html
Hanna, Risden, & Alexander. (1997). Guidelines for Usability Testing with Children.
Interactions , 9-14.
Ingeduld, P., Svitak, Z., Pradhan, A., & Tarai, A. (August 2006). Modeling Intermittent Water
Supply Systems with EPANET. 8th Annual WD Symposium. Cincinnati.
60
Kayaga, S., & Franceys, R. (2006, December 2006). Costs of urban utility water connections:
Excessive burden to the poor. Utilities Policy .
Kim, S. H., Choi, S. H., Koo, J. Y., Choi, S. I., & Hyun, I. H. (2007). Trend analysis of domestic
water consumption depending upon social, cultural, economic parameters. Water Science
& Technology: Water Supply , 61-68.
Maldonado, C. (2008, April 21). Environmental Scientist, Non-PRASA Program Coordinator.
(F. Song, Interviewer)
Marsh, D., Ryan, T., & Wesolowski, D. (2006). Water Flow Meter Replacement. Worcester:
WPI.
Mays, L. W. (2000). Water Distribution System Handbook. McGraw-Hill.
Najjaran, H., Sadiq, R., & Rajani, B. (2004). Modeling pipe deterioration using soil properties –
an application of fuzzy logic expert system. ACSE International Conference on Pipeline
Engineering and Construction , 1-10.
National Academy of Engineering. (2008). Water Supply & Distribution III - Thirsty Cities.
Retrieved February 2008, from Greatest Engineering Achievements of the 20th Century:
http://www.greatachievements.org/?id=3616
Ohlsson, L. (2000). Physics and Chemistry of the Earth, Part B: Hydrology, Oceans &
Atmosphere . Water Conflicts and Social Resource Scarcity , 213-220.
Olaya, M. (2008, April). (E. Carey, M. Woods, F. Song, & R. Jaimes, Interviewers)
Pelletier, G., Mailhot, A., & Villeneuve, J.-P. (2003, March). Modeling Water Pipe Breaks—
Three Case Studies. JOURNAL OF WATER RESOURCES PLANNING AND
MANAGEMENT , 115-123.
Perez, R. (2008, March 28). Rio Prieto Water Distribution System. (F. Song, & M. Woods,
Interviewers)
Puerto Rico and the U. S. Virgin Islands Regional Summary. (2005, May 25). Retrieved January
2008, from Ground Water Atlas of the United States:
http://capp.water.usgs.gov/gwa/index.html
Puerto Rico Aqueduct and Sewer Authority (PRASA) Pollutant Discharge Settlement. (2003,
March). Retrieved February 2008, from United States Environmental Protection Agency:
http://www.epa.gov/Compliance/resources/cases/civil/cwa/prasa.html
61
Repetto, R. (2004, December). Environmental Sustainability in Puerto Rico: Assessments,
Options and Opportunities. Retrieved January 2008, from
http://www.heller.brandeis.edu/sid/downloads/prenviron.pdf
Rodrigues, E. (2006, June 22). Puerto Rico Aqueduct andd Sewer Authority Indicted for
Environmental Crimes. Retrieved February 2008, from United States Environmental
Protection Agency:
http://yosemite.epa.gov/opa/admpress.nsf/7144dd430c47561885257018004c77a3/f120c4
f065c8bce685257195006a1831!OpenDocument
Royer, M. D. (2005). White Paper on Improvement of Structural Integrity Monitoring for
Drinking Water Mains. Retrieved February 7, 2008, from EPA:
http://www.epa.gov/nrmrl/pubs/600r05038/600r05038.pdf
Ruijs, A., Zimmermann, A., & van den Berg, M. (2007, March 13). Demand and distributional
effects of water pricing policies. Ecological Economies .
United States Department of Justice. (2008, April). Retrieved April 2008, from
http://www.usdoj.gov/
Vision. (2008). Retrieved January 2008, from One Laptop Per Child: http://www.laptop.org/
Water Distribution System. (2003). Retrieved February 2008, from Anne Arundel County,
Maryland: Citizens Information Center:
http://www.aacounty.org/DPW/Utilities/waterDistribution.cfm
Water Distribution System. (2003). Retrieved January 2008, from Anne Arundel County,
Maryland: Citizens Information Center:
http://www.aacounty.org/DPW/Utilities/waterDistribution.cfm
Yauco...Land of Coffee. (n.d.). Retrieved March 24, 2008, from Link t Puerto Rico.com:
http://www.linktopr.com/yauco_e.html
YORK, M. A. (2006, September 22). NATIONAL FEDERATION OF MUNICIPAL
ANALYSTS.
Zhou, S. L., McMahon, T. A., Walton, A., & Lewis, J. (2000). Forecasting daily urban water
demand: a case study of Melbourne. Journal of Hydrology , 153-164.
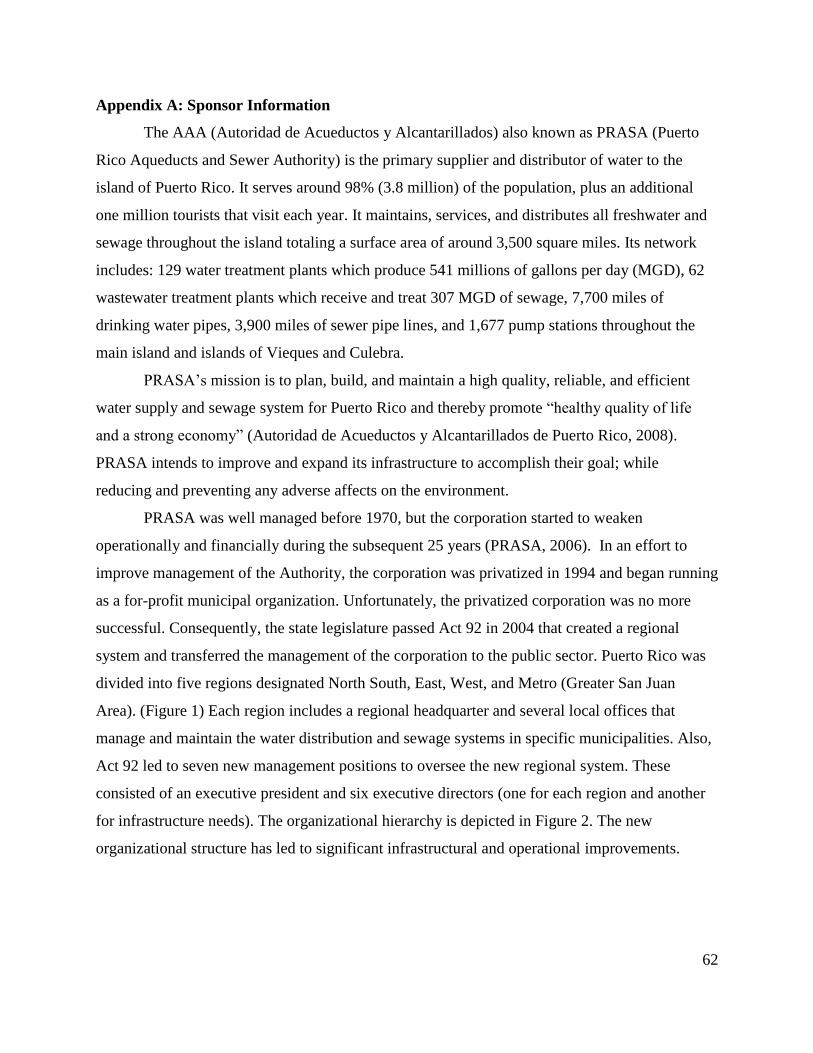
62
Appendix A: Sponsor Information
The AAA (Autoridad de Acueductos y Alcantarillados) also known as PRASA (Puerto
Rico Aqueducts and Sewer Authority) is the primary supplier and distributor of water to the
island of Puerto Rico. It serves around 98% (3.8 million) of the population, plus an additional
one million tourists that visit each year. It maintains, services, and distributes all freshwater and
sewage throughout the island totaling a surface area of around 3,500 square miles. Its network
includes: 129 water treatment plants which produce 541 millions of gallons per day (MGD), 62
wastewater treatment plants which receive and treat 307 MGD of sewage, 7,700 miles of
drinking water pipes, 3,900 miles of sewer pipe lines, and 1,677 pump stations throughout the
main island and islands of Vieques and Culebra.
PRASA’s mission is to plan, build, and maintain a high quality, reliable, and efficient
water supply and sewage system for Puerto Rico and thereby promote ―healthy quality of life
and a strong economy‖ (Autoridad de Acueductos y Alcantarillados de Puerto Rico, 2008).
PRASA intends to improve and expand its infrastructure to accomplish their goal; while
reducing and preventing any adverse affects on the environment.
PRASA was well managed before 1970, but the corporation started to weaken
operationally and financially during the subsequent 25 years (PRASA, 2006). In an effort to
improve management of the Authority, the corporation was privatized in 1994 and began running
as a for-profit municipal organization. Unfortunately, the privatized corporation was no more
successful. Consequently, the state legislature passed Act 92 in 2004 that created a regional
system and transferred the management of the corporation to the public sector. Puerto Rico was
divided into five regions designated North South, East, West, and Metro (Greater San Juan
Area). (Figure 1) Each region includes a regional headquarter and several local offices that
manage and maintain the water distribution and sewage systems in specific municipalities. Also,
Act 92 led to seven new management positions to oversee the new regional system. These
consisted of an executive president and six executive directors (one for each region and another
for infrastructure needs). The organizational hierarchy is depicted in Figure 2. The new
organizational structure has led to significant infrastructural and operational improvements.
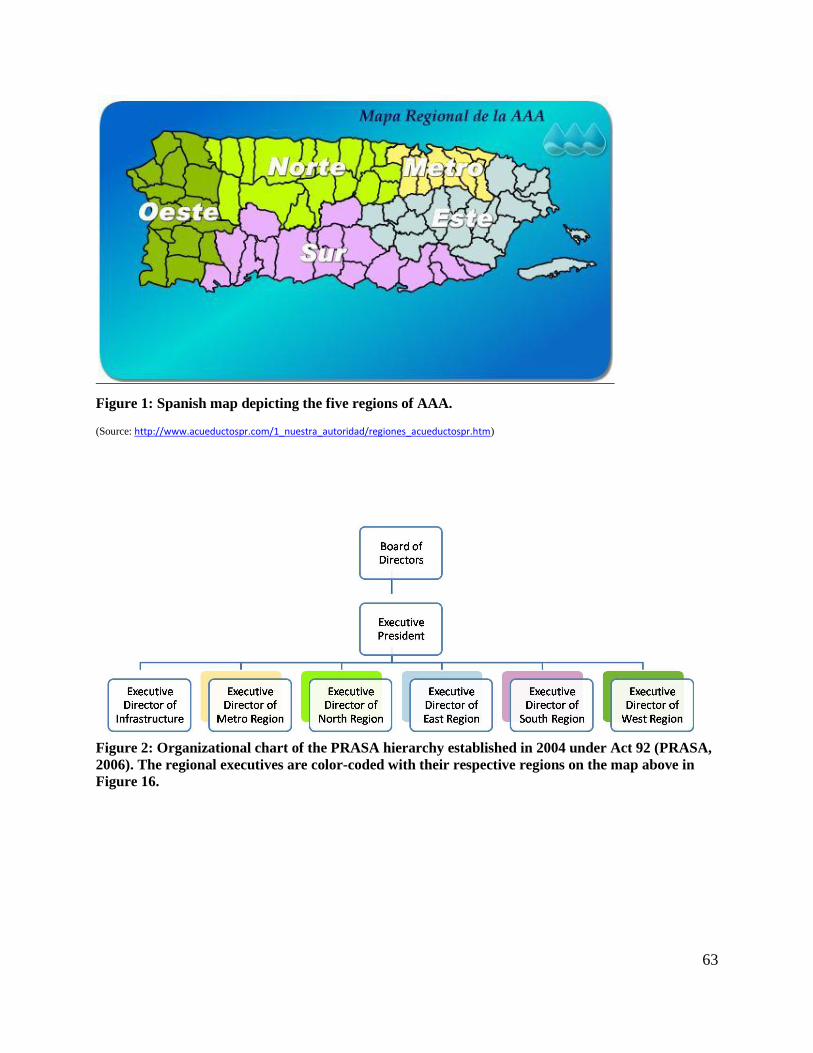
63
Figure 1: Spanish map depicting the five regions of AAA.
(Source: http://www.acueductospr.com/1_nuestra_autoridad/regiones_acueductospr.htm)
Figure 2: Organizational chart of the PRASA hierarchy established in 2004 under Act 92 (PRASA,
2006). The regional executives are color-coded with their respective regions on the map above in
Figure 16.
64
PRASA is currently undergoing huge changes and renovations throughout its
infrastructure. In order for PRASA to achieve its mission, it has set three goals. These goals
include (PRASA, 2006):
Obtaining the trust of the Puerto Rico residents for the company
Modernizing the corporation’s organizational structure
Creating a financially successful corporation
PRASA has invested millions of dollars into renovating many of their treatment facilities
and plants. In the past five years it has spent $3.2 billion for its renovations. Some of the major
projects that PRASA has started include: a $36 million project on expanding the sewage plant in
Barceloneta, a $62 million project on improving the filtration in Toa Vaca, a $120 million
project on improving the Reservoir for el Rio Blanco, and a $115 million project for a new
system for transmission and distribution for the Carolina-Canovanas-Trujillo-Alto region. In
2006, PRASA received a large fine with nine offenses of illegal dumping of water and raw
sewage into nearby seas and clean water. Because of these indictments, PRASA is committed to
improving the quality of its services. PRASA projects they will invest approximately $2.4 billion
in improvements over the next ten years. Among many others, some of PRASA’s goals are to
increase potable water supply by over 80 MGD, bringing the current 541 MGD to 621 and
increase sewer treatment capacity by 45 MGD, achieving 352 up from 307 within the next ten
years.
In FY2005 (ending June 30, 2006), PRASA ran a deficit of $229.30 million, since
operating expenses ($558.00 million) exceeded revenues ($328.70 million). PRASA saw a
deficit of only $96.60 million the following year in FY2006 since revenues increased
dramatically to $484.70 million, while operating expenses remained similar to FY2005 at
$581.30 million. In 2007, revenue reached a staggering $760.90 million while operating budget
only increased slightly to $593.00 million, resulting in a positive profit of $167.90 million. The
financial data is summarized in Table 1.
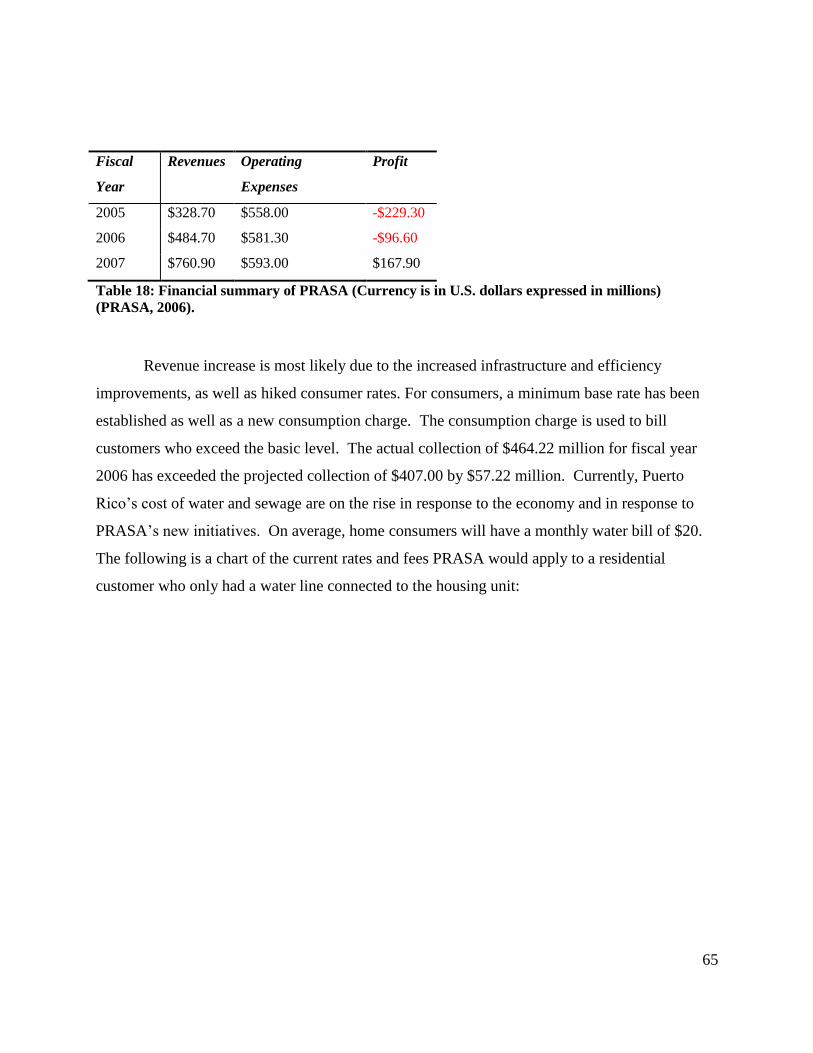
65
Fiscal
Year
Revenues Operating
Expenses
Profit
2005 $328.70 $558.00 -$229.30
2006 $484.70 $581.30 -$96.60
2007 $760.90 $593.00 $167.90
Table 18: Financial summary of PRASA (Currency is in U.S. dollars expressed in millions)
(PRASA, 2006).
Revenue increase is most likely due to the increased infrastructure and efficiency
improvements, as well as hiked consumer rates. For consumers, a minimum base rate has been
established as well as a new consumption charge. The consumption charge is used to bill
customers who exceed the basic level. The actual collection of $464.22 million for fiscal year
2006 has exceeded the projected collection of $407.00 by $57.22 million. Currently, Puerto
Rico’s cost of water and sewage are on the rise in response to the economy and in response to
PRASA’s new initiatives. On average, home consumers will have a monthly water bill of $20.
The following is a chart of the current rates and fees PRASA would apply to a residential
customer who only had a water line connected to the housing unit:
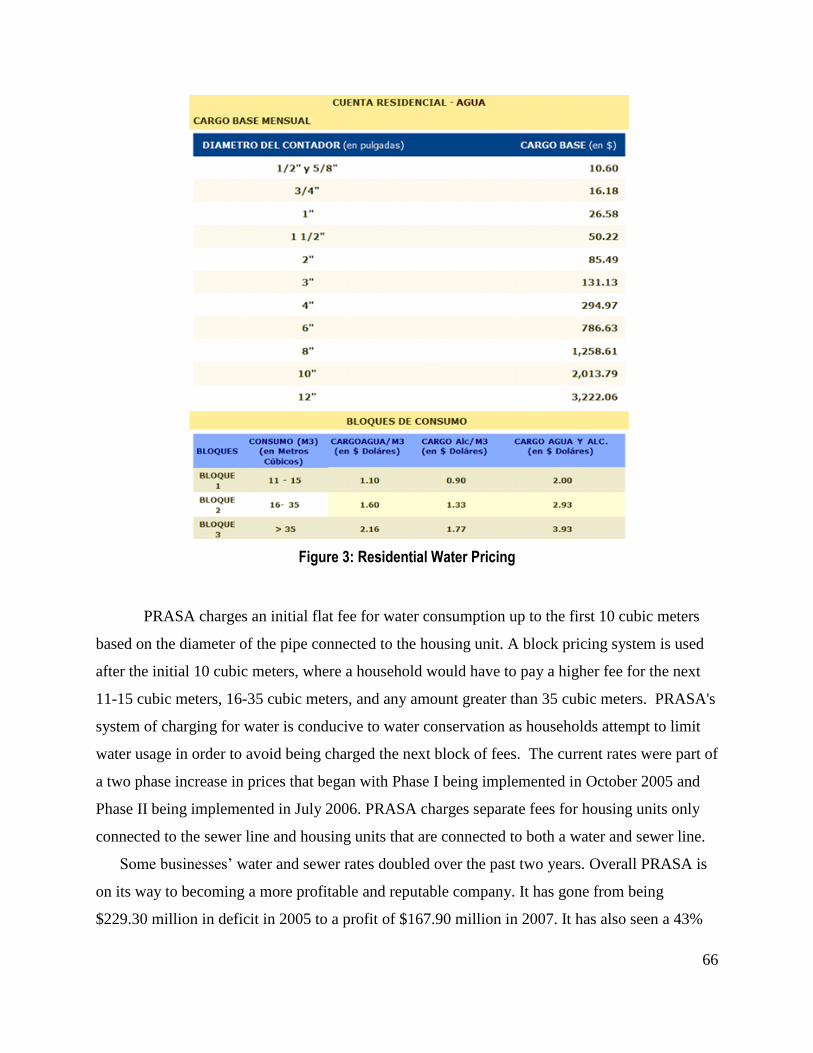
66
Figure 3: Residential Water Pricing
PRASA charges an initial flat fee for water consumption up to the first 10 cubic meters
based on the diameter of the pipe connected to the housing unit. A block pricing system is used
after the initial 10 cubic meters, where a household would have to pay a higher fee for the next
11-15 cubic meters, 16-35 cubic meters, and any amount greater than 35 cubic meters. PRASA's
system of charging for water is conducive to water conservation as households attempt to limit
water usage in order to avoid being charged the next block of fees. The current rates were part of
a two phase increase in prices that began with Phase I being implemented in October 2005 and
Phase II being implemented in July 2006. PRASA charges separate fees for housing units only
connected to the sewer line and housing units that are connected to both a water and sewer line.
Some businesses’ water and sewer rates doubled over the past two years. Overall PRASA is
on its way to becoming a more profitable and reputable company. It has gone from being
$229.30 million in deficit in 2005 to a profit of $167.90 million in 2007. It has also seen a 43%

67
reduction in service time due to water leaks, reduced unknown meter readings from 21% to 17%,
and has been more stringent with disconnecting non-paying customers. PRASA is dedicated to
improving the quality of their facilities and providing the highest quality water to the people of
Puerto Rico for years to come.
68
Appendix B: Interview Questionnaires
PRASA-WPI Team Interview with:
Date:
1) In the Rio Prieto region, how long have the pipes been installed? What kind of pipes are
they?
2) What problems caused the delay of the connections between pipes currently installed in
homes throughout the Rio Prieto sector with the PRASA infrastructure?
3) How are the residents of Rio Prieto receiving potable water now?
4) When are the pipes expected to be successfully connected and running with the PRASA
network? How soon will it be before all of the affected areas of the Rio Prieto sector will
become fully integrated with all of PRASA’s databases, including QAAA, ACTIVO, and the
CAR reports?
5) What unique considerations were taken into account when working on the Rio Prieto sector?
What are some of the environmental conditions (unique or not) of the areas associated with
the pipeline connections? What problems do you predict arising with the connections of these
pipes?
6) Are there other rural areas throughout Puerto Rico with environmental conditions similar to
the Rio Prieto sector?
7) Are there similar projects being planned in rural areas similar to the current Rio Prieto
project? If so, when are they? Are connection projects such as the Rio Prieto project a
concern for PRASA?
69
PRASA-WPI Team Interview with: Ronald Perez and/or Hugo Delgado
Date:
1) How long have the pipes been installed? What kind of pipes are they?
2) What problems caused the delay of the connections between pipes currently installed in
homes throughout the Rio Prieto sector with the PRASA infrastructure?
3) How are the residents of Rio Prieto receiving potable water now?
4) When are the pipes expected to be successfully connected and running with the PRASA
network?
5) What are the primary sources of water for the residents in the affected areas of the Rio
Prieto region? Do they get water from lakes, rivers, or streams?
6) What unique considerations were taken into account when working on the Rio Prieto
sector? What are some of the environmental conditions (unique or not) of the areas
associated with the pipeline connections? What problems do you predict arising with the
connections of these pipes?
7) Are there other rural areas throughout Puerto Rico where similar projects are happening
or will happen soon?
70
Appendix C: Sample Mini-Survey
Dear Customer,
AAA is looking to improve our services and we would like to know what we can do to help! Please take a moment to fill out the survey and mail it out in the self-addressed envelope. Your response is greatly
appreciated.
Do you find the water quality provided by AAA to
be better or worse than before the pipeline
connections were made? Please explain details in
the Additional Comments section.
□ Much Better
□ Somewhat Better
□ No Change
□ Somewhat Worse
□ Much Worse
□ Other (Explain in Comments)
Do you find the water services provided by AAA
to be better or worse than before the pipeline
connections were made? Please explain details in
the Additional Comments section.
□ Much Better
□ Somewhat Better
□ No Change
□ Somewhat Worse
□ Much Worse
□ Other (Explain in Comments)
During the time you have been a customer of AAA, has the water quality improved or declined?
□ Much Better
□ Somewhat Better
□ No Change
□ Somewhat Worse
Do you have a personal water tank installed in
your home?
□ Yes
□ No
If so, how often do you rely on your personal
water tank?
□ At Least Once a Day
□ Once a Week or Less
□ Several Times a Week
□ Several Times a Month
□ Other (Explain in Comments)
How long have you been connected to AAA?
□ A Month or Less
□ 1-6 Months
□ 7-12 Months
□ 1-2 Years
□ 3 Years or More
Do you feel that the water bill accurately
charges you for your water consumption?
□ Yes
□ No (If Not, Please Explain in Comments)
How would you rate the current quality of water
supplied by AAA?
□ Excellent
□ Good
□ Fair
□ Poor
How would you rate the current water service
provided by AAA?
Random Person
Random Street, Apt. #123
Random Municipality, PR 12345-1234

71
Are there any other additional comments or feedback you would like to offer us?
About You
Name
Address
Phone
City, State,
ZIP Code
May continue to contact you in the future for follow up surveys? □ Yes □ No
Thank you for your participation!
□ Much Worse
□ Other (Explain in Comments)
During the time you have been a customer of AAA, has
the water service improved or declined?
□ Much Better
□ Somewhat Better
□ No Change
□ Somewhat Worse
□ Much Worse
□ Other (Explain in Comments)
□ Excellent
□ Good
□ Fair
□ Poor
Do you find any of the following in the water
supplied by AAA? (Check all that apply.)
□ Bad or unusual taste
□ Discoloration
□ Bad Odor
□ Water Leaves Behind Film or Other Precipitates
□ Other (Explain in Comments)

72
Appendix D: 2000 National Census Data on Affected Barrios of Yauco
Appendix D contains information obtained from the 2000 National Census through the
US National Census Bureau. For each of the barrios in Yauco affected by the expansion project
(Aguas Blancas, Duey, Naranjo, Rubias, Rio Prieto, and Sierra Alta), select demographic
statistics are compared to those of the municipality of Yauco and Puerto Rico as a whole. When
looking at race, it is important to note that the US Census Bureau does not consider Latino or
Hispanic to be race, but rather an ethnicity. Therefore, unless specifically stated, the surveyed
population considered themselves to be a Hispanic or Latino first before indicating which race
they were.
Household Income
0% 10% 20% 30% 40% 50% 60% 70% 80% 90% 100%
Aguas Blancas
Duey
Naranjo
Río Prieto
Rubias
Sierra Alta
Yauco
Puerto Rico
Percentage of Households
Breakdown of Household Income
Less than $10,000
$10,000 to $14,999
$15,000 to $19,999
$20,000 to $24,999
$25,000 to $29,999
$30,000 to $34,999
$35,000 to $39,999
$40,000 to $44,999
$45,000 to $99,999
$100,000 or more
73
Median Household Income
Income to Poverty Level Ratio
$5,536
$7,585
$9,028
$6,743
$10,000
$6,120
$11,924
14,412
$4,000
$6,000
$8,000
$10,000
$12,000
$14,000
$16,000
Aguas
Blancas
Duey Naranjo Rio Prieto Rubias Sierra Alta Yauco
Municipality
Puerto Rico
Median Household Income
0%
10%
20%
30%
40%
50%
60%
70%
80%
90%
100%
Aguas
Blancas
Duey Naranjo Río Prieto Rubias Sierra Alta Yauco Puerto Rico
Percen
tag
e o
f H
ou
seh
old
s
Affected Barrios of Yauco
Ratio of Income to Poverty Level
2.00 and over
1.85 to 1.99
1.75 to 1.84
1.50 to 1.74
1.25 to 1.49
1.00 to 1.24
.75 to .99
.50 to .74
Under .50
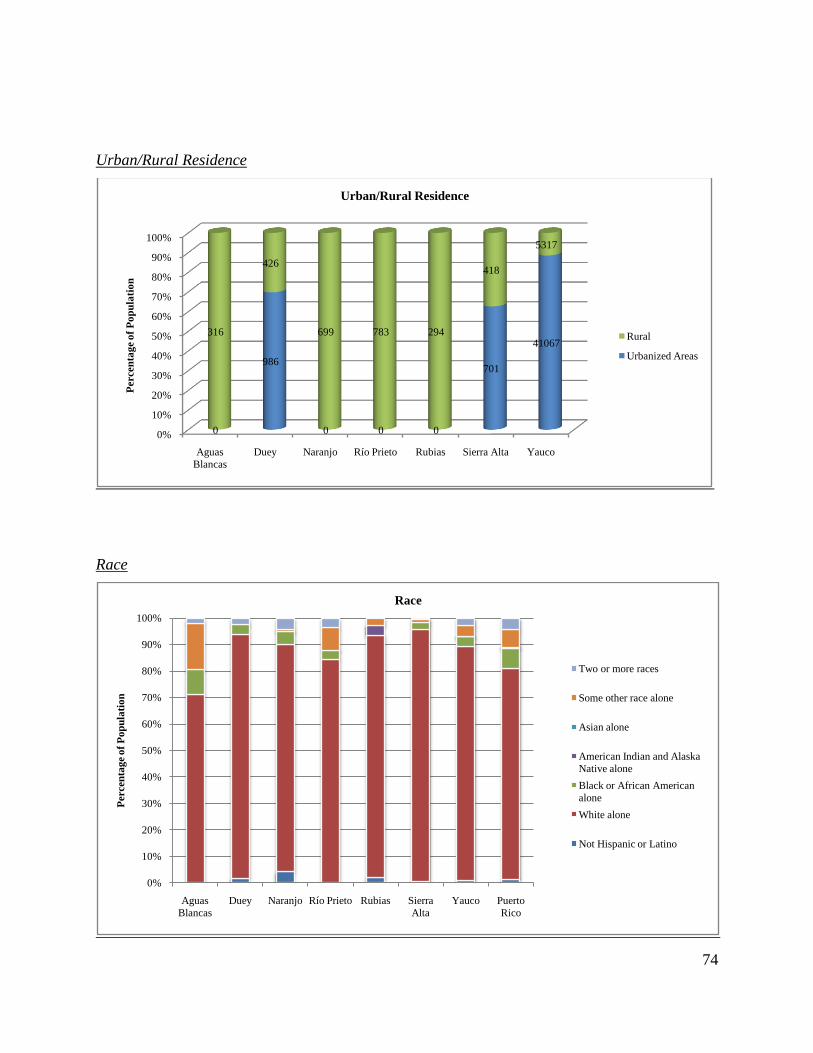
74
Urban/Rural Residence
Race
0%
10%
20%
30%
40%
50%
60%
70%
80%
90%
100%
Aguas
Blancas
Duey Naranjo Río Prieto Rubias Sierra Alta Yauco
0
986
0 0 0
701
41067316
426
699 783 294
418
5317
Percen
tag
e o
f P
op
ula
tio
n
Urban/Rural Residence
Rural
Urbanized Areas
0%
10%
20%
30%
40%
50%
60%
70%
80%
90%
100%
Aguas
Blancas
Duey Naranjo Río Prieto Rubias Sierra
Alta
Yauco Puerto
Rico
Percen
tag
e o
f P
op
ula
tio
n
Race
Two or more races
Some other race alone
Asian alone
American Indian and Alaska
Native alone
Black or African American
alone
White alone
Not Hispanic or Latino
75
Highest Level of Education Attained
Age
0% 20% 40% 60% 80% 100%
Aguas Blancas
Duey
Naranjo
Río Prieto
Rubias
Sierra Alta
Yauco
Puerto Rico
Percentage of Population
Highest Level of Education Attained
No Schooling Completed
Nursery to 8th Grade
9th to 12 Grade (No Diploma)
High School Graduate
(includes Equivalency)Some College, No Degree
Associate Degree
Bachelor's Degree
Master's Degree
Professional or Doctorate
Degree
0% 20% 40% 60% 80% 100%
Aguas
Blancas
Duey
Naranjo
Río Prieto
Rubias
Sierra Alta
Yauco
Puerto
Rico
Percentage of Population
Age
17 years or younger
18 to 24 years
25 to 34 years
35 to 44 years
45 to 54 years
55 to 61 years
62 to 74 years
75 to 84 years
85 years and over