Embed Size (px)
Citation preview

DRAFT
0
Existing Data for Evaluating Coastal Plain Ecological Flows in the Albemarle-Pamlico Estuary Region
By Michael O’Driscoll 1,2, Ryan Bond3, Isabel Hillman2, Caitlin Skibiel4, Charles Humphrey5, and Christa Sanderford5
1Department of Coastal Studies, East Carolina University 2Nicholas School of the Environment, Duke University
3Department of Geological Sciences, East Carolina University 4Coastal Resources Management Program, East Carolina University 5Environmental Health Sciences Program, East Carolina University
DRAFT submitted August 23, 2018

DRAFT
1
Executive Summary This study focused on the status of available flow and ecological flow-related data for the
Albemarle-Pamlico drainage basin. During our data search and compilation there were numerous notable data gaps. The main data gaps were associated with streamflow, groundwater, evapotranspiration, salinity, water use, and ecological response data. Gaps in water use data may influence the accuracy of water budgets for watersheds in the region. In general, there is a lack of publicly-available, fine-scale water withdrawal data sets that can be used to assess the temporal variations in water usage. This decreases the capability to evaluate how anthropogenic changes such as groundwater pumping and surface water withdrawals might impact low-flow in streams, particularly during high demand summer months. Based on the surface water, groundwater, meteorological, and water use data available we recommend a pilot study to determine if accurate water budgets can be constructed with pre-existing data at the watershed-scale. A water budget for a pilot watershed would be constructed with publicly available data, while at the same time the watershed would be intensively monitored to gain a better understanding of how accurate the water budget using publicly available data predicted the flux of water. It is hypothesized that improvements in Coastal Plain water budgets could be made if georeferenced data could be collected monthly and verified with water meters throughout the pilot study watershed. Since the Central Coastal Plain Capacity Use Area (CCPCUA) falls within the Albemarle-Pamlico Basin, a study watershed within the CCPCUA would be ideal. Water use is tracked more closely in the CCPCUA and since 2002, the data has been available to the public. Based on long-term flow records, Contentnea Creek, may be a good candidate for further study. In addition, the Little River shows evidence of declining low-flows and further study could help to explain why. The Trent River station near Trenton is one of the limited number of discharge stations adjacent to the Outer Coastal Plain that has a long-term record, this watershed would also be a good candidate for coastal ecological flow research.
These and other potential studies could focus on answering several research questions: • What are the most accurate and least accurate water flux and use estimates and how can gaps
in water use data be filled? • What are the relative influences of meteorological forcing vs water withdrawals on low-flows? • Are current low flows protective of ecological integrity? What threshold of water use would
adversely affect streamflow and/or ecological integrity? • How will climate change, withdrawals, and land-use change affect low flows in the future? • What are the general stressor-response relationships between flow alteration and ecological
health? • Based on pre-existing data, can the stressor-response relationships be adequately evaluated and
if not, what types of data are needed in the future? • What are barriers to understanding the dominant influences on ecological flows at the
watershed-scale?

DRAFT
2
Although there is a database of ecological flow work in the southeast, few of these studies were conducted in the Albemarle-Pamlico drainage basin. We recommend seeking funding and partnerships to include watershed-based ecological flows research focused on the ecological responses to low-flows and variability in pulses, flooding, and salinity. The earlier work by NC DEQ (2013) also concluded that more information is needed on the biological response to streamflow reductions, particularly for headwaters and coastal plain streams, but also for large rivers. Since climate change and land-use change may affect future river flows in the region, work focused on potential changes to flows, salinity, and ecological responses associated with future climate and land-use change would also be needed to help guide water resources, fisheries, and land-use management in the basin.
A first step towards understanding ecological flows in the region would be to perform ecological flow analysis on the long-term discharge records along unregulated river reaches in the Albemarle-Pamlico drainage basin. We recommend that these analyses be performed on the discharge records at the USGS stations with long-term data (>30 years). We recommend that the flow analyses first be performed using the Indicators of Hydrologic Alteration software and on streams categorized based on the initial classification system (Coastal Plain tidal, Coastal Plain low-slope, Coastal Plain medium-slope, and Piedmont) suggested by the Coastal Ecological Flow Working Group (CEFWG) (NC DEQ 2013). If the USGS flow stations correspond with sites where NC DEQ has collected biological data, flow metrics can be compared with diversity indices for fish or macroinvertebrates.
Based on the number of agencies collecting water use and wastewater discharge data, it would be worthwhile to bring together water use and water flux experts from USGS, NC DEQ, NC Dept. of Agriculture and Consumer Services, NC Climate Office, NC Dept. of Health and Human Services, water utilities, and other stakeholders with the goal of developing a comprehensive water accounting system for the region. An interagency plan is needed to address the challenges, costs, and other issues associated with coordinating a more comprehensive water use and wastewater return-flow database for the Albemarle-Pamlico Drainage Basin.
Based on ecological flow development work in other states, numerous states in the southeast have data and experience developing ecological flow criteria. Many suggest that adaptive management with stakeholder involvement is an important component of ecological flow management. This kind of approach in which federal, state, and local agencies work in cooperation with stakeholders to achieve ecological flow management objectives may be the most likely to succeed. In most states, the water or environmental agency in the state takes the lead, in this case that would be the NC DEQ. Moving forward, APNEP and DEQ could collaboratively develop a process to define ecological flow goals and criteria for the drainage basin. Based on Session Law 2010-143, DEQ is required to develop basinwide hydrological models for each of NC’s 17 river basins to predict the places, times, and frequencies at which ecological flows may be adversely affected in North Carolina (NC DEQ 2013). Future work on ecological flows in the Albemarle-Pamlico drainage basin should aim to complement the mandated efforts by NC DEQ.

DRAFT
3
Table of Contents Introduction 4
Low Flow Conditions and Their Significance to Ecological Flows 4
Available Data to Assist with Evaluating Coastal Plain Ecological Flows in the Albemarle Pamlico Drainage Basin 6
Surface Water Discharge Data 6
Stage and Flood Recurrence Data 13
Geomorphological, Soils, and Land Cover Data 14
Meteorological Data 17
Groundwater and Baseflow Data 19
Water Use Data 21
Flow Alteration Data 31
Dams 31
NPDES Discharges 32
Land Use Change 33
Water Quality 34
Ecological Flow Relationships in Coastal Plain Settings 37
Notable Data Gaps 38
Conclusions and Recommendations for Further Study 41
Appendices 48
References 49

DRAFT
4
Introduction Session Law 2010-143 (https://www.ncleg.net/EnactedLegislation/SessionLaws/HTML/2009-
2010/SL2010-143.html) was enacted in response to concerns over water availability in North Carolina. This legislation required NC DEQ to develop basinwide hydrological models for each of NC’s 17 river basins to evaluate if there is adequate water for all needs, essential water uses, and to predict the places, times, and frequencies at which ecological flows may be adversely affected in North Carolina (NC DEQ 2013). In this case, ecological flow is defined as “stream flow necessary to protect ecological integrity” and ecological integrity is defined as “the ability of an aquatic system to support and maintain a balanced, integrated, adaptive community of organisms having a species composition, diversity, and functional organization comparable to prevailing ecological conditions and, when subject to disruption, to recover and continue to provide the natural goods and services that normally accrue from the system” (NC DEQ 2013). Ecological flow assessment considers the amount of water (and timing) needed to support the diversity of aquatic life and functioning ecosystem in a river or estuary. As noted the coastal streams in the Albemarle-Pamlico drainage basin present particular challenges for ecological flow assessment due to the lack of streamflow data in tidal areas, flow reversals from wind and tides, and spatiotemporal variability of salinity in coastal waters.
The overall goal of this project was to identify data and research that can guide and support ecological flow assessment in the region. In addition, based on the data available, we recommend potential approaches to assist with the development of ecological flow guidelines within the Albemarle-Pamlico basin. These data will be utilized to help understand the magnitude and timing of streamflow needed to maintain ecological integrity for Coastal Plain and Piedmont streams in the region. This report identifies and discusses available data, notable data gaps, and provides recommendations for future work.
Low Flow Conditions and Their Significance to Ecological Flows Low flows play a vital role in evaluating ecological flows because of their influence on
contaminant dilution, saltwater intrusion, aquatic habitat, and public water supplies (Price et al. 2011). Although the timing, duration, and range of streamflows are important for ecological flows, the occurrence of floods and overbank flows is less likely to be affected by water withdrawals when compared to low flows. Therefore, this project emphasized data that can improve the accuracy of water budgets for the region, and on improving the understanding of factors that influence low flow estimates in coastal watersheds in the region. Dry season (or growing season) streamflows are referred to as “low flows” (Smakhtin, 2001).

DRAFT
5
The natural factors which influence the low-flow regime of a stream include: ● Soils (distribution and infiltration characteristics) ● Aquifer type and extent (hydraulic characteristics) ● Recharge (rate, frequency and amount of recharge) ● Meteorological controls (precipitation and evapotranspiration) ● Distribution of vegetation types (runoff, interception, recharge and evapotranspiration) ● Topography (influence on runoff and recharge)
The anthropogenic factors which influence the low flows include:
● Groundwater abstraction ● Changes in vegetation (cutting, deforestation, or planting) ● Urbanization ● Run of river withdrawals ● Effluent discharges and irrigation return flows ● Inter-basin transfers (wastewater and water) ● Dams and regulation of flow regime (particularly large impoundments) Based on seasonal and long-term variation in precipitation, temperature, and
evapotranspiration, streams in the Albemarle-Pamlico drainage are vulnerable to low flows particularly during summer months. Long-term tree ring analysis in the region conducted by Stahle et al. (1988) suggests that drought cycles for eastern North Carolina occur over approximately 30-year periods. Based on their findings, streamflow records of 30 years or longer would be most helpful for evaluating ecological flows because that duration and longer would likely capture at least one drought cycle. The following sections will focus on the existing data that can help provide a basis for evaluating water budgets and ecological flows, particularly associated with the low-flow regime.
The 7Q10 is a common hydrologic statistic used to describe low flow conditions. This is determined by statistical analysis of stream flow records, and represents the lowest stream flow average for seven consecutive days (in a given year) with a recurrence interval of 10 years. It is a concept similar to the 10-year recurrence interval flood, but instead is a metric to quantify the low flow portion of the stream discharge record. This metric can be useful to understand what extreme low flow conditions are like for specific rivers and help guide management of ecological flows, wastewater discharge to rivers, navigability, and water supply withdrawals. 7Q10 data for streams in the Albemarle-Pamlico drainage basin that have long-term discharge records are included in the appendices.

DRAFT
6
Available Data to Assist with Evaluating Coastal Plain Ecological Flows in the Albemarle Pamlico Drainage Basin
A wide variety of data are available that may prove useful for ecological flow assessment and associated work in the Albemarle-Pamlico Sound Region. These data were generally organized in the categories of Quality, Quantity, Ecological Flow Specific, Geomorphic, Meteorological, and GIS (Appendix I). Most of the surface and groundwater data in the region is collected by the US Geological Survey and the NC Department of Environmental Quality.
Surface Water Discharge Data Streamflow data can be used for characterizing and evaluating in-stream conditions. The
primary source of surface water discharge data for the Albemarle-Pamlico Drainage Basin is the US Geological Survey (USGS). Streamflow data for North Carolina can be obtained from the USGS weblink: https://waterdata.usgs.gov/nc/nwis/sw. Flow data are publicly available at: https://waterdata.usgs.gov/nc/nwis/current/?type=flow&group_key=basin_cd. Figure 1 includes current gauges in the region and Appendix I includes more detailed information on the gauges. The temporal extent of monitoring data varies among gauges. Numerous gauges with long records (>30 years) have been discontinued and the densely populated Piedmont physiographic province tends to have a greater density of gauges relative to other provinces (Figure 1). Stream gauges are often located along higher-order (larger) streams (3rd-order and above). The smallest watershed area for a stream gauge in the region was 0.02 square miles (208762750, Unnamed tributary to Swift Creek, Wake Co.), whereas the largest was 3,900 square miles (Neuse River near Fort Barnwell-02087570). In general, flow data are available for more sites in the Piedmont and Inner Coastal Plain provinces in comparison to the Outer Banks and Outer Coastal Plain (although there are some stage gauges near the coast, they do not have corresponding discharge data) (Figure 1). This gap in data coverage is in part due to the challenges associated with developing streamflow-stage rating curves in low-lying, flat coastal areas where wind and tides can influence the relationship between stream stage and discharge over time.
For future ecological flow work, there are 19 gages currently operating that have > 30-year data records and these sites are good candidates for ecological flow analyses (Table 1). The longest available record of streamflow (along active unregulated reaches) was found at Fishing Creek at Enfield-2083000 (94 years).

DRAFT
7
Figure 1. Location of current USGS streamflow gages in NC Albemarle-Pamlico watersheds. Red gages indicate stage and discharge sites. Blue gages indicate stage only. Yellow stars indicate inland water quality data available. Black circles indicate water quality data available in the estuary. USGS Stream gages were queried from the source layer: https://services.nconemap.gov/secure/rest/services/NC1Map_Environment/MapServer

DRAFT
8
Table 1. USGS active NC discharge stations in the Albemarle-Pamlico Drainage Basin with greater than 30-year records. USGS station # Station Name Lat Long County
Drainage Area (mi^2) Period of record Years of Record
2085500 FLAT RIVER AT BAHAMA 36.182 -78.879 Durham 149 July 1925 to current 92
2085070 ENO RIVER NEAR DURHAM 36.072 -78.908 Durham 141 August 1963 to current 51
2097314 NEW HOPE CREEK NEAR BLANDS 35.885 -78.966 Durham 75.9 October 1982 to current 35
2082585 TAR RIVER AT NC 97 35.95472 -77.78722 Edgecombe 925 August 1976 to current 41
2083000 FISHING CREEK NEAR ENFIELD 36.151 -77.693 Edgecombe 526 October 1923 to current 94
2083500 TAR RIVER AT TARBORO 35.894 -77.533 Edgecombe 2183 July1896 to December 1900; October 1931 to current 90
2081747 TAR R AT US 401 AT LOUISBURG 36.093 -78.297 Franklin 427 October 1963 to current 54
2081500 TAR RIVER NEAR TAR RIVER 36.195 -78.583 Granville 167 October 1939 to current 78
2091000 NAHUNTA SWAMP NEAR SHINE 35.489 -77 Greene 80.4 April 1954 to current 63
2091500 CONTENTNEA CREEK AT HOOKERTON 35.428 -77.582 Greene 733 November 1928 to current 89
2082950 LITTLE FISHING CREEK NEAR WHITE OAK 36.186 -77.876 Halifax 177 October 1959 to current 58
2053200 POTECASI CREEK NEAR UNION 36.371 -77.027 Hertford 225 March 1958 to current 59
2053500 AHOSKIE CREEK AT AHOSKIE 36.28 -77 Hertford 63 January 1950 to current 67
2092500 TRENT RIVER NEAR TRENTON 35.065 -77.457 Jones 168 January 1951 to current 66
2088500 LITTLE RIVER NEAR PRINCETON 35.511 -78.161 Johnston 229 February 1930 to current 87
2082770 SWIFT CREEK AT HILLIARDSTON 36.112 -77.921 Nash 166 July 1963 to current 54
2085000 ENO RIVER AT HILLSBOROUGH 36.072 -79.104 Orange 66 October 1927 to August 1971; October 1985 to current 76
2084160 CHICOD CR AT SR1760 35.56167 -77.23083 Pitt 45 October 1975 to March 1987; May 1992 to current 35
208732885 MARSH C NR NEW HOPE 35.81694 -78.59306 Wake 6.84 January 1984 to current 33

DRAFT
9
Stage and flow data for the sites are presented against flow percentiles for the period of
record to illustrate seasonal variability in stage and streamflow common in the Coastal Plain. An example is provided below for Potecasi Creek (Figure 2), where these data show a clear seasonal pattern of lower flows during the summer months and higher flows in winter and early spring. The higher flows tend to be less variable throughout the year and the greatest range in flow variability tends to occur during September. This is when streamflows may be extremely low if precipitation-evapotranspiration is at a deficit for a sustained period during the preceding summer months or extremely high if tropical storms make landfall. The raster hydrograph (Figure 3) provides a graphical approach to identify extremes over the entire period of record. The record of these data for Potecasi Creek extends for 58 years and the watershed has minimal impervious area (0.21%). This creek has a watershed area of 225 square miles and a 7Q10 of 0.46 cubic feet/s (cfs). In the Albemarle-Pamlico drainage basin, smaller watersheds (below 225 square miles) have a much greater likelihood that the 7Q10 will be at or close to 0 (river dries up at gauging station) (Figure 4). Land-use upstream of the Potecasi Creek gauge is approximately 45% forested, with limited public supply withdrawals (see Hertford County in Figure 11). Based on the land-use and duration of flow record, this stream may be considered as a potential reference stream to better understand timing and duration of discharge to Inner Coastal Plain streams in the absence of large water withdrawals.
Comparisons with other watersheds that experience large water withdrawals can help to quantify the effects of withdrawals, particularly on low-flow conditions. Hydrograph separation models can be used to isolate the groundwater (baseflow) component of streamflow. Hydrograph separation may reduce some of the variability associated with stormwater runoff and can help to make low flow patterns more visible (Figure 5). For example, baseflow minimums along the Eno River at Hillsborough appear to be affected by withdrawals. A comparison between the Eno River and Potecasi Creek can show how withdrawals may affect low flow patterns (Figure 5). Since stream gages will be located at various locations along streams with variable watershed areas, it is important to normalize the discharge data by dividing the upstream watershed area when making comparisons across watersheds. The Eno River at Hillsborough had approximately 55% forested area upstream, is in a Piedmont watershed with igneous and metamorphic underlying geology, and has approximately 2% impervious area upstream. The Eno had a 7Q10 of 0.48 cfs. The record for this stream extends back to 1927, however there was a data gap with no flow data from 1971-1985. The watershed area upstream was 66 square miles. A comparison of the baseflow minimums over time suggests that withdrawals from the Eno River may have caused a decline in low flow values. The recent low flows are lower than those measured in the 1960s. Although Potecasi Creek doesn’t have the same length of flow record, there doesn’t appear to be a large downward trend in baseflow minimums from 1958 to 2016 (Figure 5). Further work is needed to evaluate the relative importance of changes in effective precipitation (precipitation-evapotranspiration) and withdrawals on low-flow conditions over time for the region.

DRAFT
10

DRAFT
11
Figure 2. Comparison of 2016-2017 discharge data (black line) to various percentile discharges for the period of record for Potecasi Creek (58 years).
Figure 3. Raster hydrograph for Potecasi Creek.

DRAFT
12
Figure 4. 7Q10 vs watershed area for selected unregulated North Carolina Coastal Plain streams in the USGS monitoring network.
The USGS StreamStats program estimates flood and low flow discharges for a range of recurrence intervals at gauging stations in the Albemarle-Pamlico Drainage Basin (Table 1). In addition, the program provides estimates of land-use and watershed area at stream gauge and ungauged sites. The online program can be accessed at: https://streamstatsags.cr.usgs.gov/streamstats/. The 7Q10 data were available for 49 stations in the Albemarle-Pamlico drainage basin through StreamStats. Figure 4 shows a general trend in decreasing 7Q10 with watershed size. Smaller (< 225 square miles) watersheds tended to have lower 7Q10 values and those will be particularly sensitive to water withdrawals, especially if wastewater is not returned directly to the stream or returned further downstream as groundwater return flow.
Although in past studies (e.g., Giese and Mason 1991) the USGS has developed low flow relationships for some regions, there was substantial variability in 7Q10 in the Coastal Plain region, in part due to the relative lack of discharge data in the region. The limited 7Q10 data suggested that although watershed area has a major influence, other variables including hydrogeological, biological, and anthropogenic influences also affect low-flows. The most recent USGS low-flow study by Weaver (2016) revealed that 55 of 63 gauging stations in North Carolina showed declines in 7Q10 since the 1990s. Along the Cape Fear River (adjacent to the Albemarle-Pamlico drainage basin), the 7Q10 declined by approximately 25%. All Coastal Plain sites (12) with long-term flow records in the study exhibited declines in 7Q10 relative to the pre-1998 record. In a recent study, Meitzen (2016) also found similar results suggesting decreasing low flows in NC. These studies suggest that low-flow analyses should be an important consideration for ecological flow development.
y = 0.0367x - 0.846R² = 0.86
020406080
100120140160180200
0 500 1000 1500 2000
7Q10
(cfs
)
Drainage area (square miles)

DRAFT
13
.
Figure 5. Comparison of the Eno River and Potecasi Creek minimum daily baseflow (per year) over time. Hydrograph separations were performed using the local minimum method with the Web Based Hydrograph Analysis Tool: https://engineering.purdue.edu/mapserve/WHAT/
Stage and Flood Recurrence Data The USGS discharge stations typically have associated stage data. However, numerous
gauges just record stream stage and do not collect discharge data (Figure 1). Stage data are also useful for ecological flow assessment by providing information on the frequency and duration of overland flows and the extreme low stages, high stages, and range of stages which may affect the extent of aquatic habitat. Stage data may be particularly helpful for ecological flow assessment in tidal areas, where flow-related metrics may be difficult to obtain because of lunar and wind tides. The locations of gauges are presented in Figure 1.
The National Weather Service – Advanced Hydrological Prediction Service provides flood stages for several USGS gauge stations on the major rivers of the APNEP region at: http://water.weather.gov/ahps2/index.php?wfo=mhx
Weaver et al. (2009) provided empirical relationships for a variety of recurrence interval stormflows for ungauged Coastal Plain streams based on watershed area (Table 2). Flood frequency statistics for USGS gauged sites in North Carolina are located at: https://streamstatsags.cr.usgs.gov/streamstats/. In addition, US EPA has developed a Windows-based tool developed to estimate user selected design stream flows for low flow analysis at: https://www.epa.gov/waterdata/dflow

DRAFT
14
Percent Chance Exceedance Recurrence Interval (yrs) Flood-Frequency equation
50 2 60.3 DA 0.649
20 5 123 DA 0.627
10 10 174 DA 0.617
4 25 245 DA 0.606
2 50 309 DA 0.600
1 100 380 DA 0.594
0.5 200 447 DA 0.589
0.2 500 550 DA 0.583
Table 2. Flood discharge estimate equations for ungauged streams in the North Carolina Coastal Plain (source: Weaver et al. 2009); DA= drainage area in square miles. Flood discharge is in cfs.
Geomorphological, Soils, and Land Cover Data
In addition to flow and stage data, an understanding of the channel dimensions can be helpful for evaluating overbank flow events and stage during bankfull and low flow conditions. Based on past field studies by Sweet and Geratz (2003) and O’Driscoll et al. (2009), regional regression equations are available to estimate bankfull stream channel dimensions for Coastal Plain streams in watersheds that are less than 200 square miles (Figure 6). In addition, these empirical approaches can help estimate bank-full discharge for Coastal Plain streams based on their watershed area and predominant land-use (urban vs. rural). Soils data may also provide evidence of locations that are commonly inundated and the data available through the USDA Web Soil Survey include infiltration capacity, texture, and depth to water table. These soils data can be obtained through the USDA web soil survey (https://websoilsurvey.sc.egov.usda.gov/App/HomePage.htm). Topographic and land cover data may be compiled from the National Elevation Dataset (NED) (U.S. Geological Survey, 1999), USDA-NRCS Soil Survey Geographic (SSURGO) soil data (Soil Survey Staff, 1995), National Land Cover Dataset (NLCD) land cover data (Homer et al., 2015), the USGS StreamStats program (https://streamstatsags.cr.usgs.gov/streamstats/), and other databases.

DRAFT
15
Figure 6. Regional curves showing the relationship between watershed drainage area and channel dimensions for North Carolina Coastal Plain streams (modified from Sweet and Geratz, 2003).

DRAFT
16
Table 3. Coastal Plain stream bankfull dimension equations from O’Driscoll et al. (2009) and Sweet and Geratz (2003). Watershed area units are in square kilometers (modified from O’Driscoll et al. (2009).

DRAFT
17
Meteorological Data Meteorological data is necessary to evaluate the controls on low-flows, stream runoff response to precipitation inputs, and seasonal variations in discharge associated with precipitation inputs and evapotranspiration losses. Precipitation data is widely available in the Coastal Plain through several federal and state programs including:
• USGS: http://nc.water.usgs.gov/infodata/precip.html
• NOAA's National Centers for Environmental Information (NCEI): https://www.ncdc.noaa.gov/cdo-web/
• National Weather Service Radar: http://radar.weather.gov/
• State Climate Office of NC (CRONOS): http://climate.ncsu.edu/
• National Atmospheric Deposition Program (precipitation chemistry and quantity data): http://nadp.sws.uiuc.edu
In addition, the NOAA Precipitation Frequency Data Server provides statistical analyses of regional rainfall data at http://hdsc.nws.noaa.gov/hdsc/pfds/. These data can be used to quantify the recurrence interval of a variety of different rainstorm durations for the specific area of interest, e.g. Greenville’s 25-yr recurrence interval 1-hour duration storm. For water budgets in the Albemarle-Pamlico drainage basin, evapotranspiration is the major water flux from most Coastal Plain watersheds (typically approximately 70% of annual precipitation (Sun et al. 2002, Sanford and Selnick 2013)). In the Coastal Plain province, there is a high degree of seasonal variability in evapotranspiration associated with elevated solar inputs and plant water uptake during the growing season (March-October). An example of the influence of elevated evapotranspiration on streamflow is shown in Figure 7 for a watershed in Carteret County with a streamflow record from 1988-1997 (Sun et al. 2002). In this case, potential evapotranspiration is used as a surrogate for actual evapotranspiration. Potential evapotranspiration (PET) is the amount of water transpired in unit time by a short green crop, completely shading the ground, of uniform height, and never short of water (Brooks et al. 2013). PET can be calculated with air temperature data using a variety of approaches, including the Thornthwaite or Hamon methods. If other meteorological data are available such as solar radiation, relative humidity, temperature, and windspeed, it is possible to estimate the PET using the Penman-Monteith and other more complex equations. However, there is a constraint to using PET data for water budgets. If water supply to the vegetation is limited, then actual evapotranspiration will not reach potential evapotranspiration and these PET approaches will tend to overestimate evapotranspiration. For detailed water budgets, actual evapotranspiration data will provide more accurate results, particularly in the summer months when evapotranspiration may exceed precipitation.
Actual evapotranspiration data for the Albemarle-Pamlico basin is less publicly available than PET data, with the exception of the actual evapotranspiration data collected at the Ameriflux site in Plymouth, NC (http://ameriflux.lbl.gov/). The State Climate Office of North Carolina

DRAFT
18
provides potential evapotranspiration estimates at ECONET stations http://climate.ncsu.edu/map/?q=cronos/map/. The meteorological data collected at the stations and the Penman-Monteith equation are used to estimate daily or monthly reference crop evapotranspiration at six Coastal Plain stations in the APNEP region: Aurora (since 2000), Buckland (since 2006), Kinston (since 1987), Lewiston (since 1979), Plymouth (since 1984), and Williamston (since 2000). In addition, there are numerous Piedmont stations, particularly in the Raleigh-Durham region. In areas where ET data is unavailable, the USGS recently developed an estimation tool, through the US National Water Census Data portal (water budget tool) at https://cida.usgs.gov/nwc/. This can provide watershed-scale evapotranspiration estimates for daily, monthly, and annual timeframes since 2000. To evaluate future (potential) changes to ET associated with climate change, the recent Federal/University collaborative effort with the US Bureau of Reclamation to provide downscaled climate and hydrology data may be helpful. This project provides access to climate and hydrologic projections at the watershed-scale, these data may help to evaluate climate change effects on ecological flows in the region. The collaborative data can be found at: https://gdo-dcp.ucllnl.org/downscaled_cmip_projections/dcpInterface.html
Figure 7. Example of streamflow seasonality in a small (25 ha) coastal watershed in Carteret County, NC (modified from Sun et al. 2002) based on streamflow data collected from 1988-1997.

DRAFT
19
Groundwater and Baseflow Data Groundwater is usually the dominant contributor to low flows, therefore groundwater
input data are important for low flow and ecological flow assessment. Baseflow (groundwater inputs to streams) contributions to total streamflow vary throughout the year. They typically reach their minimum during the growing season when ET is higher and effective precipitation (precipitation-evapotranspiration) is at or near its lowest monthly value. Baseflow is sourced from the aquifer(s) connected to the stream and upwells diffusely through channel sediments or flows directly to the channel at discrete points along seeps and springs. Seeps may be common along stream banks where contrasting clay (aquitard) and sandy (aquifer) sediments exist. Groundwater and baseflow data can be used to assess groundwater recharge, groundwater flux, groundwater flow direction, and surface water-groundwater interactions. Although groundwater wells cannot provide baseflow information directly, water table information from the wells can indicate changes in recharge associated with land-use change and withdrawals. When more than three wells are located at a site, the groundwater hydraulic head data can be used to estimate the direction and magnitude of groundwater flow. Although USGS has a limited number of groundwater monitoring wells (approximately 10) in the APNEP region (Figure 8) (https://waterdata.usgs.gov/nc/nwis/gw/), the North Carolina Department of Environmental Quality (NCDEQ) has an extensive groundwater monitoring network. NC DEQ has a web based interface to locate groundwater wells with data accessible through their Ground Water Data Map Interface webpage (Figure 9) at: http://www.ncwater.org/?page=587. Based on broad regional hydraulic head patterns, regional groundwater flow directions can also be estimated for individual aquifer systems from the DEQ data. Although baseflow data are not directly available from USGS gauges, the USGS StreamStats program can provide an average baseflow index (fraction of annual total stream discharge that is comprised of groundwater inputs) for rivers within the USGS monitoring network based on a numerical model that performs hydrograph separations (separates the total streamflow into stormflow and baseflow (groundwater) components): https://streamstatsags.cr.usgs.gov/streamstats/
In addition, the Web Based Hydrograph Analysis Tool at: https://engineering.purdue.edu/mapserve/WHAT/ can run hydrograph separations on discharge records at individual USGS gauging stations. These data can provide daily estimates of baseflow for the period of record. Past studies in the region have shown that groundwater inputs are frequently the dominant source of water that nourishes streamflow in Coastal Plain streams (Carlston 1963, Williams and Pinder, 1990, and O’Driscoll et al. 2010). The regional importance of baseflow (groundwater) to maintain low-flows, suggests that groundwater withdrawals may have a greater likelihood of affecting low-flows in this region, particularly in settings where the groundwater withdrawals are from aquifers with a direct connection to the stream, such as the surficial aquifer. Conversely, there may be regions where withdrawals occur from deeper aquifers that are disconnected from the stream and those withdrawals are unlikely to affect local streamflow. A more detailed understanding of stream-groundwater interactions in the Albemarle-

DRAFT
20
Pamlico Drainage Basin is needed to help identify streams and stream reaches that may be most sensitive to groundwater withdrawals. Due to seasonal variability in precipitation, evapotranspiration and groundwater recharge, it is likely that streams will be most sensitive to groundwater withdrawals during the summer and fall low-flow periods. Past studies have also used the analysis of baseflow recessions (periods of no-rain when baseflow declines over time as groundwater is drained from aquifer storage) to detect human interference on low flows (Wang and Cai 2009).
In addition to groundwater withdrawals, changing patterns in groundwater recharge over time may also affect the baseflow in streams. Groundwater recharge data are often one of the more difficult components of the water budget to quantify and recharge varies spatially and temporally. In addition, a surficial aquifer may receive more recharge because of its aerial extent, whereas some of the deeper aquifers (e.g. Cretaceous) may receive less recharge because they are confined by low permeability units that can limit recharge. Mew et al. (2002) developed a GIS-based approach to estimate groundwater recharge for the Coastal Plain and Piedmont regions of North Carolina, this approach may be useful for developing watershed-scale estimates of groundwater recharge for the Albemarle-Pamlico basin.
Figure 8. USGS groundwater monitoring well locations in the Albemarle-Pamlico region (source: https://nc.water.usgs.gov/realtime/real_time_north_carolina.html).

DRAFT
21
Figure 9. NCDEQ Groundwater Management Branch Interface with layers showing active and inactive groundwater monitoring points. The red circles with black crosses indicate wells that are active and have recorders. Many of the groundwater monitoring stations are nested, meaning that at one location several wells are present at different depths. This allows for monitoring of the different aquifers present at different depths and separated by confining units.
Water Use Data The USGS has provided estimates of water use in North Carolina since 1985 and these data
are available online at: https://waterdata.usgs.gov/nc/nwis/water_use/. In this database water use data is provided by counties. We obtained the data for the counties in North Carolina that overlap with the Albemarle-Pamlico drainage basin (Bertie, Camden, Carteret, Chowan, Craven, Currituck, Dare, Durham, Edgecombe, Franklin, Gates, Greene, Halifax, Hertford, Hyde, Johnston, Jones, Lenoir, Martin, Nash, Northampton, Orange, Pamlico, Pasquotank, Perquimans, Person, Pitt, Tyrrell, Vance, Wake, Warrren, Washington, Wayne, and Wilson Counties). Figure 10 presents the water use data for these counties in North Carolina. These estimates do not include thermoelectric water use, which is only documented for Person (1 billion gallons/day), Wake (26 million gallons/day), and Wayne (8.9 million gallons/day) Counties. The counties with the largest water usage (> 20 MGD) are Wake, Martin, Craven, Durham, Halifax, Johnston, Lenoir, Pitt, Wilson, Wayne, Orange, Northampton, Bertie, and Nash Counties (Figure 10, Table 4).

DRAFT
22
Countywide USGS data can be helpful to understand regional water use and future projections. However, for ecological flows assessment, georeferenced water use data at the site and watershed-scale will be needed. DEQ public water supply data (Figure 11) show more withdrawals occurring in the Piedmont headwater counties. The large thermoelectric withdrawals for Person County (~ 1 billion gallons/day) result in thermoelectric being the largest use in the region. Excluding thermoelectric, typically the largest water use would be public supply (261 million gallons/day) followed by irrigation (114 million gallons/day). Annual data may not fully reflect the potential that irrigation may influence summer low-flows since irrigation demands peak in the growing season. Monthly data would be needed to evaluate summer low-flows.
Water withdrawals (Mgal/d)
County Public Supply Domestic Industrial Thermoelectric Mining Livestock Aquaculture Irrigation Total
Beaufort 3.99 1 62.82 0 16.2 0.3 4.37 1.2 89.88 Bertie 10.79 0.45 2.86 0.00 0.06 0.67 0.00 5.98 20.81 Camden 0.87 0.21 0.00 0.00 0.01 0.00 5.04 0.00 6.13 Carteret 6.91 1.40 0.04 0.00 0.00 0.01 0.44 1.85 10.65 Chowan 1.40 0.31 0.00 0.00 0.00 0.07 0.00 5.25 7.03 Craven 14.15 2.17 15.32 0.00 0.21 0.36 0.91 4.22 37.34 Currituck 2.73 0.50 0.00 0.00 0.41 0.01 0.00 1.99 5.64 Dare 7.51 0.71 0.00 0.00 0.00 0.00 0.00 0.51 8.73 Durham 25.56 5.62 0.00 0.00 0.11 0.05 0.00 2.43 33.77 Edgecombe 5.43 1.19 0.00 0.00 0.42 0.82 1.44 5.97 15.27 Franklin 1.36 2.84 0.00 0.00 0.08 0.32 0.02 4.84 9.46 Gates 0.95 0.26 0.00 0.00 0.00 0.20 0.00 1.44 2.85 Granville 3.54 2.12 0.00 0.00 0.00 0.20 0.00 2.35 8.21 Greene 1.83 0.45 0.00 0.00 0.01 1.79 0.00 3.54 7.62 Halifax 9.99 1.15 17.54 0.00 0.08 0.41 0.00 2.53 31.70 Hertford 2.26 0.52 2.50 0.00 0.06 0.40 0.05 4.87 10.66 Hyde 0.94 0.12 0.00 0.00 0.00 0.25 0.00 0.50 1.81 Johnston 11.62 3.50 0.00 0.00 0.42 1.24 5.04 7.85 29.67 Jones 0.82 0.21 0.00 0.00 0.00 0.92 0.10 1.63 3.68 Lenoir 11.74 1.25 0.83 0.00 0.10 1.65 10.09 3.98 29.64 Martin 1.54 0.52 58.55 0.00 0.00 0.11 0.53 2.32 63.57 Nash 10.91 2.73 0.00 0.00 0.16 0.77 0.05 5.98 20.60 Northampton 2.53 0.46 0.00 0.00 0.12 0.78 15.13 2.41 21.43 Orange 9.33 2.81 0.00 0.00 0.06 0.24 10.09 1.65 24.18 Pamlico 1.22 0.28 0.00 0.00 0.00 0.04 0.80 1.42 3.76 Pasquotank 3.39 0.85 0.00 0.00 0.00 0.01 0.00 1.06 5.31 Perquimans 1.06 0.28 0.00 0.00 0.00 0.20 0.00 1.31 2.85 Person 2.71 1.94 0.00 1,007.89 0.00 0.13 0.00 2.12 1,014.79 Pitt 17.09 3.53 0.25 0.00 0.19 1.05 1.00 5.71 28.82 Tyrrell 0.39 0.09 0.00 0.00 0.00 0.08 0.00 0.03 0.59 Vance 6.23 1.92 0.00 0.00 0.08 0.03 0.00 1.56 9.82 Wake 57.68 18.92 0.00 26.41 1.19 0.10 0.34 9.81 114.45 Warren 0.05 0.69 0.00 0.00 0.00 0.21 0.00 1.62 2.57 Washington 0.93 0.28 0.00 0.00 0.00 0.30 1.95 2.34 5.80 Wayne 11.97 2.58 0.14 8.91 0.16 3.05 0.03 7.47 34.31 Wilson 9.85 1.71 0.03 0.00 0.22 0.18 10.09 3.89 25.97
Total: 261.27 65.57 160.88 1,043.21 20.35 16.95 67.51 113.63 1,749.37
Table 4. USGS 2010 water use by county for NC counties within the A-P drainage basin.

DRAFT
23
A.
B.
Figure 10A. Total county water use for 2010 for North Carolina counties within the Albemarle-Pamlico drainage basin, excluding thermoelectric usage. Figure 10B. 2010 total county water use (including thermoelectric) for the region and select USGS flow stations (USGS, 2017).

DRAFT
24
Figure 11. Public Water Supply Permits for Albemarle-Pamlico Watershed Counties in North Carolina. Surface Water Intakes and Groundwater Wells used by Public Water Supply. Adapted from NC DEQ - Division of Water Resources, published February 2017. Feature Service by Melanie M. Williams.
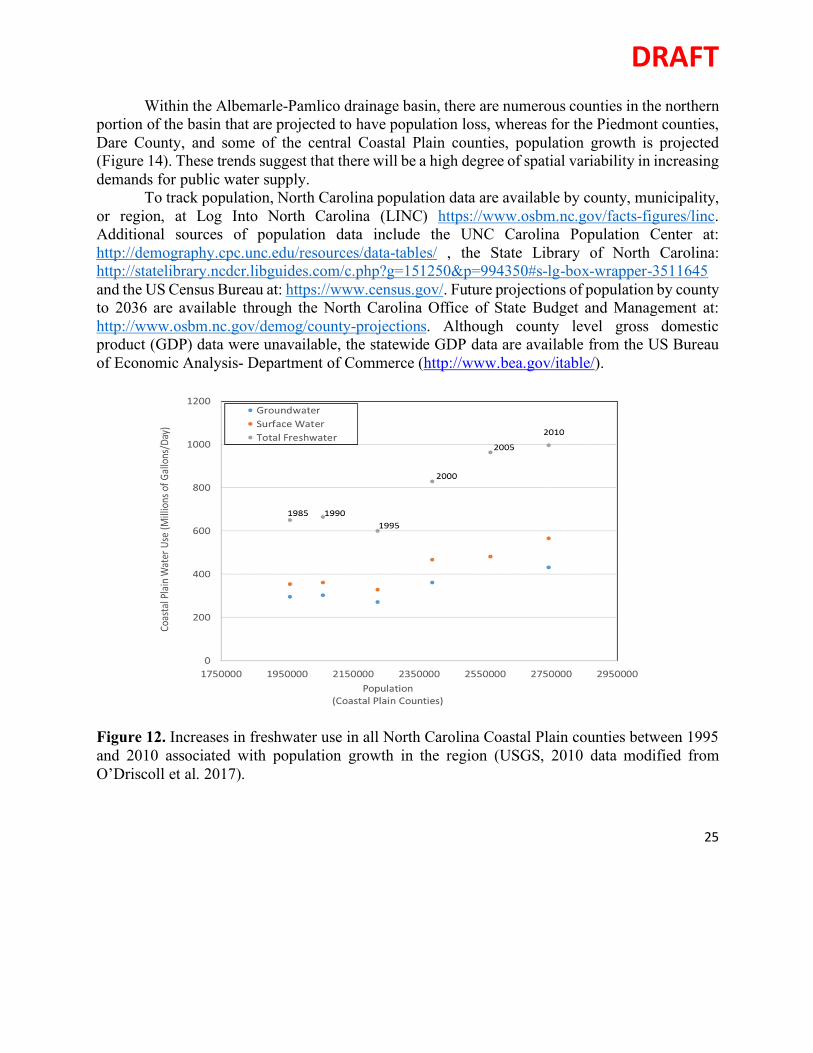
Population projections are useful for forecasting changes in public water supply demand, however industrial, thermoelectric, mining, and agricultural uses will tend to also be influenced by economic conditions. The changes in water use over time in the Coastal Plain have increased as population has grown (Figure 12) and there is evidence that changes in water demand in the Coastal Plain may also be linked to economic activity, as tracked by the North Carolina Gross Domestic Product (Figure 13). In addition, water conservation and consumer behavior can influence future water demand, and water conservation after the major droughts in the 2000s may also play a role in the recent slowdown in growth in water demand in the Coastal Plain since 2005.
DRAFT
25
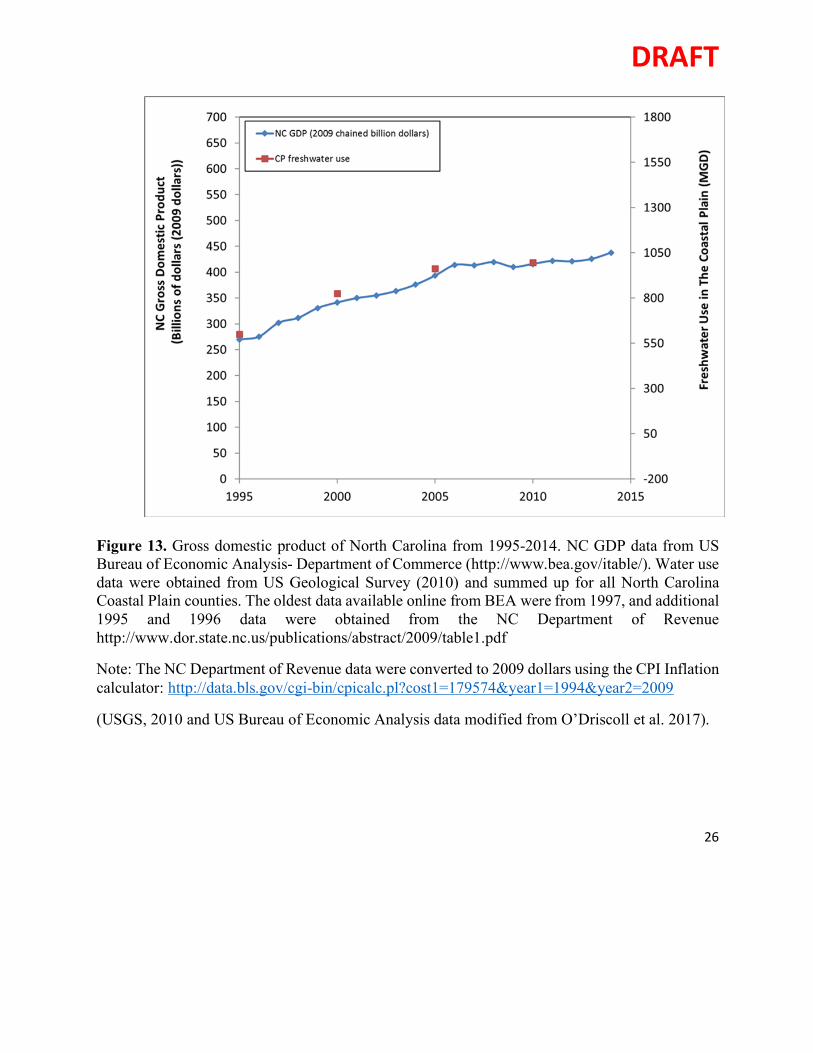
Within the Albemarle-Pamlico drainage basin, there are numerous counties in the northern portion of the basin that are projected to have population loss, whereas for the Piedmont counties, Dare County, and some of the central Coastal Plain counties, population growth is projected (Figure 14). These trends suggest that there will be a high degree of spatial variability in increasing demands for public water supply.
To track population, North Carolina population data are available by county, municipality, or region, at Log Into North Carolina (LINC) https://www.osbm.nc.gov/facts-figures/linc. Additional sources of population data include the UNC Carolina Population Center at: http://demography.cpc.unc.edu/resources/data-tables/ , the State Library of North Carolina: http://statelibrary.ncdcr.libguides.com/c.php?g=151250&p=994350#s-lg-box-wrapper-3511645 and the US Census Bureau at: https://www.census.gov/. Future projections of population by county to 2036 are available through the North Carolina Office of State Budget and Management at: http://www.osbm.nc.gov/demog/county-projections. Although county level gross domestic product (GDP) data were unavailable, the statewide GDP data are available from the US Bureau of Economic Analysis- Department of Commerce (http://www.bea.gov/itable/).
Figure 12. Increases in freshwater use in all North Carolina Coastal Plain counties between 1995 and 2010 associated with population growth in the region (USGS, 2010 data modified from O’Driscoll et al. 2017).
DRAFT
26
Figure 13. Gross domestic product of North Carolina from 1995-2014. NC GDP data from US Bureau of Economic Analysis- Department of Commerce (http://www.bea.gov/itable/). Water use data were obtained from US Geological Survey (2010) and summed up for all North Carolina Coastal Plain counties. The oldest data available online from BEA were from 1997, and additional 1995 and 1996 data were obtained from the NC Department of Revenue http://www.dor.state.nc.us/publications/abstract/2009/table1.pdf
Note: The NC Department of Revenue data were converted to 2009 dollars using the CPI Inflation calculator: http://data.bls.gov/cgi-bin/cpicalc.pl?cost1=179574&year1=1994&year2=2009
(USGS, 2010 and US Bureau of Economic Analysis data modified from O’Driscoll et al. 2017).
DRAFT
27
Figure 14. Projected growth for NC Counties- 2020-2030 (Source: NC Office of State Budget and Management – Demographics; https://files.nc.gov/ncosbm/demog/20202030growthmig.pdf
One challenge associated with understanding past, current, and future water use in the region is the absence of a publicly available statewide water use and wastewater return-flow database. Water use data are available from several different agencies, including the USGS, NCDEQ, and the NC Department of Agriculture and Consumer Services (NCDA&CS), and wastewater data are generally maintained by NC DEQ for municipal plants and some large onsite systems, by NC DHHS for a range of onsite systems, and by county health departments for residential septic systems. However, there are constraints on data availability depending on the timeframe, location, and type of use that makes it challenging to develop an accurate comprehensive watershed-scale estimate of water use and wastewater return flows. USGS can provide county-scale water use estimates from 1985 to 2010 (2015 data should be available soon), but as categories for some uses have changed over time, it may not be possible to track use by category over this entire period. For example, aquaculture uses have only been tracked since 2000. Although there are some constraints (lack of monthly data, data aggregated by county, annual

DRAFT
28
estimates only available every five years) the USGS data set provides the most comprehensive publicly-available water use dataset available for North Carolina, it accounts for use across different categories (e.g. public supply, irrigation, industry, thermoelectric, etc.), and is publicly available back to 1985. Since the USGS statewide and county data generally originate from NCDEQ records, future efforts by DEQ to make those data publicly available, georeferenced, and usable would help to improve understanding of the temporal and spatial patterns of water use. NCDEQ has a variety of water use data, but it is not as easily available as the USGS dataset and it appears to be more comprehensive for tracking public water supply use than other categories.
Overall, water use reporting to NCDEQ is based on a variety of different rules that were put in place at various times, therefore the extent of record, frequency of data collection, and reporting thresholds may vary. In our effort to understand how one might obtain comprehensive water use data for a Coastal Plain watershed, several NCDEQ employees were consulted. There are several water use tracking systems that are being used or have been used by NCDEQ based on different regulatory requirements. The availability of water use data corresponds with the timing of various statutes. For example, the Local Water Supply Plan data go back to 1992 (paper) and 1997 (online). Water Withdrawal and Transfer Registration data go back to 1993 and include agricultural water use if it was greater than 1 million gallons/day. The Central Coastal Plain Capacity Use Area (CCPCUA) data go back to 2002 and track withdrawals from registered users between 10,000 and 100,000 gallons per day and permitted users above 100,000 gallons per day. The agricultural census data reports for the CCPCUA go back to 2002. After the 2007-2008 drought, the Water Use During Drought Rules were put in place, which resulted in water use reporting moving from a 5-year cycle to an annual cycle. Finally, the Agricultural Census began statewide in 2008 and these agricultural water use data capture use above 10,000 gallons per day, and the data are aggregated by county due to privacy concerns. This dataset can be obtained from NCDA&CS. Overall, it appears that the USGS comprehensive water use assessments every five years provide the broadest effort to evaluate overall water use; these data can be very valuable for evaluating overall use trends by county over time. However, these data may not be as useful for low-flow assessments at the watershed-scale (e.g. the Neuse watershed) because county lines do not generally correspond with watershed drainage divides and monthly data over time (and by sub-watershed, e.g. Contentnea Creek) are not available to evaluate water use during the summer low-flow periods.
There appears to be a data gap associated with site-specific agricultural water use data at monthly or shorter timescales which could limit the State’s capabilities to accurately evaluate water withdrawal effects on ecological flows in the Albemarle-Pamlico watershed. The USGS provides agricultural use estimates by categories of irrigation, livestock, and aquaculture by county. Irrigation estimates (Dickens et al. 2011) are based on cropland extent per county on an annual basis. The estimates are based on the extent of irrigated land by county estimates from the USDA Agricultural Statistics Service. These numbers are used to approximate irrigation on an

DRAFT
29
annual basis and are unavailable at the monthly timeframe, making it difficult to evaluate the effects during summer months when low flows are common.
As mentioned, NCDA&CS has been performing a voluntary annual agricultural water use survey since legislation was enacted in 2008 (SL2008-0143). Based on this legislation, annual water use data (after 2012 it is bi-annual) are collected from farmers who withdraw 10,000 gallons/day or more. These data are available in summary form in reports at: http://www.ncagr.gov/stats/environmental/. Since individual responses are confidential, voluntary, and unverified, the reported data are an estimate of annual agricultural use per county and we could not find information on the accuracy of the reported withdrawals. Since many watersheds occur across county boundaries, the practical use of the available countywide data to help understand watershed-scale effects of agricultural withdrawals on streamflow are limited. Annually, agricultural water use data may be available by 8-digit HUC units, so it may be possible to look at annual spatial patterns in agricultural water use at that scale.
Based on a brief review of the agricultural water use estimates from USGS and NCDA&CS, it was evident that potential differences in withdrawal estimation approaches between USGS and NCDA&CS can result in significant differences in countywide estimates of agricultural water use. Since the NCDA&CS survey began in 2008, there is currently only one year that overlaps with USGS data (2010). For 2010, the NCDA&CS data estimate 63.4 million gallons/day of agricultural water usage statewide, whereas the USGS 2010 statewide estimate (sum of irrigation, aquaculture, and livestock uses) suggests 1.9 billion gallons/day. Table 5 illustrates the differences for the 11 counties in the Coastal Plain that had estimates that were different by more than 10 million gallons/day. When estimates were compared, USGS agricultural water use estimates were consistently larger. More work is needed to confirm the most accurate approaches for estimating agricultural water use to be included in ecological flow assessments. Agricultural users that withdraw more than 10,000 gallons/day in the Central Coastal Plain Capacity Use Area report directly to NCDEQ; therefore, NCDA&CS estimates are likely underestimated. In addition, not all agricultural users that are sent surveys respond, so the survey-based estimate can potentially underestimate the actual water use. We were unable to find comprehensive agricultural use data (combined NCDACS and NCDEQ datasets) at the county or watershed-scale, and it appears that the NCDEQ data collected separately would need to be added to the NCDA&CS data to get total agricultural use data for a county. An additional reason for differences may also be that USGS includes golf courses in their irrigation estimates but NCDA&CS does not. In addition to agricultural and public supply uses, industrial, thermoelectric, and mining uses may be important in some watersheds, and the availability and accuracy of estimates of these uses should also be considered in water budgets.

DRAFT
30
Table 5. A comparison of agricultural water use estimates between USGS and NCDA&CS countywide estimates for 2010 for counties that had differences in estimates of over 10 MGD.
Figure 15. Location of Central Coastal Plain Capacity Use Area, these counties have regulations associated with the magnitude of groundwater withdrawals from the Cretaceous aquifer system (source: DEQ).

DRAFT
31
Flow Alteration Data Dams
Several river systems within the Albemarle-Pamlico region are affected by the presence of dams. The US Army Corps of Engineers National Inventory of Dams contains a database including dams along NC rivers. Based on filtering the data just for Albemarle-Pamlico basin counties (or watersheds), there are approximately 1106 dams located along rivers draining the basin. Figure 16 shows the locations of the major dams in the North Carolina portion of the Albemarle-Pamlico drainage basin and more information on their characteristics is provided in the Appendices. These data (and USGS flow data) suggest that the Roanoke River’s discharge patterns are highly influenced by the operation of dams and should not be considered as reference sites for evaluating ecological flows, unless there are flow data available prior to dam construction. However, understanding the effects of dam operation on ecological integrity downstream can be an important aspect of ecological flow management.
Figure 16. Map of major North Carolina rivers in and around the Albemarle-Pamlico drainage basin (red outline). High hazard dams within the region, are represented by red points. The dams in the region, that did not fall into a high hazard category, are represented by blue points. Modified Dams layer from Nationalmap.gov Current Data Release (March 2006). https://nationalmap.gov/small_scale/atlasftp.html#dams00x
DRAFT
32
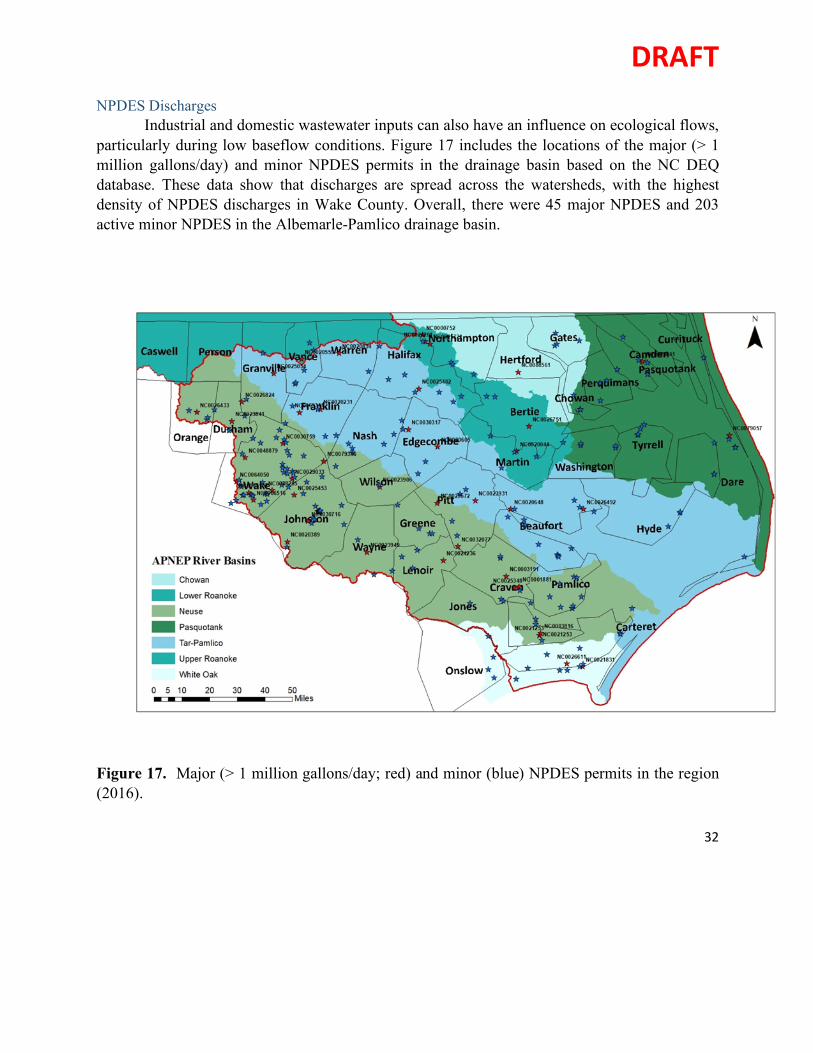
NPDES Discharges Industrial and domestic wastewater inputs can also have an influence on ecological flows, particularly during low baseflow conditions. Figure 17 includes the locations of the major (> 1 million gallons/day) and minor NPDES permits in the drainage basin based on the NC DEQ database. These data show that discharges are spread across the watersheds, with the highest density of NPDES discharges in Wake County. Overall, there were 45 major NPDES and 203 active minor NPDES in the Albemarle-Pamlico drainage basin.
Figure 17. Major (> 1 million gallons/day; red) and minor (blue) NPDES permits in the region (2016).

DRAFT
33
Land Use Change Numerous studies (summarized in O’Driscoll et al. 2010) document the effects of
urbanization on Coastal Plain streamflow. The common response is flashier streamflows, increased peakflows, and decreased lag times between rainfall and runoff downstream of locations with increased watershed total impervious area (>~10% TIA). In response to increased peakflows, stream channel dimensions typically enlarge (deeper and wider channels due to stormwater-related erosion). For watersheds with TIA greater than 5% impervious area, the chances for changes in flow regime increase and will be more noticeable for lower-order streams. Exum et al. (2005) provided recent and future projections for total impervious area for North Carolina (Figure 18). Their data suggest that the main areas where TIA increases will likely affect streamflow regimes are the Piedmont headwater sections of the Neuse and Tar-Pamlico basins, and the Wilson, Rocky Mount, Greenville, New Bern, Jacksonville, and Morehead City areas. Although stormwater inputs typically increase with increased impervious area, baseflow inputs may increase or decrease depending on a variety of factors including leaking urban infrastructure, wastewater management, irrigation, and effects on groundwater recharge.
To track land cover changes over time, the National Land Cover Dataset (NLCD) data can be used (Homer et al., 2015). Recently, Google Earth Pro has provided historical aerial photographic imagery back to 1972 for some regions. In addition, USGS StreamStats program can provide land cover data for individual watersheds back to 1992. For North Carolina, GIS data can be acquired at the Center for Geographic Information and Analysis (NCCGIA) at: http://www.cgia.state.nc.us/. The dominant land covers in the North Carolina Coastal Plain include agricultural row crops (24%), coniferous cultivated plantations (11%), water (15%), and pocosin woodlands and shrublands (7%). Wetlands are a dominant feature, with approximately 17% of the region comprised of forested or herbaceous wetlands (McKerrow et al. 2006). A detailed analysis of land cover in the North Carolina Coastal Plain was developed by the North Carolina Gap Analysis Project (McKerrow et al. 2006). In addition, NCDEQ in cooperation with NCCGIA developed the “High Quality Water and Outstanding Resource Water Management Zones” tool to enhance planning, siting and impact analysis. This tool covers areas directly affecting waters having excellent (high) water quality or designated as an outstanding resource. GIS data can be downloaded at: http://data.nconemap.gov/downloads/vector/hqworw.zip

DRAFT
34
Figure 18. Total impervious area (TIA) projections for North Carolina to 2030 (Exum et al. 2005).
Water Quality Although a wide range of water quality parameters may affect ecological integrity, we primarily focused on salinity because of its importance in coastal aquatic habitats. In general, river discharge plays an important role in river and estuarine water quality because of its effects on temperature, dissolved oxygen, the transport of organic matter, nutrients, and contaminants, and effects on dilution

DRAFT
35
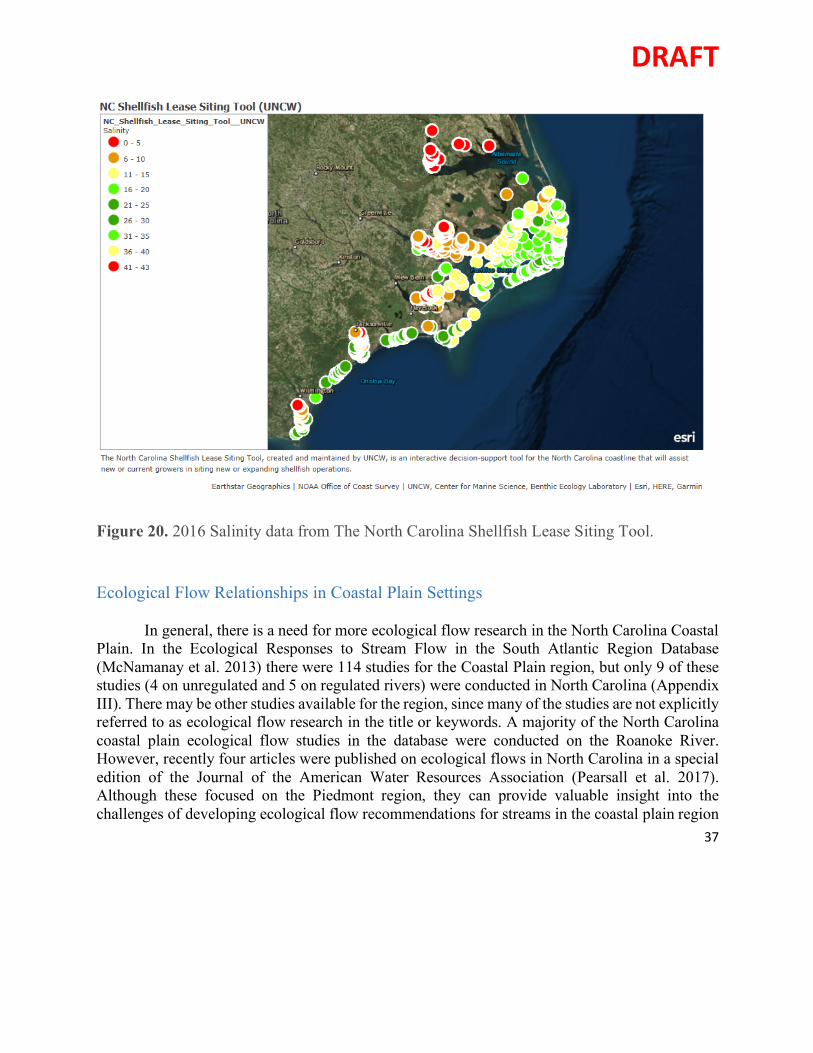
of contaminants and/or salinity associated with ocean or estuarine waters. In Appendix I, other information is included on publicly available water quality data that may be useful for future ecological flow assessment work. The salinity data in the region is typically collected by NC DEQ and the USGS. Recent work by Moorman et al. 2014 documented the estuarine monitoring programs in the Albemarle Sound region and is provided in Appendix VI. In addition to surface water, NCDEQ also monitors salinity at select groundwater monitoring wells (Figure 9). Figure 19 provides the locations of surface water salinity monitoring stations. Typically, surface water quality monitoring stations include pH, conductivity, water temperature, and dissolved oxygen data. In addition, NCDEQ manages a shellfish sanitation water quality monitoring program along the coast that may provide data relevant to ecological flows (Figure 20). The most comprehensive source of water quality data appears to be the National Water Quality Monitoring Council database that includes NCDEQ, EPA, USGS and other data (more user friendly than EPA STORET). Overall, major sources of water quality data include:
• USGS, National water quality database: https://water.usgs.gov/owq/data.html
• EPA, STORET (Storage and Retrieval): http://www.epa.gov/storet/
• National Water Quality Monitoring Council: https://acwi.gov/monitoring/waterqualitydata.html
• NCDEQ Ambient Water Quality Monitoring: https://deq.nc.gov/about/divisions/water-resources/water-resources-data/water-sciences-home-page/ecosystems-branch/ambient-monitoring-system
• USGS, Real time data for 23 sites
https://waterdata.usgs.gov/nc/nwis/current/?type=quality&group_key=basin_cd

DRAFT
36
Figure 19. Salinity sites on the A-P estuary (ranging from 1970-2016) ArcGIS layer. Source NC DEQ Water Quality Salinity Measurements.
DRAFT
37
Figure 20. 2016 Salinity data from The North Carolina Shellfish Lease Siting Tool.
Ecological Flow Relationships in Coastal Plain Settings In general, there is a need for more ecological flow research in the North Carolina Coastal
Plain. In the Ecological Responses to Stream Flow in the South Atlantic Region Database (McNamanay et al. 2013) there were 114 studies for the Coastal Plain region, but only 9 of these studies (4 on unregulated and 5 on regulated rivers) were conducted in North Carolina (Appendix III). There may be other studies available for the region, since many of the studies are not explicitly referred to as ecological flow research in the title or keywords. A majority of the North Carolina coastal plain ecological flow studies in the database were conducted on the Roanoke River. However, recently four articles were published on ecological flows in North Carolina in a special edition of the Journal of the American Water Resources Association (Pearsall et al. 2017). Although these focused on the Piedmont region, they can provide valuable insight into the challenges of developing ecological flow recommendations for streams in the coastal plain region
DRAFT
38
(Appendix IV). In addition, we conducted a literature review for relevant ecological flow research in the southeastern U.S. with an emphasis on coastal regions. This information is attached in Appendix VII. Based on the literature review and annotated bibliography, there were several findings that may apply to future efforts to understand and develop ecological flow guidelines for the region. Pearsall et al (2017) summarized four articles related to developing ecological flows in NC. Their significant findings are listed below: • Fish guild diversity and macroinvertebrate richness showed significant and consistently
negative responses to reductions in flow evaluated through a series of modeled hydrologic metrics.
• The space-for-time analysis approach for establishing flow-biology relationships was validated through the development of statistically significant relationships across both the diversity of multiple fish guilds and the richness of macroinvertebrates.
• Hydro-ecological stream classification systems were not found to be transferable, and their application did not improve the strength of flow-biology relationships.
• Classification based on preexisting regional classification systems did not improve the flow-biology relationships.
• Seasonality, as it pertains to flow reduction, was an important differentiator in the significant relationships with greater sensitivity to reduced streamflow during lower flow seasons.
• In addition to the NC studies, an abundance of studies have found that anthropogenic alteration of the natural flow regime resulted in negative effects to stream biota.
• Much of the previous ecological flow work performed in other states included cooperative efforts from the USGS, Nature Conservancy, and US Army Corps of Engineers, working alongside state agencies.
• The majority of studies found regarding ecological flow work for the southeastern U.S. have been performed in Florida. These include low flow/increased salinity impacts on biota as well as potential methods for determining minimum flows.
Notable Data Gaps
During our data search, there were numerous notable data gaps. One of the primary issues is that generally to the east of Greenville (Tar River), Hamilton (Roanoke River), and Kinston (Neuse), there are no streamflow gages between those locations and the coast. In most coastal plain locations at land elevations below approximately 3 m above sea level, there is an absence of flow monitoring. This data gap will make it difficult to evaluate and verify ecological flows for a large portion of the drainage basin using long-term flow records. In the future, the USGS National Water Census Coastal Carolinas Water Availability Study may provide more data on discharge in the outer coastal plain region (also referred to as the tidewater region, the low-lying portion of the

DRAFT
39
Coastal Plain closest to the coast that is comprised of all or a portion of the counties that directly border the ocean or estuarine shoreline from Brunswick County to the south to Currituck County in the north). However, the USGS study area is centered on the Cape Fear basin and the region around Wilmington, NC and Myrtle Beach, SC. Also, salinity data tends to be collected in the estuaries, and for future monitoring of saltwater intrusion it would be helpful to include more monitoring in inland watersheds. In the future, it would be helpful to have more discharge and salinity monitoring stations in rivers near the coast to track sea level rise, subsidence, climate change, and land-use change effects on saltwater intrusion.
To construct accurate water budgets, actual evapotranspiration data would increase the accuracy. There is only one Ameriflux site in the region (Plymouth, NC) where actual evapotranspiration data is collected. It is likely that extrapolating these data across the entire drainage basin would lead to some error. Efforts to scale these data using remote sensing approaches may improve ET estimates for individual watersheds leading to more accurate water budgets and better understanding of meteorological controls on low-flows and ecological flows.
There were a variety of gaps in water use data that would prevent the construction of accurate water budgets in the region. However, approximate water budgets may be possible. In general, there is a lack of publicly-available, detailed, fine-scale water withdrawal data that can be used to assess the temporal variations in water usage at the sub-watershed or watershed scale and for individual aquifers, e.g. the surficial aquifer. The lack of data hinders our understanding of how anthropogenic changes such as groundwater pumping and surface water withdrawals might impact low-flow in Coastal Plain streams. Although data are available for groundwater withdrawals for large scale industrial, public supply and agricultural water users, data are generally unavailable for smaller-scale users and residential use outside of municipal suppliers. The USGS dataset is a great resource for tracking water use by County and over large (5 year) timesteps. However, these data may not contain enough information on spatial and temporal variability of withdrawals to be useful for evaluating withdrawal effects on summer low-flows. Understanding summer low-flows is critical to ecological flows because these are likely the peak water stress periods for the region. More information and analysis is needed to understand how they respond to recent meteorological conditions and anthropogenic inputs and withdrawals, as well as future land-use and climate change.
In suburban areas where residences rely on groundwater, it is not clear what densities of wells and magnitudes of withdrawals may affect groundwater levels and baseflow to the streams. This is especially true for nearby low-order streams that are draining the same aquifer that is being pumped. If the sites are using septic systems and their groundwater withdrawals are from the surficial aquifer, the withdrawals are less likely to significantly affect baseflow. In areas that obtain municipal water supply and use septic systems, there can be additional groundwater recharge and an increase in baseflow associated with the wastewater inputs to the surficial aquifer (Iverson et al. 2015). In neighborhoods where groundwater is withdrawn but wastewater is sent to a treatment plant outside of the watershed, baseflow may decline. Since counties manage the residential

DRAFT
40
wastewater data, there are differences across counties with respect to data availability and quality. In general, not every county has a comprehensive database accounting for all septic systems and no county that we are aware of has tracked actual wastewater discharge data over time for residential systems. However, estimates can be made if water use data are available and outdoor water use (that will not return to the surficial aquifer via wastewater inputs from onsite wastewater systems) is accounted for. Although counties generally track the number of private wells (earlier data prior to 1990s is less comprehensive), all wells may not be accounted for and records of water use for private wells are typically not available. Spatial and temporal data gaps concerning withdrawals and wastewater return flows would need to be filled to construct accurate water budgets in these watersheds, particularly in areas where high densities of wells are present. However, in the absence of actual metered water use data, USGS has developed a range of methods for estimating water uses that can be extrapolated using population and land cover data (Maupin et al. 2014, Dickens et al. 2011).
Agricultural water use can be important in Albemarle-Pamlico watersheds with extensive agricultural lands. Currently, agricultural water use data are generally provided at longer timescales (monthly to annual) and on a county basis. Since there are major differences in agricultural use estimates between the USGS and NCDA&CS data it is difficult to determine which approach is most accurate based on the data available. Precipitation, evapotranspiration, streamflow, and water use data are all needed to isolate the relative effects of meteorological controls on water withdrawals. Generally, the water-use data (outside of public supply) are often the least documented. In addition, little information is available for irrigation return flows and consumptive use for specific watersheds within the region. Other states in the southeast have begun efforts to better account for water use, with notable programs for agricultural water metering in Georgia (Torak and Painter, 2011; Hawkins and Harrison, 2015). Stream discharge monitoring stations are most often located on larger (higher-order) streams, so there is a gap in discharge data for smaller streams. As shown in Figure 4, watersheds with drainage areas less than approximately 225 square miles are more vulnerable to drying up during periods of precipitation deficits. More information is also needed on groundwater inputs along coastal plain streams (magnitude, spatial and temporal variability, and source aquifer). Seepage runs (nested discharge measurements along a stream) during summer low-flow conditions would help characterize the spatial variability in groundwater inputs. In addition, hydrograph separation models could be used to quantify stormwater runoff compared to groundwater inputs at pre-existing stream gauges. Recent work on age dating and residence time estimation of coastal plain groundwater inputs to streams can also help improve understanding of the stream-groundwater interactions and their effects on baseflow quantity and quality in the region, factors that are ultimately influential on ecological flows.

DRAFT
41
Conclusions and Recommendations for Further Study Based on the surface water, groundwater, meteorological, and water use data available we
recommend a pilot study to evaluate if accurate water budgets can be constructed at the sub-watershed scale using pre-existing data. The approach would be to compare a water budget using publicly available data to a water budget derived with additional water use and flux data after intensively monitoring the same watershed. A comparison between these two approaches would provide a deeper understanding of how accurate current methods may be used to gain a better understanding of the spatial and temporal variability of water use and water fluxes in a coastal watershed. Improvements could be made if georeferenced data are collected monthly and verified with water meters at a pilot, small watershed-scale. Since the Central Coastal Plain Capacity Use Area (Figure 15) falls within the Albemarle-Pamlico Basin, it may be an ideal location for a pilot study because water use is tracked more closely in these counties and the data are publicly available since 2002: http://www.ncwater.org/Permits_and_Registration/Capacity_Use/Central_Coastal_Plain/ccpcuatables_reported.php.
Due to its long-term flow record, Contentnea Creek, may be a good candidate for further
study. In addition, the Little River shows evidence of declining low-flows and further study could help to explain why. The Trent River station near Trenton is one of the limited number of discharge stations adjacent to the Outer Coastal Plain that has a long-term record, this watershed would also be a good candidate for ecological flow research. These potential studies could focus on answering several research questions: • What are the most accurate and least accurate water flux and use estimates? • How can gaps in water use data be filled? • What are barriers to understanding the dominant influences on ecological flows at the
watershed-scale? • What are the relative influences of meteorological forcing versus water withdrawals on low-
flows? • Are current low flows protective of ecological integrity? What threshold of water use would
adversely affect streamflow and/or ecological integrity? • How will climate change, withdrawals, and land-use change affect low flows in the future? • What are the general stressor-response relationships between flow alteration and ecological
health? • Based on pre-existing data, can the stressor-response relationships be adequately evaluated and
if not, what types of data are needed in the future? In addition, a study of low flows using pre-existing data would be helpful. A comparison
of watersheds with heavy water-use versus light water-use (potentially Potecasi Creek) could help to isolate the influence of withdrawals on low-flows. In general, there has been a lack of ecological flow studies in the basin, particularly in the coastal plain region. Therefore, we recommend seeking funding and partnerships (USGS, DEQ, The Nature Conservancy, etc.) to research watershed-

DRAFT
42
based ecological flows for coastal watersheds. Research should focus on the ecological responses to low-flows and variability in pulses, flooding, and salinity in these coastal watersheds. Since climate change and land-use change may affect river flows in the region in the future, work focused on potential changes to flows, salinity, and ecological response would also be needed to help guide water resources, fisheries, and land-use management in the future.
A first step towards understanding ecological flows in the region would be to perform flow analysis on the long-term discharge records in the region along river reaches that are not regulated. We recommend that these analyses be performed on the discharge records at the 19 stations provided in Table 1. The Indicators of Hydrologic Alteration software (IHA: the Nature Conservancy) is public domain and provides a range of statistical analyses geared towards ecological flows. We recommend that the flow analyses first be performed using the IHA software and streams categorized based on the initial classification system suggested by the Coastal Ecological Flow Working Group (CEFWG) (Figure 23) in the “Recommendations for Estimating Flows to Maintain Ecological Integrity in Streams and Rivers in North Carolina” submitted to the North Carolina Department of Environment and Natural Resources by the North Carolina Ecological Flows Science Advisory Board (NCDEQ 2013) (APPENDIX III). A preliminary assessment of the low-flow data was provided by Hillman et al. 2018 and is included in Appendix VI. An example is provided for Little River near Princeton, NC (Figure 21) (USGS Station- 0208850).
The preliminary low flow assessment for the Albemarle-Pamlico drainage basin (sites listed in Table 1) performed by Hillman et al. (2018) found that:
• Lowest flows typically occurred between August and October. • Streams that drained smaller watershed areas (<225 square mi) typically had the lowest
7Q10s and were most vulnerable to drying up. • The trends in zero flow days, baseflow index, and extreme low flow frequencies suggested
that low flows are becoming more common in the region, similar to the broader findings by Weaver (2016) and Meitzen (2016).
Based on this initial low flow assessment, it was suggested that future work consider: • Flow and ecological sampling across gradients of flow alteration to quantify ecological
response (Poff and Zimmerman 2013). • More detailed (spatial and temporal) water use data to evaluate the influence of water
withdrawals on low flows, particularly during periods of low flows (summer months) and in areas with greater water use.
• Analysis to evaluate the relative influence of water use versus meteorological controls on low flows. Determination of the influence of low flows on coastal salinity patterns and timing of freshwater pulsing to the coast.

DRAFT
43
Figure 21. IHA environmental (or ecological) flow components for the Little River discharge record from 1930-2018. Monthly flows in August, base flow, and extreme low flows all showed a trend of decreasing low flows over time.

DRAFT
44
Since there is limited information on baseflow (groundwater) inputs to coastal plain streams and the spatial and temporal variability of groundwater recharge in the region, future field and modeling studies that quantify groundwater inputs along discrete reaches of coastal plain rivers would help to identify reaches with greater groundwater inputs. Seepage runs could be used to help understand summer low-flows and the water table fluctuation method could be used to quantify recharge in different hydrogeomorphic settings. Earlier studies of river-groundwater interactions in the NC Coastal Plain have shown a high degree of spatial and temporal variability in groundwater inputs (O’Driscoll et al. 2010). Overall, since there are several barriers to acquiring water use and wastewater return flow data at various temporal and spatial scales, it appears that it would be worthwhile to bring together water use and water flux experts from USGS, NCDEQ, NCDA&CS, NC Climate Office, NCDHHS, the water utilities, consulting firms and academia with the goal of developing a comprehensive water accounting system for the region. Without accurate comprehensive water use and return flow data available at monthly or shorter timescales it will be difficult to understand the cause of the recent declines in low flows in the region documented by Weaver (2016) and Meitzen (2016). Ultimately having accurate, georeferenced water use and wastewater discharge data available to the public would lead to enhanced understanding of the effects of water withdrawals and water and wastewater management on ecological flows. Based on Session Law 2010-143, the NC DEQ is required to develop basinwide hydrological models for each of NC’s 17 river basins to predict the places, times, and frequencies at which ecological flows may be adversely affected in North Carolina (NC DEQ 2013). Future work on ecological flows in the Albemarle-Pamlico Drainage Basin should aim to complement the mandated efforts by NC DEQ: (https://deq.nc.gov/about/divisions/water-resources/water-planning/basin-planning/ecological-flows).
Ecological flow programs have progressed in other southeastern coastal states (Table 6). Many suggest that adaptive management is an important component of ecological flow management. This kind of approach in which federal, state, and local agencies work in cooperation with stakeholders to achieve ecological flow management objectives may be the most likely to succeed. In most states, the water or environmental agency in the state takes the lead, in this case that would be the North Carolina Dept. of Environmental Quality. Moving forward, APNEP and DEQ should coordinate to develop a process to define ecological flow goals and criteria for the Albemarle-Pamlico Drainage Basin. The process should include a broad range of stakeholders. The earlier NC efforts to develop scientifically defensible flow guidelines for the state that protect ecological integrity of rivers included representatives from DEQ, NC Wildlife Resources Commission, NC Div. of Marine Fisheries, the NC Natural Heritage Program, the U.S. Fish and Wildlife Service, the National Marine Fisheries Service and a variety of scientists and other experts (NC DEQ 2013). Future efforts for the Albemarle-Pamlico drainage basin should include a similar broad stakeholder group and consider regional and local stakeholders.
For example, in Virginia, the ecological flow work is being spearheaded by the Office of Surface and Ground Water Planning (OSGWSP), VA Dept. of Environmental Quality. This

DRAFT
45
effort is in collaboration with the US Environmental Protection Agency, US Geological Survey, VA Dept. of Game and Inland Fisheries, academic experts, the Nature Conservancy, and the Interstate Commission on the Potomac River Basin. Some of their work is included in Appendix IX. It would be instructive to review their most recent efforts to understand some of the challenges associated with evaluating and developing ecological flow recommendations in this region. Virginia also has some work completed by the USGS (and some covers portions of the Roanoke and Chowan watersheds that drain land in Virginia). For, example recent work completed by the USGS in Virginia can provide some guidance on the type of work needed in the Coastal Plain region of the Albemarle-Pamlico drainage basin (Rapp and Reilly 2017: https://pubs.usgs.gov/of/2017/1088/ofr20171088.pdf). Their work on flow reduction effects on aquatic biota in Virginia suggested that decreases in flows contributed to a shift in aquatic biota to generalized and less diverse species assemblages (more generalized fish communities and more tolerant macroinvertebrates (Chironomidae and Hydropsychidae)). In future efforts to develop ecological flow guidelines for the Albemarle-Pamlico basin, it would be helpful to review the current status of efforts in Virginia and to consult with their Office of Surface and Ground Water Planning (OSGWSP) at the VA Dept. of Environmental Quality to gauge the level of effort, resources, data, and technical expertise needed to develop a program at a broad scale. In Virginia and other states, the USGS and the Nature Conservancy have also played large roles in ecological flow work.
A framework for developing ecological flow guidelines is presented by Poff et al. (2010) in Figure 22. Based on NC DEQ’s progress in basinwide modeling efforts and the USGS flow gauging network, the first step of building the hydrologic foundation is in progress but needs to be guided towards the comprehensive coverage of the specific watersheds of the Albemarle-Pamlico drainage basin and may require new data collection efforts to fill in the gaps in flow data for the region, but particularly the outer Coastal Plain. The second step, classification of river segments, has been completed by the Coastal Ecological Flows Working Group (DEQ 2013) (Figure 23). Actions associated with the third step, determining the amount of hydrologic alteration and fourth step, developing the flow-ecology response relationships associated with degrees of hydrologic alteration and changes in ecological condition, are still needed. Once flow-ecology relationships are developed for the region, these can be used to identify specific environmental flow criteria which fall within the range of acceptable change to hydrologic and ecological conditions. Stakeholder input is needed to characterize the value-based definition of “acceptable” conditions. This report, datasets, and the associated information can serve as a first step towards developing an ecological flow program for the drainage basin. This program can help to provide guidelines that can quantify and balance ecological and development demands on the limited water resources of the region and educate the stakeholders on the finite nature of water resources.

DRAFT
46
*States in which there are regulations associated with ecological flows
Table 6. Ecological flow information for other southeastern coastal states.
State(s) Title/Description Reference Alabama, Georgia
Watershed Modeling and Development of Ecological Flows in ACF River Basin (USGS, 2016) Water Availability for Ecological Needs in the Upper Flint River Basin, Georgia (USGS, 2006) Water Allocation and Natural Resource Protection in the ACT and ACF River Basins (FWS)
https://www.srs.fs.usda.gov/pubs/gtr/gtr_srs211/gtr_srs211_085.pdf https://pubs.usgs.gov/fs/2006/3114/pdf/fs2006-3114.pdf https://www.fws.gov/athens/rivers/ACT_ACF.html
Delaware Ecosystem Flow Recommendations for the Delaware River Basin (TNC, 2013)
https://www.state.nj.us/drbc/library/documents/TNC_DRBFlowRpt_dec2013.pdf
Florida*
Minimum Flows and Minimum Water Levels (MFLs) Program Water Use Reservations (Reservations) Program
https://floridadep.gov/water-policy/water-policy/content/minimum-flows-and-minimum-water-levels-and-reservations
Maryland, Virginia Texas
Maryland Biological Stream Survey – Environmental Flows (MDDNR) Middle Potomac River Watershed Assessment: Potomac River Sustainable Flow and Water Resources Analysis (USACE, 2013) Physical Habitat Classification and Instream Flow Modeling to Determine Habitat Availability During Low-Flow Periods, North Fork Shenandoah River, Virginia (USGS, 2006) South Fork Shenandoah River Habitat-Flow Modeling to Determine Ecological and Recreational Characteristics during Low-Flow Periods (USGS, 2006) Virginia Flow-Ecology Modeling Results: An Initial Assessment of Flow Reduction Effects on Aquatic Biota (USGS, 2017) Virginia Ecological Limits of Hydrologic Alteration (ELOHA): Development of Metrics of Hydrologic Alteration (TetraTech, 2012) Texas Instream Flows Program (TIFP) Environmental Flow Process Freshwater Inflow Needs Program
http://dnr.maryland.gov/streams/Pages/hydroeco.aspx https://www.potomacriver.org/wp-content/uploads/2014/12/MPRWA_FINAL_April_2013.pdf https://pubs.usgs.gov/sir/2006/5025/sir06_5025.pdf https://pubs.usgs.gov/sir/2012/5081/pdf/sir2012-5081.pdf https://pubs.usgs.gov/of/2017/1088/ofr20171088.pdf http://deq1.bse.vt.edu/sifnwiki/images/5/5d/Tasks_3-4_draft_femodels20120109.pdf http://www.twdb.texas.gov/surfacewater/flows/index.asp#inflow

DRAFT
47
Figure 22. The framework for evaluating Ecological Limits of Hydrologic Alteration (ELOHA). Modified from Poff et al. 2010.
Figure 23. Proposed classification of Coastal Plain streams in the Albemarle-Pamlico Drainage Basin (originally developed by the Coastal Ecological Flows Working Group; NC DEQ 2013).

DRAFT
48
Appendices
Appendix I- Web resources (master spreadsheet with webpages) APPENDICES\APPENDIX I Ecological Flows Main Spreadsheet.xlsx Appendix II - recommendations for establishing ecological flows in coastal waterways from the Coastal Ecological Flows Working Group (NC DEQ 2013) APPENDICES\APPENDIX II Recommendations_for_Maintaining_Flows_2013.pdf Appendix III – (attached spreadsheet) a previously compiled database focused on ecological flows in the southeastern U.S. by McManamay et al. 2013. APPENDICES\APPENDIX III Ecological_Responses_to_Flow_Alteration DATABASE.xlsx Appendix IV - The recent (February 2017) Journal of the American Water Resources Association included 4 articles in a collection focused on ecological flows in North Carolina streams entitled “North Carolina Ecological Flows.” APPENDICES\APPENDIX IV NC ecological flows special issue Appendix V – Estuarine monitoring programs in the Albemarle Sound study area by Moorman et al. 2014. APPENDICES\APPENDIX V Estuarine monitoring in the Albemarle Sound.pdf Appendix VI- NC Water Resources Research Poster Presentation entitled “Evaluating ecological flows in the Albemarle Pamlico Basin” by Hillman et al. 2018. APPENDICES\APPENDIX VI Hillman ecological flows WRRI 2018 Poster.pdf Appendix VII- Annotated bibliography of ecological flow literature from the southeastern U.S. APPENDICES\APPENDIX VII Ecological Flow Annoted Bibliography.pdf Appendix VIII- NC DEQ benthic data APPENDICES\APPENDIX VIII NC DEQ Benthic Data.xlsx Appendix IX- VA Virginia Ecological Limits of Hydrologic Alteration (ELOHA): Development of Metrics of Hydrologic Alteration Report (TetraTech, 2012) APPENDICES\APPENDIX IX VA Ecological Limits to Flow Alteration.pdf

DRAFT
49
References Ameriflux (http://ameriflux.lbl.gov/). AmeriFlux Management Project, U.S. Department of Energy’s Office of Science. Brooks, K., Ffolliott, P., and Magner, J. 2013. Hydrology and the Management of Watersheds. 4th edition. John Wiley and Sons. Carlston, C. 1963. Drainage density and streamflow. Geological Survey Professional Paper 422-C. https://pubs.usgs.gov/pp/0422c/report.pdf Center for Geographic Information and Analysis (CGIA) at : http://www.cgia.state.nc.us/. CPI Inflation calculator: http://data.bls.gov/cgi-bin/cpicalc.pl?cost1=179574&year1=1994&year2=2009 Dickens, J.M., Forbes, B.T., Cobean, D.S., and Tadayon, S. 2011, Documentation of methods and inventory of irrigation data collected for the 2000 and 2005 U.S. Geological Survey Estimated use of water in the United States, comparison of USGS-compiled irrigation data to other sources, and recommendations for future compilations: U.S. Geological Survey Scientific Investigations Report 2011–5166, 60 p. ECONET stations (http://climate.ncsu.edu/map/?q=cronos/map/) Exum, L.R.; Bird, S.L.; Harrison, J.; Perkins, C.A. Estimating and Projecting Impervious Cover in the Southeastern United States. Ecosystems Research Division, National Exposure Research Laboratory, U.S. Environmental Protection Agency: Athens, GA, USA, 2005; p. 133. Giese, G. and Mason, R. 1991. Low-flow characteristics of streams in North Carolina. USGS Water Supply Paper 2403. https://pubs.er.usgs.gov/publication/wsp2403 Hawkins and Harrison, 2015. Water Meters as a Water Management Tool on Georgia Farms. Bulletin 1296, UGA-extension. http://extension.uga.edu/publications.html. Homer, C. G., Dewitz, J. A., Yang, L., Jin, S., Danielson, P., Xian, G., Coulston, J., Herold, N., Wickham, J. & Megown, K. (2015). Completion of the 2011 National Land Cover Database for the conterminous United States-Representing a decade of land cover change information. Photogramm. Eng. Remote Sens, 81(5), 345-354.

DRAFT
50
Hillman, I. and O’Driscoll, M. 2018. Evaluating ecological flows in the Albemarle-Pamlico Basin. NC Water Resources Research Institute Conference. Raleigh, NC. March 14-15. Iverson, G., O'Driscoll, M., Humphrey, C., Manda, A., and Anderson-Evans, E. Wastewater nitrogen contributions to coastal plain watersheds, North Carolina, USA. Water, Air, and Soil Pollution Oct.:226-325. Log Into North Carolina (LINC) (https://www.osbm.nc.gov/facts-figures/linc). Maupin, M.A., Kenny, J.F., Hutson, S.S., Lovelace, J.K., Barber, N.L., and Linsey, K.S., 2014, Estimated use of water in the United States in 2010: U.S. Geological Survey Circular 1405, 56 p., http://dx.doi.org/10.3133/cir1405. McKerrow, A., Williams, S., and Collazo, J. 2006. The North Carolina Gap Analysis Project. US Geological Survey. Mew, H., Hirth, D., Van Lewis, D., Daniels, R., and Keyworth, A. 2002. Methodology for Compiling Ground Water Recharge Maps in the Piedmont and Coastal Plain Provinces of North Carolina. Ground Water Bulletin Number 25. NCDENR, Raleigh, NC. Meitzen, K.M. 2016. Stream flow changes across North Carolina (USA) 1955-2012 with implications for environmental flow management. Geomorphology 252, 171-184. McManamay, R., Orth, D., Kauffman, J., and Davis, M. 2013. A Database and Meta-Analysis of Ecological Responses to Stream Flow in the South Atlantic Region. Southeastern Naturalist, Volume 12, Monograph 5, 2013 1-36. Moorman, M., Kolb, K., and Supak, S. 2014. Estuarine monitoring programs in the Albemarle Sound Study Area, North Carolina. US Geological Survey Open File Report 2014-1110. NC DEQ Central Coastal Plain Capacity Use Area: http://www.ncwater.org/Permits_and_Registration/Capacity_Use/Central_Coastal_Plain/ccpcuatables_reported.php Nationalmap.gov Dams data Current Data Release (March 2006). https://nationalmap.gov/small_scale/atlasftp.html#dams00x NC Office of State Budget and Management – Demographics: https://files.nc.gov/ncosbm/demog/20202030growthmig.pdf

DRAFT
51
North Carolina Office of State Budget and Management at: http://www.osbm.nc.gov/demog/county-projections. NC DEQ 2013. Recommendations for Estimating Flows to Maintain Ecological Integrity in Streams and Rivers in North Carolina Submitted to the North Carolina Department of Environment and Natural Resources by the North Carolina Ecological Flows Science Advisory Board. O’Driscoll, M., Clinton, S., Jefferson, A., Manda, A., and McMillan, S. 2010 Urbanization effects on watershed hydrology and in-stream processes in the southern United States. Water 2: 605-648. O’Driscoll, M., Soban, J., and Lecce, S. 2009. Stream channel enlargement response to urban land cover in small Coastal Plain watersheds, North Carolina. Physical Geography 30(6): 528- 555. O’Driscoll, M., Wilkinson, N., Skibiel, C., Brennan, T., and S. Vogel. 2017. Freshwater in the North Carolina Coastal Plain: Emerging Trends in Water Use. NC Water Resources Research Institute Annual Conference 2017. Raleigh, NC. O’Driscoll, M., Johnson, P., and Mallinson, D. Geological controls and effects of floodplain asymmetry on river-groundwater interactions in the southeastern coastal plain, USA. Hydrogeology Journal 18: 1265-1279. Pearsall, S., Eddy, M., and Phelan, J. 2017. Featured collection introduction: North Carolina Ecological flows. Journal of the American Water Resources Association (JAWRA) 53(1): 3-5. DOI: 10.1111/1752-1688. Poff, N. et al. 2010. The ecological limits of hydrologic alteration (ELOHA): a framework for developing regional environmental flow standards. Freshwater Biology 55:147-170. Price, K., Jackson, C. R., Parker, A. , Reitan, T., Dowd, J., Cyterski, M. Effects of watershed land use and geomorphology on stream low flows during severe drought conditions in the southern Blue Ridge Mountains, Georgia and North Carolina, United States. Water Resources Research, VOL. 47, W02516, doi: 10.1029/2010WR009340.

DRAFT
52
Rapp, J. and Reilly, P. 2017. Virginia flow-ecology modeling results-An initial assessment of flow reduction effects on aquatic biota. USGS Open-File Report 2017-1088. https://pubs.er.usgs.gov/publication/ofr20171088 Sanford, W. and Selnick, D. 2013. Estimation of Evapotranspiration across the Conterminous United States Using a Regression with Climate and Land-Cover Data. Journal of the American Water Resources Association 49: 217-230. Smakhtin, V. U., (2001), Low-flow hydrology: A review, J. Hydrol., 240, 147 – 186 Soil Survey Staff (1995), Natural Resources Conservation Service, United States Department of Agriculture, Web Soil Survey. Available at http://websoilsurvey.nrcs.usda.gov/. Stahle, D, Cleaveland, M., and Hehr, J. 1988. North Carolina Climate Changes Reconstructed from Tree Rings: A.D. 372 to 1985. Science Vol. 240, No. 4858: 1517-1519. State Library of North Carolina: http://statelibrary.ncdcr.libguides.com/c.php?g=151250&p=994350#s-lg-box-wrapper-3511645 Sun, G., S.G. McNulty, D.M. Amatya, R.W. Skaggs, L.W. Swift, J.P. Shepard, and H. Riekerk, 2002. A Comparison of the Watershed Hydrology of Coastal Forested Wetlands and the Mountainous Uplands in the Southern U.S. Journal of Hydrology 263:92-104. Sweet, W.V. and J.W. Geratz, 2003. Bankfull Hydraulic Geometry Relationships and Recurrence Intervals for North Carolina’s Coastal Plain. Journal of the American Water Resources Association 39:861-871. Torak, L.J., Painter, J.A., 2011, Summary of the Georgia Agricultural Water Conservation and Metering Program and Evaluation of Methods Used to Collect and Analyze Irrigation Data in the Middle and Lower Chattahoochee and Flint River basins, 2004–2010: U.S. Geological Survey Scientific Investigations Report 2011– 5126, 25 p. UNC Carolina Population Center at: http://demography.cpc.unc.edu/resources/data-tables/ , US Bureau of Economic Analysis- Department of Commerce (http://www.bea.gov/itable/). US Census Bureau at: https://www.census.gov/. US National Water Census Data portal (water budget tool) at https://cida.usgs.gov/nwc/.

DRAFT
53
U.S. Geological Survey (1999), National Elevation Dataset. [Available at http://ned.usgs.gov/.] USGS, Streamstats. Streamstats program: https://streamstatsags.cr.usgs.gov/streamstats/. USGS, 2017. Water Use Data for North Carolina Webpage: https://waterdata.usgs.gov/nc/nwis/water_use/ Web Based Hydrograph Analysis Tool (https://engineering.purdue.edu/mapserve/WHAT/) Weaver, J.C., Feaster, T.D., and Gotvald, A.J., 2009, Magnitude and frequency of rural floods in the Southeastern United States, through 2006—Volume 2, North Carolina: U.S. Geological Survey Scientific Investigations Report 2009–5158, 111 p. Weaver, J. C. 2016. Low-Flow Characteristics and Flow-Duration Statistics for Selected USGS Continuous-Record Streamgaging Stations in North Carolina through 2012. US Geological Survey, Scientific Investigations Report 2015–5001. http://dx.doi.org/10.3133/sir20155001/. Wang, D. and Cai, X. 2009. Detecting human interferences to low flows through base flow recession analysis. Water Resources Research VOL. 45, W07426, doi:10.1029/2009WR007819. Williams, J.B. and Pinder, J. 1990. Ground-Water Flow and Runoff in a Coastal Plain Stream. Water Resources Bulletin 26:343-351.