Embed Size (px)
Citation preview

2
Exergy and Environmental Considerations in Gas Turbine Technology and Applications
Richard ‘Layi Fagbenle BSME, PhD (Illinois), MSME(Iowa State),
USA
1. Introduction
Global CO2 emissions by sector in 1990 for transportation, electric power, buildings, synfuels & hydrogen production, and industry were 20%, 27%, 15%, 0% and 38% respectively [IPIECA Workshop, Baltimore, USA, 12-13 October 2004]. In a 2095 scenario limiting the GHG to 550 ppm CO2, the sectoral CO2 emissions for transportation, electric power, buildings, synfuels & hydrogen production, and industry are 40%, 23%, 19%, 1% and 17% respectively [IPIECA Workshop, Baltimore, USA, 12-13 October 2004]. It is argued that the high cost of alternatives, and the strong demand for mobility, limits the effects of climate policies on the transportation sector, while more cost-effective emission reductions are found in the electric power and the industry sectors [IPIECA Workshop, Baltimore, USA, 12-13 October 2004]. While it is noted that climate change scenarios are replete with assumptions, the global growth of the transportation sector is undeniable, in both developing and developed countries, as the worldwide passenger travel vs. GDP by region in the figure below for the period 1950-1997 shows [IPIECA Workshop, Baltimore, USA, 12-13 October 2004].
IPIECA Workshop, Baltimore, USA, 12-13 October 2004
In the EU, sectoral CO2 emissions in 2005 for Energy, Transport, Industry, and Households were 34%, 27%, 21%, and 11%. The Transportation sector breakdown was Road (71.2%), Sea
www.intechopen.com

Gas Turbines
30
From: Rail Transport and Environment, page 5 – Facts & Figures, Nov. 2008.
From: Rail Transport and Environment, page 20 – Facts & Figures, Nov. 2008
www.intechopen.com

Exergy and Environmental Considerations in Gas Turbine Technology and Applications
31
and Inland Waterways (14.5%), Aviation (11.9%). From: Rail Transport and Environment, page 5 – Facts & Figures, Nov. 2008 [Rail Transport and Environment, page 5 – Facts & Figures, Nov. 2008]. The sectoral energy consumption for 2005 appears in the figure shown below, from which the Transportation sector had the second largest share of 31% after the Households & Services sector. Aviation’s share of the Transportation sector energy consumption was 14%, second to Road Transport. A similar trend would be found in other regions of the developed world which accounts for the bulk of the global energy consumption and carbon emission. Similarly, local air pollution data for NOx and PM10 appears below for a journey of 545 km by three modes of transportation. Transportation of 100 tons of cargo for a distance of 700 km between the Netherlands and Switzerland generates the local pollution information as shown in the figure below:
From: Rail Transport and Environment, page 19 – Facts & Figures, Nov. 2008.
Energy efficiency is of utmost importance in addressing the climate problem. Some significant strides have been made by some sub-sectors as the figure below indicates.
www.intechopen.com

Gas Turbines
32
From: Rail Transport and Environment, page 11 – Facts & Figures, Nov. 2008.
Finally, a look at the noise profile of some modes of transportation is instructive.
From: Rail Transport and Environment, page 22 – Facts & Figures, Nov. 2008.
www.intechopen.com

Exergy and Environmental Considerations in Gas Turbine Technology and Applications
33
From the above, it is clear that just as the other sectors are called upon to reduce their GHG
emission, the same should hold for the transportation sector. Gas turbines are employed in
the air transportation sub-sector as well as in industry generally. It is claimed that air
transport accounts for some 2-3 per cent of all anthropogenic CO2 emissions [IPIECA
Workshop, Baltimore, USA, 12-13 October 2004]. As of 2004 IPIECA Workshop, there was no
substitute envisioned for jet fuel neither was there any niche alternative fuel on the horizon.
However, between 2008 and 2010, several test flights have been undertaken with synthetic
jet fuel derived from natural gas [Airline Industry Information, May 3, 2010] as well as second
generation biofuels from 50:50 blend of jathropha oil and standard A1 jet fuel [The Seattle
Times, Dec. 31, 2008]. Similarly, the Airline Industry Information publication of 16 January
2009 reported that the US Federal Aviation Administration (FAA) has announced the results
of a commercial airline test flight using a mixture of jet fuel and biofuel derived from algae
and jatropha plants early in January 2009. In June 2009, the aviation fuels subcommittee of
the ASTM International was reported to have approved specifications for synthetic aviation
fuel, derived from a 50/50 blend of synthetic Fischer-Tropsch fuels and petroleum-derived
fuels.
Gas turbines are employed in the Energy, Industrial, and the Transportation Sectors; sectors which have been shown to be responsible for most of the carbon emissions globally. Hence it is imperative to sustain the current drive for improvement in the energy, exergy and environmental performance of gas turbines in general (land, aviation, and marine gas turbine technology). We shall consider some of these issues in this chapter.
2. The Brayton open-cycle components – simple cycle and combined cycle gas turbines
Combustion Chamber/Combustor
Compressed air from the compressor (either centrifugal or axial-flow type) flows directly
into the combustion chamber (such as that shown in Fig. 2.1 below) in a Brayton open
simple cycle gas turbine where part of it ( < 1/3) is used in a direct-fired air heater to burn
the fuel after which the remaining air is mixed with the combustion products, all of which is
to be carried out with minimum pressure loss. Minimization of pressure is critical at all
stages from inlet to the compressor to entry into the turbine to ensure optimal power
production from the gas turbine.
The Turbine Chamber of a 3-stage gas turbine plant is shown in Fig. 2.2 and Fig. 2.3 shows a
typical turbine stage blades. Substantial volumes of air and combustion gases are moved
smoothly and vibration-free through the gas turbine at very high velocities in an axial flow
machine, being taken through a series of processes. These processes follow the Brayton cycle
processes, viz.: non-isentropic compression from the atmospheric inlet conditions of the
compressor to the isobaric (constant-pressure) combustion of the fuel in the combustion
chamber, and then followed by adiabatic (non-isentropic) expansion of the hot gases and
finally discharging the gases into the atmosphere, all of which is done in a continuous flow
process. The energy transfer between the fluid and the rotor in the compression and
expansion processes is achieved by means of kinetic action rather than by positive
displacement as occurs as in reciprocating machines.
www.intechopen.com

Gas Turbines
34
Fig. 2.1. A Combustion Chamber Can. [From Shepherd, D.G., Introduction to the Gas Turbine, D. Van Nostrand Co., Inc.
Fig. 2.2. The Turbine Chamber of a 3-stage turbine plant. [From Shepherd, D.G., Introduction to the Gas Turbine, D. Van Nostrand Co., Inc.
www.intechopen.com

Exergy and Environmental Considerations in Gas Turbine Technology and Applications
35
Fig. 3.3. Typical turbine stage. [From Shepherd, D.G., Introduction to the Gas Turbine, D. Van Nostrand Co., Inc.
4. Gas turbine fuels – conventional and new fuels
Conventional gas turbine fuels currently in use are exclusively liquid and gaseous and usually hydrocarbons. Solid gas turbine fuel technology is still in the research and developmental stages. New gas turbine fuels, as mentioned earlier in the Introduction, include the synthetic Fischer-Tropsch aviation jet fuels and the second generation biofuels.
Conventional gas turbine fuels – Liquid and gaseous fuels
Conventional gas turbine liquid fuels include the range of refined petroleum oils from highly refined gasoline through kerosene and light diesel oil to a heavy residual oil (Bunker C or No. 6 fuel oil). Table 4-1 gives the ultimate analysis of some liquid fuels.
Fuel Carbon Hydrogen Sulfur Ash, etc. 100 Octane petrol 85.1 14.9 0.01 - Motor petrol 85.5 14.4 0.1 - Benzole 91.7 8.0 0.3 - Kerosene (paraffin) 86.3 13.6 0.1 - Diesel oil 86.3 12.8 0.9 - Light fuel oil 86.2 12.4 1.4 - Heavy fuel oil 86.1 11.8 2.1 - Residual fuel oil 88.3 9.5 1.2 1.0
Table 4.1. Ultimate analysis of some liquid fuels. (From Applied Thermodynamics for Engineering Technologists, S.I. Units by Eastop & McConkey, 2nd ed., 1970).
Table 4-2 below also indicates some of the key properties of some of the many known hydrocarbons.
www.intechopen.com
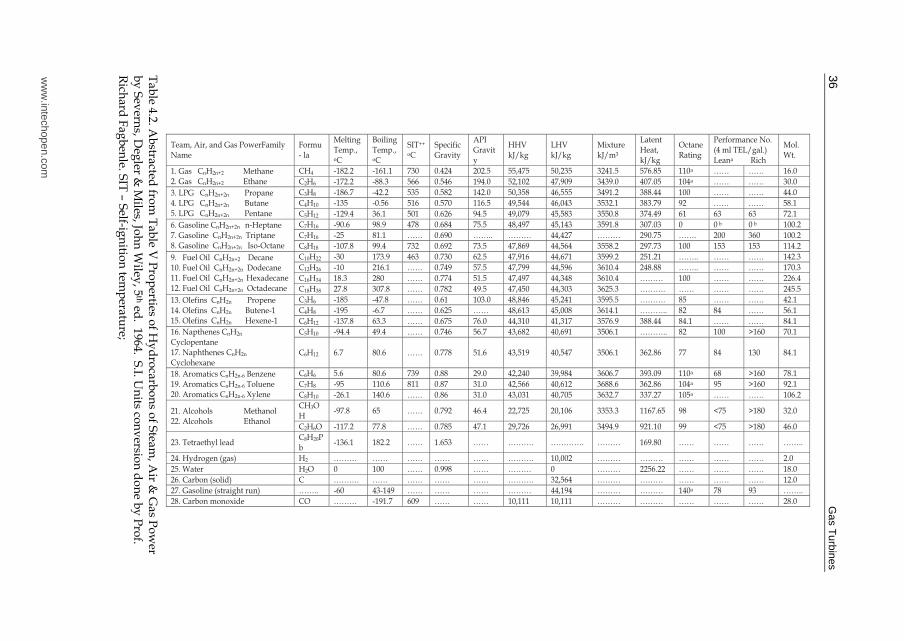
G
as Turbines
36
Team, Air, and Gas PowerFamily Name
Formu- la
Melting Temp., oC
Boiling Temp., oC
SIT++
oC Specific Gravity
API Gravity
HHV kJ/kg
LHV kJ/kg
Mixture kJ/m3
Latent Heat, kJ/kg
Octane Rating
Performance No. (4 ml TEL/gal.) Leana Rich
Mol.Wt.
1. Gas CnH2n+2 Methane 2. Gas CnH2n+2 Ethane
CH4 -182.2 -161.1 730 0.424 202.5 55,475 50,235 3241.5 576.85 110a …… …… 16.0
C2H6 -172.2 -88.3 566 0.546 194.0 52,102 47,909 3439.0 407.05 104a …… …… 30.0
3. LPG CnH2n+2n Propane 4. LPG CnH2n+2n Butane 5. LPG CnH2n+2n Pentane
C3H8 -186.7 -42.2 535 0.582 142.0 50,358 46,555 3491.2 388.44 100 …… …… 44.0
C4H10 -135 -0.56 516 0.570 116.5 49,544 46,043 3532.1 383.79 92 …… …… 58.1
C5H12 -129.4 36.1 501 0.626 94.5 49,079 45,583 3550.8 374.49 61 63 63 72.1
6. Gasoline CnH2n+2n n-Heptane 7. Gasoline CnH2n+2n Triptane 8. Gasoline CnH2n+2n Iso-Octane
C7H16 -90.6 98.9 478 0.684 75.5 48,497 45,143 3591.8 307.03 0 0 b 0 b 100.2
C7H16 -25 81.1 …… 0.690 …….. ……… 44,427 ……… 290.75 ……. 200 360 100.2
C8H18 -107.8 99.4 732 0.692 73.5 47,869 44,564 3558.2 297.73 100 153 153 114.2
9. Fuel Oil CnH2n+2 Decane 10. Fuel Oil CnH2n+2n Dodecane 11. Fuel Oil CnH2n+2n Hexadecane 12. Fuel Oil CnH2n+2n Octadecane
C10H22 -30 173.9 463 0.730 62.5 47,916 44,671 3599.2 251.21 …….. …… …… 142.3
C12H26 -10 216.1 …… 0.749 57.5 47,799 44,596 3610.4 248.88 …….. …… …… 170.3
C16H34 18.3 280 …… 0.774 51.5 47,497 44,348 3610.4 ……… 100 …… …… 226.4
C18H38 27.8 307.8 …… 0.782 49.5 47,450 44,303 3625.3 ………. …… …… …… 245.5
13. Olefins CnH2n Propene 14. Olefins CnH2n Butene-1 15. Olefins CnH2n Hexene-1
C3H6 -185 -47.8 …… 0.61 103.0 48,846 45,241 3595.5 ………. 85 …… …… 42.1
C4H8 -195 -6.7 …… 0.625 …… 48,613 45,008 3614.1 ……….. 82 84 …… 56.1
C6H12 -137.8 63.3 …… 0.675 76.0 44,310 41,317 3576.9 388.44 84.1 …… …… 84.1
16. Napthenes CnH2n Cyclopentane 17. Naphthenes CnH2n Cyclohexane
C5H10 -94.4 49.4 …… 0.746 56.7 43,682 40,691 3506.1 ……….. 82 100 >160 70.1
C6H12 6.7 80.6 …… 0.778 51.6 43,519 40,547 3506.1 362.86 77 84 130 84.1
18. Aromatics CnH2n-6 Benzene 19. Aromatics CnH2n-6 Toluene 20. Aromatics CnH2n-6 Xylene
C6H6 5.6 80.6 739 0.88 29.0 42,240 39,984 3606.7 393.09 110a 68 >160 78.1
C7H8 -95 110.6 811 0.87 31.0 42,566 40,612 3688.6 362.86 104a 95 >160 92.1
C8H10 -26.1 140.6 …… 0.86 31.0 43,031 40,705 3632.7 337.27 105a …… …… 106.2
21. Alcohols Methanol 22. Alcohols Ethanol
CH3OH
-97.8 65 …… 0.792 46.4 22,725 20,106 3353.3 1167.65 98 <75 >180 32.0
C2H6O -117.2 77.8 …… 0.785 47.1 29,726 26,991 3494.9 921.10 99 <75 >180 46.0
23. Tetraethyl lead C8H20Pb
-136.1 182.2 …… 1.653 …… ………. …………. ……… 169.80 …… …… …… ……..
24. Hydrogen (gas) H2 ……… …… …… …… …… ………. 10,002 ……… ……… …… …… …… 2.0
H retaW .52 2O 0 100 …… 0.998 …… ……… 0 ……… 2256.22 …… …… …… 18.0
26. Carbon (solid) C ………. …… …… …… …… ………. 32,564 ……… ……… …… …… …… 12.0
27. Gasoline (straight run) …….. -60 43-149 …… …… …… ……… 44,194 ……… ……… 140a 78 93 ……..
28. Carbon monoxide CO ……… -191.7 609 …… …… 10,111 10,111 ……… ……… …… …… …… 28.0
Tab
le 4.2. Ab
stracted fro
m T
able V
Pro
perties o
f Hy
dro
carbo
ns o
f Steam
, Air &
Gas P
ow
er b
y S
evern
s, Deg
ler & M
iles, Joh
n W
iley, 5
th ed. 1964. S
.I. Un
its con
versio
n d
on
e by
Pro
f. R
ichard
Fag
ben
le. SIT
– Self-ig
nitio
n tem
peratu
re;
ww
w.intechopen.com

Exergy and Environmental Considerations in Gas Turbine Technology and Applications
37
Fig. 4-1 below shows typical distillation characteristics for military and commercial aircraft fuels. Relative to the “pure substance” single evaporation temperatures of water and ethyl alcohol, gasoline is a mixture of liquid several hydrocarbons and its various components boil off at different temperatures as can be seen in the graphs.
Fig. 4.1. Typical ASTM distillation characteristics for various types of fuels. Degree Centigrade scale supplied by Prof. R. ‘Layi Fagbenle. Abstracted from Steam, Air, and Gas Power by Severns, Degler & Miles, John Wiley & Sons Inc. 1964.
The aviation gasoline graph at the bottom of the graph is for piston-engine powered aircraft and it has a low flash point to improve its ignition characteristics. It is usually a high-octane gasoline known as “avgas”. Turbine engines on the other hand can operate with a wide range of fuels, but typically use fuels with much higher flash points, less flammable and generally safer to store and transport. Most jet fuels are basically kerosene-based. Both the Jet A specification fuel used in the USA and the Jet A-1 standard specification of most of the rest of the world have a relatively high flash point of 38°C and a self-ignition temperature (SIT) (or auto-ignition temperature) of 210°C, making them safer to handle than the traditional avgas. The open air burning temperature in Table 4-2 can be compared with the typical distillation characteristics for aircraft gas turbine fuel in Fig. 4-1.
www.intechopen.com

Gas Turbines
38
Physical Properties Jet A-1 Jet A
Flash Point > 38°C (100.4 °F)
Self- (auto-) ignition temperature 210 °C (410 °F)
Freezing point < -47 °C (-52.6 °F) < -40 °C (-40 °F)
Open air burning temperature 287.5 °C (549.5 °F)
Density (per litre) 0.775 kg/l – 0.840 kg/l
Specific energy (calorific value) > 42.80 MJ/kg
Table 4.2. Typical Specifications for Jet A and Jet A-1 Aircraft Fuels (from Wikipedia)
Specifications for Heavy-Duty Gas Turbine Fuels
Heavy-duty gas turbines are able to burn a wide range of gaseous fuels and hence are less
restricted in their fuel classifications. A typical heavy-duty gas turbine fuel specification
(range only indicated) appears in Table 4-3 below.
Fuel LHV [MJ/m3] Major Components
Natural Gas and Liquefied Natural Gas (LNG)
29.81 – 7.45 Methane
Liquefied Petroleum Gas [LPG] 85.70 – 119.23 Propane; Butane
Gasification Gases (Air Blown) 3.73 – 5.50 CO; H2; N; H20v
Gasification Gases (Oxygen Blown) 7.45 – 14.90 CO; H2; H20v
Process Gases 11.20 – 37.30 CH4; H2; CO; CO2
Table 4.3. Range of typical heavy-duty gas turbine fuel classification (adapted from GEI 41040G – GE Gas Power Systems, Revised January 2002).
The feedstock for gasification fuels can be coal, petroleum coke or heavy liquids.
Gasification fuels generally have lower much lower heating values than other fuel gases,
and they are produced by one of two processes: oxygen blown or air blown gasification
process.
Process gases are generated by many petrochemical and chemical processes and are suitable
for fuelling gas turbines, for example refinery gases). Constituents of process gases include
CH4, H2, CO, and CO2. Other process gases used as gas turbine fuels are byproducts of steel
production such as blast furnace gases and coke oven gases. Blast Furnace Gases (BFG) have
heating values below minimal allowable limits for gas turbine fuels, necessitating blending
with other fuels such as coke oven gas, natural gas or hydrocarbons such as propane or
butane.
Typical gas turbine fuel specification ranges appear in Table 4-4 below. In addition to such
specifications which may be particular to each turbine manufacturer, allowable gas fuel
contaminant levels are also specified for such trace metals as (Pb, V, Ca, and Mg), Alkali
metals (Na and K) and particulates. Sodium (Na) is the only trace metal contaminant
normally found in natural gas, and it source is salt water in the ground gas wells.
Sources of contaminants in heavy-duty gas turbine applications include particulates arising
largely from corrosion chemical reactions in gas pipelines, liquid (water and/or
hydrocarbon) condensates and lubricating oils from compressor stations; sulfur (as H2S or
COS); trace metals; steam and water for injection; alkali metals contained in compressor
discharge; and the fuel.
www.intechopen.com

Exergy and Environmental Considerations in Gas Turbine Technology and Applications
39
Fuel Properties Max Min Notes
Lower Heating Value, MJ/m3 None 3.73 –11.20
Modified Wobbe Index (MWI) - Absolute limits - Range within limits
54
+5%
40
-5%
Flammability Ratio 2.2:1
Rich:Lean Fuel/Air Ratio, volume basis
Constituent Limits, mole % Methane, CH4 Ethane, C2H6 Propane, C3H8 Butane C4H10 + higher paraffins (C4+) Hydrogen, H2 Carbon monoxide, CO Oxygen, O2 Total Inerts (N2+CO2+Ar)
Aromatics (Benzene C6H6, Toluene C7H8, etc.) Sulfur
100 15 15 5
Trace Trace Trace Trace
15
Report Report
85 0 0 0 0 0 0 0 0
0 0
% of reactant species % of reactant species % of reactant species % of reactant species % of reactant species % of reactant species % of reactant species % of reactant species % of total (reactants + inerts)
Table 4.4. Range of typical heavy-duty gas turbine fuel specification (adapted from GER 41040G – GE Gas Power Systems, Revised January 2002).
Conventional and New Environmental-conscious Aero and Industrial Gas Turbine Fuels
Conventional aero gas turbine fuels are commonly: i. Kerosene from crude petroleum sources using established refining processes, and ii. synthetic kerosene from Fischer-Tropsch (FT) synthesis using coal, natural gas, or any
other hydrocarbon feedstock (e.g. shale, tar sands, etc.). These are produced by first gasifying the hydrocarbon resource followed by liquefaction to form hydrocarbon liquids (e.g. as earlier noted, the Airline Industry Information update dateline 26 June 2009)
New Environmentally-conscious aero gas turbine fuels are: i. Bio-fuels from bio-derived Fatty Acid Methyl Esters (FAME) mixed with conventional
aero fuel (kerosene) in regulated proportions, ii. Bio-ethanol and bio-methanol neat or mixed in regulated proportions with gasoline, iii. Biofuels produced from Fischer-Tropsch Synthesis (FTS) process using biomass
feedstock such as oil seeds – jathropha, palm oil, soybeans, rapeseed (canola), sunflower, camelina, etc., as well as animal fats,
iv. Bio-syngas produced by gasification of biomass, lignocellulosic biomass and other agricultural wastes used as feed into the FTS (2nd generation biofuels) to produce liquid fuels (FTL), and
v. Liquefied petroleum gas (LPG) which is really not a cryogen; Liquefied gases such as LNG, Methane and Hydrogen. Both methane and hydrogen will have to be liquefied for use as aircraft fuel.
Table 4.5 below gives relative properties of conventional aviation kerosene and typical biodiesel aircraft fuel (will vary with Fatty Acid Methyl Esters [FAME] type):
www.intechopen.com

Gas Turbines
40
Property Aviation Kerosene
Bio-diesel 20% Blend Impact
Heat of combustion [MJ/kg] typical
43.2 32 – 39 41.0 – 42.4 (spec. min:
42.8)
Airframe range/loading
Density [kg/m3] range 775 – 840 860 – 900 792 – 852
Viscosity [mm2/sec @ -20°C max.
Wing tank temp.
limits, Cold Starts & Relight.
Approx. Carbon lengthC14 – C15 max (trace levels)
C16 – C22 C16 – C22 Combustion
emissions Flash point, °C min. 38 >101 Unchanged
Freeze Point,°C max -47 -3? 0 -5 to -10 with
additives
Wing tank temp. limits, Cold Start
and Relight. Sulfur [ppm] max 3000 10
0.015 0.5 0.11 Material
compatibility Acidity [mg KOH/g] max Phosphorous [ppm] max
Excluded 10 2 Hot-end life
Metals [ppm] max Excluded 5 1 Hot-end life Controlled to well defined
level
Not controlled
Not known Fuel system &
injector life Thermal Stability Composition
Hydrocarbon FAME 20% FAME Elastomer
compatibility
From: Ppt. Presentation by Chris Lewis, Company Specialist – Fluids, Rolls Royce plc, titled “A Gas Turbine Manufacturer’s View of Biofuels”. 2006.
In the steam-reforming reaction, steam reacts with feedstock (hydrocarbons, biomass, municipal organic waste, waste oil, sewage sludge, paper mill sludge, black liquor, refuse-derived fuel, agricultural biomass wastes and lignocellulosic plants) to produce bio-syngas. It is a gas rich in carbon monoxide and hydrogen with typical composition shown in Table 4.6 below.
Constituents % by vol. (dry & N2-free) Carbon monoxide (CO) 28 – 36 Hydrogen (H2) 22 – 32 Carbon dioxide (CO2) 21 – 30 Methane (CH4) 8 – 11 Ethene (C2H4) 2 – 4 Benzene-Toluene-Xylene (BTX) 0.84 – 0.96 Ethane (C2H5) 0.16 – 0.22 Tar 0.15 – 0.24 Others (NH3, H2S, HCl, dust, ash, etc.) < 0.021
Source: M. Balat et al. Energy Conversion and Management 50 (2009) 3158 – 3168).
Table 4.6. Typical composition of bio-syngas from biomass gasification.
www.intechopen.com
Exergy and Environmental Considerations in Gas Turbine Technology and Applications
41
A useful reference for the thermo-conversion of biomass into fuels and chemicals can be
found in the above referenced paper by M. Balat et al.
Ethanol-powered gas turbines for electricity generation
In a 2008 report by Xavier Navarro (RSS feed), a company called LPP Combustion (Lean,
Premixed, Prevaporized) was claimed to have demonstrated that during gas turbine testing,
emissions of NOx, CO, SO2 and PM (soot) from biofuel ethanol (ASTM D-4806) were the
same as natural gas-level emissions achieved using dry low emission (DLE) gas turbine
technology. It was also claimed that the combustion of the bio-derived ethanol produced
virtually no net CO2 emissions.
Gas Turbines and Biodiesels
A recent study by Bolszo and McDonnell (2009)1 on emissions optimization of a biodiesel-
fired 30-kW gas turbine indicates that biodiesel fluid properties result in inferior
atomization and longer evaporation times compared to hydrocarbon diesel. It was found
that the minimum NOx emission levels achieved for biodiesel exceeded the minimum
attained for diesel, and that optimizing the fuel injection process will improve the biodiesel
NOx emissions.
A theoretical study was recently carried out by Glaude et al. (2009)2 to clarify the NOx index
of biodiesels in gas turbines taking conventional petroleum gasoils and natural gas as
reference fuels. The adiabatic flame temperature Tf was considered as the major determinant
of NOx emissions in gas turbines and used as a criterion for NOx emission. The study was
necessitated by the conflicting results from a lab test on a microturbine and two recent gas
turbine field tests, one carried out in Europe on rapeseed methyl ester (RME) and the other
in USA on soybean methyl ester (SME), the lab test showing a higher NOx emission while
the two field tests showed slightly lower NOx emission relative to petroleum diesel. It is
however clear that biodiesels have reduced carbon-containing emissions and there is
agreement also on experimental data from diesel engines which indicate a slight increase in
NOx relative to petroleum diesel. The five FAME’s studied by Glaude et al. were RME,
SME, and methyl esters from sunflower, palm and tallow.
The results showed that petroleum diesel fuels tend to generate the highest temperatures
while natural gas has the lowest, with biodiesel lying in-between. This ranking thus agrees
with the two field tests mentioned earlier. It was also found out that the variability of the
composition of petroleum diesel fuels can substantially affect the adiabatic flame
temperature, while biofuels are less sensitive to composition variations.
5. Factors limiting gas turbine performance
The Joule cycle (also popularly known as the Brayton cycle) is the ideal gas turbine cycle
against which the performance (i.e. the thermal efficiency of the cycle ┟CY) of an actual gas
turbine cycle is judged under comparable conditions. We prefer to restrict the use of Joule
1 C. D. Bolszo and V. G. McDonell, Emissions optimization of a biodiesel fired gas turbine, Proceedings
of the Combustion Institute, Vol 32, Issue 2, 2009, Pages 2949-2956. 2 Pierre A. Glaude, Rene Fournet, Roda Bounaceur and Michel Moliere, (2009). Gas Turbines and
Biodiesel: A clarification of the relative NOx indices of FAME, Gasoil and Natural Gas.
www.intechopen.com

Gas Turbines
42
cycle to the ideal gas turbine cycle while the Brayton cycle is exclusively used for the actual
gas turbine cycle. The ideal gas turbine “closed”cycle (or Joule cycle) consists of four ideal
processes – two isentropic and two isobaric processes – which appear as shown in Fig. 5.1.
The thermal efficiency of the Joule cycle in terms of the pressure ratio rp given by
B
Ap
pp
r = and the pressure ratio parameter ρp given by ( 1)/p pr
γ γρ −= is:
Joule ( 1)/
1 11 1
pprγ γη ρ−
⎛ ⎞ ⎛ ⎞⎜ ⎟ ⎜ ⎟= − = −⎜ ⎟⎜ ⎟ ⎝ ⎠⎝ ⎠ (5.1)
Hence, the thermal efficiency of the ideal gas Joule cycle is a function only of the pressure
ratio. Since for isentropic processes 1-2 and 3-4, 32
1 4
TTpT T
ρ= = , the Joule efficiency is also
dependent of the isentropic temperature ratios only, but independent of the compressor and
the turbine inlet temperatures separately without a knowledge of the pressure ratio. Thus, ρp
is essentially the isentropic temperature ratio, the abscissa in Fig. 5.1. If air is the working
fluid employed in the ideal Joule cycle, the cycle is referred to as the air-standard Joule
cycle.
Fig. 5.1. Ideal Joule cycle (a) p-V and (b) T-s state diagrams. From Haywood [ ].
Fixing the inlet temperature to the compressor Ta and the inlet temperature to the turbine Tb
automatically sets a limit to the pressure ratio rp, which occurs when the temperature after
isentropic compression from Ta is equal to the TIT Tb. However, when this occurs, the net
work done is seen to be equal to zero, as the area of the cycle on the T-s and p-V diagrams
indicate.
Haywood considers an interesting graphical representation of eq. 5.1 above for Ta = 15°C
and Tb = 100°C as shown in Fig. 5.2
www.intechopen.com

Exergy and Environmental Considerations in Gas Turbine Technology and Applications
43
For Ta = 15°C and Tb = 100°C, ηJoule increases continuously with rp right up to the limiting value as the curve labeled “reversible” shows. The limiting pressure ratio rp = 99.82 approximated to 100 in the figure is attained when ρp = ┠ = Tb/Ta = 1073/288 = 3.7257. Under this condition, a sketch of the Joule cycle on the T-s diagram shows that as rp approaches this value, the area enclosed by the cycle approaches zero. However, In practical terms, a pressure ratio this large is never used when issues of process irreversiblities are considered, to which the remaining two curves in the graph pertain.
Fig. 5.2. Variation of cycle efficiency with Isentropic temperature ratio ρp (ta = 15°C). From Haywood [ ].
5.1 Effect of irreversibilities in the actual gas turbine cycle In an actual plant, frictional effects in turbines and compressors and pressure drops in heat exchangers and ductings and combustion chamber are basically lost opportunities for production of useful work. The h-s curve diagram for such a gas turbine Brayton cycle appears in Fig. 5.3, wherein the heat and work terms in each of the processes are identified, ignoring the frictional effects in the heat exchangers, ductings and combustion chamber. We note that the compressor work input required WC, is now much larger than its previous value for the ideal Joule cycle while the turbine work output WT is considerably smaller than for the ideal Joule cycle, revealing the considerable effect of turbine and compressor inefficiencies on the cycle thermal efficiency. An analytic expression for the Brayton cycle thermal efficiency can be shown to be:
(1 1 / )( )
( )
p pBrayton
p
ρ α ρη β ρ− −= − (5.2)
where α = ┟C┟T┠, ┚ = [1 + ┟C(┠ – 1)], and ┠ = Tb/Ta. In Fig. 5.2, the actual Brayton cycle performance is depicted for turbine and compressor isentropic efficiencies of 88% and 85% respectively, ta = 15°C for two values of tb = 800°C and 500°C respectively. The optimum pressure ratio is now reduced from approximately 100 to 11.2 for tb = 800°C, and to only 4.8 at tb = 500°C. This optimum pressure ratio is more realistically achievable in a single compressor. Here also, we find that ηBrayton is highly
dependent on θ = Tb/Ta, showing a drastic reduction from TIT = 800°C to TIT = 500°C.
www.intechopen.com

Gas Turbines
44
The compressor work input per unit mass of working fluid is
2( ) ( 1)p a
c p a pc
c TW c T T ρη′= − = − (5.3)
while
41( ) 1p
T p b p T bW c T T c T ρη ⎛ ⎞′= − = −⎜ ⎟⎝ ⎠ (5.4)
and
( )net T C1W W – W 1 ( )p
p ap
c
c Tρ α ρη ⎛ ⎞= = − −⎜ ⎟⎝ ⎠ (5.5)
with α = ┟C┟T┠ and ┠ = Tb/Ta as before. From 5.5, Wnet vanishes when ρp = 1 and when
ρp = α. Also from differentiating 5.5 w.r.t. ρp, we obtain that Wnet is maximum when ρp =
√α. The variation of Wnet with the adiabatic temperature ratio ρp appears in Fig. 5.4.
Fig. 5.3. Enthalpy-entropy diagram for Actual Brayton cycle, with turbine and Compressor inefficiencies. From Haywood [ ].
Haywood [] discusses the graphical construction in Fig. 5.4 due to Hawthorne and Davis [ ] for the variation of QB, WT, WC, and Wnet with variation in ρp for fixed values of Ta and Tb. The maximum efficiency is obtained at the value of ρp corresponding to the point H at which a straight line from point E is tangent to the curve for Wnet, i.e at ρp = ρopt. The method indicates that the points of maximum thermal efficiency of the Brayton cycle ┟CY and the maximum Wnet are not coincident; rather the value of ρp is greater for the former than for the latter. It may also be shown that, if ρW and ρopt are the values of ρp for maximum Wnet and maximum ┟CY
respectively, then (1 )w
optm
ρρ η= −
where ηm is the maximum value of the thermal efficiency of the Brayton cycle.
Fig. 5.4. Variation of heat supplied to the combustor QB, turbine work output WT, compressor work input WC, and Wnet with isentropic temperature ratio ρp. From Haywood [ ].
www.intechopen.com

Exergy and Environmental Considerations in Gas Turbine Technology and Applications
45
Figs. 5.5 and 5.6 show the schematic of the simple-cycle, open-flow gas turbine with a single shaft and double shaft respectively. The single shaft units are typically used in applications requiring relatively uniform speed such as generator drives while in the dual shaft applications, the power turbine rotor is mechanically separate from the high-pressure turbine and compressor rotor. It is thus aerodynamically coupled, making it suitable for variable speeds applications.
Fig. 5.5. Simple-cycle, open-flow, single-shaft gas turbine
Fig. 5.6. Simple cycle, open-flow, dual-shaft gas turbine for mechanical drives.
5.2 Simple-cycle vs. Combined-cycle gas turbine power plant characteristics Fig. 5.7 shows the variation of output per unit mass and efficiency for different firing temperatures and pressure ratios for both simple-cycle and combined-cycle applications. In the simple-cycle top figure, at a given firing temperature, an increase in pressure ratio results in significant gains in thermal efficiency. The pressure ratio resulting in maximum efficiency and maximum output are a function of the firing temperature; the higher the pressure ratio, the greater the benefits from increased firing temperature. At a given
www.intechopen.com

Gas Turbines
46
pressure ratio, increasing the firing temperature results in increased power output, although this is achieved with a loss in efficiency mainly due to increase in cooling air losses for air-cooled nozzle blades. On the other hand, pressure ratio increases do not affect efficiency markedly as in simple-cycle plants; indeed, pressure ratio increases are accompanied by decreases in specific power output. Increases in firing temperature result in marked increases in thermal efficiency. While simple-cycle efficiency is readily achieved with high pressure ratios, combined-cycle efficiency is obtained with a combination of modest pressure ratios and higher firing temperatures. A typical combined-cycle gas turbine as shown in Fig. 5.7 (lower cycle) will convert 30% to 40% of the fuel input into shaft output and up to 98% of the remainder goes into exhaust heat which is recovered in the Heat Recovery Steam Generator (HRSG). The HRSG is basically a heat exchanger which provides steam for the steam turbine part of the combined-cycle. It is not unusual to utilize more than 80% of the fuel input in a combined-cycle power plant which also produces process steam for on- or off-site purposes.
Fig. 5.7. Gas turbine characteristics for simple-cycle (above) and for combined-cycle (below). Abstracted from GE Power Systems.GER-3567H 10/00.
5.3 Other factors affecting gas turbine performance Other factors affecting the performance of a gas turbine (heat rate, power output) include the following: Air temperature (compressor inlet temperature) and pressure; Site elevation or altitude; humidity; inlet and exhaust losses resulting from equipment add-ons such as air filters, evaporative coolers, silencers, etc. The usual reference conditions stated by manufacturers are 59F/15C and 14.7 psia/1.013 bar. In general, output decreases with increasing air temperature while the heat rate increases less steeply. Similarly, altitude
www.intechopen.com

Exergy and Environmental Considerations in Gas Turbine Technology and Applications
47
corrections are provided by manufacturers with factors less than 1.0 at higher latitudes. The density of humid air is less than that of dry air and it affects both the heat rate and the specific output of a gas turbine. The higher the humidity, the lower the power output and conversely the higher the heat rate. Inlet and exhaust pressure losses result in power output loss, heat rate increase and exhaust temperature increase.
5.4 Gas turbine emissions and control Over the past three to four decades, many developed countries have put in place applicable state and federal environmental regulations to control emissions from aero, industrial and marine gas turbines. This was the case even before the current global awareness to the Climate Change problem. Only NOx gas turbine emission was initially regulated in the early 1970s and it was found that injection of water or steam into the combustion zone of the combustor liner did produce the then required low levels of NOx reduction without serious detrimental effects on the gas turbine parts lives or the overall gas turbine cycle performance. However, as more stringent requirements emerged with time, further increase in water/steam approach began to have significant detrimental effects on the gas turbine parts lives and cycle performance, as well increased levels of other emissions besides NOx. Alternative or complimentary methods of emission controls have therefore been sought, some internal to, and others external to, the gas turbine, namely: i. Dry Low NOx Emission (DLN) or DLE burner technology ii. Exhaust catalytic combustion technology iii. Overspray fogging While NOx emissions normally include Nitrous oxide (NO) and Nitrogen dioxide (NO2), NOx from gas turbines is predominantly NO, although NO2 is generally used as the mass reference for reporting NOx. This can be seen from the typical exhaust emissions from a stationary industrial gas turbine appearing in Table 5.1.
Table 5.1. Typical exhaust emissions from a stationary industrial gas turbine. Abstracted from GE Power Systems – GER-4211-03/01.
www.intechopen.com

Gas Turbines
48
NOx are divided into two main classes depending on their mechanism of formation. NOx formed from the oxidation of free nitrogen in either the combustion air of the fuel are known as “thermal NOx”, and they are basically a function of the stoichiometric adiabatic flame temperature of the fuel. Emissions arising from oxidation of organically bound nitrogen in the fuel (the fuel-bound-nitrogen, FBN) are known as “organic NOx”. Of the two, efficiency of conversion of FBN to NOx proceeds much more efficiently than that of thermal NOx.
Fig. 5.8. Typical NOx emissions for a class of Industrial gas turbines. Abstracted from GE Power Systems – GER-4311-03/01.
Fig. 5.9. Typical NOx emissions for a class of Industrial gas turbines. Abstracted from GE Power Systems – GER-4311-03/01.
Thermal NOx is relatively well studied and understood, but much less so for organic NOx formation. For thermal NOx production, NOx increases exponentially with combustor inlet air temperature, increases quite strongly with F/A ratio or with firing temperature, and increases with increasing residence time in the flame zone. It however decreases exponentially with increasing water or steam injection or increasing specific humidity. Figs.
www.intechopen.com

Exergy and Environmental Considerations in Gas Turbine Technology and Applications
49
5.1 and 5.2 show typical NOx emissions for industrial gas turbines operating on natural gas fuel and No.2 distillate as a function of firing temperature. As regards organic NOx, reduction of flame temperature (as through water or steam injection) does scant little to abate it. Water and steam injection are known to actually increase organic NOx in liquid fuels. As noted earlier, organic NOx is important only for fuels containing significant amount of FBN such as crude or residual oils. Carbon Monoxide (CO) emissions as seen from Table 5.1 can be of comparable magnitude with NO emission, depending on the fuel and the loading condition of the gas turbine. Fig. 5.10 is a typical industrial gas turbine CO emission as a function of firing temperature. We note that, contrary to the NOx trend, CO emission increases significantly as the firing temperature is reduced below about 816°C (1500°F). It is noted that carbon monoxide is normally expected from incomplete combustion and hence inefficiency in the combustion process.
Fig. 5.10. CO emissions from an industrial gas turbine. Abstracted from GE Power Systems – GER-4311-03/01.
Fig. 5.11. UHC emissions from an industrial gas turbine. Abstracted from GE Power Systems – GER-4311-03/01.
www.intechopen.com

Gas Turbines
50
Unburned hydrocarbons (UHC) are also products of the inefficiency in the combustion process. Fig. 5.11 shows a typical industrial gas turbine UHC emission as a function of firing temperature.
Particulates.
Fuel properties, combustor operating conditions and the design of the combustor all affect the gas turbine exhaust particulate emission, whose main components are smoke, ash, erosion and corrosion products in the metallic ducting and piping of the system.
Gas Turbine Emission Control Techniques
Emission Control technique
NOx Lean Head End Liner; Water or Steam Injection; Dry Low NOx Emission (DLE); Overspray fogging
CO Combustor Design; Catalytic reduction
UHC & VOC Combustor Design
SOx Control of sulfur in fuel
Particulates & PM-10 Fuel composition influencing Sulfur & Ash;
Smoke Combustor design; Fuel composition; Air atomization
6. Exergy considerations
Publication of research articles on exergy consideration in power cycles dates back about
four decades now, possibly with the initial work of Kalina (1984) on the combined cycle
system with novel bottoming cycle and that of El-Sayed and Tribus (1985) on a theoretical
comparison of the Rankine and Kalina cycles. This was followed with the work of Zheng et
al. (1986a) on Energy Utilization Diagram (EUD) for two types of LNG power-generation
systems; Zheng (1986b) on graphic exergy analysis for coal gasification-combined power
cycle based on EUD; Ishida et al. (1987) on evaluation of a chemical-looping-combustion
power-generation system by graphic exergy analysis; and Wall et al. (1989) ending the first
decade with an exergy study of the Kalina cycle that began the decade.
In the second decade belong the works of Najjar (1990) on hydrogen fuelled and cooled gas
turbines; Ishida et al. (1992a) on graphic exergy analysis of fuel-cell systems based on EUDs;
Jin & Ishida (1993) on graphical analysis of complex cycles; Joshi et al. (1996) on a review of
IGCC technology; and Jaber et al. (1998) on gaseous fuels (derived from oil shale) for heavy-
duty gas turbines and Combined Cycle Gas Turbines.
The third decade began with the analysis of Bilgen (2000) on exergetic and engineering
analysis of gas turbine-based cogeneration systems; Thongchai et al. (2001) on simplification
of power cycles with EUDs; Marrero et al. (2002) on 2nd law analysis and optimization of a
combined triple power cycle; Jin & Ishida (2004) on graphic presentation of exergy loss in
mixing on an EUD; Khaliq (2004) on second-law analysis of the Brayton/Rankine combined
power cycle with reheat; Khaliq (2004b) on thermodynamic performance evaluation of
combustion gas turbine cogeneration systems with reheat; Ertesvag et al. (2005) on exergy
analysis of a gas turbine combined cycle power plant with pre-combustion CO2 capture; Tae
won Song et al. (2006) on performance characteristics of a MW-class SOFC/GT hybrid
system based on a commercially available gas turbine; Guillermo Ordorica-Garcia et al.
(2006) on technoeconomic evaluation of IGCC power plants for CO2 avoidance; Fagbenle et
www.intechopen.com

Exergy and Environmental Considerations in Gas Turbine Technology and Applications
51
al (2007) on thermodynamic analysis of biogas-fired integrated gasification steam-injected
gas turbine (BIG/STIG) plant; Karellas et al. (2008) on thermodynamic evaluation of
combined cycle plants; Fadok et al. (2008) on an update on advanced hydrogen turbine
development; Bartieri et al. (2008) on biomass as an energy resource – the thermodynamic
constraints on the performance of the conversion process in producing synthetic gas
(syngas) for high efficiency internal combustion engines such as CCGT as well as in fuel
cells (MCFC and SOFC) after adequate cleaning up and reforming; Khaliq (2009a) on exergy
analysis of a gas turbine trigeneration system for combined production of power, heat and
refrigeration; Khaliq (2009b) on energy and exergy analyses of compression inlet air-cooled
gas turbines using the Joule-Brayton refrigeration cycle; Khaliq (2009c) on exergy analysis of
the regenerative gas turbine cycle using absorption inlet cooling and evaporative
aftercooling; Farzaneh-Gord et al. (2009) on a new approach for enhancing performance of a
gas turbine using as a case study the Khangiran refinery in Iran; Fachina (2009) on Exergy
accounting – the energy that matters; and finally closing the highly productive decade with
Baratieri et al. (2009) on the use of syngas in IC engines and CCGT.
The fourth decade has begun with Woudstra et al. (2010) on thermodynamic evaluation of
combined cycle plants. This does in no way claim to be a complete account of all the
contributions to exergy analyses of power cycles from inception to the present time, rather
we have tried to give some highlights on the journey so far.
Exergetic Analyses of Power Cycles – Gas Turbines, CCGTs, IGCC & BIG/STIG
Dincer and Rosen (2007) have listed the following benefits of using exergy analysis in
industrial plant equipment and processes:
• Efficiencies based on exergy, unlike those based on energy, are always measures of the
approach to true ideality, and therefore provide more meaningful information when
assessing the performance of energy systems. Also, exergy losses clearly identify the
locations, causes and sources of deviations from ideality in a system.
• In complex systems with multiple products (e.g., cogeneration and trigeneration
plants), exergy methods can help evaluate the thermodynamic values of the product
energy forms, even though they normally exhibit radically different characteristics.
• Exergy-based methods have evolved that can help in design-related activities. For
example, some methods (e.g., exergoeconomics and thermoeconomics) can be used to
improve economic evaluations. Other methods (e.g., environomics) can assist in
environmental assessments.
• Exergy can improve understanding of terms like energy conservation and energy crisis,
facilitating better responses to problems. The following table comparing energy and exergy from Dincer & Cengel [ ] is also useful in appreciating exergy. According to Szargut et al. [1988], “exergy is the amount of work obtainable when some
matter is brought to a state of thermodynamic equilibrium with the common components of
the natural surroundings by means of reversible processes, involving interaction only with
the above mentioned components of nature”. Four different types of exergy are identifiable
in principle, denoted as kinetic, potential, physical and chemical exergy, Masim and Ayres
[ ], viz.:
ε = εk + εp + εph + εch
www.intechopen.com

Gas Turbines
52
ENERGY EXERGY
Is dependent on the parameters of matter or energy flow only, and independent of the environment parameters.
Is dependent on both the parameters of matter or energy flow and on the environment parameters.
Has the values different from zero (equal to mc2 upon Einstein’s equation)
Is equal to zero (in dead state by equilibrium with the environment).
Is governed by the 1st Law of Thermodynamics (FLT) for all the processes.
Is governed by the 1st Law of Thermodynamics (FLT) for reversible processes only (while it is destroyed partly or completely in irreversible processes).
Is limited by the 2nd Law of Thermodynamics (SLT) for all processes (including reversible ones).
Is not limited for reversible processes due to the 2nd Law of Thermodynamics (SLT).
Is motion or ability to produce motion. Is work or ability to produce work.
Is always conserved in a process, so can neither be destroyed or produced.
Is always conserved in a reversible process, but is always consumed in an irreversible process.
Is a measure of quantity only. Is a measure of quantity and quality due to entropy.
Table 6.1.
Kinetic and potential exergy (εk & εp) have the same meaning as their corresponding energy or work terms, Wk and Wp, both of which are usually negligible in the analysis of most common industrial processes. Physical exergy is the work obtainable by taking a substance through reversible physical processes from its initial state at temperature T and pressure p to the final state determined by the temperature To and pressure po of the environment, Szargut et al. [1988]. Consideration of physical exergy is important for optimization of thermal and mechanical processes including heat engines and power plants. However, it is of secondary importance and often negligible when attention is focused on very large systems, such as chemical and metallurgical processes, where chemical exergy dominates in resource accounting and environmental analyses Masim and Ayres [ ]. Chemical exergy is the work that can be obtained by bringing a substance having the temperature and pressure (T,p) to a state of thermodynamic equilibrium with the datum level components of the environment. It has two components – one associated with chemical reactions occurring in isolation, and the other associated with the diffusion of reaction products into the surroundings, Masim and Ayres [ ]. Hence the importance of defining a reference state when calculating both physical and chemical exergy. The exergy function is thus a measure of the difference between two states, namely the state of the “target” system and that of its surroundings (or, more appropriately, the ultimate state of the combined system plus its surroundings, after they have reached mutual equilibrium of pressure po, temperature To, and chemical composition μo). As Masim and Ayres [ ] put it, the analytical expression for exergy shows that exergy is a measure of the “thermodynamic distance” of the target system from equilibrium, or alternatively, a measure of the “distinguishability” of the target system from its environment. For a closed system with (T,p), the exergy (loss) Δε is given by:
Δε = B = S(T-To) – V(p-po) + ∑μi(Ni – Nio)
www.intechopen.com

Exergy and Environmental Considerations in Gas Turbine Technology and Applications
53
where Ni is the number of moles of the ith system and μi is its chemical potential. As noted earlier, Δε ≤ 0, the equality holding only when the process is reversible. Here po and To are, appropriately, the ambient atmospheric pressure and temperature respectively. For a flow or open system, where mass crosses the system boundaries,
Δε = B = (H – Ho) - To(S-So) - ∑μi(Ni – Nio)
where H is enthalpy. In this case, it is important to have a knowledge of the detailed average chemical composition of the reaction products and the environmental sink with which the system reacts Masim and Ayres [ ].
Exergetic Analyses of Gas Turbine Cogeneration/Combined Cycle Plants
The generic name “Cogeneration or Combined Cycle” plants is used for gas turbine top cycle plant whose hot exhaust is used for generating steam in a heat recovery steam generator (HRSG) for a steam turbine bottom cycle. In these plants, the gas turbine combustion chamber (combustor) is fuelled normally with liquid or gaseous fuels piped to the plant from nearby storage tanks; the fuel is thus not produced on-site. Cogeneration/Combined Cycle plants therefore generate additional power from the steam turbine. However, they may also generate both power and steam from the steam turbine if process steam is required on-site or elsewhere, as in district heating systems. In such a case, the Cogeneration/CC plant would properly qualify to be called a Combined Heat and Power (CHP) Plant, although this appellation is technically reserved for any power plant whose hot combustion product gases are used to generate steam for on-site or other uses. Thus a CHP need not have a gas turbine in its power production train, it could be any power plant that generates “waste” heat from which we are able to extract “useful” thermal energy. In this regard, many CHP plants are powered by large diesel Internal Combustion (I.C.) engines. We first consider the work of Bilgen (2000) on exergetic analyses of gas turbine cogeneration systems in which gas turbine cogeneration systems involving three different combinations of power and steam generation from a gas turbine and a steam turbine fed with steam from a HRSG were studied (see Figures 6.1, 6.2 and 6.3). The gas turbine exhaust gases produce the steam in the HRSG.
Fig. 6.1. From Bilgen (2000).
www.intechopen.com

Gas Turbines
54
Fig. 6.2. From Bilgen (2000)
Fig. 6.3. From Bilgen (2000).
Bilgen undertook a combustion analysis by calculating the composition of the fuel gas mixture using direct minimization of the Gibbs function of formation of each compound I from its constituent elements, using Lagrangian multipliers. The fuel utilization efficiency or the 1st Law efficiency is given by
( )e p
f
W Q
ECη += (6.1)
Where Ef is the energy of the fuel, We and Qp are the electrical energy and the thermal energy of the process respectively while C is 0.98 as the parasitic system loss is assumed to be 2%. The second law or exergy efficiency is defined as
( )e p
fB
W Bε += (6.2)
www.intechopen.com

Exergy and Environmental Considerations in Gas Turbine Technology and Applications
55
Where We is work, hence considered all exergy as earlier discussed, Bp is the exergy content of process heat produced and Bf is the exergy content of fuel input. Expressions for the energy and exergy terms above were given by Bilgen as follows:
f e e i ip rE n h n h= −∑ ∑ (6.3)
1
21 2
2 2
( ) ln
yO
f i i e e or p x xCO H O
yB n g n g RT
y y
⎛ ⎞⎜ ⎟= − + ⎜ ⎟⎜ ⎟⎝ ⎠∑ ∑ (6.4)
where hi, he are enthalpies and gi, ge are the Gibbs functions of reactants (shown with r) and products (shown with p) for stoichiometric reaction of fuel evaluated at 1 bar and 298 K; yi┙ is the mole fraction of component I in the environment. A fuel exergy factor is defined as
f
ff
B
Eε = (6.5)
The exergy of the process heat produced is given by
Bp = ms[(h-hc)- To(s-sc)] (6.6)
where ms and s are the mass and entropy of the steam produced, sc is the entropy of the condensate return, both at the process heat pressure, and To is temperature of the environment. Further,
Qp = ms(h-hc) (6.7)
Process heat exergy factor and power-to-heat ratio are defined as
p
pp Q
Bε = and e
p
Wph Q
r = (6.8a,b)
A relationship can be established between exergy, ε, and fuel utilization, ┟, efficiencies using the above equations as follows, Bilgen (2000):
1
pph
f ph
r
rεεηε +
+⎡ ⎤= ⎢ ⎥⎣ ⎦ (6.9)
Two Case Studies corresponding to Figures 6.1 and 6.3 were considered in detail, and in
both cases, natural gas was used as fuel. Plant capacity factor was assumed to be 80%. The
data for Case Study I appear in Table 6.2 for base-load gas turbine at ISO conditions of 288 K
and 101.325 kPa, and 60% relative humidity and they are from a case study earlier reported
for an industrial gas turbine (the GE LM2500PE reported by Rice (1987) and Huang (1990).
Other parameters employed in the Case Study are isentropic efficiencies of compressor and
turbine of 70.4% and 92.6% respectively; intake air temperature same as ISO condition of
288K; process steam is saturated at 2026 kPa; temperature of condensate return is 373 K; and
the pinch point temperature difference is 50 K. Bilgen calculated the composition of the
products of combustion of natural gas with 226% air (in moles) as follows:
www.intechopen.com

Gas Turbines
56
1 CO2; 0 CO; 2 HO2; 0.001 OH; 0 NO2; 0 NO; 24.515 N2; 4.52 O2. He also presented the following parameters from his study which agreed quite well with those of Rice (1987) and Huang (1990): cycle efficiency, air flow, specific work output, and exhaust temperature compared quite well with Rice (1987) and fuel utilization efficiency, exergy efficiency, and power-to-heat ratio compared quite well with Huang (1990).
Table 6.2. Base-load gas turbine data for Case Study I of Bilgen (2000).
The cycle efficiency of 37.62% in Table 6.3 below is for the gas turbine without cogeneration
while the fuel efficiency of 77.02% in the same Table 6.3 is for the cogeneration system. This
implies a 105% efficiency improvement. The exergy efficiency of the cogeneration system is
50.06% while Bilgen reports an exergy efficiency of only 35.78% for the system without
cogeneration, yielding a 40% improvement.
Table 6.3. Comparison of the results of Bilgen (2000) with those of Rice (1987) and Huang (1990).
Process heat results of Bilgen (2000) appear in Table 6.4 below. Fig. 6.4 below shows the 1st law and exergy (2nd law) efficiency and % steam extraction as a
function of power-to-heat ratio. The trends of the 1st and 2nd law efficiencies in the figure are
quite consistent with equations 6.1, 6.2, and 6.8b. The slow variation of the second law
efficiency with power-to-heat ratio indicates that the exergy content of the steam plus power
generated from the steam turbine is little degraded.
www.intechopen.com

Exergy and Environmental Considerations in Gas Turbine Technology and Applications
57
Table 6.4. Process heat results of Bilgen (2000).
Fig. 6.4. shows the 1st law and exergy (2nd law) efficiency and % steam extraction as a function of power-to-heat ratio.
www.intechopen.com

Gas Turbines
58
Similarly, Fig. 6.5 shows power from the steam turbine, total power, process heat production and payback period as a function of the power-to-heat ratio. The process steam production (in t/h) follows the same relationship as that of the % steam extraction in Fig. 6.4.
Fig. 6.5. Total power, steam turbine power, process heat production and payback period as a function of the power-to-heat ratio.
Exergy analysis of integrated gasification combined cycle gas turbine (IGCC) plants Integrated Gasification Combined Cycle (IGCC) plants, as distinct from the general Combined Cycle/Cogeneration plants, have an integrated fuel production unit (gasifier) which provides the fuel (normally gaseous) required by the gas turbine combustors. The feed into the gasifier could be a solid hydrocarbon (usually coal) or biomass (e.g. agricultural wastes, lignocellulosic plants, etc.) as earlier noted in the section on Conventional and New Environmental-conscious Aero and Industrial Gas Turbine Fuels. A schematic of a coal-fired gasifier in an integrated coal gasification combined cycle gas turbine plant (ICGCC) plant appears in Fig. 6.XXX below. We shall consider a biogas-fired integrated gasification steam-injected gas turbine (BIG/STIG) plant studied by Fagbenle et al. (2007) and shown schematically in Fig. 6.6 below. The Energy Utilization Diagram (EUD) popularized by the Ishida group and discussed in section 6 of this chapter was used to highlight the exergy losses in the various sub-systems of the plant. The EUD is a useful tool for exergy analysis of chemical processes and plants in which the energy level or availability factor (A) is plotted against the energy-transformation quantity (AH), enabling easy identification of subsystems with potentials for performance improvement.
www.intechopen.com

Exergy and Environmental Considerations in Gas Turbine Technology and Applications
59
Fig. 6.XXX. Simplified diagram of an integrated coal gasification combined cycle (ICGCC) gas turbine plant. From Emun et al. (2010).
The BIG/STIG plant of Fig. 6.6 consists of a 53 MW gas turbine plant fuelled by fuel gas (syngas assumed to be largely CH4) from a biogas gasifier and gas clean-up system. The adiabatic combustion temperature was found from the 1st Law to be 1895K but a more realistic (from metallurgical standpoint) turbine inlet temperature (TIT) of 1450 K was used in the analysis. The turbine exhausts at 410 °C (TET) into a Heat Recovery Steam Generator (HRSG) which produces steam for three purposes: injection steam into the turbine for blade cooling, injection steam into the combustor for NOx emission reduction, and blast steam required by the gasifier chemical process. The stack gases exhaust into the atmosphere at 151°C. Air flow of 141 kg/s and at 32.2 bar leaves the compressor, out of which 131.9 kg/s is fed into the combustor while the remaining 9.1 kg/s is fed into the gasifier.
Basis of the Energy Utilization Diagram
The exergy change Δεi over all the energy donors and acceptors “i” in the energy-transformation system is:
0( )i i ii iH T SεΔ = Δ − Δ∑ ∑ (6.10)
By the 1st law of thermodynamics, the first term on the RHS of the above equation is zero, since the energy released by the energy donor must equal that gained by the energy acceptor. Also, by the 2nd law of thermodynamics, to total entropy change in the system must be greater than or equal to zero, the equality being for isentropic (lossless) processes, i.e.
0iiSΔ ≥∑ (6.11)
Hence,
i o ii iT SεΔ = − Δ∑ ∑ (6.12)
The availability-factor or the energy level (an intensive parameter) is defined by
www.intechopen.com

Gas Turbines
60
Fig. 6.6. BIG/STIG based on GE LM 5000 aero-derivative gas turbine [Williams (1988)].
01 SH H
A TεΔ ΔΔ Δ= = − (6.13)
It is seen that the relationship between the availability-factor of energy donors and energy acceptors is Aed ≥ Aea since in the energy change of the acceptor process, ΔHea > 0. The exergy loss in the system is thus given by
( ) 0i ea ed eaiH A Aε− Δ = Δ − ≥∑ ∑ (6.14)
which, in the limit, gives the system exergy loss as:
0
( )eaH
i ed ea eaA A dHε− Δ = −∑ ∫ (6.15)
A plot of the energy level of the energy donating process (Aed) and the energy accepting process (Aea) against the transformed energy (ΔHea) gives the energy loss in the system as the area between the curves of Aed and Aea. This is the EUD diagram and the energy level difference (Aed – Aea) is indicative of the driving force for the energy transformation process. A summary of the operating conditions together with the results of the 1st law efficiencies appears in Table 6.5 below, assuming compressor and turbine isentropic efficiencies of 98% each. The first law efficiency based on power production alone is 41.5% while it is 45% based on both heat and power.
www.intechopen.com

Exergy and Environmental Considerations in Gas Turbine Technology and Applications
61
Table 6.5.
2nd Law or Exergy Analysis and synthesis
Irreversibilities in the turbines and the compressors processes. The processes through the 2 stages each of the turbines (LP & HP) and the compressors (LP & HP) as well as that through the power turbine (PT) are done irreversibly, and their irreversibilities are For the turbines:
It = (1 – ┟t)WHPT,LPT & PT = (1 – 0.98)(143) = 2.9 MW
For the compressors:
Ic = &1( 1) 1.7c
c LPC HPCI W MWη= − =
The gross power input to the compressors is therefore Wgross,c = 85 + 1.73 = 86.7 MW, while the net generated power is Wnet, generated = 140.14 - 86.73 = 53.4 MW. Irreversibility due to the discharge of hot combustion products at 151°C and 1 bar into the environment is given by Iexh = εstack gases = 3.6 MW as detailed below:
Gas Exergy loss, MW N2 2.28 CO2 0.148 CO 0.278 H2O 0.860
www.intechopen.com

Gas Turbines
62
The Heat Recovery Steam Generator, HRSG The pinch point on the heat donor side is 546 K and on 512 K on the acceptor side, giving ATpinch = 34°C, while the irreversibility was found to be IHRSG = 7.7 MW. Combustion chamber subsystem reaction The total exergy loss in the combustion chamber, Icc, assuming the steam is not dissociated, is given by
Icc = εfuel – Δεair - Δεsteam
Assuming that the ratio φ of the specific chemical exergy of the fuel to its net calorific value is 0.98, then
Icc = (0.98)(5622kJ/kg)(22.9 kg/s) – Δεair - Δεsteam
= 126.17 – 58.4 – 7
= 60.8 MW
It is seen that the exergy loss in the combustion chamber (60.8 MW) is about 49% of the fuel exergy (126.17 MW). Table 6.6 summarizes the results.
Net generated power 53.4 MW Exhaust temperature 151 °C Pinch point 273 °C Minimum ΔT 34 °C
Location Exergy Loss (MW) Fuel exergy, % Total exergy loss, %
Total exergy loss 76.7 60.8 1000
HRSG 7.7 6.1 10.1
Combustion chamber 60.8 48.2 79.3
Stacks exhaust gases 3.6 2.9 4.7
Turbines 2.9 2.3 3.8
Compressors 1.7 1.3 2.2
Table 6.6. Summary of the net generated power and the exegy loss (Irreversibilities) in the BIG/STIG plant.
The Energy Utilization Diagrams (EUDs) for the combustion chamber and the HRSG The EUD for the combustion chamber and the HRSG appear in Figs. 6.7 and 6.8 respectively. The largest single subsystem exergy loss occurs in the combustion chamber, being about 79% of the total system exergy loss. The EUD for the HRSG indicates a pinch point of 273°C on the heat donor side and a ΔT = 34°C. The cross-hatched area approximately equals the calculated values shown in Table 6.6. The irreversibility of the combustion process can be reduced by reducing the effective temperature difference across which the heat transfer is taking place, i.e. between the acceptor and the donor. In this case, preheating the reactants with the exhaust stack gases would reduce the irreversibility of the combustion process. Both the energy and the exergy in the stack gases in this case are both lost. Exergy loss associated with the steam injection mixing process in the combustion chamber has not been taken into consideration, primarily because the amount of steam injected is relatively small.
www.intechopen.com

Exergy and Environmental Considerations in Gas Turbine Technology and Applications
63
Fig. 6.5. Energy-utilization for the combustion chamber.
Fig. 6.6. Energy-utilization diagram for the heat recovery steam generator (HRSG).
7. References
Emun, F., Gadalla, M., Majozi, T. and Boer, D. (2010). Integrated gasification combined cycle simulation and optimization. Computers and Chemical Engineering, 34 (2000) 331-338.
Fagbenle, R. Layi, Oguaka, A.B.C., Olakoyejo, O.T. (2007). A thermodynamic analysis of a biogas-fired integrated gasification steam injected gas turbine (BIG/STIG) plant. Applied Thermal Engineering 27 (2007) 2220-2225.
Woudstra, N., Woudstra, T., Pirone, A. and van der Stelt, T. (2010). Thermodynamic evaluation of combined cycle plants. Energy Conversion and Management 51 (2010) 1099-1110.
IPIECA Workshop (2004), Baltimore, USA, 12-13 October 2004. Rail Transport and Environment – Facts and Figures, Nov. 2008. Airline Industry Information, May 3, 2010. The Seattle Times, Dec. 31, 2008. Shepherd, D. G. Introduction to the Gas Turbine, D. van Nostrand Co. Inc. 1949. Eastop, T. D. and McConkey, A. Applied Thermodynamics for Engineering Technologists.
2nd. Ed. Longmans, London. 1970. Wikipedia, Typical specifications for Jet A-1 Aircraft Fuels. 2010. Specifications for Fuel Gases for Combustion in Heavy-Duty Gas Turbines. GE Power
Systems, GEI 41040G, Revised Jan. 2002. Chris Lewis, (2006). A gas turbine manufacturer’s view of Biofuels. Ppt presentation, Rolls
Royce plc. Balat., M., Balat, M., Kirtay, E. and Balat, H. (2009). Main routes for the thermo-conversion
of biomass into fuels and chemicals. Part I: Pyrolysis systems. Energy Conversion and Management 50 (2009) 3147-3157.
www.intechopen.com

Gas Turbines
64
Balat., M., Balat, M., Kirtay, E. and Balat, H. (2009). Main routes for the thermo-conversion of biomass into fuels and chemicals. Part 2: Gasification systems. Energy Conversion and Management 50 (2009) 3158-3168.
Balat., M. and Balat, H. (2009). Recent trends in global production and utilization of bio-ethanol fuel. Applied Energy 86 (2009) 2273-2282.
Balat., M. and Balat, H. (2010). Progress in biodiesel processing. Applied Energy 87 (2010) 1815-1835.
Baratieri, M., Baggio, P., Fiori, L. and Grigiante, M. (2008). Biomass as an energy source: Thermodynamic constraints on the performance of the conversion process. Bioresource Technology 99 (2008) 7063-7073).
Navarro, X. (2008). Ethanol-powered gas turbine to generate electricity. RSS Feed. Feb. 17th 2008. C. D. Bolszo and V. G. McDonell, Emissions optimization of a biodiesel fired gas turbine,
Proceedings of the Combustion Institute, Vol 32, Issue 2, 2009, Pages 2949-2956. Pierre A. Glaude, Rene Fournet, Roda Bounaceur and Michel Moliere, (2009). Gas Turbines
and Biodiesel: A clarification of the relative NOx indices of FAME, Gasoil and Natural Gas.
Haywood, R. W. Analysis of Engineering Cycles. 2nd edition (SI Units). Pergamon Press. 1975. Severns, W. H., Degler, H. E. and Miles, J. C. (1964). Steam, Air and Gas Power by Severns,
John Wiley, 5th ed. 1964. Frank J. Brooks, (2000) GE Gas Turbine Performance Characteristics, GER-3567H. GE Energy
Services, Atlanta, GA, USA. March 2001. Pavri, R. and Moore, G. D., Gas Turbine Emissions and Control. GER4211. GE Energy
Services, Atlanta, GA. USA. March 2001. Dincer, I. and Rosen, M. A. Exergy, Energy, Environment and Development, Elsevier. 2007. Bilgen, E. (2000). Exergetic and engineering analyses of gas turbine based cogeneration
systems. Energy 25 (2000) 1215-1229. Williams, R. H. (1992). Renewable energy on a large scale. In P. E. Trudeau, ed. Energy for a
Habitable World, A Call for Action. Crane Russak, New York. Srinophakun, T., Laowithayangkul, S. and Ishida, M. (2001). Simulation of power cycle with
energy utilization diagram. Energy Conversion and Management 42 (2001) 1437-1456. Khaliq, A. and Kaushik, S. C. (2004). Thermodynamic performance evaluation of
combustion gas turbine cogeneration system with reheat. Applied Thermal Engineering 24 (2004) 1785-1795.
Khaliq, A. and Kaushik, S. C. (2004). Second-law based thermodynamic analysis of Brayton/Rankine combined power cycle. Applied Energy 78 (2004) 179-197.
Khaliq, A. (2009). Exergy analysis of gas turbine trigeneration system for combined production of power, heat and refrigetation. International Journal of Refrigeration 32 (2009) 534-545.
Karellas, S., Karl, J. and Kakara, E. (2008). An innovative biomass gasification process and its coupling with microturbine and fuel cell systems. Energy 33 (2008) 284-291.
Ertesvag, I, Kvamsdal, H. M. and Bolland, O. (2005). Exergy analysis of a gas-turbine combined-cycle power plant with precombustion CO2 capture. Energy 30 (2005) 5-39.
Song, T. W., Sohn, J. L., Kim, T. S. and Ro, S. T. (2006). Performance characteristics of a MW-class SOFC/GT hybrid system based on a commercially available gas turbine. Journal of Power Sources 158 (2006) 361-367.
Ordorica-Garcia, G., Douglas, P., Croiset, E. and Zheng, L. (2006). Technoeconomic evaluation of IGCC power plants for CO2 avoidance. Energy Conversion and Management 47 (2006) 2250-2259.
www.intechopen.com

Gas TurbinesEdited by Gurrappa Injeti
ISBN 978-953-307-146-6Hard cover, 364 pagesPublisher SciyoPublished online 27, September, 2010Published in print edition September, 2010
InTech EuropeUniversity Campus STeP Ri Slavka Krautzeka 83/A 51000 Rijeka, Croatia Phone: +385 (51) 770 447 Fax: +385 (51) 686 166www.intechopen.com
InTech ChinaUnit 405, Office Block, Hotel Equatorial Shanghai No.65, Yan An Road (West), Shanghai, 200040, China
Phone: +86-21-62489820 Fax: +86-21-62489821
This book is intended to provide valuable information for the analysis and design of various gas turbineengines for different applications. The target audience for this book is design, maintenance, materials,aerospace and mechanical engineers. The design and maintenance engineers in the gas turbine and aircraftindustry will benefit immensely from the integration and system discussions in the book. The chapters are ofhigh relevance and interest to manufacturers, researchers and academicians as well.
How to referenceIn order to correctly reference this scholarly work, feel free to copy and paste the following:
Richard 'Layi Fagbenle (2010). Exergy and Environmental Considerations in Gas Turbine Technology andApplications, Gas Turbines, Gurrappa Injeti (Ed.), ISBN: 978-953-307-146-6, InTech, Available from:http://www.intechopen.com/books/gas-turbines/exergy-and-environmental-considerations-in-gas-turbine-technology-and-applications