Embed Size (px)
Citation preview
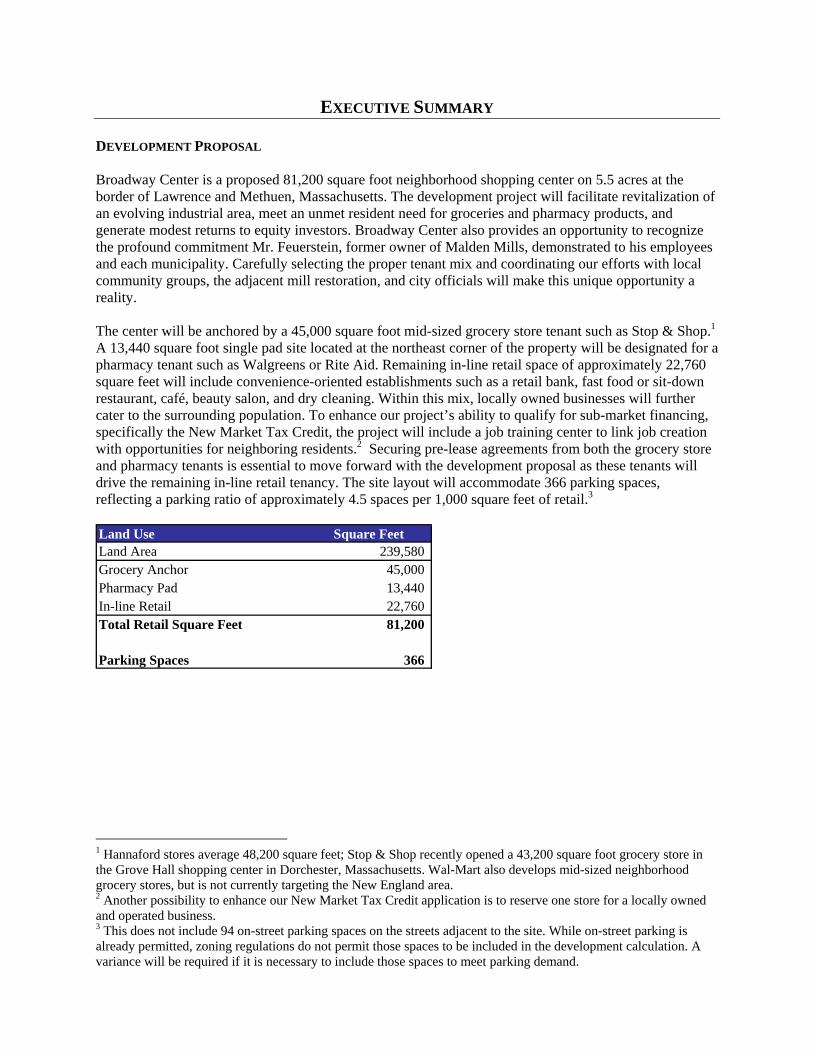
EXECUTIVE SUMMARY DEVELOPMENT PROPOSAL Broadway Center is a proposed 81,200 square foot neighborhood shopping center on 5.5 acres at the border of Lawrence and Methuen, Massachusetts. The development project will facilitate revitalization of an evolving industrial area, meet an unmet resident need for groceries and pharmacy products, and generate modest returns to equity investors. Broadway Center also provides an opportunity to recognize the profound commitment Mr. Feuerstein, former owner of Malden Mills, demonstrated to his employees and each municipality. Carefully selecting the proper tenant mix and coordinating our efforts with local community groups, the adjacent mill restoration, and city officials will make this unique opportunity a reality. The center will be anchored by a 45,000 square foot mid-sized grocery store tenant such as Stop & Shop.1 A 13,440 square foot single pad site located at the northeast corner of the property will be designated for a pharmacy tenant such as Walgreens or Rite Aid. Remaining in-line retail space of approximately 22,760 square feet will include convenience-oriented establishments such as a retail bank, fast food or sit-down restaurant, café, beauty salon, and dry cleaning. Within this mix, locally owned businesses will further cater to the surrounding population. To enhance our project’s ability to qualify for sub-market financing, specifically the New Market Tax Credit, the project will include a job training center to link job creation with opportunities for neighboring residents.2 Securing pre-lease agreements from both the grocery store and pharmacy tenants is essential to move forward with the development proposal as these tenants will drive the remaining in-line retail tenancy. The site layout will accommodate 366 parking spaces, reflecting a parking ratio of approximately 4.5 spaces per 1,000 square feet of retail.3
1 Hannaford stores average 48,200 square feet; Stop & Shop recently opened a 43,200 square foot grocery store in the Grove Hall shopping center in Dorchester, Massachusetts. Wal-Mart also develops mid-sized neighborhood grocery stores, but is not currently targeting the New England area. 2 Another possibility to enhance our New Market Tax Credit application is to reserve one store for a locally owned and operated business. 3 This does not include 94 on-street parking spaces on the streets adjacent to the site. While on-street parking is already permitted, zoning regulations do not permit those spaces to be included in the development calculation. A variance will be required if it is necessary to include those spaces to meet parking demand.
Land Use Square FeetLand Area 239,580 Grocery Anchor 45,000 Pharmacy Pad 13,440 In-line Retail 22,760 Total Retail Square Feet 81,200
Parking Spaces 366
Building A45,000 sf
Bu
ildin
g B
13
,44
0 s
fB
uild
ing
C2
2,7
60
sf
40’
2
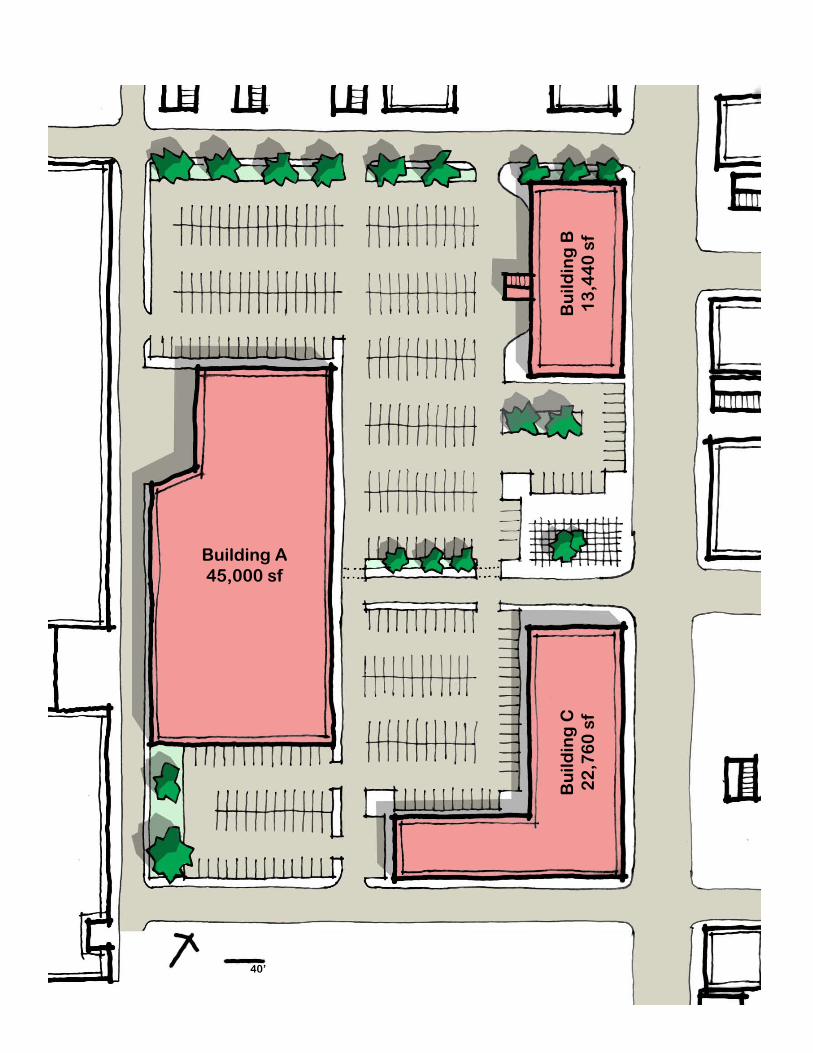
LOCATION
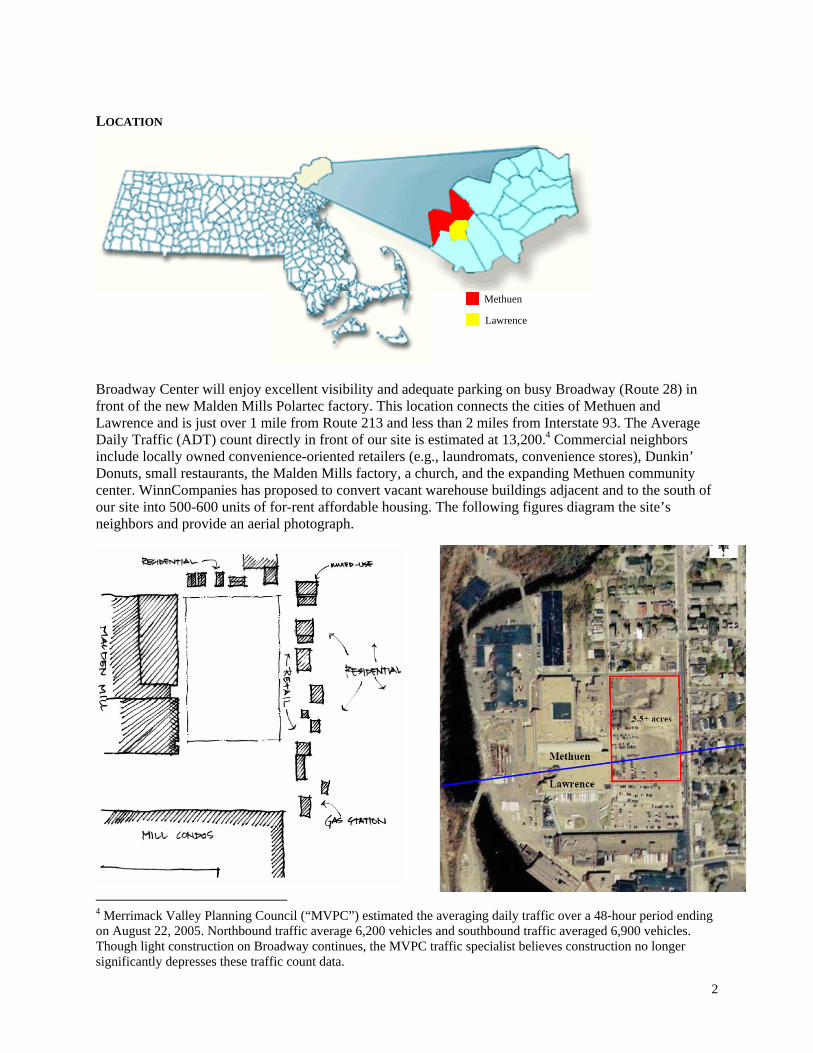
Broadway Center will enjoy excellent visibility and adequate parking on busy Broadway (Route 28) in front of the new Malden Mills Polartec factory. This location connects the cities of Methuen and Lawrence and is just over 1 mile from Route 213 and less than 2 miles from Interstate 93. The Average Daily Traffic (ADT) count directly in front of our site is estimated at 13,200.4 Commercial neighbors include locally owned convenience-oriented retailers (e.g., laundromats, convenience stores), Dunkin’ Donuts, small restaurants, the Malden Mills factory, a church, and the expanding Methuen community center. WinnCompanies has proposed to convert vacant warehouse buildings adjacent and to the south of our site into 500-600 units of for-rent affordable housing. The following figures diagram the site’s neighbors and provide an aerial photograph.
4 Merrimack Valley Planning Council (“MVPC”) estimated the averaging daily traffic over a 48-hour period ending on August 22, 2005. Northbound traffic average 6,200 vehicles and southbound traffic averaged 6,900 vehicles. Though light construction on Broadway continues, the MVPC traffic specialist believes construction no longer significantly depresses these traffic count data.
Methuen
Lawrence
3
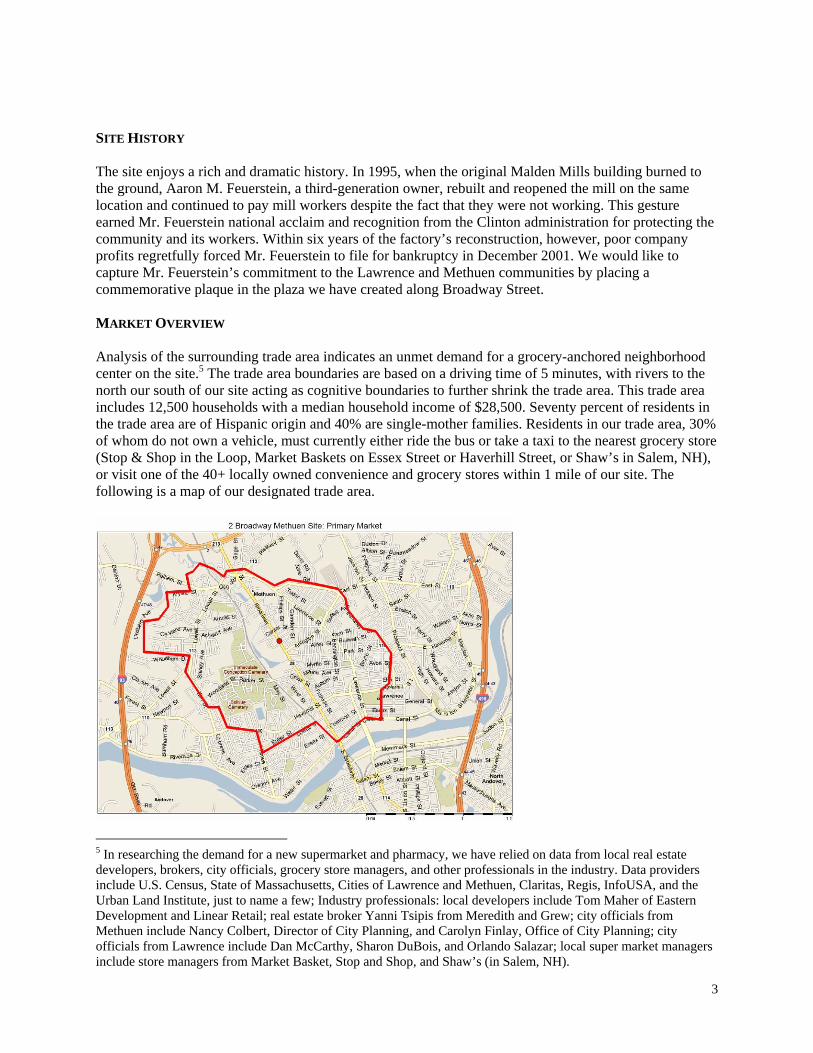
SITE HISTORY The site enjoys a rich and dramatic history. In 1995, when the original Malden Mills building burned to the ground, Aaron M. Feuerstein, a third-generation owner, rebuilt and reopened the mill on the same location and continued to pay mill workers despite the fact that they were not working. This gesture earned Mr. Feuerstein national acclaim and recognition from the Clinton administration for protecting the community and its workers. Within six years of the factory’s reconstruction, however, poor company profits regretfully forced Mr. Feuerstein to file for bankruptcy in December 2001. We would like to capture Mr. Feuerstein’s commitment to the Lawrence and Methuen communities by placing a commemorative plaque in the plaza we have created along Broadway Street. MARKET OVERVIEW Analysis of the surrounding trade area indicates an unmet demand for a grocery-anchored neighborhood center on the site.5 The trade area boundaries are based on a driving time of 5 minutes, with rivers to the north our south of our site acting as cognitive boundaries to further shrink the trade area. This trade area includes 12,500 households with a median household income of $28,500. Seventy percent of residents in the trade area are of Hispanic origin and 40% are single-mother families. Residents in our trade area, 30% of whom do not own a vehicle, must currently either ride the bus or take a taxi to the nearest grocery store (Stop & Shop in the Loop, Market Baskets on Essex Street or Haverhill Street, or Shaw’s in Salem, NH), or visit one of the 40+ locally owned convenience and grocery stores within 1 mile of our site. The following is a map of our designated trade area.
5 In researching the demand for a new supermarket and pharmacy, we have relied on data from local real estate developers, brokers, city officials, grocery store managers, and other professionals in the industry. Data providers include U.S. Census, State of Massachusetts, Cities of Lawrence and Methuen, Claritas, Regis, InfoUSA, and the Urban Land Institute, just to name a few; Industry professionals: local developers include Tom Maher of Eastern Development and Linear Retail; real estate broker Yanni Tsipis from Meredith and Grew; city officials from Methuen include Nancy Colbert, Director of City Planning, and Carolyn Finlay, Office of City Planning; city officials from Lawrence include Dan McCarthy, Sharon DuBois, and Orlando Salazar; local super market managers include store managers from Market Basket, Stop and Shop, and Shaw’s (in Salem, NH).
4
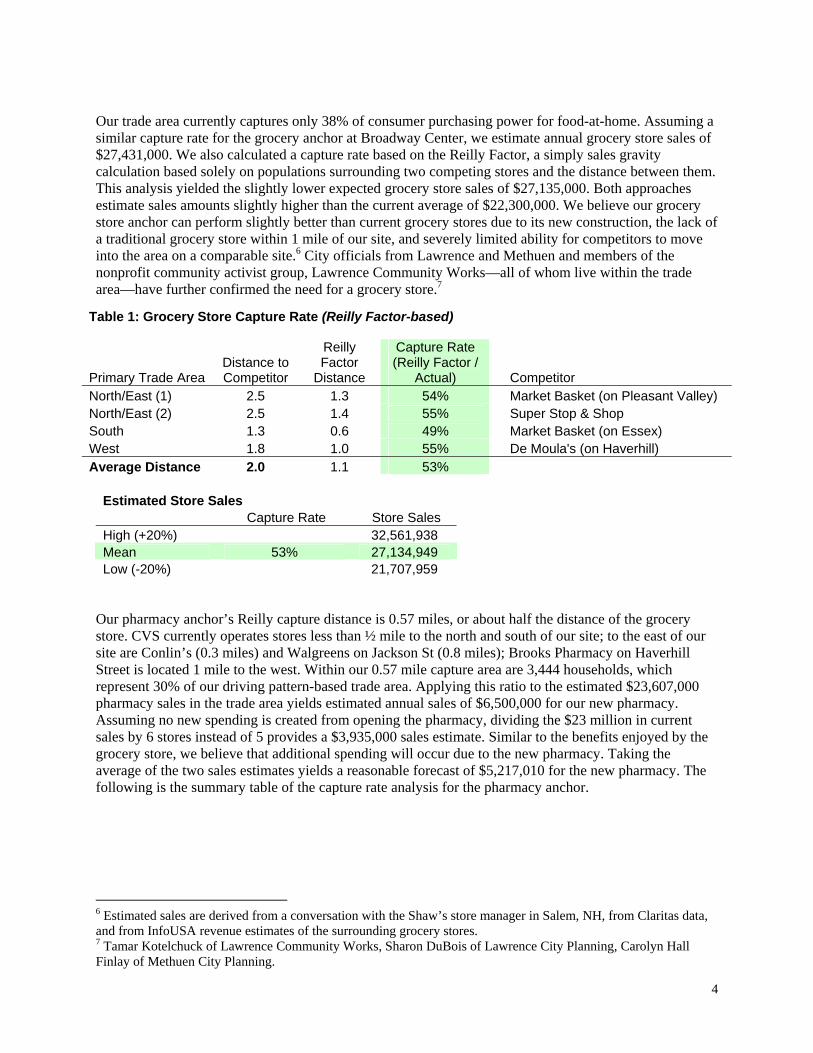
Our trade area currently captures only 38% of consumer purchasing power for food-at-home. Assuming a similar capture rate for the grocery anchor at Broadway Center, we estimate annual grocery store sales of $27,431,000. We also calculated a capture rate based on the Reilly Factor, a simply sales gravity calculation based solely on populations surrounding two competing stores and the distance between them. This analysis yielded the slightly lower expected grocery store sales of $27,135,000. Both approaches estimate sales amounts slightly higher than the current average of $22,300,000. We believe our grocery store anchor can perform slightly better than current grocery stores due to its new construction, the lack of a traditional grocery store within 1 mile of our site, and severely limited ability for competitors to move into the area on a comparable site.6 City officials from Lawrence and Methuen and members of the nonprofit community activist group, Lawrence Community Works—all of whom live within the trade area—have further confirmed the need for a grocery store.7
Estimated Store Sales Capture Rate Store Sales High (+20%) 32,561,938 Mean 53% 27,134,949 Low (-20%) 21,707,959
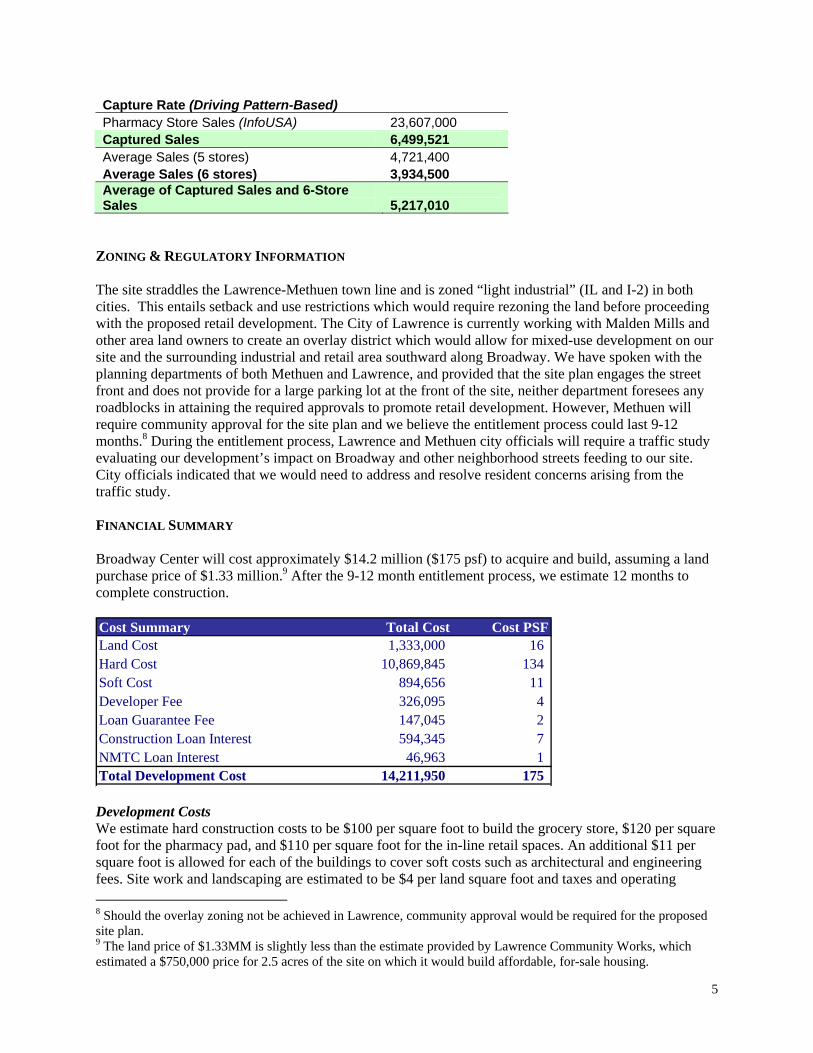
Our pharmacy anchor’s Reilly capture distance is 0.57 miles, or about half the distance of the grocery store. CVS currently operates stores less than ½ mile to the north and south of our site; to the east of our site are Conlin’s (0.3 miles) and Walgreens on Jackson St (0.8 miles); Brooks Pharmacy on Haverhill Street is located 1 mile to the west. Within our 0.57 mile capture area are 3,444 households, which represent 30% of our driving pattern-based trade area. Applying this ratio to the estimated $23,607,000 pharmacy sales in the trade area yields estimated annual sales of $6,500,000 for our new pharmacy. Assuming no new spending is created from opening the pharmacy, dividing the $23 million in current sales by 6 stores instead of 5 provides a $3,935,000 sales estimate. Similar to the benefits enjoyed by the grocery store, we believe that additional spending will occur due to the new pharmacy. Taking the average of the two sales estimates yields a reasonable forecast of $5,217,010 for the new pharmacy. The following is the summary table of the capture rate analysis for the pharmacy anchor.
6 Estimated sales are derived from a conversation with the Shaw’s store manager in Salem, NH, from Claritas data, and from InfoUSA revenue estimates of the surrounding grocery stores. 7 Tamar Kotelchuck of Lawrence Community Works, Sharon DuBois of Lawrence City Planning, Carolyn Hall Finlay of Methuen City Planning.
Table 1: Grocery Store Capture Rate (Reilly Factor-based)
Primary Trade Area Distance to Competitor
Reilly Factor
Distance
Capture Rate (Reilly Factor /
Actual) Competitor North/East (1) 2.5 1.3 54% Market Basket (on Pleasant Valley) North/East (2) 2.5 1.4 55% Super Stop & Shop South 1.3 0.6 49% Market Basket (on Essex) West 1.8 1.0 55% De Moula's (on Haverhill) Average Distance 2.0 1.1 53%
5
Capture Rate (Driving Pattern-Based) Pharmacy Store Sales (InfoUSA) 23,607,000 Captured Sales 6,499,521 Average Sales (5 stores) 4,721,400 Average Sales (6 stores) 3,934,500 Average of Captured Sales and 6-Store Sales 5,217,010
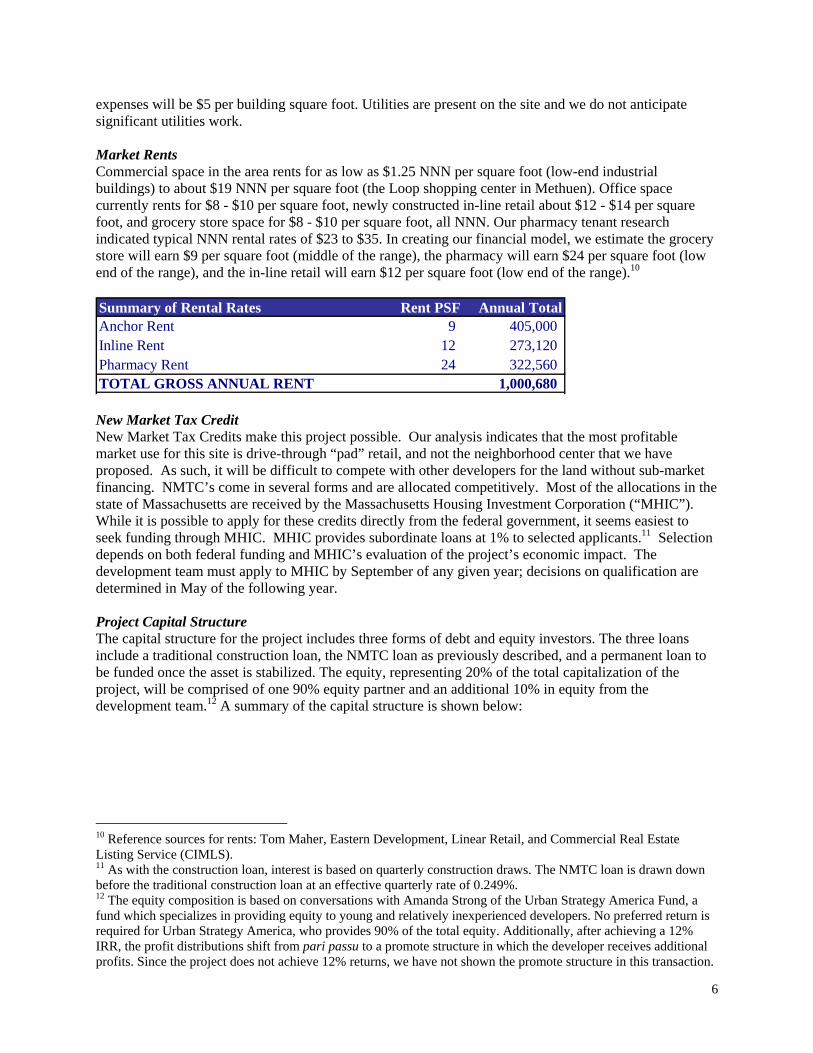
ZONING & REGULATORY INFORMATION The site straddles the Lawrence-Methuen town line and is zoned “light industrial” (IL and I-2) in both cities. This entails setback and use restrictions which would require rezoning the land before proceeding with the proposed retail development. The City of Lawrence is currently working with Malden Mills and other area land owners to create an overlay district which would allow for mixed-use development on our site and the surrounding industrial and retail area southward along Broadway. We have spoken with the planning departments of both Methuen and Lawrence, and provided that the site plan engages the street front and does not provide for a large parking lot at the front of the site, neither department foresees any roadblocks in attaining the required approvals to promote retail development. However, Methuen will require community approval for the site plan and we believe the entitlement process could last 9-12 months.8 During the entitlement process, Lawrence and Methuen city officials will require a traffic study evaluating our development’s impact on Broadway and other neighborhood streets feeding to our site. City officials indicated that we would need to address and resolve resident concerns arising from the traffic study. FINANCIAL SUMMARY Broadway Center will cost approximately $14.2 million ($175 psf) to acquire and build, assuming a land purchase price of $1.33 million.9 After the 9-12 month entitlement process, we estimate 12 months to complete construction. Cost Summary Total Cost Cost PSFLand Cost 1,333,000 16 Hard Cost 10,869,845 134 Soft Cost 894,656 11 Developer Fee 326,095 4 Loan Guarantee Fee 147,045 2 Construction Loan Interest 594,345 7 NMTC Loan Interest 46,963 1 Total Development Cost 14,211,950 175
Development Costs We estimate hard construction costs to be $100 per square foot to build the grocery store, $120 per square foot for the pharmacy pad, and $110 per square foot for the in-line retail spaces. An additional $11 per square foot is allowed for each of the buildings to cover soft costs such as architectural and engineering fees. Site work and landscaping are estimated to be $4 per land square foot and taxes and operating 8 Should the overlay zoning not be achieved in Lawrence, community approval would be required for the proposed site plan. 9 The land price of $1.33MM is slightly less than the estimate provided by Lawrence Community Works, which estimated a $750,000 price for 2.5 acres of the site on which it would build affordable, for-sale housing.
6
expenses will be $5 per building square foot. Utilities are present on the site and we do not anticipate significant utilities work. Market Rents Commercial space in the area rents for as low as $1.25 NNN per square foot (low-end industrial buildings) to about $19 NNN per square foot (the Loop shopping center in Methuen). Office space currently rents for $8 - $10 per square foot, newly constructed in-line retail about $12 - $14 per square foot, and grocery store space for $8 - $10 per square foot, all NNN. Our pharmacy tenant research indicated typical NNN rental rates of $23 to $35. In creating our financial model, we estimate the grocery store will earn $9 per square foot (middle of the range), the pharmacy will earn $24 per square foot (low end of the range), and the in-line retail will earn $12 per square foot (low end of the range).10 Summary of Rental Rates Rent PSF Annual TotalAnchor Rent 9 405,000 Inline Rent 12 273,120 Pharmacy Rent 24 322,560 TOTAL GROSS ANNUAL RENT 1,000,680 New Market Tax Credit New Market Tax Credits make this project possible. Our analysis indicates that the most profitable market use for this site is drive-through “pad” retail, and not the neighborhood center that we have proposed. As such, it will be difficult to compete with other developers for the land without sub-market financing. NMTC’s come in several forms and are allocated competitively. Most of the allocations in the state of Massachusetts are received by the Massachusetts Housing Investment Corporation (“MHIC”). While it is possible to apply for these credits directly from the federal government, it seems easiest to seek funding through MHIC. MHIC provides subordinate loans at 1% to selected applicants.11 Selection depends on both federal funding and MHIC’s evaluation of the project’s economic impact. The development team must apply to MHIC by September of any given year; decisions on qualification are determined in May of the following year. Project Capital Structure The capital structure for the project includes three forms of debt and equity investors. The three loans include a traditional construction loan, the NMTC loan as previously described, and a permanent loan to be funded once the asset is stabilized. The equity, representing 20% of the total capitalization of the project, will be comprised of one 90% equity partner and an additional 10% in equity from the development team.12 A summary of the capital structure is shown below:
10 Reference sources for rents: Tom Maher, Eastern Development, Linear Retail, and Commercial Real Estate Listing Service (CIMLS). 11 As with the construction loan, interest is based on quarterly construction draws. The NMTC loan is drawn down before the traditional construction loan at an effective quarterly rate of 0.249%. 12 The equity composition is based on conversations with Amanda Strong of the Urban Strategy America Fund, a fund which specializes in providing equity to young and relatively inexperienced developers. No preferred return is required for Urban Strategy America, who provides 90% of the total equity. Additionally, after achieving a 12% IRR, the profit distributions shift from pari passu to a promote structure in which the developer receives additional profits. Since the project does not achieve 12% returns, we have not shown the promote structure in this transaction.
7
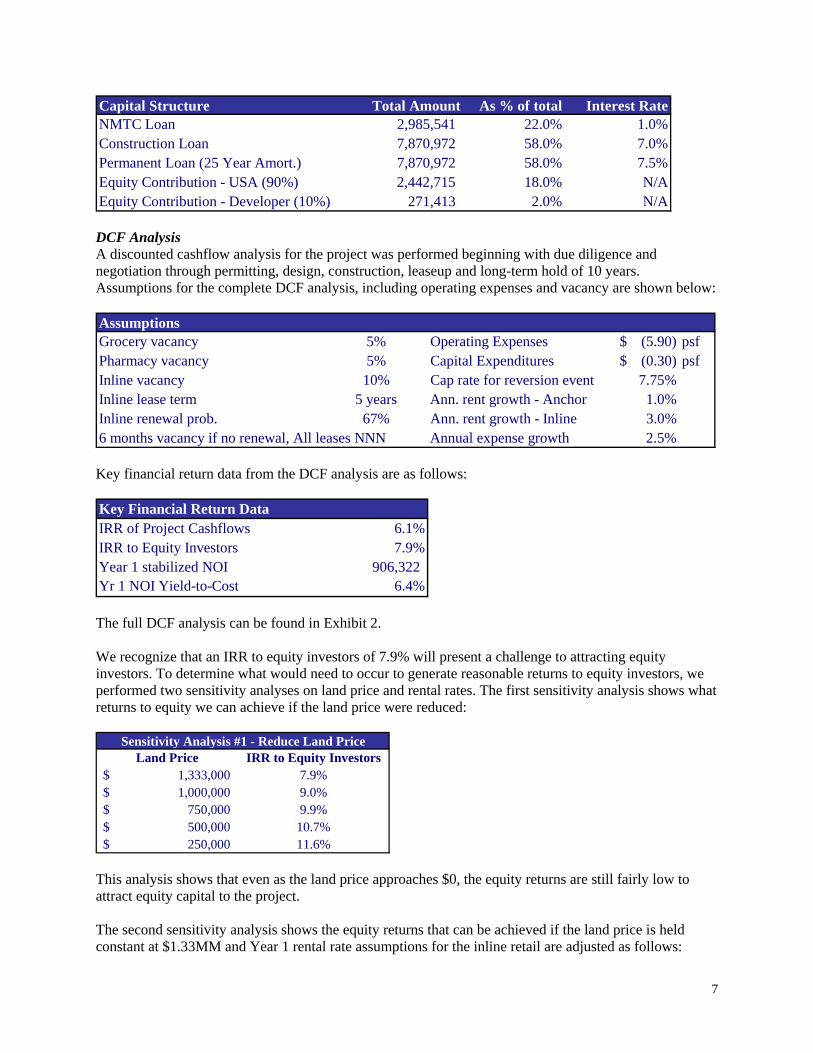
Capital Structure Total Amount As % of total Interest RateNMTC Loan 2,985,541 22.0% 1.0%Construction Loan 7,870,972 58.0% 7.0%Permanent Loan (25 Year Amort.) 7,870,972 58.0% 7.5%Equity Contribution - USA (90%) 2,442,715 18.0% N/AEquity Contribution - Developer (10%) 271,413 2.0% N/A DCF Analysis A discounted cashflow analysis for the project was performed beginning with due diligence and negotiation through permitting, design, construction, leaseup and long-term hold of 10 years. Assumptions for the complete DCF analysis, including operating expenses and vacancy are shown below: AssumptionsGrocery vacancy 5% Operating Expenses (5.90)$ psfPharmacy vacancy 5% Capital Expenditures (0.30)$ psfInline vacancy 10% Cap rate for reversion event 7.75%Inline lease term 5 years Ann. rent growth - Anchor 1.0%Inline renewal prob. 67% Ann. rent growth - Inline 3.0%6 months vacancy if no renewal, All leases NNN Annual expense growth 2.5% Key financial return data from the DCF analysis are as follows: Key Financial Return DataIRR of Project Cashflows 6.1%IRR to Equity Investors 7.9%Year 1 stabilized NOI 906,322 Yr 1 NOI Yield-to-Cost 6.4% The full DCF analysis can be found in Exhibit 2. We recognize that an IRR to equity investors of 7.9% will present a challenge to attracting equity investors. To determine what would need to occur to generate reasonable returns to equity investors, we performed two sensitivity analyses on land price and rental rates. The first sensitivity analysis shows what returns to equity we can achieve if the land price were reduced:
Land Price IRR to Equity Investors1,333,000$ 7.9%1,000,000$ 9.0%
750,000$ 9.9%500,000$ 10.7%250,000$ 11.6%
Sensitivity Analysis #1 - Reduce Land Price
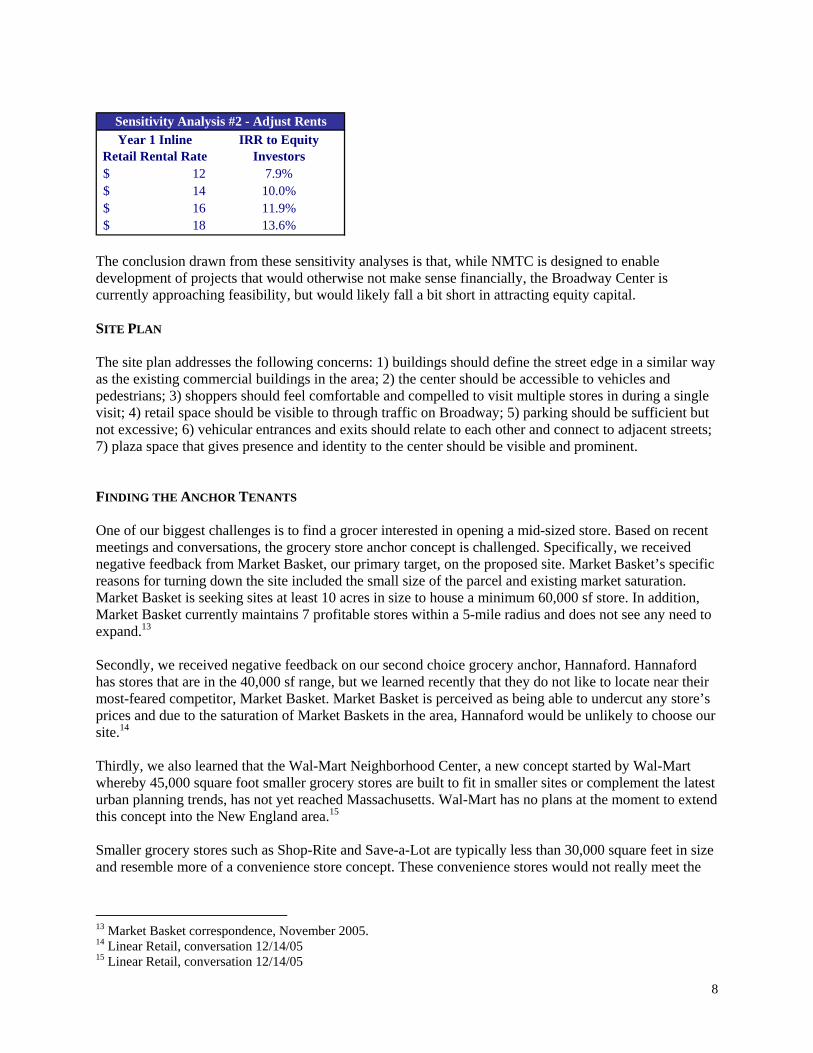
This analysis shows that even as the land price approaches $0, the equity returns are still fairly low to attract equity capital to the project. The second sensitivity analysis shows the equity returns that can be achieved if the land price is held constant at $1.33MM and Year 1 rental rate assumptions for the inline retail are adjusted as follows:
8
Year 1 Inline IRR to EquityRetail Rental Rate Investors
12$ 7.9%14$ 10.0%16$ 11.9%18$ 13.6%
Sensitivity Analysis #2 - Adjust Rents
The conclusion drawn from these sensitivity analyses is that, while NMTC is designed to enable development of projects that would otherwise not make sense financially, the Broadway Center is currently approaching feasibility, but would likely fall a bit short in attracting equity capital. SITE PLAN The site plan addresses the following concerns: 1) buildings should define the street edge in a similar way as the existing commercial buildings in the area; 2) the center should be accessible to vehicles and pedestrians; 3) shoppers should feel comfortable and compelled to visit multiple stores in during a single visit; 4) retail space should be visible to through traffic on Broadway; 5) parking should be sufficient but not excessive; 6) vehicular entrances and exits should relate to each other and connect to adjacent streets; 7) plaza space that gives presence and identity to the center should be visible and prominent. FINDING THE ANCHOR TENANTS One of our biggest challenges is to find a grocer interested in opening a mid-sized store. Based on recent meetings and conversations, the grocery store anchor concept is challenged. Specifically, we received negative feedback from Market Basket, our primary target, on the proposed site. Market Basket’s specific reasons for turning down the site included the small size of the parcel and existing market saturation. Market Basket is seeking sites at least 10 acres in size to house a minimum 60,000 sf store. In addition, Market Basket currently maintains 7 profitable stores within a 5-mile radius and does not see any need to expand.13 Secondly, we received negative feedback on our second choice grocery anchor, Hannaford. Hannaford has stores that are in the 40,000 sf range, but we learned recently that they do not like to locate near their most-feared competitor, Market Basket. Market Basket is perceived as being able to undercut any store’s prices and due to the saturation of Market Baskets in the area, Hannaford would be unlikely to choose our site.14 Thirdly, we also learned that the Wal-Mart Neighborhood Center, a new concept started by Wal-Mart whereby 45,000 square foot smaller grocery stores are built to fit in smaller sites or complement the latest urban planning trends, has not yet reached Massachusetts. Wal-Mart has no plans at the moment to extend this concept into the New England area.15 Smaller grocery stores such as Shop-Rite and Save-a-Lot are typically less than 30,000 square feet in size and resemble more of a convenience store concept. These convenience stores would not really meet the
13 Market Basket correspondence, November 2005. 14 Linear Retail, conversation 12/14/05 15 Linear Retail, conversation 12/14/05
9
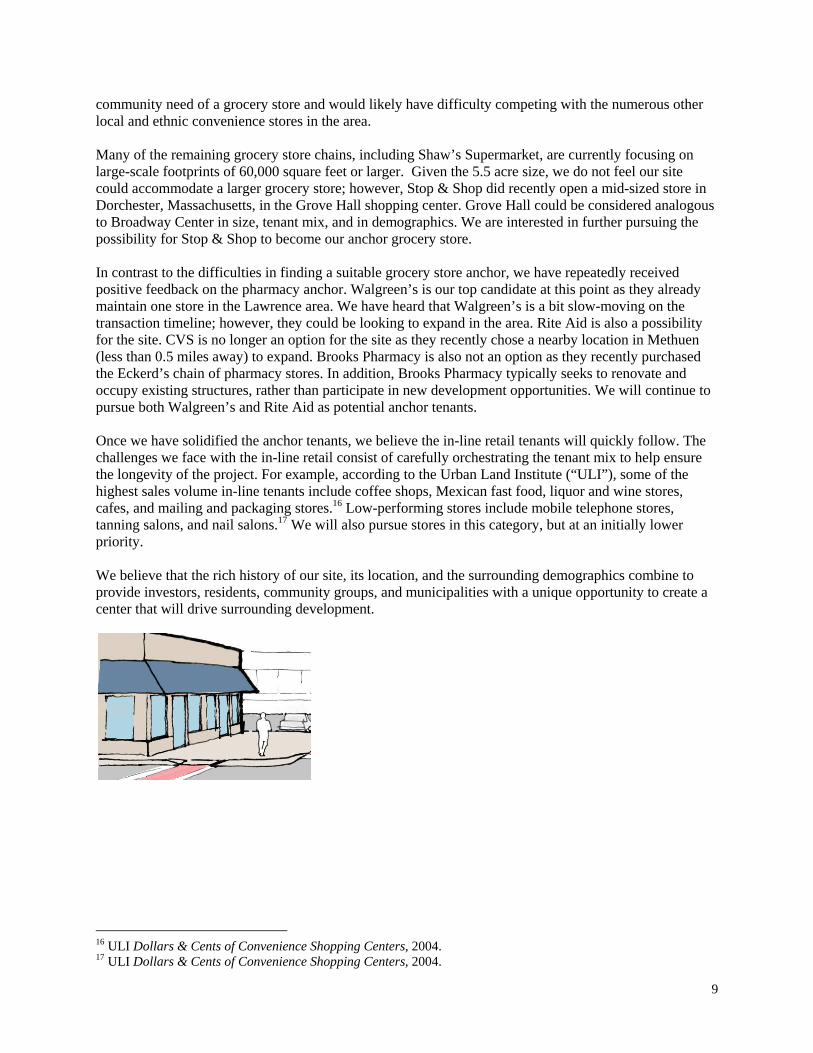
community need of a grocery store and would likely have difficulty competing with the numerous other local and ethnic convenience stores in the area. Many of the remaining grocery store chains, including Shaw’s Supermarket, are currently focusing on large-scale footprints of 60,000 square feet or larger. Given the 5.5 acre size, we do not feel our site could accommodate a larger grocery store; however, Stop & Shop did recently open a mid-sized store in Dorchester, Massachusetts, in the Grove Hall shopping center. Grove Hall could be considered analogous to Broadway Center in size, tenant mix, and in demographics. We are interested in further pursuing the possibility for Stop & Shop to become our anchor grocery store. In contrast to the difficulties in finding a suitable grocery store anchor, we have repeatedly received positive feedback on the pharmacy anchor. Walgreen’s is our top candidate at this point as they already maintain one store in the Lawrence area. We have heard that Walgreen’s is a bit slow-moving on the transaction timeline; however, they could be looking to expand in the area. Rite Aid is also a possibility for the site. CVS is no longer an option for the site as they recently chose a nearby location in Methuen (less than 0.5 miles away) to expand. Brooks Pharmacy is also not an option as they recently purchased the Eckerd’s chain of pharmacy stores. In addition, Brooks Pharmacy typically seeks to renovate and occupy existing structures, rather than participate in new development opportunities. We will continue to pursue both Walgreen’s and Rite Aid as potential anchor tenants. Once we have solidified the anchor tenants, we believe the in-line retail tenants will quickly follow. The challenges we face with the in-line retail consist of carefully orchestrating the tenant mix to help ensure the longevity of the project. For example, according to the Urban Land Institute (“ULI”), some of the highest sales volume in-line tenants include coffee shops, Mexican fast food, liquor and wine stores, cafes, and mailing and packaging stores.16 Low-performing stores include mobile telephone stores, tanning salons, and nail salons.17 We will also pursue stores in this category, but at an initially lower priority. We believe that the rich history of our site, its location, and the surrounding demographics combine to provide investors, residents, community groups, and municipalities with a unique opportunity to create a center that will drive surrounding development.
16 ULI Dollars & Cents of Convenience Shopping Centers, 2004. 17 ULI Dollars & Cents of Convenience Shopping Centers, 2004.
10
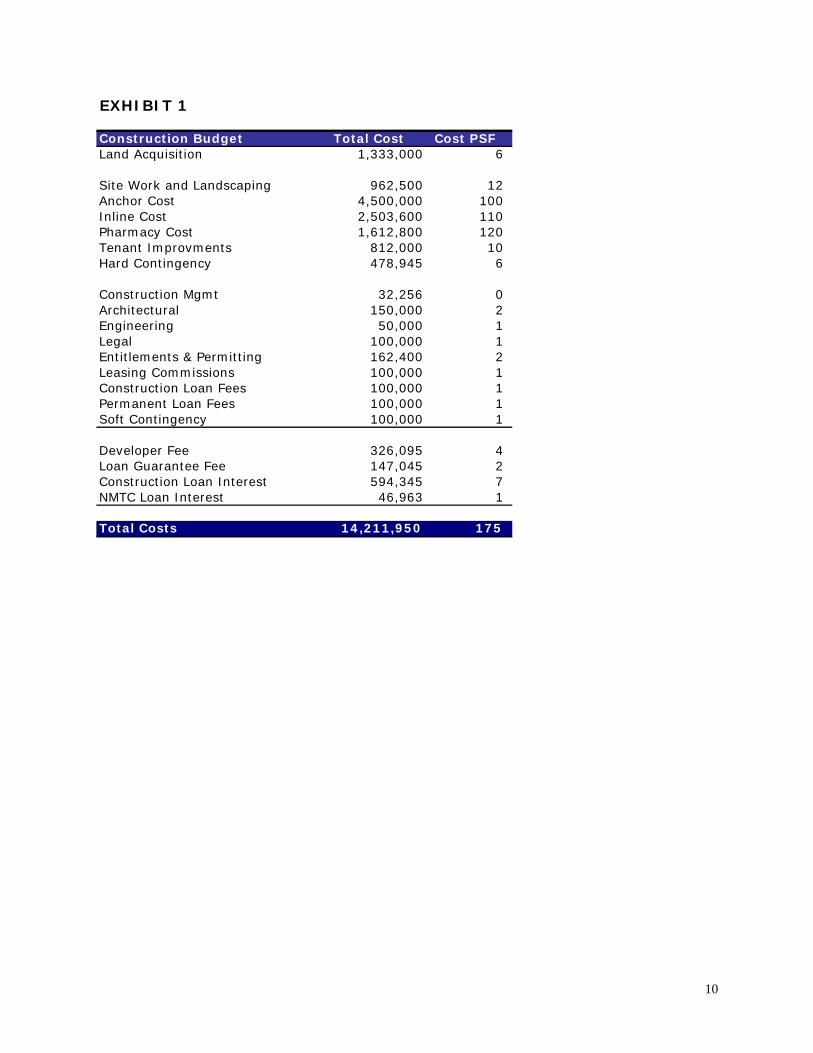
EXHIBIT 1
Construction Budget Total Cost Cost PSFLand Acquisition 1,333,000 6
Site Work and Landscaping 962,500 12 Anchor Cost 4,500,000 100 Inline Cost 2,503,600 110 Pharmacy Cost 1,612,800 120 Tenant Improvments 812,000 10 Hard Contingency 478,945 6
Construction Mgmt 32,256 0 Architectural 150,000 2 Engineering 50,000 1 Legal 100,000 1 Entitlements & Permitting 162,400 2 Leasing Commissions 100,000 1 Construction Loan Fees 100,000 1 Permanent Loan Fees 100,000 1 Soft Contingency 100,000 1
Developer Fee 326,095 4 Loan Guarantee Fee 147,045 2 Construction Loan Interest 594,345 7 NMTC Loan Interest 46,963 1
Total Costs 14,211,950 175
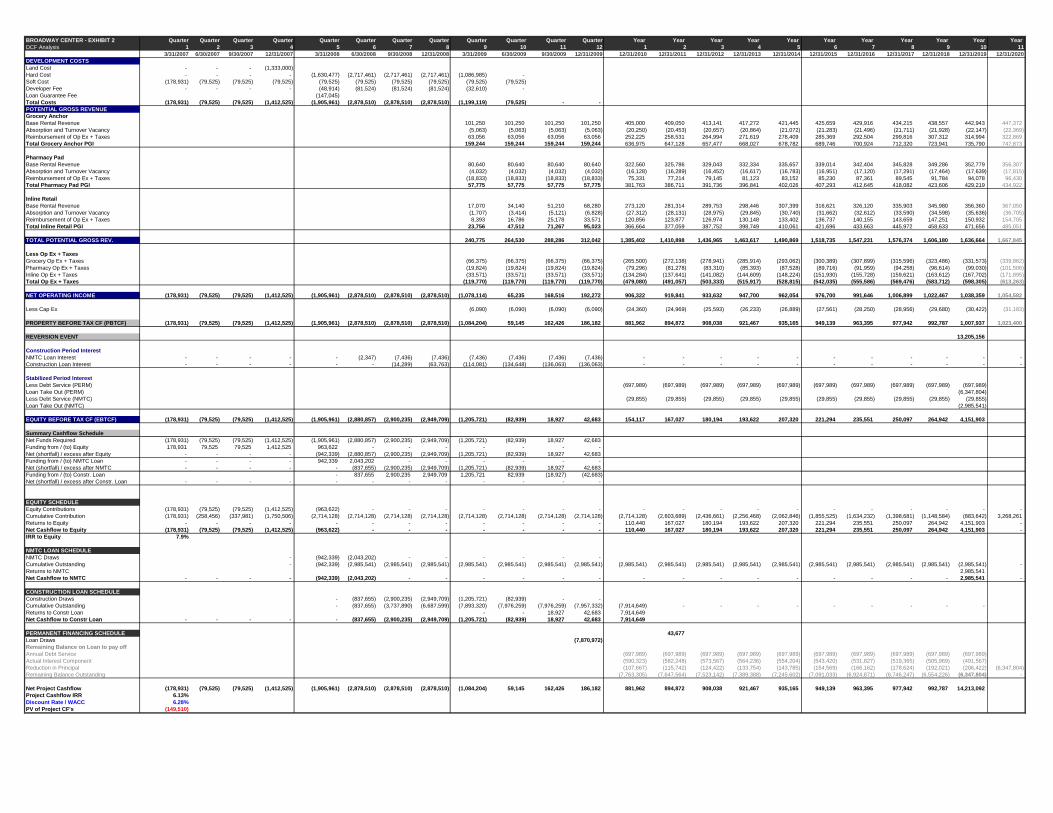
BROADWAY CENTER - EXHIBIT 2 Quarter Quarter Quarter Quarter Quarter Quarter Quarter Quarter Quarter Quarter Quarter Quarter Year Year Year Year Year Year Year Year Year Year Year DCF Analysis 1 2 3 4 5 6 7 8 9 10 11 12 1 2 3 4 5 6 7 8 9 10 11
3/31/2007 6/30/2007 9/30/2007 12/31/2007 3/31/2008 6/30/2008 9/30/2008 12/31/2008 3/31/2009 6/30/2009 9/30/2009 12/31/2009 12/31/2010 12/31/2011 12/31/2012 12/31/2013 12/31/2014 12/31/2015 12/31/2016 12/31/2017 12/31/2018 12/31/2019 12/31/2020DEVELOPMENT COSTSLand Cost - - - (1,333,000) Hard Cost - - - - (1,630,477) (2,717,461) (2,717,461) (2,717,461) (1,086,985) - Soft Cost (178,931) (79,525) (79,525) (79,525) (79,525) (79,525) (79,525) (79,525) (79,525) (79,525) Developer Fee - - - - (48,914) (81,524) (81,524) (81,524) (32,610) - Loan Guarantee Fee (147,045) Total Costs (178,931) (79,525) (79,525) (1,412,525) (1,905,961) (2,878,510) (2,878,510) (2,878,510) (1,199,119) (79,525) - - POTENTIAL GROSS REVENUEGrocery AnchorBase Rental Revenue 101,250 101,250 101,250 101,250 405,000 409,050 413,141 417,272 421,445 425,659 429,916 434,215 438,557 442,943 447,372 Absorption and Turnover Vacancy (5,063) (5,063) (5,063) (5,063) (20,250) (20,453) (20,657) (20,864) (21,072) (21,283) (21,496) (21,711) (21,928) (22,147) (22,369) Reimbursement of Op Ex + Taxes 63,056 63,056 63,056 63,056 252,225 258,531 264,994 271,619 278,409 285,369 292,504 299,816 307,312 314,994 322,869 Total Grocery Anchor PGI 159,244 159,244 159,244 159,244 636,975 647,128 657,477 668,027 678,782 689,746 700,924 712,320 723,941 735,790 747,873
Pharmacy PadBase Rental Revenue 80,640 80,640 80,640 80,640 322,560 325,786 329,043 332,334 335,657 339,014 342,404 345,828 349,286 352,779 356,307 Absorption and Turnover Vacancy (4,032) (4,032) (4,032) (4,032) (16,128) (16,289) (16,452) (16,617) (16,783) (16,951) (17,120) (17,291) (17,464) (17,639) (17,815) Reimbursement of Op Ex + Taxes (18,833) (18,833) (18,833) (18,833) 75,331 77,214 79,145 81,123 83,152 85,230 87,361 89,545 91,784 94,078 96,430 Total Pharmacy Pad PGI 57,775 57,775 57,775 57,775 381,763 386,711 391,736 396,841 402,026 407,293 412,645 418,082 423,606 429,219 434,922
Inline RetailBase Rental Revenue 17,070 34,140 51,210 68,280 273,120 281,314 289,753 298,446 307,399 316,621 326,120 335,903 345,980 356,360 367,050 Absorption and Turnover Vacancy (1,707) (3,414) (5,121) (6,828) (27,312) (28,131) (28,975) (29,845) (30,740) (31,662) (32,612) (33,590) (34,598) (35,636) (36,705) Reimbursement of Op Ex + Taxes 8,393 16,786 25,178 33,571 120,856 123,877 126,974 130,148 133,402 136,737 140,155 143,659 147,251 150,932 154,705 Total Inline Retail PGI 23,756 47,512 71,267 95,023 366,664 377,059 387,752 398,749 410,061 421,696 433,663 445,972 458,633 471,656 485,051
TOTAL POTENTIAL GROSS REV. 240,775 264,530 288,286 312,042 1,385,402 1,410,898 1,436,965 1,463,617 1,490,869 1,518,735 1,547,231 1,576,374 1,606,180 1,636,664 1,667,845
Less Op Ex + TaxesGrocery Op Ex + Taxes (66,375) (66,375) (66,375) (66,375) (265,500) (272,138) (278,941) (285,914) (293,062) (300,389) (307,899) (315,596) (323,486) (331,573) (339,862) Pharmacy Op Ex + Taxes (19,824) (19,824) (19,824) (19,824) (79,296) (81,278) (83,310) (85,393) (87,528) (89,716) (91,959) (94,258) (96,614) (99,030) (101,506) Inline Op Ex + Taxes (33,571) (33,571) (33,571) (33,571) (134,284) (137,641) (141,082) (144,609) (148,224) (151,930) (155,728) (159,621) (163,612) (167,702) (171,895) Total Op Ex + Taxes (119,770) (119,770) (119,770) (119,770) (479,080) (491,057) (503,333) (515,917) (528,815) (542,035) (555,586) (569,476) (583,712) (598,305) (613,263)
NET OPERATING INCOME (178,931) (79,525) (79,525) (1,412,525) (1,905,961) (2,878,510) (2,878,510) (2,878,510) (1,078,114) 65,235 168,516 192,272 906,322 919,841 933,632 947,700 962,054 976,700 991,646 1,006,899 1,022,467 1,038,359 1,054,582
Less Cap Ex (6,090) (6,090) (6,090) (6,090) (24,360) (24,969) (25,593) (26,233) (26,889) (27,561) (28,250) (28,956) (29,680) (30,422) (31,183)
PROPERTY BEFORE TAX CF (PBTCF) (178,931) (79,525) (79,525) (1,412,525) (1,905,961) (2,878,510) (2,878,510) (2,878,510) (1,084,204) 59,145 162,426 186,182 881,962 894,872 908,038 921,467 935,165 949,139 963,395 977,942 992,787 1,007,937 1,023,400
REVERSION EVENT 13,205,156
Construction Period InterestNMTC Loan Interest - - - - - (2,347) (7,436) (7,436) (7,436) (7,436) (7,436) (7,436) - - - - - - - - - - - Construction Loan Interest - - - - - - (14,289) (63,763) (114,081) (134,648) (136,063) (136,063) - - - - - - - - - - -
Stabilized Period InterestLess Debt Service (PERM) (697,989) (697,989) (697,989) (697,989) (697,989) (697,989) (697,989) (697,989) (697,989) (697,989) Loan Take Out (PERM) (6,347,804) Less Debt Service (NMTC) (29,855) (29,855) (29,855) (29,855) (29,855) (29,855) (29,855) (29,855) (29,855) (29,855) Loan Take Out (NMTC) (2,985,541)
EQUITY BEFORE TAX CF (EBTCF) (178,931) (79,525) (79,525) (1,412,525) (1,905,961) (2,880,857) (2,900,235) (2,949,709) (1,205,721) (82,939) 18,927 42,683 154,117 167,027 180,194 193,622 207,320 221,294 235,551 250,097 264,942 4,151,903
Summary Cashflow ScheduleNet Funds Required (178,931) (79,525) (79,525) (1,412,525) (1,905,961) (2,880,857) (2,900,235) (2,949,709) (1,205,721) (82,939) 18,927 42,683 Funding from / (to) Equity 178,931 79,525 79,525 1,412,525 963,622 - - - - - - - Net (shortfall) / excess after Equity - - - - (942,339) (2,880,857) (2,900,235) (2,949,709) (1,205,721) (82,939) 18,927 42,683 Funding from / (to) NMTC Loan - - - - 942,339 2,043,202 - - - - - - Net (shortfall) / excess after NMTC - - - - - (837,655) (2,900,235) (2,949,709) (1,205,721) (82,939) 18,927 42,683 Funding from / (to) Constr. Loan - 837,655 2,900,235 2,949,709 1,205,721 82,939 (18,927) (42,683) Net (shortfall) / excess after Constr. Loan - - - - - - - - - - - -
EQUITY SCHEDULEEquity Contributions (178,931) (79,525) (79,525) (1,412,525) (963,622) - - - - - - - - - - - - - - - - - - Cumulative Contribution (178,931) (258,456) (337,981) (1,750,506) (2,714,128) (2,714,128) (2,714,128) (2,714,128) (2,714,128) (2,714,128) (2,714,128) (2,714,128) (2,714,128) (2,603,689) (2,436,661) (2,256,468) (2,062,846) (1,855,525) (1,634,232) (1,398,681) (1,148,584) (883,642) 3,268,261 Returns to Equity - - - - - - - - - - - - 110,440 167,027 180,194 193,622 207,320 221,294 235,551 250,097 264,942 4,151,903 - Net Cashflow to Equity (178,931) (79,525) (79,525) (1,412,525) (963,622) - - - - - - - 110,440 167,027 180,194 193,622 207,320 221,294 235,551 250,097 264,942 4,151,903 - IRR to Equity 7.9%
NMTC LOAN SCHEDULENMTC Draws - (942,339) (2,043,202) - - - - - - Cumulative Outstanding - (942,339) (2,985,541) (2,985,541) (2,985,541) (2,985,541) (2,985,541) (2,985,541) (2,985,541) (2,985,541) (2,985,541) (2,985,541) (2,985,541) (2,985,541) (2,985,541) (2,985,541) (2,985,541) (2,985,541) (2,985,541) - Returns to NMTC 2,985,541 Net Cashflow to NMTC - - - - (942,339) (2,043,202) - - - - - - - - - - - - - - - 2,985,541 -
CONSTRUCTION LOAN SCHEDULEConstruction Draws - (837,655) (2,900,235) (2,949,709) (1,205,721) (82,939) - - Cumulative Outstanding - (837,655) (3,737,890) (6,687,599) (7,893,320) (7,976,259) (7,976,259) (7,957,332) (7,914,649) - - - - - - - - - Returns to Constr Loan - - 18,927 42,683 7,914,649 Net Cashflow to Constr Loan - - - - - (837,655) (2,900,235) (2,949,709) (1,205,721) (82,939) 18,927 42,683 7,914,649
PERMANENT FINANCING SCHEDULE 43,677 Loan Draws (7,870,972) Remaining Balance on Loan to pay offAnnual Debt Service (697,989) (697,989) (697,989) (697,989) (697,989) (697,989) (697,989) (697,989) (697,989) (697,989) Actual Interest Component (590,323) (582,248) (573,567) (564,236) (554,204) (543,420) (531,827) (519,365) (505,969) (491,567) Reduction in Principal (107,667) (115,742) (124,422) (133,754) (143,785) (154,569) (166,162) (178,624) (192,021) (206,422) (6,347,804) Remaining Balance Outstanding (7,763,305) (7,647,564) (7,523,142) (7,389,388) (7,245,602) (7,091,033) (6,924,871) (6,746,247) (6,554,226) (6,347,804) -
Net Project Cashflow (178,931) (79,525) (79,525) (1,412,525) (1,905,961) (2,878,510) (2,878,510) (2,878,510) (1,084,204) 59,145 162,426 186,182 881,962 894,872 908,038 921,467 935,165 949,139 963,395 977,942 992,787 14,213,092 Project Cashflow IRR 6.13%Discount Rate / WACC 6.28%PV of Project CF's (149,510)