Embed Size (px)
Citation preview

Executive Education Course on
Multidimensional Poverty for SADC
Steering Committee members

Aim & Agenda

Aim
The aim of this seminar is to provide an introduction to
multidimensional poverty approach for SADC Steering
Committee members and to discuss (informally) the
implementation and use of multidimensional approaches
for SADC policy purposes.
The course takes place right before the third SADC
Steering Committee Meeting and thus provides an
excellent opportunity to make use of a multidimensional
poverty measure for policy-making.

Agenda
First Day
• Welcome
• Why multidimensional poverty?
• Discussion of relevance to
southern Africa
• The International MPI & case of
southern Africa
• Multidimensional Poverty
measurement and southern
African values
Second Day
• The cases of Mexico, Colombia and
Brazil and growing demand
• Normative Issues (Purpose &
Institutions) & Implementation
(Dimensions, time, people & Process)
• Exercises: institutional processes and
relevance to southern Africa
• Politics of MPI
• The Multidimensional Poverty
Network
• Reflections, feedback and next steps

What is OPHI?

What is OPHI?
The Oxford Poverty and Human Development
Initiative (OPHI) is an economic research centre
within the Oxford Department of International
Development at the University of Oxford. Established
in 2007, the centre is led by Sabina Alkire.
Advisors:
Sudhir Anand, Tony Atkinson, and Amartya Sen
Management Committee:
Valpy FitzGerald, Ian Goldin, John Hammock, Barbara
Harriss-White, Frances Stewart

Global team: • 5 post-docs (Venezuela, India, Bolivia, Chile)+ 1 director
• 3 core staff (administrator, communications, project assistant)
• 20 colleagues from many countries (India, Colombia, Mexico, Pakistan,
US, Argentina, Morocco, Portugal etc.)
Purpose:
To build a multidimensional economic framework
for reducing poverty grounded in people’s
experiences and values.
What is OPHI?

Research Topics
Missing Dimensions
• Developing modules for inclusion in internationally
comparable household surveys.
• Relevant to post-2015 discussion of potential MDGs like
work, safety from violence, or empowerment.

Research Topics
Missing Dimensions
1. I wish I'd had the courage to live a life true
to myself, not the life others expected of
me. (Meaningful life)
2. I wish I hadn't worked so hard. (Quality
of employment)
3. I wish I'd had the courage to express my
feelings. (Without shame)
4. I wish I had stayed in touch with my
friends (Without isolation).
5. I wish that I had let myself be happier
(Psychological wellbeing).

Research Topics/activities
Multidimensional Metrics
• Developing & publishing rigorous new measures
• Applying these to real problems (WEAI, MPI, etc)
• Developing methodologies of analysis and evaluation
Worldwide training program:
• 200+ people from over 30 countries so far trained in intensive
two-week courses since 2008.
• 27 bespoke training courses held for policymakers in countries
as diverse as Bhutan, Chad, Egypt, Ethiopia, Hungary, Iraq,
Jordan, Malaysia, Nepal, Rwanda, Thailand, and Venezuela.
• Demand for courses exceeds supply, hence e-portal developed;
OUP book proposal under consideration.

Other Applications
• Use techniques to support other initiatives: − Monitoring and Evaluation
− Targeting of rural poverty initiatives
− Coordination
− Institutional measures of service delivery – e.g. water, educ.
• National Initiatives: − Official Poverty Measures
− Linked Targeting, M&E, Coordination activities
− Qualitative and country-based centres of excellence.
− Policy network alongside technical network.

Multidimensional Measures & Policy
Incomplete timeline: • 2007: Alkire & Foster new multidimensional methodology
• 2008: Academic applications - 14 countries; Bhutan’s 1st GNH index.
• 2009: Applications to other issues, including:
governance, targeting, child poverty, education, health
• 2009: National application: Mexico’s official national measure
• 2010: Global MPI launched for 100+ developing countries
• 2011: Extensive demand for technical support from countries.
• 2011: National Application: Colombia, launched by Head of State
• 2012: Application: Women’s Empowerment in Agriculture Index
• 2012: Bhutan’s official Gross National Happiness Index

Why Multidimensional
(MD) Poverty Measures?

Motivation
“We are almost blind when the
metrics on which action is based
are ill-designed or when they are
not well understood”

Motivation Don’t ask me what poverty is because
you have met it outside my house. Look
at the house and count the number of
holes. Look at my utensils and the
clothes that I am wearing. Look at
everything and write what you see. What
you see is poverty. —A poor man, Kenya
1997
In the evenings, eat sweet potatoes, sleep
In the mornings, eat sweet potatoes, work
At lunch, go without (Guatemala 1997)
The rich have one permanent job; the
poor are rich in many jobs. —Poor man,
Pakistan 2000
Water is life, and because we have no
water, life is miserable. —Kenya 1997
I am illiterate. I am like a blind person. —
Illiterate mother, Pakistan 1995

Why such interest?
This session will briefly introduce some of the reasons
that multidimensional measures of poverty (and
well-being) are on the upswing.
In addition to the moral or ethical motivations already
covered, they can be divided into three types:
1. Technical – we can
2. Policy – we realize the value-added
3. Political – there is a demand

Why the new emphasis on measurement?
We can: Technical
1) Data are increasing
2) Methodologies are improving
We need to: Policy
3) Income poverty: important but insufficient.
4) Growth insufficient
5) Dashboards are complex
6) Associations vary
7) Joint Distribution (Marginal Measures)
We are willing to: Political
8) 2010 HD measures sparked interest and debate
9) Political critique of current metrics; exploration

1. Relevant Data are Increasing
• Since 1985, the multi-topic household survey
data has increased in frequency and coverage
• Even greater breathtaking increases have
occurred with income and expenditure data
• Technology exists to process these data

1. Relevant Data are Increasing

2. Multidimensional Measures are
exploding
• Bandura (2006) found that over 50% of
composite (multidimensional) indices had
been developed since 2001; now is greater.
• Examples: Doing Business Index,
Governance, Global Peace Index, Quality of
Life Indices, Multidimensional Poverty
Indices, SIGI, CGD Index.

3. Why Multidimensional Poverty?
Income poverty is incomplete
Mismatches between
income poverty and
deprivations in
education and nutrition.
Education
Nutrition/health
Children
Adults
Children
Adults
deprived in
functionings but not
income/expenditure
India
43%
60%
53%
63%
Perú
32%
37%
21%
55%
income/expenditure
poor persons who are
not deprived in
functionings
India
65%
38%
53%
91%
Perú
93%
73%
66%
94%
Source: Franco et al. (2002) cited in
Ruggieri-Laderchi, Saith and Stewart.

Source: Whelan Layte Maitre 2004 Understanding the Mismatch between Income Poverty & Deprivation
3. Why Multidimensional Poverty?
Income poverty is incomplete
Source: Whelan Layte Maitre 2004 Understanding the Mismatch between Income Poverty & Deprivation
Europe 2020: Multidimensional
Poverty
In Europe, while 20% of
people are persistently
income poor, and 20% are
persistently materially
deprived, ONLY 10% of
people are BOTH
persistently income poor
and materially deprived.
This observation motivated
the move in Europe to a
multidimensional poverty
measure. Income doesn’t
tell the full story – even of
material deprivation!

3. Why Multidimensional Poverty?
Income poverty is incomplete
Source: RECOUP Data, CORD India. 2009
Quintiles Severely thin Thin Normal Overwt Obese Total
Rural Quintiles BMI < 17 < 18.5 25>x>30 >30
Quintile 1 (poorest) 22.8 25.7 49.3 2.0 0.3 100
Quintile 5 (richest) 17.0 19.0 55.7 7.0 1.3 100
Total 18.5 22.6 53.6 4.3 1.1 100

POOR
Income Poverty? IN
CO
ME
0
Poverty line
NON-POOR
Usually Basic
Basket
Income or
Consumption?
Twice the food
basket: Why?
Requirements
(Calories? Proteins?)
Usually based on
an average adult
• Rural vs. Urban
• Update app. each 10 years
• Scales (Oxford, Luxemburg, Per capital)
• Consumption survey (mainly urban)
• National? Regional? Poverty line
• Access not always implies achievement
• Prices (shadow, by region?, country?)

Source: Whelan Layte Maitre 2004 Understanding the Mismatch between Income Poverty & Deprivation
3. Why Multidimensional Poverty?
Income poverty is incomplete
Other considerations with income poverty:
• shows some changes with lag; others at once
• does not show how people are poor
• affected by different policies
• measurement error & data collection issues
So need both – income & other dim.

4. Growth? Claims are strong
2008 Growth Commission
“Growth is not an end in itself. But it makes it
possible to achieve other important objectives
of individuals and societies. It can spare people
en masse from poverty and drudgery. Nothing
else ever has.”

4. Growth Commission
The Growth Commission 2008 generated a nuanced set of
observations on sustained economic growth based on case
studies of countries that had 7% growth for over 25 years.
BUT after 25 years of growth:
- In Indonesia, 28% of children under five were still
underweight and 42% were stunted
- In Botswana, 30% of the population were malnourished, and
the HDI rank was 70 places below the GDP rank.
- In Oman, women earned less than 20% of male earnings.
Conclusion: Sustained growth needs to be pursued
alongside multidimensional poverty reduction. All
variables need to be on the table, in view, at the same time.

4. Growth? Claims are strong
…and debated
François Bourguignon, Agnès Bénassy-Quéré, Stefan Dercon,
Antonio Estache, Jan Willem Gunning, Ravi Kanbur, Stephan
Klasen, Simon Maxwell, Jean-Philippe Platteau, Amedeo
Spadaro
‘The correlation between GDP per
capita growth and non-income
MDGs is practically zero…’

Crecimiento y Desarrollo Humano después de 40 años (IDH 2010)

4. Growth? Insufficient.
India: strong economic growth since 1980s.
1998-9 NHFS-2: 47% children under 3 were undernourished
2005-6 NHFS-3: 46% were undernourished (wt-age)
“Growth, of course, can be very helpful in achieving development, but
this requires active public policies to ensure that the fruits of economic
growth are widely shared, and also requires – and this is very important
– making good use of the public revenue generated by fast economic
growth for social services, especially for public healthcare and public
education.” Dreze and Sen ‘Putting Growth in its Place’ Outlook. November 2011

5. So let’s use a dashboard
- to complement income poverty
- to help design growth & policy

5. A Dashboard
Dashboards… suffer because of their heterogeneity, at least in the case of very large
and eclectic ones, and most lack indications about… hierarchies amongst the
indicators used. Further, as communications instruments, one frequent criticism is
that they lack what has made GDP a success: the powerful attraction of a single
headline figure allowing simple comparisons of socioeconomic performance...
Stiglitz-Sen-Fitoussi p.63
• A dashboard does not show people’s overlaps across dimensions.
• It does not allow ‘freedom’ – voluntarily opting out.
• It does not catalyse expert, political, or public scrutiny and debate on
tradeoffs, nor encourage transparency about these.
• Measurement conclusions will be vague:
“Government says Well-being is Higher, Lower, & Unchanged”

5. A Dashboard

5. Dashboard Multiplication? 72 indicators (or even 10),
broken down by gender
by region
by ethnicity
by disability
(or even just region)

6. Associations So Dashboards may give TMI
(too much information)
Can we just choose one indicator as a
proxy of the main social deprivaitons?

Let’s look across indicators
Are they all associated? India NFHS data 2005-6
Let’s start with an easy case:
These refer to censored headcounts:
% of people who are MPI poor and are deprived in assets: 37.55%
% of people who are MPI poor and are deprived by cooking fuel: 51.11%
Are they the same people? In this case, Yes.
36.78% of people live in hh with both deprivations (Nearly 37.55%)
0.76% of people are only deprived in assets (Very Low)
14.33% of people are only deprived in cooking fuel (About 51%-37%)
48.12% of people do not experience either deprivation

Why look across indicators? India NFHS data 2005-6
Because it is not always that way!
These refer to raw headcounts*:
Percentage of people living in hh where no member has 5 yrs schooling: 18.27%
Percentage of people living in hh where a child is not attending school: 21.17%
Are they the same people? Far less than half the time.
7.41% of people live in hh with both deprivations
10.86% of people have no member with 5 years of schooling only
13.76% of people have a child who is not attending school only.
67.97% of people do not experience either deprivation. *With censored headcounts: it is 17.58% total for 5 yrs of schooling and 19.53% in children out of school; 7.41
both.

Why look across indicators? India NFHS data 2005-6
Another example:
These refer to censored headcounts:
How about mortality and 5 yrs schooling ? Surely they are highly correlated?
Percentage of people living in a hh where a child has died: 22.55%
Percentage of people living in a hh where no one has 5 yrs schooling: 17.58%
Are they mostly the same people? Less than one-third of the time.
5.75% of people live in hh with both deprivations
11.83% of people have no member with 5 years of schooling only
16.80% of people live in a hh where a child has died only.
65.63% of people do not experience either deprivation.

Why look across indicators? India NFHS data 2005-6
Child mortality vs Safe Water
Hh has not had
child mortality
Drinking water with
MDG standards +
distance Total
Non-depr Deprived
Non-depr 63.21 11.07 74.28
Deprived 21.02 4.7 25.72
84.23 15.77 100

So let’s use Venn Diagrammes?
41
Atkinson, A. B., E.
Marlier, F. Monatigne,
and A. Reinstadler
(2010) `Income
poverty and income
inequality’, in Income
and Living Conditions in
Europe, Atkinson and
Marlier (eds), Eurostat,
page 127.

Still a wee
bit difficult
with only 5
dimensions

These can be divided broadly into two types:
Marginal Measures
Measures that reflect Joint Distribution
7. Joint Distribution
So we are going to make a MD
measure. What kind shall we make?

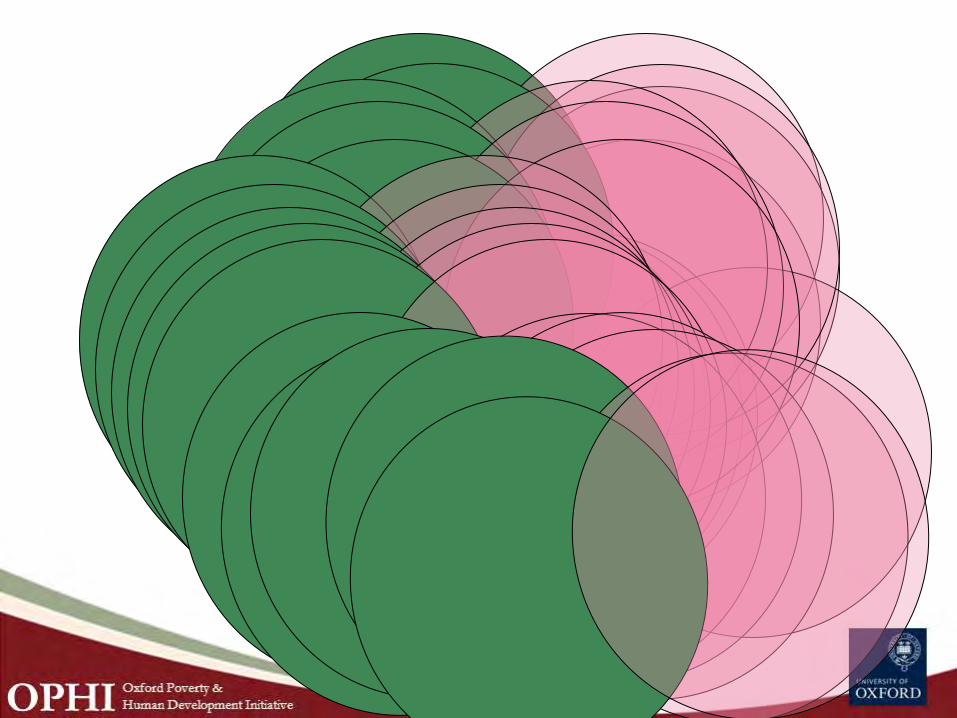
Why do Joint Distribution methods add value?
Matrix 1 Matrix 2
4
0
0
0
1111
0000
0000
0000
0 g
1
1
1
1
1000
0100
0010
0001
0 g
25.25.25.25.
25.25.25.25.

Informal Note: order of operations
Unidim. Marginal Joint D
Identify Deprivations n/a 1 1
Aggregate Across
Dimensions (‘count’) 1 3 2
Identify Who is Poor 2 n/a 3
Aggregate across
People 3 2 4
Alkire MD Pov & Discontents
Why do Joint Distribution methods add value?
Matrix 1 Matrix 2
4
0
0
0
1111
0000
0000
0000
0 g
1
1
1
1
1000
0100
0010
0001
0 g
25.25.25.25.
25.25.25.25.
Marginal Measures ONLY use
this vector to create their
measures. So according to
ANY marginal measure, the
poverty of Matrix 1 = the
poverty of Matrix 2.

1997 2000 2004 2007
Panel A. Marginal distribution: % children under 5 deprived in...
Health (1) 43.5 39.8 26.7 19.9
Nutrition (2) 74.3 62.2 61.4 58.3
Improved Sanitation (3) 72.5 68.4 79.1 58.3
Panel B. Joint distribution: % children under 5...
Deprived in at least one dimension (union) 93.3 88.6 91 82.9
Deprived in all three dimensions (intersectn) 26.6 21.1 16.3 8.6
The joint distribution tells a different story
Source: Roche (2012) based on Bangladesh Demographic Health Survey data. The example follows a similar illustration from Atkinson and Lugo (2010) reproduced in Ferreira and Lugo (2012) Note: (1) No immunized or did not received medical treatment when sick; (2) Either underweight, stunting, or wasting; (3) MDGs indicator standards.
The joint distribution provides an indication of the intensity
of deprivations that batter the poor at the same time.

8. 2010 HDR
sparked debate
• HDI: Blogs and Lets Talk
HD
• MPI: Blogs and papers
• Governments: what data?
Our voice?

MPI Media Coverage . 60+ countries - including:
– The New York Times (US)
– TIME Magazine (US)
– Xinhua (China)
– Al Jazeera (Qatar)
– The Hindu (India)
– Dawn (Pakistan)
– BBC (UK)
– The Daily Nation (Kenya)
– Agence France Presse (France)
– The Wall Street Journal (US)
– The Economist (UK)
– The Cape Times (South Africa)
– The Australian (Australia)
– The Guardian (UK)
– The Financial Times(UK)
– Radio Netherlands
− The Huffington Post (US)
− Foreign Policy (US)
− The Hindu (India)
− Christian Science Monitor (US)
− The Globe and Mail (Canada)
− The Times of India (India)

9. Political space is opening;
demand increases
• Sarkozy Commission: Stiglitz Sen Fitoussi
• National Demands for MD Pov
• National interest in Well-being & Progress

The SSF Commission’s Consensus (p 9)
“those attempting to guide the
economy and our societies are
like pilots trying to steering a
course without a reliable
compass. …
“We are almost blind when
the metrics on which action is
based are ill-designed or when
they are not well understood.
For many purposes, we need
better metrics.”

Changed environment. By 2009
• European Commission’s Communication on “GDP and Beyond: Measuring Progress in a Changing World –
• OECD Roadmap & Framework to measure progress
• Sen Stiglitz Fitoussi Commission on the Measurement of Economic Performance and Social Progress
• III OECD World Forum in Busan
• National Initiatives for multidimensional measures – WB: Bhutan, UK & Ireland, German, Italy, Spain, Korea, Japan
– Poverty: Mexico, Colombia, Chile, Bhutan, Malaysia, Egypt etc.
Demand has increased. Challenge : to deliver

Italy – Measure of Progress.
Objectives (2010-2012) of ISTAT-CNEL:
• develop a shared definition of progress for Italy by
identifying the most relevant domains;
• select a set of high-quality indicators to represent
the different domains;
• communicate the results of the process; the set of
indicators to be defined by this consultation is in
fact intended for a broad public audience as well as
for policy users.
http://www.wikiprogress.org/images//Newsletter-Issue_9-July.pdf

Canadian Index of Wellbeing (CIW)
Uses 64 separate headline indicators to characterise eight
interconnected domains central to the lives of Canadians:
Community Vitality, Democratic Engagement,
Education,
Environment,
Healthy Populations,
Leisure and Culture,
Living Standards, and
Time Use.


Bhutan
Gross
National
Happiness
Nine
Domains

ONS UK Measuring National Well-
being (Nov 2010 launched)
In his speech at the launch of the programme
the UK Prime Minister, David Cameron,
outlined his ambitions for the UK to “start
measuring our progress as a country, not
just by how our economy is growing, but
by how our lives are improving; not just
by our standard of living, but by our
quality of life."

European Commission 2009
• European Commission’s Communication on “GDP and Beyond: Measuring Progress in a Changing World • The Communication outlines an EU roadmap with five key
actions to improve our indicators of progress in ways that meet citizens’ concerns and make the most of new technical and political developments.
• The Beyond GDP initiative is about developing indicators that are as clear and appealing as GDP, but more inclusive of environmental and social aspects of progress.
• June 2011: Beyond GDP Resolution adopted by European Parliament
• www.beyond-gdp.eu

The Global Project on “Measuring the
Progress of Societies” at the OECD
• Three main streams of work: – What to measure?
– How to measure?
– Ensure that measures are used
• Build a partnership with international national
and local organisations, foundations, etc.
• Partners: WB, UNDP, UNICEF, IADB, AfDB,
EC, INTOSAI, ESCWA, ESCAP
• Associates: national and international
organisations, NGOs, universities, etc.
Slide from Enrico Giovannini

And Occupy?
• ‘People are right to be angry’. The
Economist (21 Oct 2011) noted that “There are
legitimate deep-seated grievances” – youth
unemployment being prime among them. Plus,
“The middle-aged face falling real wages…And the
elderly are seeing inflation eat away the value of
their savings; in Britain prices are rising by 5.2%
but bank deposits yield less than 1%. In the
meantime, bankers are back to huge bonuses”
61

OECD ‘How’s Life?’
http://oecdbetterlifeindex.org

63
Post 2015 discussions:
Johnson Sirleaf and Yudhoyono join
Cameron on development goals panel
Liberia's Ellen Johnson Sirleaf and Indonesia's Susilo Bambang Yudhoyono have tricky task of creating new development goals

Others An Australian National
Development Index
(ANDI)
General background paper May 2010

10. Interest in MD Poverty Ethical: “Human lives are battered and diminished in all kinds of
different ways.” Amartya Sen
Efficiency: “Acceleration in one goal often speeds up
progress in others;” to meet MDGs strategically we need
to see them together. Roadmap towards the Implementation of
the MDGs
“Achieving the MDGs will require increased attention
to those most vulnerable.” UNDP MDG Report 2010
National MD Poverty measures: being designed in many countries
to monitor change, to target, and to supplement income data.

10. Interest in AF Poverty measure 1. Birds-eye view - can be unpacked
a. by region, ethnicity, rural/urban, etc
b. by indicator, to show composition
c. by ‘intensity’ to show inequality among poor
2. Adds Value:
a. focuses on the multiply deprived
b. shows joint distribution of deprivation.
3. Incentives to reach the poorest of the poor
4. Flexible: you choose indicators/cutoffs/values
5. Robust to wide range of weights and cutoffs

In sum: why the new emphasis on measurement?
We can: Technical
1) Data are increasing
2) Methodologies are improving
We need to: Policy
3) Income poverty: important but insufficient.
4) Growth insufficient
5) Dashboards are complex
6) Associations vary
7) Joint Distribution (Marginal Measures)
We are willing to: Political
8) 2010 HD measures sparked interest and debate
9) Political critique of current metrics; exploration
10) Interest in Multidimensional Poverty