Embed Size (px)
Citation preview
Seediscussions,stats,andauthorprofilesforthispublicationat:http://www.researchgate.net/publication/274407254
Exceptionaltwentieth-centuryslowdowninAtlanticOceanoverturningcirculation
ARTICLEinNATURECLIMATECHANGE·MARCH2015
ImpactFactor:14.55·DOI:10.1038/nclimate2554
CITATIONS
5
READS
81
7AUTHORS,INCLUDING:
GeorgFeulner
PotsdamInstituteforClimateImpactRese…
86PUBLICATIONS1,810CITATIONS
SEEPROFILE
MichaelE.Mann
PennsylvaniaStateUniversity
242PUBLICATIONS13,460CITATIONS
SEEPROFILE
AlexanderRobinson
ComplutenseUniversityofMadrid
40PUBLICATIONS258CITATIONS
SEEPROFILE
Availablefrom:MichaelE.Mann
Retrievedon:01October2015
ARTICLESPUBLISHED ONLINE: 23 MARCH 2015 | DOI: 10.1038/NCLIMATE2554
Exceptional twentieth-century slowdown inAtlantic Ocean overturning circulationStefan Rahmstorf1*, Jason E. Box2, Georg Feulner1, Michael E. Mann3,4, Alexander Robinson1,5,6,Scott Rutherford7 and Erik J. Scha�ernicht1
Possible changes in Atlantic meridional overturning circulation (AMOC) provide a key source of uncertainty regarding futureclimate change. Maps of temperature trends over the twentieth century show a conspicuous region of cooling in the northernAtlantic. Here we present multiple lines of evidence suggesting that this cooling may be due to a reduction in the AMOC overthe twentieth century and particularly after 1970. Since 1990 the AMOC seems to have partly recovered. This time evolutionis consistently suggested by an AMOC index based on sea surface temperatures, by the hemispheric temperature di�erence,by coral-based proxies and by oceanic measurements. We discuss a possible contribution of the melting of the GreenlandIce Sheet to the slowdown. Using a multi-proxy temperature reconstruction for the AMOC index suggests that the AMOCweakness after 1975 is an unprecedented event in the past millennium (p>0.99). Further melting of Greenland in the comingdecades could contribute to further weakening of the AMOC.
Apersistent subpolar North Atlantic cooling anomaly is aconspicuous feature of the overall global warming pattern(Fig. 1). Model simulations indicate the largest cooling
response to a weakening of the AMOC in this same region1,suggesting this area has so far defied global warming owing to aweakening of the AMOC over the past century. The time historyof the AMOC over this period is poorly known, however, owingto the scarcity of direct measurements. Because of the large heattransport associated with the AMOC, changes in sea surfacetemperatures (SSTs) can be used as an indirect indicator of theAMOC evolution2.
Dima and Lohmann3 identified two distinct modes in globalSST evolution, one associated with a gradual decline of theglobal thermohaline circulation and one due to multidecadaland shorter AMOC variability, and concluded ‘that the globalconveyor has been weakening since the late 1930s and that theNorth Atlantic overturning cell suffered an abrupt shift around1970’. Thompson et al.4 found that the SST difference between theNorthern and Southern Hemisphere underwent a sudden declineby ∼0.5 ◦C around 1970, with the largest cooling observed overthe northern Atlantic. We interpret this as indicative of a large-scale AMOC reduction, as the most plausible explanation for sucha rapid change in the interhemispheric temperature differenceis the cross-equatorial heat transport of the AMOC (ref. 5).Drijfhout et al.6 regressed the AMOC strength and global-meantemperature on surface temperature fields in models and concludedthat the conspicuous ‘warming hole’ south of Greenland is relatedto a weakening of the AMOC. They further found that a possiblecontribution of aerosol forcing to the cool patch as proposed in ref. 7cannot be excluded.
Zhang et al.8, however, argue that the model simulation in ref. 7overestimates the effect of aerosol forcing, by not accounting for
any increase in ocean heat content in the North Atlantic overthe second half of the twentieth century, in contrast to what issuggested by the observations. The observational data show a cleardipole response in the Atlantic, with the North Atlantic coolingand the South Atlantic warming when comparing 1961–1980 with1941–1960. The maximum of South Atlantic warming is within theBenguela Current off southern Africa and the maximum of NorthAtlantic cooling is found within the Gulf Stream. These patternsare highly characteristic of AMOC changes and are found in manymodel simulations wherein the AMOC is weakened by freshwater‘hosing experiments’. The Atlantic see-saw pattern is also evidentin Fig. 1, where out of all Southern Hemisphere ocean regions theSouth Atlantic has warmed the most.
Terray9 analysed the CMIP5 model ensemble together withobserved SST data to quantify the relative contributions ofradiatively forced changes to the total decadal SST variability.Although in most models forced changes explain more than halfof the variance in low latitudes, they explain less than 10% in thesubpolar North Atlantic, where in most cases their contribution isnot significantly different from zero (the notable exception is themodel used by Booth et al. as mentioned above).
To put the twentieth-century AMOC evolution into a longer-term context, in the following we develop an AMOC index basedon surface temperatures from instrumental and proxy data.
An AMOC index based on surface temperaturesWe take the results of a climate model intercomparison1 to identifythe geographic region that is most sensitive to a reduction in theAMOC (Fig. 1), which for simplicity we henceforth refer to as‘subpolar gyre’, although we use the term here merely to describea geographic region and not an ocean circulation feature. Toisolate the effect of AMOC changes from other climate change, we
1Potsdam Institute for Climate Impact Research (PIK), Earth System Analysis, Potsdam 14473, Germany. 2Geologic Survey of Denmark and Greenland(GEUS), Østervoldgade 10, Copenhagen 1350, Denmark. 3Pennsylvania State University, Department of Meteorology, University Park, Pennsylvania 16802,USA. 4Environmental Systems Institute (EESI), University Park, Pennsylvania 16802, USA. 5Universidad Complutense de Madrid, Dpto Astrofísica y CC dela Atmósfera, Madrid 28040, Spain. 6Instituto de Geociencias, UCM-CSIC, Madrid 28040, Spain. 7Department of Environmental Science, Roger WilliamsUniversity, Bristol, Rhode Island 02809, USA. *e-mail: [email protected]
NATURE CLIMATE CHANGE | VOL 5 | MAY 2015 | www.nature.com/natureclimatechange 475
© 2015 Macmillan Publishers Limited. All rights reserved
ARTICLES NATURE CLIMATE CHANGE DOI: 10.1038/NCLIMATE2554
0.0
a
b
60
60
45
45
15
Longitude (° W)
Latit
ude (
° N)
0
30
30
−0.4−0.8 0.4 0.8 1.2 1.6 2.0 2.4Linear temperature trend (°C per century)
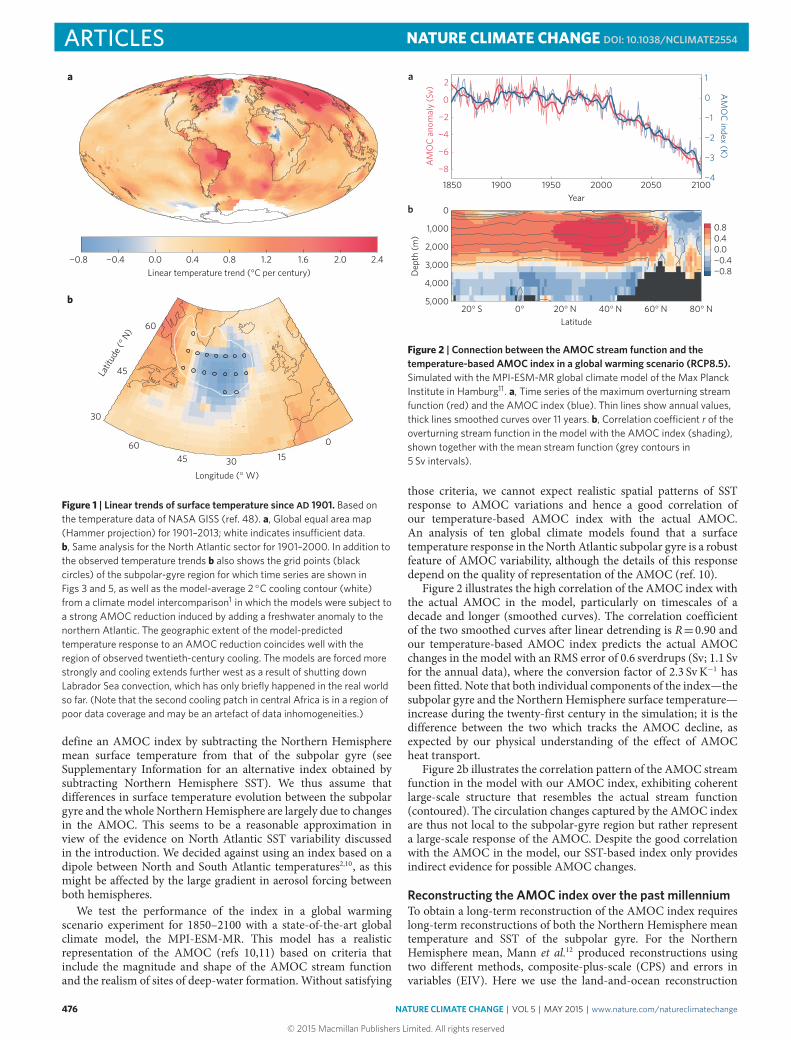
Figure 1 | Linear trends of surface temperature since AD 1901. Based onthe temperature data of NASA GISS (ref. 48). a, Global equal area map(Hammer projection) for 1901–2013; white indicates insu�cient data.b, Same analysis for the North Atlantic sector for 1901–2000. In addition tothe observed temperature trends b also shows the grid points (blackcircles) of the subpolar-gyre region for which time series are shown inFigs 3 and 5, as well as the model-average 2 ◦C cooling contour (white)from a climate model intercomparison1 in which the models were subject toa strong AMOC reduction induced by adding a freshwater anomaly to thenorthern Atlantic. The geographic extent of the model-predictedtemperature response to an AMOC reduction coincides well with theregion of observed twentieth-century cooling. The models are forced morestrongly and cooling extends further west as a result of shutting downLabrador Sea convection, which has only briefly happened in the real worldso far. (Note that the second cooling patch in central Africa is in a region ofpoor data coverage and may be an artefact of data inhomogeneities.)
define an AMOC index by subtracting the Northern Hemispheremean surface temperature from that of the subpolar gyre (seeSupplementary Information for an alternative index obtained bysubtracting Northern Hemisphere SST). We thus assume thatdifferences in surface temperature evolution between the subpolargyre and the whole Northern Hemisphere are largely due to changesin the AMOC. This seems to be a reasonable approximation inview of the evidence on North Atlantic SST variability discussedin the introduction. We decided against using an index based on adipole between North and South Atlantic temperatures2,10, as thismight be affected by the large gradient in aerosol forcing betweenboth hemispheres.
We test the performance of the index in a global warmingscenario experiment for 1850–2100 with a state-of-the-art globalclimate model, the MPI-ESM-MR. This model has a realisticrepresentation of the AMOC (refs 10,11) based on criteria thatinclude the magnitude and shape of the AMOC stream functionand the realism of sites of deep-water formation. Without satisfying
a
b
19001850 1950 2000Year
2050 2100
0
2
−2
−4
−6
−8
AM
OC
anom
aly
(Sv)
0
−1
−2
−3
−4
1A
MO
C index (K)
0° 20° N20° S
−0.8−0.40.00.40.8
40° N 60° N 80° N5,000
4,000
3,000
2,000
1,000
0
Latitude
Dep
th (m
)
Figure 2 | Connection between the AMOC stream function and thetemperature-based AMOC index in a global warming scenario (RCP8.5).Simulated with the MPI-ESM-MR global climate model of the Max PlanckInstitute in Hamburg11. a, Time series of the maximum overturning streamfunction (red) and the AMOC index (blue). Thin lines show annual values,thick lines smoothed curves over 11 years. b, Correlation coe�cient r of theoverturning stream function in the model with the AMOC index (shading),shown together with the mean stream function (grey contours in5 Sv intervals).
those criteria, we cannot expect realistic spatial patterns of SSTresponse to AMOC variations and hence a good correlation ofour temperature-based AMOC index with the actual AMOC.An analysis of ten global climate models found that a surfacetemperature response in the North Atlantic subpolar gyre is a robustfeature of AMOC variability, although the details of this responsedepend on the quality of representation of the AMOC (ref. 10).
Figure 2 illustrates the high correlation of the AMOC index withthe actual AMOC in the model, particularly on timescales of adecade and longer (smoothed curves). The correlation coefficientof the two smoothed curves after linear detrending is R=0.90 andour temperature-based AMOC index predicts the actual AMOCchanges in the model with an RMS error of 0.6 sverdrups (Sv; 1.1 Svfor the annual data), where the conversion factor of 2.3 SvK−1 hasbeen fitted. Note that both individual components of the index—thesubpolar gyre and the Northern Hemisphere surface temperature—increase during the twenty-first century in the simulation; it is thedifference between the two which tracks the AMOC decline, asexpected by our physical understanding of the effect of AMOCheat transport.
Figure 2b illustrates the correlation pattern of the AMOC streamfunction in the model with our AMOC index, exhibiting coherentlarge-scale structure that resembles the actual stream function(contoured). The circulation changes captured by the AMOC indexare thus not local to the subpolar-gyre region but rather representa large-scale response of the AMOC. Despite the good correlationwith the AMOC in the model, our SST-based index only providesindirect evidence for possible AMOC changes.
Reconstructing the AMOC index over the past millenniumTo obtain a long-term reconstruction of the AMOC index requireslong-term reconstructions of both the Northern Hemisphere meantemperature and SST of the subpolar gyre. For the NorthernHemisphere mean, Mann et al.12 produced reconstructions usingtwo different methods, composite-plus-scale (CPS) and errors invariables (EIV). Here we use the land-and-ocean reconstruction
476 NATURE CLIMATE CHANGE | VOL 5 | MAY 2015 | www.nature.com/natureclimatechange
© 2015 Macmillan Publishers Limited. All rights reserved
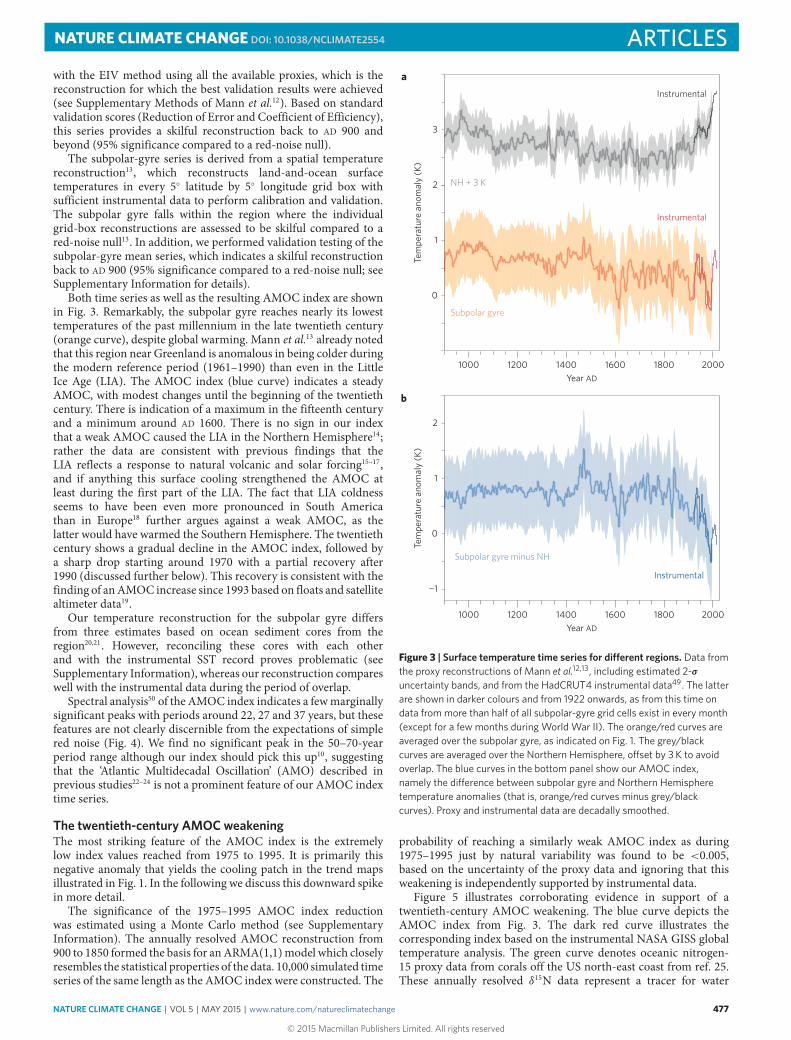
NATURE CLIMATE CHANGE DOI: 10.1038/NCLIMATE2554 ARTICLESwith the EIV method using all the available proxies, which is thereconstruction for which the best validation results were achieved(see Supplementary Methods of Mann et al.12). Based on standardvalidation scores (Reduction of Error and Coefficient of Efficiency),this series provides a skilful reconstruction back to AD 900 andbeyond (95% significance compared to a red-noise null).
The subpolar-gyre series is derived from a spatial temperaturereconstruction13, which reconstructs land-and-ocean surfacetemperatures in every 5◦ latitude by 5◦ longitude grid box withsufficient instrumental data to perform calibration and validation.The subpolar gyre falls within the region where the individualgrid-box reconstructions are assessed to be skilful compared to ared-noise null13. In addition, we performed validation testing of thesubpolar-gyre mean series, which indicates a skilful reconstructionback to AD 900 (95% significance compared to a red-noise null; seeSupplementary Information for details).
Both time series as well as the resulting AMOC index are shownin Fig. 3. Remarkably, the subpolar gyre reaches nearly its lowesttemperatures of the past millennium in the late twentieth century(orange curve), despite global warming. Mann et al.13 already notedthat this region near Greenland is anomalous in being colder duringthe modern reference period (1961–1990) than even in the LittleIce Age (LIA). The AMOC index (blue curve) indicates a steadyAMOC, with modest changes until the beginning of the twentiethcentury. There is indication of a maximum in the fifteenth centuryand a minimum around AD 1600. There is no sign in our indexthat a weak AMOC caused the LIA in the Northern Hemisphere14;rather the data are consistent with previous findings that theLIA reflects a response to natural volcanic and solar forcing15–17,and if anything this surface cooling strengthened the AMOC atleast during the first part of the LIA. The fact that LIA coldnessseems to have been even more pronounced in South Americathan in Europe18 further argues against a weak AMOC, as thelatter would have warmed the Southern Hemisphere. The twentiethcentury shows a gradual decline in the AMOC index, followed bya sharp drop starting around 1970 with a partial recovery after1990 (discussed further below). This recovery is consistent with thefinding of anAMOC increase since 1993 based on floats and satellitealtimeter data19.
Our temperature reconstruction for the subpolar gyre differsfrom three estimates based on ocean sediment cores from theregion20,21. However, reconciling these cores with each otherand with the instrumental SST record proves problematic (seeSupplementary Information), whereas our reconstruction compareswell with the instrumental data during the period of overlap.
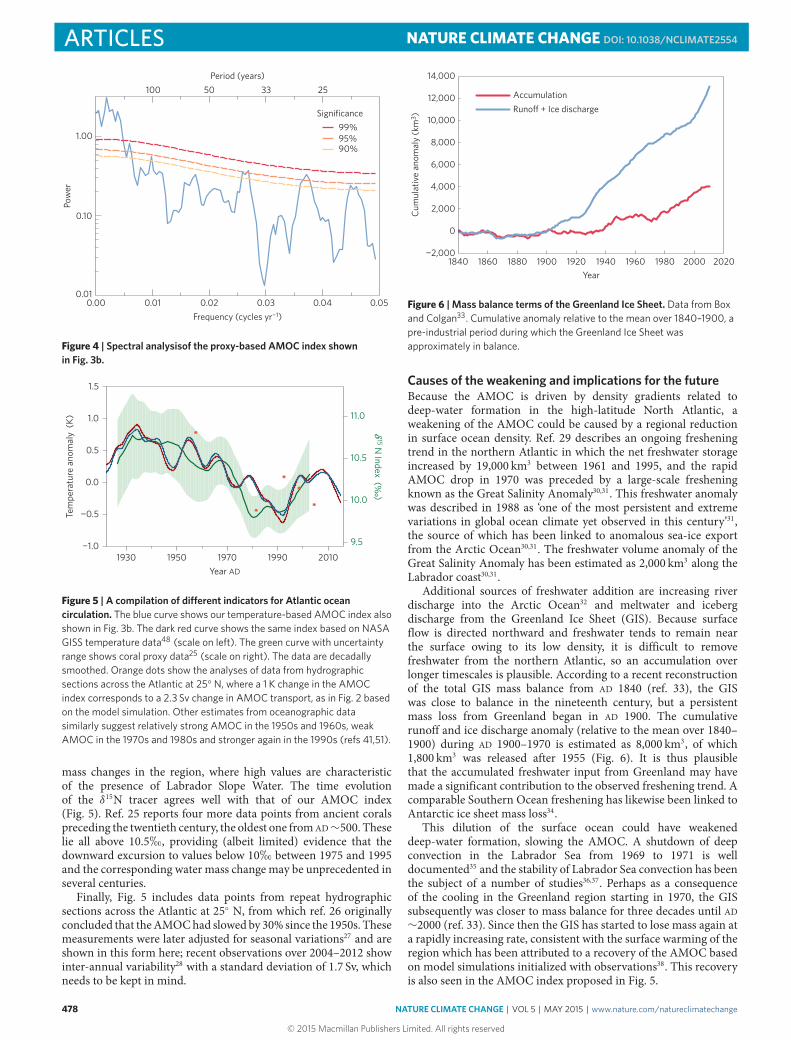
Spectral analysis50 of the AMOC index indicates a fewmarginallysignificant peaks with periods around 22, 27 and 37 years, but thesefeatures are not clearly discernible from the expectations of simplered noise (Fig. 4). We find no significant peak in the 50–70-yearperiod range although our index should pick this up10, suggestingthat the ‘Atlantic Multidecadal Oscillation’ (AMO) described inprevious studies22–24 is not a prominent feature of our AMOC indextime series.
The twentieth-century AMOC weakeningThe most striking feature of the AMOC index is the extremelylow index values reached from 1975 to 1995. It is primarily thisnegative anomaly that yields the cooling patch in the trend mapsillustrated in Fig. 1. In the following we discuss this downward spikein more detail.
The significance of the 1975–1995 AMOC index reductionwas estimated using a Monte Carlo method (see SupplementaryInformation). The annually resolved AMOC reconstruction from900 to 1850 formed the basis for anARMA(1,1)model which closelyresembles the statistical properties of the data. 10,000 simulated timeseries of the same length as the AMOC index were constructed. The
−1
0
1
2
0
a
b
1
2
3
1000 1200 1400 1600 1800 2000
Tem
pera
ture
ano
mal
y (K
)Te
mpe
ratu
re a
nom
aly
(K)
Year AD
1000 1200 1400 1600 1800 2000Year AD
NH + 3 K
Instrumental
Subpolar gyre
Instrumental
Subpolar gyre minus NH
Instrumental
Figure 3 | Surface temperature time series for di�erent regions. Data fromthe proxy reconstructions of Mann et al.12,13, including estimated 2-σuncertainty bands, and from the HadCRUT4 instrumental data49. The latterare shown in darker colours and from 1922 onwards, as from this time ondata from more than half of all subpolar-gyre grid cells exist in every month(except for a few months during World War II). The orange/red curves areaveraged over the subpolar gyre, as indicated on Fig. 1. The grey/blackcurves are averaged over the Northern Hemisphere, o�set by 3 K to avoidoverlap. The blue curves in the bottom panel show our AMOC index,namely the di�erence between subpolar gyre and Northern Hemispheretemperature anomalies (that is, orange/red curves minus grey/blackcurves). Proxy and instrumental data are decadally smoothed.
probability of reaching a similarly weak AMOC index as during1975–1995 just by natural variability was found to be <0.005,based on the uncertainty of the proxy data and ignoring that thisweakening is independently supported by instrumental data.
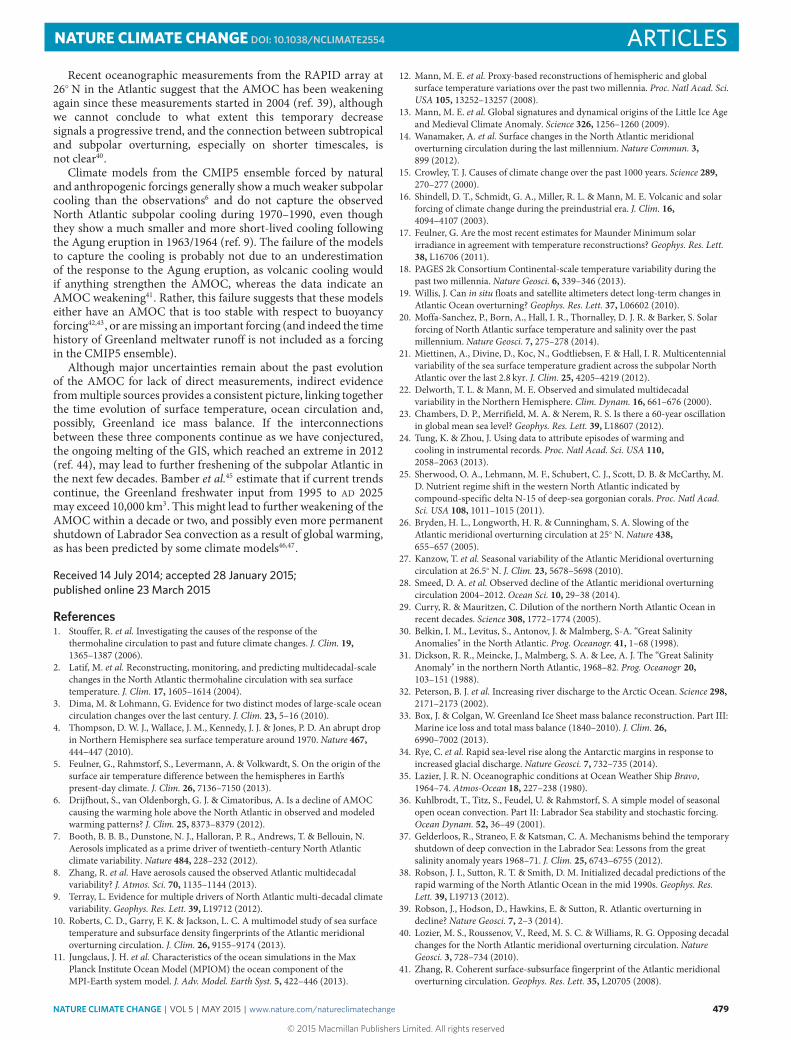
Figure 5 illustrates corroborating evidence in support of atwentieth-century AMOC weakening. The blue curve depicts theAMOC index from Fig. 3. The dark red curve illustrates thecorresponding index based on the instrumental NASA GISS globaltemperature analysis. The green curve denotes oceanic nitrogen-15 proxy data from corals off the US north-east coast from ref. 25.These annually resolved δ15N data represent a tracer for water
NATURE CLIMATE CHANGE | VOL 5 | MAY 2015 | www.nature.com/natureclimatechange 477
© 2015 Macmillan Publishers Limited. All rights reserved
ARTICLES NATURE CLIMATE CHANGE DOI: 10.1038/NCLIMATE2554
0.00 0.01 0.02 0.03Frequency (cycles yr−1)
0.04 0.05
100
1.00
Pow
er
0.10
0.01
50 33Period (years)
Significance99%95%90%
25
Figure 4 | Spectral analysisof the proxy-based AMOC index shownin Fig. 3b.
−1.0
−0.5
0.0
0.5
1.0
1.5
1930 1950 1970 1990 2010
9.5
10.0
10.5
11.0
Tem
pera
ture
ano
mal
y (K
)
Year AD
15 N Index ( )
% %δ
Figure 5 | A compilation of di�erent indicators for Atlantic oceancirculation. The blue curve shows our temperature-based AMOC index alsoshown in Fig. 3b. The dark red curve shows the same index based on NASAGISS temperature data48 (scale on left). The green curve with uncertaintyrange shows coral proxy data25 (scale on right). The data are decadallysmoothed. Orange dots show the analyses of data from hydrographicsections across the Atlantic at 25◦ N, where a 1 K change in the AMOCindex corresponds to a 2.3 Sv change in AMOC transport, as in Fig. 2 basedon the model simulation. Other estimates from oceanographic datasimilarly suggest relatively strong AMOC in the 1950s and 1960s, weakAMOC in the 1970s and 1980s and stronger again in the 1990s (refs 41,51).
mass changes in the region, where high values are characteristicof the presence of Labrador Slope Water. The time evolutionof the δ15N tracer agrees well with that of our AMOC index(Fig. 5). Ref. 25 reports four more data points from ancient coralspreceding the twentieth century, the oldest one from AD∼500. Theselie all above 10.5h, providing (albeit limited) evidence that thedownward excursion to values below 10h between 1975 and 1995and the corresponding water mass change may be unprecedented inseveral centuries.
Finally, Fig. 5 includes data points from repeat hydrographicsections across the Atlantic at 25◦ N, from which ref. 26 originallyconcluded that theAMOChad slowed by 30% since the 1950s. Thesemeasurements were later adjusted for seasonal variations27 and areshown in this form here; recent observations over 2004–2012 showinter-annual variability28 with a standard deviation of 1.7 Sv, whichneeds to be kept in mind.
1840 1860 1880 1900 1920 1940 1960 1980 2000 2020−2,000
0
2,000
4,000
6,000
8,000
10,000
12,000
14,000
Year
Cum
ulat
ive
anom
aly
(km
3 )
AccumulationRunoff + Ice discharge
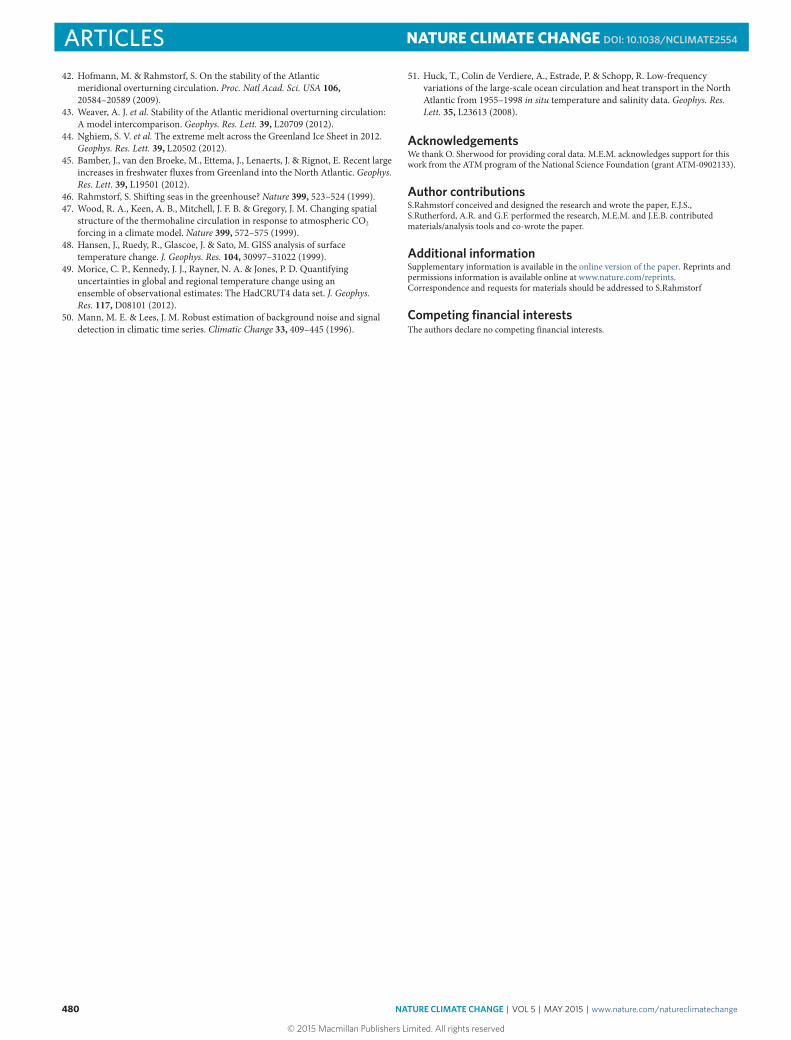
Figure 6 | Mass balance terms of the Greenland Ice Sheet. Data from Boxand Colgan33. Cumulative anomaly relative to the mean over 1840–1900, apre-industrial period during which the Greenland Ice Sheet wasapproximately in balance.
Causes of the weakening and implications for the futureBecause the AMOC is driven by density gradients related todeep-water formation in the high-latitude North Atlantic, aweakening of the AMOC could be caused by a regional reductionin surface ocean density. Ref. 29 describes an ongoing fresheningtrend in the northern Atlantic in which the net freshwater storageincreased by 19,000 km3 between 1961 and 1995, and the rapidAMOC drop in 1970 was preceded by a large-scale fresheningknown as the Great Salinity Anomaly30,31. This freshwater anomalywas described in 1988 as ‘one of the most persistent and extremevariations in global ocean climate yet observed in this century’31,the source of which has been linked to anomalous sea-ice exportfrom the Arctic Ocean30,31. The freshwater volume anomaly of theGreat Salinity Anomaly has been estimated as 2,000 km3 along theLabrador coast30,31.
Additional sources of freshwater addition are increasing riverdischarge into the Arctic Ocean32 and meltwater and icebergdischarge from the Greenland Ice Sheet (GIS). Because surfaceflow is directed northward and freshwater tends to remain nearthe surface owing to its low density, it is difficult to removefreshwater from the northern Atlantic, so an accumulation overlonger timescales is plausible. According to a recent reconstructionof the total GIS mass balance from AD 1840 (ref. 33), the GISwas close to balance in the nineteenth century, but a persistentmass loss from Greenland began in AD 1900. The cumulativerunoff and ice discharge anomaly (relative to the mean over 1840–1900) during AD 1900–1970 is estimated as 8,000 km3, of which1,800 km3 was released after 1955 (Fig. 6). It is thus plausiblethat the accumulated freshwater input from Greenland may havemade a significant contribution to the observed freshening trend. Acomparable Southern Ocean freshening has likewise been linked toAntarctic ice sheet mass loss34.
This dilution of the surface ocean could have weakeneddeep-water formation, slowing the AMOC. A shutdown of deepconvection in the Labrador Sea from 1969 to 1971 is welldocumented35 and the stability of Labrador Sea convection has beenthe subject of a number of studies36,37. Perhaps as a consequenceof the cooling in the Greenland region starting in 1970, the GISsubsequently was closer to mass balance for three decades until AD∼2000 (ref. 33). Since then the GIS has started to lose mass again ata rapidly increasing rate, consistent with the surface warming of theregion which has been attributed to a recovery of the AMOC basedon model simulations initialized with observations38. This recoveryis also seen in the AMOC index proposed in Fig. 5.
478 NATURE CLIMATE CHANGE | VOL 5 | MAY 2015 | www.nature.com/natureclimatechange
© 2015 Macmillan Publishers Limited. All rights reserved
NATURE CLIMATE CHANGE DOI: 10.1038/NCLIMATE2554 ARTICLESRecent oceanographic measurements from the RAPID array at
26◦N in the Atlantic suggest that the AMOC has been weakeningagain since these measurements started in 2004 (ref. 39), althoughwe cannot conclude to what extent this temporary decreasesignals a progressive trend, and the connection between subtropicaland subpolar overturning, especially on shorter timescales, isnot clear40.
Climate models from the CMIP5 ensemble forced by naturaland anthropogenic forcings generally show amuch weaker subpolarcooling than the observations6 and do not capture the observedNorth Atlantic subpolar cooling during 1970–1990, even thoughthey show a much smaller and more short-lived cooling followingthe Agung eruption in 1963/1964 (ref. 9). The failure of the modelsto capture the cooling is probably not due to an underestimationof the response to the Agung eruption, as volcanic cooling wouldif anything strengthen the AMOC, whereas the data indicate anAMOC weakening41. Rather, this failure suggests that these modelseither have an AMOC that is too stable with respect to buoyancyforcing42,43, or aremissing an important forcing (and indeed the timehistory of Greenland meltwater runoff is not included as a forcingin the CMIP5 ensemble).
Although major uncertainties remain about the past evolutionof the AMOC for lack of direct measurements, indirect evidencefrommultiple sources provides a consistent picture, linking togetherthe time evolution of surface temperature, ocean circulation and,possibly, Greenland ice mass balance. If the interconnectionsbetween these three components continue as we have conjectured,the ongoing melting of the GIS, which reached an extreme in 2012(ref. 44), may lead to further freshening of the subpolar Atlantic inthe next few decades. Bamber et al.45 estimate that if current trendscontinue, the Greenland freshwater input from 1995 to AD 2025may exceed 10,000 km3. This might lead to further weakening of theAMOC within a decade or two, and possibly even more permanentshutdown of Labrador Sea convection as a result of global warming,as has been predicted by some climate models46,47.
Received 14 July 2014; accepted 28 January 2015;published online 23 March 2015
References1. Stouffer, R. et al. Investigating the causes of the response of the
thermohaline circulation to past and future climate changes. J. Clim. 19,1365–1387 (2006).
2. Latif, M. et al. Reconstructing, monitoring, and predicting multidecadal-scalechanges in the North Atlantic thermohaline circulation with sea surfacetemperature. J. Clim. 17, 1605–1614 (2004).
3. Dima, M. & Lohmann, G. Evidence for two distinct modes of large-scale oceancirculation changes over the last century. J. Clim. 23, 5–16 (2010).
4. Thompson, D. W. J., Wallace, J. M., Kennedy, J. J. & Jones, P. D. An abrupt dropin Northern Hemisphere sea surface temperature around 1970. Nature 467,444–447 (2010).
5. Feulner, G., Rahmstorf, S., Levermann, A. & Volkwardt, S. On the origin of thesurface air temperature difference between the hemispheres in Earth’spresent-day climate. J. Clim. 26, 7136–7150 (2013).
6. Drijfhout, S., van Oldenborgh, G. J. & Cimatoribus, A. Is a decline of AMOCcausing the warming hole above the North Atlantic in observed and modeledwarming patterns? J. Clim. 25, 8373–8379 (2012).
7. Booth, B. B. B., Dunstone, N. J., Halloran, P. R., Andrews, T. & Bellouin, N.Aerosols implicated as a prime driver of twentieth-century North Atlanticclimate variability. Nature 484, 228–232 (2012).
8. Zhang, R. et al.Have aerosols caused the observed Atlantic multidecadalvariability? J. Atmos. Sci. 70, 1135–1144 (2013).
9. Terray, L. Evidence for multiple drivers of North Atlantic multi-decadal climatevariability. Geophys. Res. Lett. 39, L19712 (2012).
10. Roberts, C. D., Garry, F. K. & Jackson, L. C. A multimodel study of sea surfacetemperature and subsurface density fingerprints of the Atlantic meridionaloverturning circulation. J. Clim. 26, 9155–9174 (2013).
11. Jungclaus, J. H. et al. Characteristics of the ocean simulations in the MaxPlanck Institute Ocean Model (MPIOM) the ocean component of theMPI-Earth system model. J. Adv. Model. Earth Syst. 5, 422–446 (2013).
12. Mann, M. E. et al. Proxy-based reconstructions of hemispheric and globalsurface temperature variations over the past two millennia. Proc. Natl Acad. Sci.USA 105, 13252–13257 (2008).
13. Mann, M. E. et al. Global signatures and dynamical origins of the Little Ice Ageand Medieval Climate Anomaly. Science 326, 1256–1260 (2009).
14. Wanamaker, A. et al. Surface changes in the North Atlantic meridionaloverturning circulation during the last millennium. Nature Commun. 3,899 (2012).
15. Crowley, T. J. Causes of climate change over the past 1000 years. Science 289,270–277 (2000).
16. Shindell, D. T., Schmidt, G. A., Miller, R. L. & Mann, M. E. Volcanic and solarforcing of climate change during the preindustrial era. J. Clim. 16,4094–4107 (2003).
17. Feulner, G. Are the most recent estimates for Maunder Minimum solarirradiance in agreement with temperature reconstructions? Geophys. Res. Lett.38, L16706 (2011).
18. PAGES 2k Consortium Continental-scale temperature variability during thepast two millennia. Nature Geosci. 6, 339–346 (2013).
19. Willis, J. Can in situ floats and satellite altimeters detect long-term changes inAtlantic Ocean overturning? Geophys. Res. Lett. 37, L06602 (2010).
20. Moffa-Sanchez, P., Born, A., Hall, I. R., Thornalley, D. J. R. & Barker, S. Solarforcing of North Atlantic surface temperature and salinity over the pastmillennium. Nature Geosci. 7, 275–278 (2014).
21. Miettinen, A., Divine, D., Koc, N., Godtliebsen, F. & Hall, I. R. Multicentennialvariability of the sea surface temperature gradient across the subpolar NorthAtlantic over the last 2.8 kyr. J. Clim. 25, 4205–4219 (2012).
22. Delworth, T. L. & Mann, M. E. Observed and simulated multidecadalvariability in the Northern Hemisphere. Clim. Dynam. 16, 661–676 (2000).
23. Chambers, D. P., Merrifield, M. A. & Nerem, R. S. Is there a 60-year oscillationin global mean sea level? Geophys. Res. Lett. 39, L18607 (2012).
24. Tung, K. & Zhou, J. Using data to attribute episodes of warming andcooling in instrumental records. Proc. Natl Acad. Sci. USA 110,2058–2063 (2013).
25. Sherwood, O. A., Lehmann, M. F., Schubert, C. J., Scott, D. B. & McCarthy, M.D. Nutrient regime shift in the western North Atlantic indicated bycompound-specific delta N-15 of deep-sea gorgonian corals. Proc. Natl Acad.Sci. USA 108, 1011–1015 (2011).
26. Bryden, H. L., Longworth, H. R. & Cunningham, S. A. Slowing of theAtlantic meridional overturning circulation at 25◦ N. Nature 438,655–657 (2005).
27. Kanzow, T. et al. Seasonal variability of the Atlantic Meridional overturningcirculation at 26.5◦ N. J. Clim. 23, 5678–5698 (2010).
28. Smeed, D. A. et al. Observed decline of the Atlantic meridional overturningcirculation 2004–2012. Ocean Sci. 10, 29–38 (2014).
29. Curry, R. & Mauritzen, C. Dilution of the northern North Atlantic Ocean inrecent decades. Science 308, 1772–1774 (2005).
30. Belkin, I. M., Levitus, S., Antonov, J. & Malmberg, S-A. ‘‘Great SalinityAnomalies" in the North Atlantic. Prog. Oceanogr. 41, 1–68 (1998).
31. Dickson, R. R., Meincke, J., Malmberg, S. A. & Lee, A. J. The ‘‘Great SalinityAnomaly" in the northern North Atlantic, 1968–82. Prog. Oceanogr 20,103–151 (1988).
32. Peterson, B. J. et al. Increasing river discharge to the Arctic Ocean. Science 298,2171–2173 (2002).
33. Box, J. & Colgan, W. Greenland Ice Sheet mass balance reconstruction. Part III:Marine ice loss and total mass balance (1840–2010). J. Clim. 26,6990–7002 (2013).
34. Rye, C. et al. Rapid sea-level rise along the Antarctic margins in response toincreased glacial discharge. Nature Geosci. 7, 732–735 (2014).
35. Lazier, J. R. N. Oceanographic conditions at Ocean Weather Ship Bravo,1964–74. Atmos-Ocean 18, 227–238 (1980).
36. Kuhlbrodt, T., Titz, S., Feudel, U. & Rahmstorf, S. A simple model of seasonalopen ocean convection. Part II: Labrador Sea stability and stochastic forcing.Ocean Dynam. 52, 36–49 (2001).
37. Gelderloos, R., Straneo, F. & Katsman, C. A. Mechanisms behind the temporaryshutdown of deep convection in the Labrador Sea: Lessons from the greatsalinity anomaly years 1968–71. J. Clim. 25, 6743–6755 (2012).
38. Robson, J. I., Sutton, R. T. & Smith, D. M. Initialized decadal predictions of therapid warming of the North Atlantic Ocean in the mid 1990s. Geophys. Res.Lett. 39, L19713 (2012).
39. Robson, J., Hodson, D., Hawkins, E. & Sutton, R. Atlantic overturning indecline? Nature Geosci. 7, 2–3 (2014).
40. Lozier, M. S., Roussenov, V., Reed, M. S. C. &Williams, R. G. Opposing decadalchanges for the North Atlantic meridional overturning circulation. NatureGeosci. 3, 728–734 (2010).
41. Zhang, R. Coherent surface-subsurface fingerprint of the Atlantic meridionaloverturning circulation. Geophys. Res. Lett. 35, L20705 (2008).
NATURE CLIMATE CHANGE | VOL 5 | MAY 2015 | www.nature.com/natureclimatechange 479
© 2015 Macmillan Publishers Limited. All rights reserved
ARTICLES NATURE CLIMATE CHANGE DOI: 10.1038/NCLIMATE2554
42. Hofmann, M. & Rahmstorf, S. On the stability of the Atlanticmeridional overturning circulation. Proc. Natl Acad. Sci. USA 106,20584–20589 (2009).
43. Weaver, A. J. et al. Stability of the Atlantic meridional overturning circulation:A model intercomparison. Geophys. Res. Lett. 39, L20709 (2012).
44. Nghiem, S. V. et al. The extreme melt across the Greenland Ice Sheet in 2012.Geophys. Res. Lett. 39, L20502 (2012).
45. Bamber, J., van den Broeke, M., Ettema, J., Lenaerts, J. & Rignot, E. Recent largeincreases in freshwater fluxes from Greenland into the North Atlantic. Geophys.Res. Lett. 39, L19501 (2012).
46. Rahmstorf, S. Shifting seas in the greenhouse? Nature 399, 523–524 (1999).47. Wood, R. A., Keen, A. B., Mitchell, J. F. B. & Gregory, J. M. Changing spatial
structure of the thermohaline circulation in response to atmospheric CO2
forcing in a climate model. Nature 399, 572–575 (1999).48. Hansen, J., Ruedy, R., Glascoe, J. & Sato, M. GISS analysis of surface
temperature change. J. Geophys. Res. 104, 30997–31022 (1999).49. Morice, C. P., Kennedy, J. J., Rayner, N. A. & Jones, P. D. Quantifying
uncertainties in global and regional temperature change using anensemble of observational estimates: The HadCRUT4 data set. J. Geophys.Res. 117,D08101 (2012).
50. Mann, M. E. & Lees, J. M. Robust estimation of background noise and signaldetection in climatic time series. Climatic Change 33, 409–445 (1996).
51. Huck, T., Colin de Verdiere, A., Estrade, P. & Schopp, R. Low-frequencyvariations of the large-scale ocean circulation and heat transport in the NorthAtlantic from 1955–1998 in situ temperature and salinity data. Geophys. Res.Lett. 35, L23613 (2008).
AcknowledgementsWe thank O. Sherwood for providing coral data. M.E.M. acknowledges support for thiswork from the ATM program of the National Science Foundation (grant ATM-0902133).
Author contributionsS.Rahmstorf conceived and designed the research and wrote the paper, E.J.S.,S.Rutherford, A.R. and G.F. performed the research, M.E.M. and J.E.B. contributedmaterials/analysis tools and co-wrote the paper.
Additional informationSupplementary information is available in the online version of the paper. Reprints andpermissions information is available online at www.nature.com/reprints.Correspondence and requests for materials should be addressed to S.Rahmstorf
Competing financial interestsThe authors declare no competing financial interests.
480 NATURE CLIMATE CHANGE | VOL 5 | MAY 2015 | www.nature.com/natureclimatechange
© 2015 Macmillan Publishers Limited. All rights reserved