Embed Size (px)
Citation preview

eWORK and POWERPIVOT BASICS
April 2014

eWORK and POWERPIVOT BASICS CAREX Canada, April 2014 _____________________________________________________________________________________
1
This manual was prepared by: Cheryl Peters CAREX Canada In collaboration with: Alan Davies Consultant, database development Calvin Ge CAREX Canada Alison Palmer CAREX Canada
DISCLAIMER: The tools provided use Microsoft Windows-based applications and these applications were not developed by CAREX Canada. We make no warranties with respect to the tools provided. They may not work on all computers. We cannot guarantee that the same tools (i.e. PowerPivot add-on) will be freely available in the future at the websites provided.
To copy the actions shown in this manual, you will need:
1. Microsoft Excel 2010 2. PowerPivot for Microsoft 2010
Note: eWORK currently does not support Excel 2013 with PowerPivot add-in.
Please refer to our Terms of Use, which also apply to eWORK: http://www.carexcanada.ca/en/terms/ Sample citation for eWORK results: CAREX Canada, data outputs from eWORK tool [version #, date of the version]. Available from www.carexcanada.ca
For more information, contact [email protected]
Funding for this work was provided by the Canadian Partnership Against Cancer.
eWORK and POWERPIVOT BASICS CAREX Canada, April 2014 _____________________________________________________________________________________
2
BACKGROUND
CAREX Canada Occupational Estimates
The occupational exposures team at CAREX Canada produces estimates of the number of Canadians potentially exposed to known and suspected carcinogens. Where enough data exists, we also produce semi-quantitative estimates of the levels of exposure. To do this, we have drawn upon several sources of data, including census data from Statistics Canada (for the year 2006), measured levels of known and suspected carcinogens in the workplace from several provinces across the country, and information from earlier CAREX projects in Europe. A description of our approach can be found on our website at http://www.carexcanada.ca/en/occupational_approach/. In addition, there are individual pages for each of our priority carcinogens and we invite you to visit the carcinogen database at http://www.carexcanada.ca/en/profiles_and_estimates/ to view them.
What is eWORK and why did we develop it?
eWORK is essentially a home for CAREX occupational estimates data, allowing users to make customizable tables based on their needs and interests. It functions in a Microsoft Excel environment and requires a free add-on called PowerPivot. We developed eWORK as a functional tool to summarize all of our results. Our website has standard tables and graphs for each of our estimates, but many data users wanted to ask specific questions about exposure, like:
“What are the most important carcinogens in the oil and gas industry?”
“How many people are exposed to wood dust in Ontario?”
“What jobs have particularly high exposures to silica dust in Canada?”
eWORK can answer all of these questions quickly and without any help from CAREX Canada staff (and indeed we show you how to answer the first one later in this manual). We selected a Microsoft Excel-based application because of its wide usage and familiarity, and compatibility with the Microsoft SQL environment that we use internally at CAREX Canada.

eWORK and POWERPIVOT BASICS CAREX Canada, April 2014 _____________________________________________________________________________________
3
What is POWERPIVOT?
PowerPivot is a free extension to Microsoft Excel 2010. It is a data exploration tool that can integrate many different data sources, enhance data compression for quick processing times, and provide a simple and familiar Excel interface to work with. You can download PowerPivot for free here: http://www.microsoft.com/en-us/download/details.aspx?id=29074 If you have trouble installing PowerPivot, refer to the “Troubleshooting” section at the end of this manual.
Basic elements in a PowerPivot project
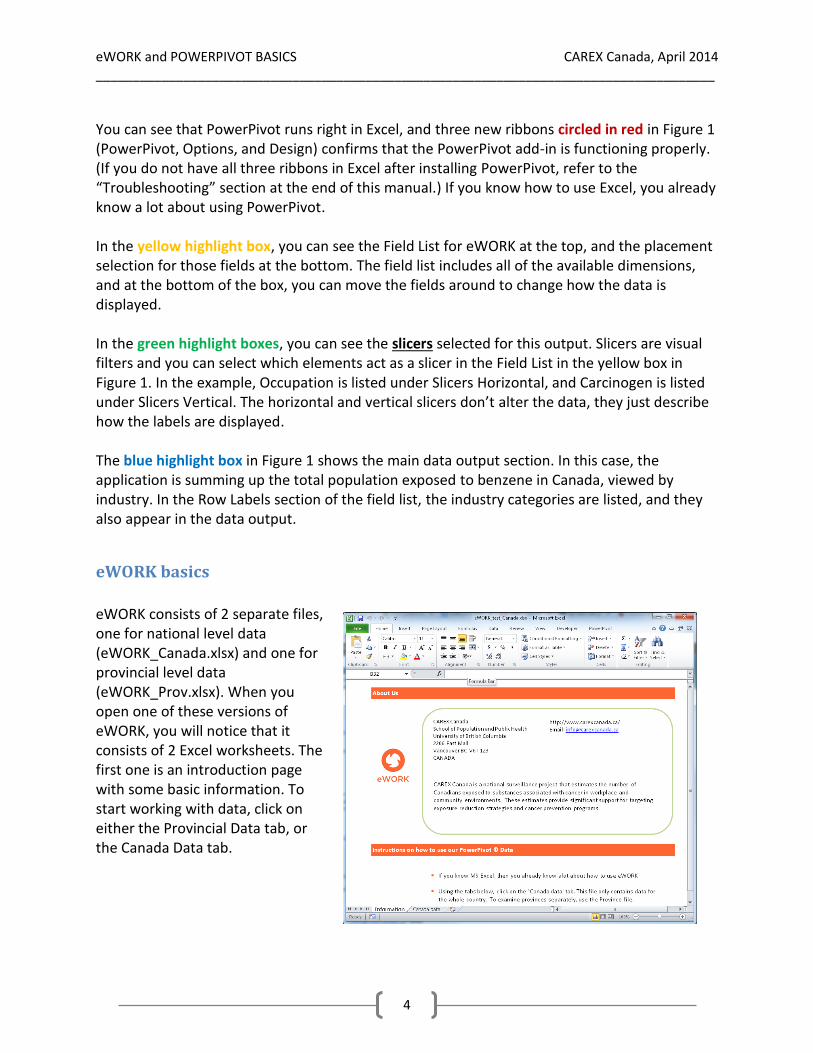
PowerPivot is an enhanced application of a pivot table. A generalized picture of what eWORK within PowerPivot looks like is shown here: Figure 1: PowerPivot screen with eWORK displayed
eWORK and POWERPIVOT BASICS CAREX Canada, April 2014 _____________________________________________________________________________________
4
You can see that PowerPivot runs right in Excel, and three new ribbons circled in red in Figure 1 (PowerPivot, Options, and Design) confirms that the PowerPivot add-in is functioning properly. (If you do not have all three ribbons in Excel after installing PowerPivot, refer to the “Troubleshooting” section at the end of this manual.) If you know how to use Excel, you already know a lot about using PowerPivot. In the yellow highlight box, you can see the Field List for eWORK at the top, and the placement selection for those fields at the bottom. The field list includes all of the available dimensions, and at the bottom of the box, you can move the fields around to change how the data is displayed. In the green highlight boxes, you can see the slicers selected for this output. Slicers are visual filters and you can select which elements act as a slicer in the Field List in the yellow box in Figure 1. In the example, Occupation is listed under Slicers Horizontal, and Carcinogen is listed under Slicers Vertical. The horizontal and vertical slicers don’t alter the data, they just describe how the labels are displayed. The blue highlight box in Figure 1 shows the main data output section. In this case, the application is summing up the total population exposed to benzene in Canada, viewed by industry. In the Row Labels section of the field list, the industry categories are listed, and they also appear in the data output.
eWORK basics
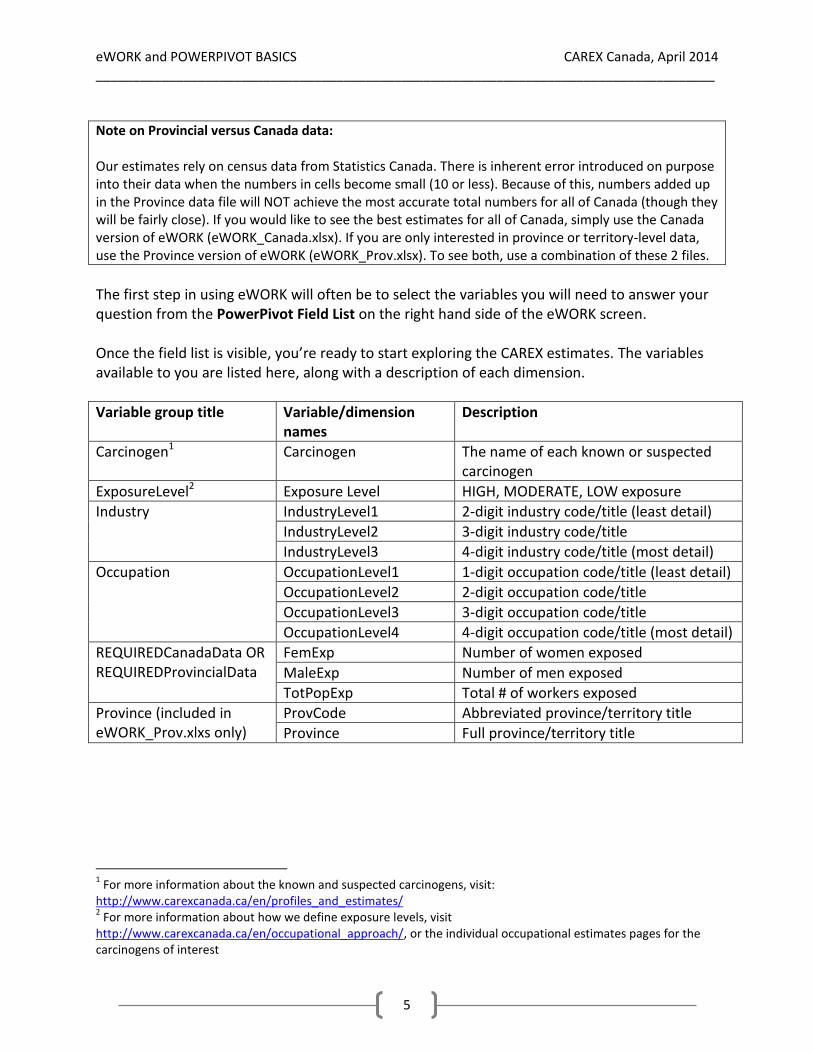
eWORK consists of 2 separate files, one for national level data (eWORK_Canada.xlsx) and one for provincial level data (eWORK_Prov.xlsx). When you open one of these versions of eWORK, you will notice that it consists of 2 Excel worksheets. The first one is an introduction page with some basic information. To start working with data, click on either the Provincial Data tab, or the Canada Data tab.
eWORK and POWERPIVOT BASICS CAREX Canada, April 2014 _____________________________________________________________________________________
5
Note on Provincial versus Canada data: Our estimates rely on census data from Statistics Canada. There is inherent error introduced on purpose into their data when the numbers in cells become small (10 or less). Because of this, numbers added up in the Province data file will NOT achieve the most accurate total numbers for all of Canada (though they will be fairly close). If you would like to see the best estimates for all of Canada, simply use the Canada version of eWORK (eWORK_Canada.xlsx). If you are only interested in province or territory-level data, use the Province version of eWORK (eWORK_Prov.xlsx). To see both, use a combination of these 2 files.
The first step in using eWORK will often be to select the variables you will need to answer your question from the PowerPivot Field List on the right hand side of the eWORK screen. Once the field list is visible, you’re ready to start exploring the CAREX estimates. The variables available to you are listed here, along with a description of each dimension.
Variable group title Variable/dimension names
Description
Carcinogen1 Carcinogen The name of each known or suspected carcinogen
ExposureLevel2 Exposure Level HIGH, MODERATE, LOW exposure
Industry IndustryLevel1 2-digit industry code/title (least detail)
IndustryLevel2 3-digit industry code/title
IndustryLevel3 4-digit industry code/title (most detail)
Occupation OccupationLevel1 1-digit occupation code/title (least detail)
OccupationLevel2 2-digit occupation code/title
OccupationLevel3 3-digit occupation code/title
OccupationLevel4 4-digit occupation code/title (most detail)
REQUIREDCanadaData OR REQUIREDProvincialData
FemExp Number of women exposed
MaleExp Number of men exposed
TotPopExp Total # of workers exposed
Province (included in eWORK_Prov.xlxs only)
ProvCode Abbreviated province/territory title
Province Full province/territory title
1 For more information about the known and suspected carcinogens, visit:
http://www.carexcanada.ca/en/profiles_and_estimates/ 2 For more information about how we define exposure levels, visit
http://www.carexcanada.ca/en/occupational_approach/, or the individual occupational estimates pages for the carcinogens of interest
eWORK and POWERPIVOT BASICS CAREX Canada, April 2014 _____________________________________________________________________________________
6
Industry and occupation (job) codes
The industry codes are from the North American Industry Classification System (NAICS 2002) and the full descriptions and activity search function can be found here: http://www.statcan.gc.ca/subjects-sujets/standard-norme/naics-scian/2002/naics-scian02l-eng.htm. The occupation codes are from the National Occupational Classification for Statistics (NOC-S 2006) and the full descriptions and task search function can be found here: http://www.statcan.gc.ca/subjects-sujets/standard-norme/soc-cnp/2006/noc2006-cnp2006-menu-eng.htm
Example In this section, we will work through an example of how to answer a typical query in eWORK. This will help you to understand how to answer your own questions about the CAREX occupational exposure estimates.
What are the most important carcinogens in the oil and gas industry? To answer this question, we should use the Canada version of eWORK, since we would like to look at Canada’s oil and gas industry as a whole. To identify the most important carcinogens in this industry, we should investigate the total number of people exposed to any of the CAREX carcinogens in a specific industry. We might also determine where there are high levels of exposure to these carcinogens. In this case then, we should make sure that the boxes in the Field List are ticked for Carcinogen, TotPopExp (total population exposed), Exposure Level, and IndustryLevel3 (the level with the greatest detail). This situation is shown in Figure 4. You can play around with how your variables are displayed at the bottom of the Field List by clicking and dragging the yellow-highlighted variables in the BOTTOM of the Field List window. You can put the variables in any of the boxes that you like, and this will change how your data is displayed. If you make a mistake, simply move the variable again. You can’t mess it up!
eWORK and POWERPIVOT BASICS CAREX Canada, April 2014 _____________________________________________________________________________________
7
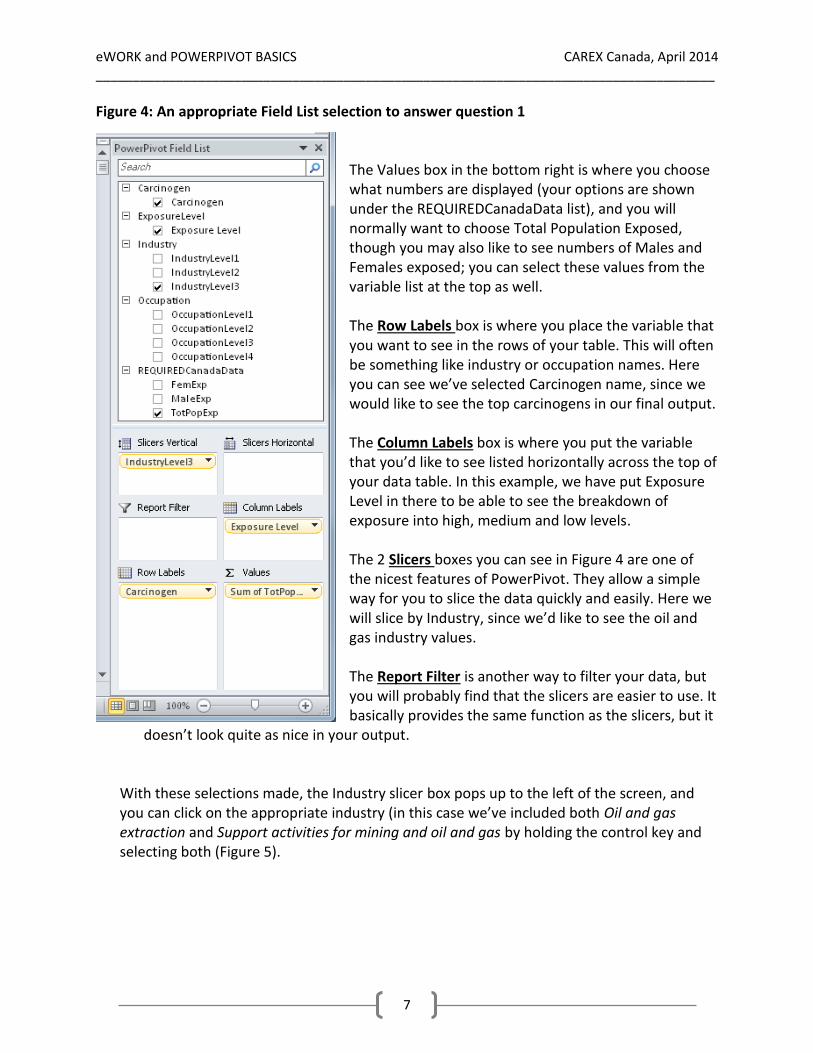
Figure 4: An appropriate Field List selection to answer question 1 The Values box in the bottom right is where you choose what numbers are displayed (your options are shown under the REQUIREDCanadaData list), and you will normally want to choose Total Population Exposed, though you may also like to see numbers of Males and Females exposed; you can select these values from the variable list at the top as well. The Row Labels box is where you place the variable that you want to see in the rows of your table. This will often be something like industry or occupation names. Here you can see we’ve selected Carcinogen name, since we would like to see the top carcinogens in our final output. The Column Labels box is where you put the variable that you’d like to see listed horizontally across the top of your data table. In this example, we have put Exposure Level in there to be able to see the breakdown of exposure into high, medium and low levels. The 2 Slicers boxes you can see in Figure 4 are one of the nicest features of PowerPivot. They allow a simple way for you to slice the data quickly and easily. Here we will slice by Industry, since we’d like to see the oil and gas industry values. The Report Filter is another way to filter your data, but you will probably find that the slicers are easier to use. It basically provides the same function as the slicers, but it
doesn’t look quite as nice in your output.
With these selections made, the Industry slicer box pops up to the left of the screen, and you can click on the appropriate industry (in this case we’ve included both Oil and gas extraction and Support activities for mining and oil and gas by holding the control key and selecting both (Figure 5).
eWORK and POWERPIVOT BASICS CAREX Canada, April 2014 _____________________________________________________________________________________
8
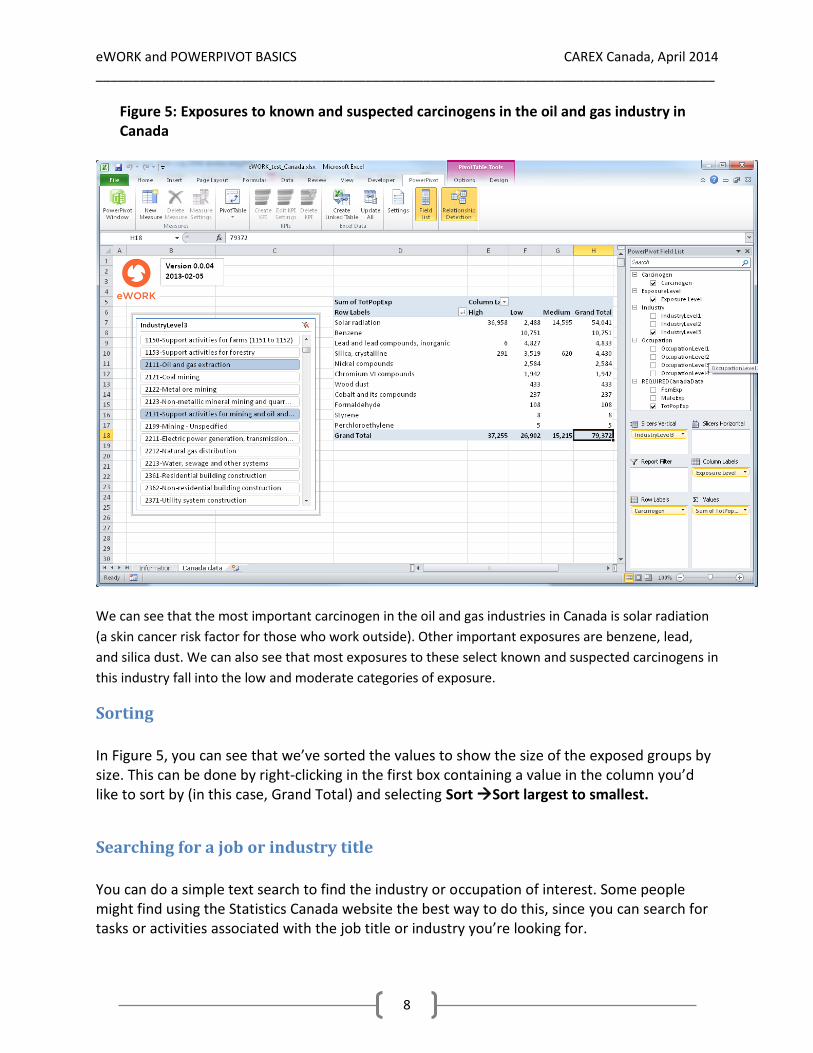
Figure 5: Exposures to known and suspected carcinogens in the oil and gas industry in Canada
We can see that the most important carcinogen in the oil and gas industries in Canada is solar radiation
(a skin cancer risk factor for those who work outside). Other important exposures are benzene, lead,
and silica dust. We can also see that most exposures to these select known and suspected carcinogens in
this industry fall into the low and moderate categories of exposure.
Sorting
In Figure 5, you can see that we’ve sorted the values to show the size of the exposed groups by size. This can be done by right-clicking in the first box containing a value in the column you’d like to sort by (in this case, Grand Total) and selecting Sort Sort largest to smallest.
Searching for a job or industry title
You can do a simple text search to find the industry or occupation of interest. Some people might find using the Statistics Canada website the best way to do this, since you can search for tasks or activities associated with the job title or industry you’re looking for.
eWORK and POWERPIVOT BASICS CAREX Canada, April 2014 _____________________________________________________________________________________
9
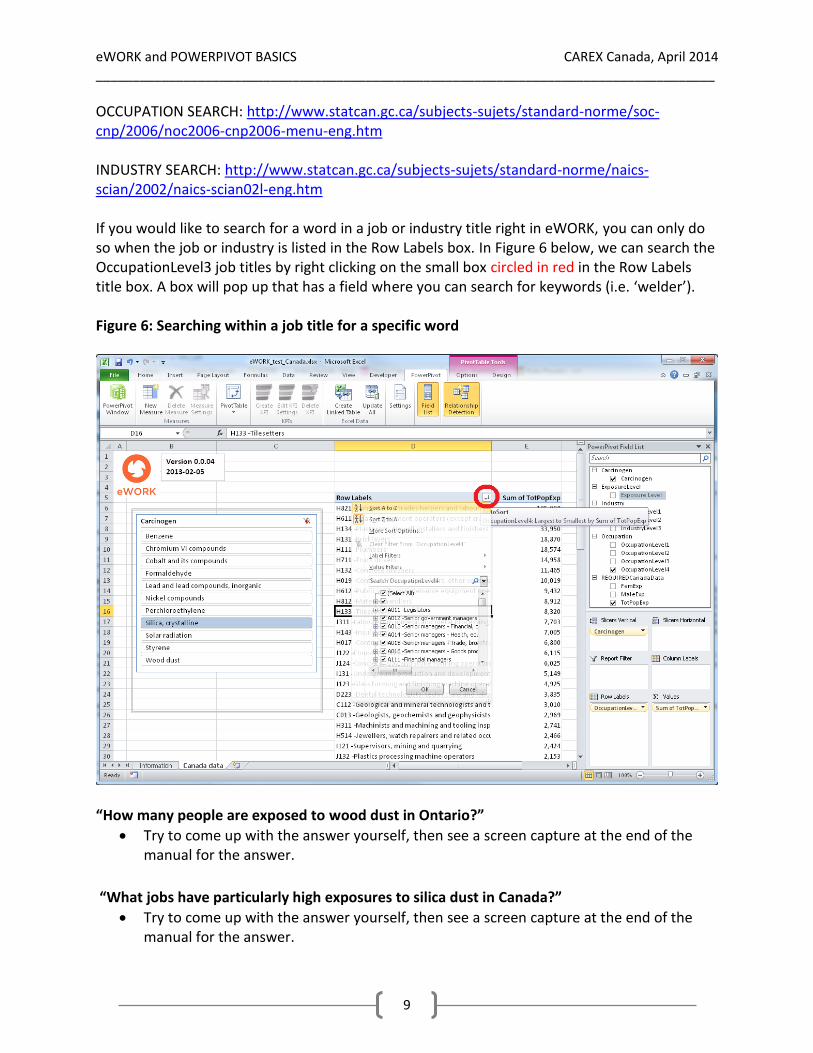
OCCUPATION SEARCH: http://www.statcan.gc.ca/subjects-sujets/standard-norme/soc-cnp/2006/noc2006-cnp2006-menu-eng.htm INDUSTRY SEARCH: http://www.statcan.gc.ca/subjects-sujets/standard-norme/naics-scian/2002/naics-scian02l-eng.htm If you would like to search for a word in a job or industry title right in eWORK, you can only do so when the job or industry is listed in the Row Labels box. In Figure 6 below, we can search the OccupationLevel3 job titles by right clicking on the small box circled in red in the Row Labels title box. A box will pop up that has a field where you can search for keywords (i.e. ‘welder’). Figure 6: Searching within a job title for a specific word
“How many people are exposed to wood dust in Ontario?” Try to come up with the answer yourself, then see a screen capture at the end of the
manual for the answer.
“What jobs have particularly high exposures to silica dust in Canada?”
Try to come up with the answer yourself, then see a screen capture at the end of the manual for the answer.

eWORK and POWERPIVOT BASICS CAREX Canada, April 2014 _____________________________________________________________________________________
10
FAQs
1. How can I remove a variable from my workspace? There are 2 ways to do this. Either unclick the checked box from the top of the PowerPivot Field List, or right click on the variable in the bottom of the field list, and check “Remove Field.”
2. Who can I contact if I have problems with eWORK? eWORK is still in beta testing mode, and we are happy to take any feedback or help you troubleshoot specific issues. Please contact [email protected].
3. How do I go about using the results I find in eWORK for a report or a presentation? You are welcome to use our results in your reports or presentations as long as you follow our Terms of Use (http://www.carexcanada.ca/en/terms/). Please cite eWORK results as follows (note that the version number appears right within the eWORK tool):
CAREX Canada, data outputs from eWORK tool [version #, date of the version]. Available from www.carexcanada.ca
4. Will this tool be updated on a regular basis? Yes. CAREX Canada is a dynamic project and we are always working on having the most current information possible. We will release updated copies of eWORK to our subscribers on a bi-yearly basis (if changes have been made).
5. How do I export a report of query results from eWORK? The easiest way to export data is to simply copy the output data table, then paste it into a new worksheet.
6. Should I save the tool when I’m finished using it? We recommend keeping a copy of eWORK that remains just as you received it from CAREX Canada. This is why we have sent it to you as a READ-ONLY file, requiring you to save a copy for your own use. That way, if you ever have trouble getting your version of eWORK to respond as you like, you can always return to the default settings. With your own working copy, you can save it if you like. If you don’t, it does not matter, and it will open just as you saw it the last time it opened.
eWORK and POWERPIVOT BASICS CAREX Canada, April 2014 _____________________________________________________________________________________
11
7. What if I can only see one carcinogen in my data table when I want to see more? This is a problem with a filter turned on in your slicer – if you had a carcinogen name selected in one of your slicers and then move it out to a row label (for example), any filters that you had turned on will remain. To fix this, simply move the Carcinogen name back into one of the Slicers, remove your filter, and move it back into the appropriate box for your use.
Troubleshooting Problem: PowerPivot cannot be installed. Double check and make sure the correct version of PowerPivot is downloaded. Your version of Microsoft Excel may either be a 64-bit or 32-bit version. A 64-bit version of Excel will need the 64-bit (x64) version of PowerPivot; a 32-bit version of Excel will need the 32-bit (x86) version of PowerPivot. To find the version of your Excel program, go to File > Help and your version will appear under “About Microsoft Excel.” Make sure you have installed both .NET Framework 4.0 (http://www.microsoft.com/en-us/download/details.aspx?displaylang=en&id=17851) and Visual Studio 2010 Tools for Office Runtime (http://www.microsoft.com/en-us/download/details.aspx?id=42513) before installing appropriate versions of PowerPivot. Problem: PowerPivot was installed correctly, but the PowerPivot ribbon is missing from the ribbon row. The horizontal and vertical slicers in the field list also do not appear. Reinstall both .NET Framework 4.0 (http://www.microsoft.com/en-us/download/details.aspx?displaylang=en&id=17851) and Visual Studio 2010 Tools for Office Runtime (http://www.microsoft.com/en-us/download/details.aspx?id=42513), then enable PowerPivot by following these steps:
1. Open Microsoft Excel, go to File > Options > Add-Ins. 2. In the Manage drop-down box, click COM Add-ins > Go. 3. Check the PowerPivot for Excel option, then click OK.
PowerPivot should display properly now in Excel 2010. Problem: The PowerPivot field list does not show up.
Try the following to make it appear:
1. Click anywhere in the Data Output Section of the screen (highlighted in blue in Figure 1).
2. If the field list still does not appear, click the Option ribbon, then click the Field List icon.
eWORK and POWERPIVOT BASICS CAREX Canada, April 2014 _____________________________________________________________________________________
12
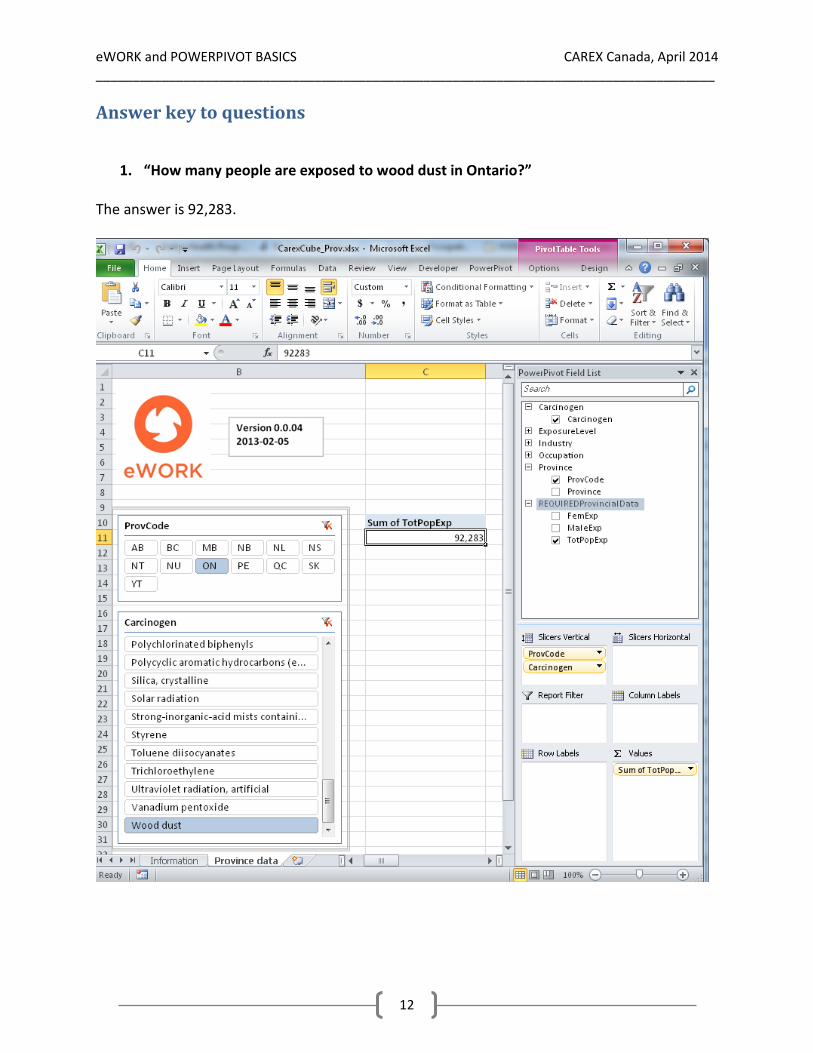
Answer key to questions
1. “How many people are exposed to wood dust in Ontario?” The answer is 92,283.
eWORK and POWERPIVOT BASICS CAREX Canada, April 2014 _____________________________________________________________________________________
13
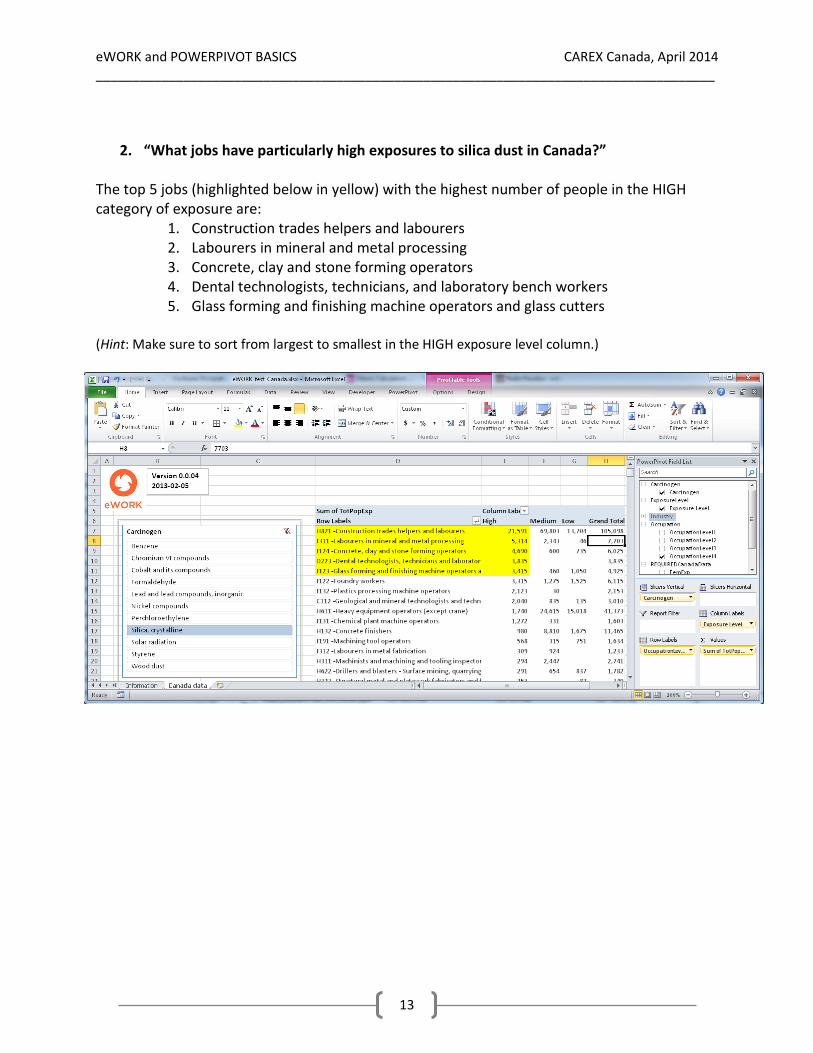
2. “What jobs have particularly high exposures to silica dust in Canada?” The top 5 jobs (highlighted below in yellow) with the highest number of people in the HIGH category of exposure are:
1. Construction trades helpers and labourers 2. Labourers in mineral and metal processing 3. Concrete, clay and stone forming operators 4. Dental technologists, technicians, and laboratory bench workers 5. Glass forming and finishing machine operators and glass cutters
(Hint: Make sure to sort from largest to smallest in the HIGH exposure level column.)

eWORK demonstration worksheet April 23, 2014
1
eWORK tool Hands-on practice
Question 1: In Canada, which three substances in eWORK beta have the HIGHEST number of exposed workers? (Hint1: This question can be answered with both eWORK Online and eWORK Excel; Hint2: For eWORK Excel, sort the table by right clicking on the top value once you have the carcinogens listed)
Substance 1: _________________________ Number of workers exposed:______________________
Substance 2: _________________________ Number of workers exposed:______________________
Substance 3: _________________________ Number of workers exposed:______________________
Question 2: What are the top 3 substances in eWORK beta for workers in the mining industries (industry code: 212 and 219) in Canada in terms number of workers exposed? (Hint: This question can be answered with
both eWORK Online and eWORK Excel.)
Substance 1: ____________________ Number of workers exposed: __________
Substance 2:____________________ Number of workers exposed: __________
Substance 3:____________________ Number of workers exposed: __________
Question 3: How many people are exposed to wood dust at work in Canada? How many are male versus female? (Hint: This question can be answered with both eWORK Online and eWORK Excel.)
Number of workers exposed to wood dust: _________________________
Number of men exposed:_____________ Number of women exposed:_________________
Note: If you aren’t able to see all of the carcinogens in your eWORK Excel data table, it might be because of a filter that was turned on previously. Fix this by dragging the Carcinogen variable to one of the slicers boxes and remove the filter by clicking the funnel icon in the top right corner of the slicer box. Now you can move the Carcinogen variable back to the Row Labels and all your values should appear.
Note: When we calculate our estimates, we do so separately for each carcinogen. As a single worker may be exposed to more than one carcinogen, it is not meaningful to add up numbers of exposed workers across carcinogens.

eWORK demonstration worksheet April 23, 2014
2
Question 4: Create a table of the number of workers exposed to crystalline silica in Canada by the broadest (least detailed) industry category. What are the top three board industries with the most workers exposed to diesel engine exhaust? (Hint: This question can only be answered with eWORK Excel.)
Industry 1: _________________________ Number of workers exposed:______________
Industry 2: _________________________ Number of workers exposed:______________
Industry 3: _________________________ Number of workers exposed:______________
Question 5: What are the top 3 detailed job titles (in terms of size of exposed group) exposed to solar radiation in Canada for men and for women separately? (Hint: This question can only be answered with
eWORK Excel.)
MEN Job #1:________________________ Job #2:________________________ Job #3:________________________
WOMEN Job #1:________________________ Job #2:________________________ Job #3:________________________
Question 6: How many different substances in eWORK beta are “welders and related machine operators” (H326) exposed to in Canada? Which substance has the most welders with HIGH exposure (and how many are there with high exposure)? (Hint: This question can be answered with both eWORK Online and eWORK Excel.
If using eWORK Excel, use OccupatioinLevel4 for the most detailed occupation descriptions).
Number of substance exposures: _________________________
Substance with most in HIGH exposure category: ______________________ Number in that category______
Note: The high numbers of workers exposed do not necessarily translate to a high level of exposure. However for solar radiation, people are flagged in the high category of exposure if they spend ≥75% of their time outside, so many of the largest jobs are also in the highest category of exposure.
Note: You can copy anything from your data table in eWORK Excel and paste it separately in your own file if you would like to create graphs or tables.

eWORK demonstration worksheet April 23, 2014
3
Question 7: For building construction industries (industry code: 236) in Canada, what are the top three occupations in terms of number of workers exposed to wood dust? Do the top three jobs remain the same when we examine exposure by number of workers with higher exposure to wood dust? (Hint: Use the lowest level occupation code here to get results for the most specific job titles)
By number of workers exposed
Job #1:________________________ Job #2:________________________ Job #3:________________________
By number of workers with higher exposure Job #1:________________________ Job #2:________________________ Job #3:________________________

eWORK demonstration worksheet April 23, 2014
1
eWORK tool Hands-on practice
Question 1: In Canada, which three substances in eWORK beta have the HIGHEST number of exposed workers? (Hint1: This question can be answered with both eWORK Online and eWORK Excel; Hint2: For eWORK Excel, sort the table by right clicking on the top value once you have the carcinogens listed)
Substance 1: __solar radiation_____ Number of workers exposed:____1,500,000_______
Substance 2: _____ silica_______ Number of workers exposed:_____382,000________
Substance 3: _____benzene______ Number of workers exposed:______374,000________
Question 2: What are the top 3 substances in eWORK beta for workers in the mining industries (industry code: 212 and 219) in Canada in terms number of workers exposed? (Hint: This question can be answered with
both eWORK Online and eWORK Excel.)
Substance 1: ___silica_____ Number of workers exposed: ___16,700___
Substance 2:______solar radiation_____ Number of workers exposed: __12,800____
Substance 3:_____nickel compounds______ Number of workers exposed: ___2,700___
Question 3: How many people are exposed to wood dust at work in Canada? How many are male versus female? (Hint: This question can be answered with both eWORK Online and eWORK Excel.)
Number of workers exposed to wood dust: 338,000
Number of men exposed:_____314,000________ Number of women exposed:_____23,800_____
Note: If you aren’t able to see all of the carcinogens in your eWORK Excel data table, it might be because of a filter that was turned on previously. Fix this by dragging the Carcinogen variable to one of the slicers boxes and remove the filter by clicking the funnel icon in the top right corner of the slicer box. Now you can move the Carcinogen variable back to the Row Labels and all your values should appear.
Note: When we calculate our estimates, we do so separately for each carcinogen. As a single worker may be exposed to more than one carcinogen, it is not meaningful to add up numbers of exposed workers across carcinogens.

eWORK demonstration worksheet April 23, 2014
2
Question 4: Create a table of the number of workers exposed to crystalline silica in Canada by the broadest (least detailed) industry category. What are the top three board industries with the most workers exposed to diesel engine exhaust? (Hint: This question can only be answered with eWORK Excel.)
Industry 1: _____construction_______ Number of workers exposed:_____236,000______
Industry 2: ____manufacturing_________ Number of workers exposed:____69,600____
Industry 3: _____mining and oil and gas extraction_____ Number of workers exposed:___21,100_____
Question 5: What are the top 3 detailed job titles (in terms of size of exposed group) exposed to solar radiation in Canada for men and for women separately? (Hint: This question can only be answered with
eWORK Excel.)
MEN Job #1: Construction trade helpers and labourers
Job #2: Farmers and farm managers Job #3:Landscaping and grounds maintenance
labourers
WOMEN Job #1: Farmers and farm managers
Job #2:General farm workers Job #3: Landscaping and grounds maintenance
labourers
Question 6: How many different substances in eWORK beta are “welders and related machine operators” (H326) exposed to in Canada? Which substance has the most welders with HIGH exposure (and how many are there with high exposure)? (Hint: This question can be answered with both eWORK Online and eWORK Excel.
If using eWORK Excel, use OccupatioinLevel4 for the most detailed occupation descriptions).
Number of substance exposures: 8
Substance with most in HIGH exposure category: lead and lead compounds
Number in that category: 4,300
Note: The high numbers of workers exposed do not necessarily translate to a high level of exposure. However for solar radiation, people are flagged in the high category of exposure if they spend ≥75% of their time outside, so many of the largest jobs are also in the highest category of exposure.
Note: You can copy anything from your data table in eWORK Excel and paste it separately in your own file if you would like to create graphs or tables.

eWORK demonstration worksheet April 23, 2014
3
Question 7: For building construction industries (industry code: 236) in Canada, what are the top three occupations in terms of number of workers exposed to wood dust? Do the top three jobs remain the same when we examine exposure by number of workers with higher exposure to wood dust? (Hint: Use the lowest level occupation code here to get results for the most specific job titles)
By number of workers exposed overall
Job #1: carpenters Job #2:contractors and supervisors, carpenters
Job #3: construction trade helpers and labourers
By number of workers with medium* exposure Job #1:carpenters
Job #2: construction trade helpers and labourers Job #3:cabinetmakers
*medium exposure category is the highest level of wood dust workers are exposed to in these industries. No workers were in the high exposure category.