Embed Size (px)
Citation preview
Plant and Soil 254: 219–227, 2003.© 2003 Kluwer Academic Publishers. Printed in the Netherlands.
219
Evolutionary implications of nucleotide sequence relatedness betweenAlnus nepalensis and Alnus glutinosa and also between correspondingFrankia microsymbionts
Rajani Varghese, Vineeta Singh Chauhan & Arvind Kumar Misra∗Molecular Genetics Laboratory, Department of Botany, North-Eastern Hill University, Shillong 793 022, India.1Corresponding author∗
Received 19 July 2002. Accepted in revised form 20 August 2002
Key words: Alnus nepalensis, Frankia, evolution, Phylogeny
Abstract
Frankia DNAs were isolated directly from root nodules of Alnus nepalensis and Alnus nitida collected from variousnatural sites in India. For comparison, a nodule sample from Alnus glutinosa was also collected from Tuebingen,Germany. Nucleotide sequence analyses of amplified 16S–23S ITS region revealed that one of the microsymbiontsfrom Alnus nepalensis was closely related to the microsymbiont from Alnus glutinosa. A similar exercise on thehost was also carried out. It was found that one sample of Alnus nepalensis was closely related to Alnus glutinosasequence from Europe. Since both Frankia and the host sequences studied revealed proximity between Alnusglutinosa and Alnus nepalensis, it is hypothesised that the common progenitor of all the alders first entered into anassociation with Frankia, and the symbiotic association has evolved since.
Introduction
Alnus, commonly known as alder, belongs to thefamily Betulaceae comprising of six genera (Alnus,Betula, Carpinus, Corylus, Ostrya and Ostrypsis)(Lawrence, 1967) and about 130 species (Chen etal., 1999). Of these six genera, only Alnus is repor-ted to symbiotically associate with the actinomyceteFrankia. Forty-seven species of Alnus have been iden-tified so far (Baker and Schwintzer, 1990) and onlytwo of them (nepalensis and nitida) are found in India.
It was hypothesised that if the progenitor of genusAlnus had entered into an association with Frankiaprior to diversification, the evolutionary pattern ofFrankia and alders should have some similarity. Thatmeans that the two species of Alnus showing closeproximity to each other should harbour closely relatedFrankia strains as well. The phylogenetic informationgenerated for alders and Frankia was therefore used todetermine if this was true.
∗ E-mail: [email protected]
Earlier investigations had shown genetic diversityin strains of Frankia isolated from nodules of Alnusnepalensis growing in India (Ganesh et al., 1994). Thepresent work was initiated to investigate the differ-ences at molecular level among some Frankia strainspresent in the nodules of Indian alders. Further, toestablish the relationship between Frankia found inIndia and that found in Europe, a comparison was alsomade between Indian frankiae with one strain presentin the nodules of Alnus glutinosa from Europe. Weisolated Frankia DNAs from field-collected nodulesand sequenced amplified ribosomal DNA sequencesto establish molecular diversity and phylogenetic re-lationship.
To reconstruct phylogenetic relationships betweenthe alder hosts, we used sequences of the 18S–28SInternally Transcribed Spacer (ITS) region, primarilybecause earlier workers had emphasised the utility ofthis region for inferring phylogenetic relationships atlower taxonomic levels (Chen et al., 1999; Savardet al., 1993). One hundred trees of Alnus nepalensiswere investigated and a lot of variability was detec-
220
ted on the basis of PCR-RFLP studies (Chauhan andMisra, 2002). Consequently, taking PCR-RFLP as amolecular criterion (Verghese and Misra, 2000) wechose three trees for the purpose of comparing withAlnus glutinosa. The 18S–28S ITS region for thesethree samples was sequenced, aligned with the se-quences of other members of Betulaceae and analysedfor phylogenetic inference.
Materials and Methods
Sample collection
Nodule samples were collected from different loca-tions listed in Table 1. Trees were randomly selectedand nodule sampling was done in three replicatesfrom each location. Each nodule cluster comprisedof more than 10 visibly active nodule lobes. With aview to include at least one other species of Alnusfor a comparative study, nodules were also collectedfrom Alnus glutinosa from Tuebingen, Germany. Allsamples were brought to the lab on ice. They werethoroughly washed with mild detergent and water, fol-lowed by several washes of double distilled water.Nodule surfaces were sterilised using H2O2 (5%) andnodules were stored at −20 ◦C.
For nucleotide sequence analysis of Frankia,samples were chosen based on the different sites andhosts. It was not possible to carry out nucleotide se-quencing of all the samples collected. Therefore, fivenodule samples, one each representing the three hosts,coupled with the different collection sites, were incor-porated. It must be noted that these sequences may notrepresent the entire range of sequences present in thesoil.
Similarly, three different samples were chosenbased on the differences in the PCR-RFLP patterns(Chauhan and Misra, 2002) and sequenced for com-parative study of Alnus nepalensis genotypes. It mustagain be noted that no claims are being made that thesethree samples represented all the different genotypesactually present in the area of collection.
Isolation of Frankia DNA from nodules
After the epidermis of the nodule lobes hadbeen peeled off in PVPP/PBS [polyvinyl pyrrol-lidone (PVPP) 3% (w/v), phosphate buffer sa-line (PBS) 100.00 mL; PBS = NaCl−0.08% (w/v),NaH2PO4−0.12% (w/v), KH2PO4−0.02% (w/v), in
water], one lobe per nodule cluster, was placed in 1.5mL micro centrifuge tube. The nodule was crushed in300 µL of extraction buffer [(Rouvier et al., 1996),100 mM Tris base, 20 mM EDTA, 1.4 M NaCl, 2%(w/v) cetyltrimethylammonium bromide (CTAB), 1%(w/v) PVPP, pH-8.0]. The resulting homogenate wasincubated at 65 ◦C for 1 h and centrifuged for 10min at 7000×g. The supernatant was first extractedwith equal volume of phenol:chloroform (1:1; v:v)and then with chloroform:isoamyl alcohol (24:1; v:v)at 13 000×g at 4 ◦C for 30 min each. DNA fromthe aqueous phase was precipitated by addition of 2volumes of ice cold ethanol followed by centrifugationat 13 000×g for 30 minutes at 4 ◦C. The pelleted DNAwas washed twice with 70% ice cold ethanol, vacuumdried, re-dissolved in 10 µL of Tris buffer (Tris base-50 mM, EDTA- 20 mM, pH- 8.0) and stored at −20◦C.
Isolation of Frankia DNA from cultures
Frankia strain ACN1AG (kindly provided by Dr Phil-ippe Normand, University of Claude Bernard, Lyon,France) was used for comparison of the nodule DNAs,both at the time of amplification reaction as posit-ive control and subsequently for nucleotide sequenceanalysis. To isolate the total genomic DNA from thisculture, the following protocol based on Simonet et al.(1985) was followed.
The cells were first washed in TE buffer to removetraces of culture medium. They were incubated in 1mL of Tris buffer, with a pinch (equivalent to approx-imately 500 units) of achromopeptidase, for 60 minat 37 ◦C. Then 10 µL of 10% (w/v) sodium dodecylsulphate (SDS) were added and the cell suspensionwas further incubated at 70 ◦C for 15 min. An equalvolume of buffer equilibrated phenol was added to thelysate and it was centrifuged at 7000×g. An equalvolume of chloroform was added to the aqueous phase.It was centrifuged for 30 min at room temperature.Two volumes of isopropyl alcohol were added to theaqueous phase and kept over night at room temperat-ure followed by centrifugation at 13 000×g for 30 min.The pellet was vacuum dried and dissolved in 10 µLof ultra pure water.
Isolation of genomic DNA from alder leaves
Young leaves were surface sterilised with 30% H2O2and thoroughly rinsed with ultra pure water. Care wastaken to avoid any leaves showing signs of fungal in-
221
Table 1. Nodule samples and sites of their collection for studies on Frankia sequences
Country Province Site Host Code
assigned
India Arunachal Pradesh Hapoli Alnus nepalensis AnpHR
Meghalaya Upper Shillong Alnus nepalensis AnpUSR
Nonkrem Hills Alnus nepalensis AnpNHR
Tamilnadu Ooty Alnus nepalensis AnpOR
Himachal Pradesh Kulu Alnus nitida AntKR
Germany Tuebingen Alnus glutinosa AgTR
fection. Two leaves were crushed in 1 ml of warmextraction buffer [1 M Tris HCl, 1.4 M NaCl, 0.5 MEDTA, 2% (w/v) CTAB and 3% (w/v) PVPP, pH 8.0].The macerate was filtered through cotton into a 1.5mL micro-centrifuge tube and centrifuged for 5 minat 8000×g at room temperature. The supernatant wasdiscarded and the pellet re-suspended in 300 µL ofthe extraction buffer. Ten µL of 20% (w/v) SDS wereadded, gently mixed and the homogenate incubated ina water bath at 65 ◦C for 1 h. It was then centrifuged at12 000×g for 15 min. The supernatant was transferredto a fresh tube and extracted with equal volume ofchloroform:isoamyl alcohol (24:1;v:v). After centrifu-gation at 12 000×g for 15 min, the aqueous phase wastransferred to a fresh tube and 30 µL of 3 M sodiumacetate (pH 5.2) and 1.2 mL of ice cold ethanol wereadded to precipitate the DNA. The DNA was pelletedby centrifugation at 13 000×g for 30 min at 4 ◦C. Thepellet was washed 2–3 times, with ice cold 70% eth-anol and vacuum dried. DNA was dissolved in 10 µLof ultra pure water and stored at −20 ◦C for furtheruse. Two µL of the isolated DNA from each samplewas tested for purity by agarose gel electrophoresis.
Amplification of Frankia DNA
Amplification reactions were carried out for two DNAregions, partial 16S rDNA and 16S–23S rDNA ITS.Amplification was performed using primers FGPS989ac (Table 2, Bosco et al., 1992) and FGPS 1509’(Table 2, Navarro et al., 1992) for the partial 16SrDNA region, and primers FGPS 989ac and FGPL2054′ (Table 2, Simonet et al., 1991) for the 16S–23S rDNA ITS region. Primer FGPS989ac is specificto Frankia compatible to genera Alnus or Casuarina(Bosco et al., 1992), therefore, the amplification ofhost plastid DNA was not likely. DNA isolated fromthe strain ACN1AG was used as positive control.
Table 2. Oligonucleotide primers used for amplification andnucleotide sequencing of Frankia and Alnus DNAs.
Primers Sequence
Frankia
FGPS989ac 5′GGGGTCCGTAAGGGTC3′FGPS1509′ 5′AAGGAGGGGATCCAGCCGCA3′FGPL2054′ 5′CCGGGTTTCCCCATTCGG3′M13F 5′GATGGATATCTTGGTTC3′M13R 5′CAGGAAACAGCTATGAC3′RFRITF3 5′CCGTCACGTCACGAAAGTCG3′RFRITR2 5′GCTCGCGTCCACTGTGCAG3′
Alnus
ITS1-PLANT 5′CGCGAGAAGTCCACTG3′ITSC26A 5′GTTTCTTTTCCTCCGCT3′
Amplification was carried out in a total volume of25 µL per tube. Each reaction mixture contained 3µL of each primer (5 pM), 2.5 µL of 10×PCR buf-fer (Bangalore Genei, India), 2.5 µL of each dNTP(1.25 mM), 0.3 µL of Taq polymerase (5 units/µL,Bangalore Genei, India) and 1 µL of template DNA.Amplification was carried out for 35 cycles. Eachcycle comprised of 1 minute of denaturation at 94 ◦C,1 min of annealing at 53 ◦C for partial 16S rDNA and49 ◦C for the ITS regions respectively, and 1 min ofelongation at 72 ◦C. The PCR products were checkedby electrophoresis using 0.8% agarose gel.
Amplification of Alnus DNA
The 18S–28S ITS region was amplified using univer-sal primers ITS1-PLANT (Table 2, Normand, personalcommunication) and ITSC26A (Table 2, Wen and Zi-mmer, 1996). PCR amplifications were performed in
222
a 25 µL mix containing 2.5 µL of each of the primersfrom a 0.5 mM stock, 2.5 µL of 10×PCR buffer, 2.5µL of the dNTP mix (1.25 mM) and 0.3 µL of TaqPolymerase (5 units/µL). One µL of the appropriatesample DNA was added to each tube just before start-ing the PCR run. The remaining volume was made upwith ultra pure water. A negative control without thetemplate DNA was also included in each PCR reac-tion. Each amplification reaction was run for 35 cyclesand each cycle comprised of 30 s of denaturation at 94◦C, 30 s of annealing at 45 ◦C and 30 s of elongationat 72 ◦C. This was followed by an extension time of 3min at 72 ◦C at the end of the run.
Sequencing of Frankia amplicons
Only five representative samples, representing dif-ferent sites from India, were randomly selected forsequencing (see the section on sampling). One samplewas sequenced as a representative of the microsym-biont found in Alnus glutinosa. Before sequencing,the PCR products were purified using QIAquick PCRpurification kit (Qiagen GmbH, Germany). An M13cloning vector was used for sequencing the 16S–23S rRNA ITS and the sequencing was carried outby the dideoxy chain termination technique (Sangeret al., 1977) using T7 sequencing kit (Pharmacia).The primers used for sequencing studies are listed inTable 2.
Sequencing of Alnus amplicons
Three samples representing different PCR-RFLP pro-files were selected for phylogenetic analysis (see thesection on sampling). For this, after agarose gel elec-trophoresis, the band of interest was excised out andpurified using the protocol of Byrnes et al. (1995).These samples were then sequenced commercially byM/s Bangalore Genei, India, using an automated DNAsequencer that used fluorescent label dye terminat-ors or fluorescent label primers. The primers used forsequencing were the same used for amplification ofDNA (Table 2). Each primer was used singly in asequencing cycle.
Nucleotide sequence analysis of Frankia amplicons
The nucleotide sequence of each sample was enteredinto the computer program DNASIS (version 7.0).The sequences (Table 3) retrieved from the GenBankdatabase using BLAST search were aligned with the
studied sequences using multiple sequence alignmentprogram CLUSTAL W (version 1.74; Thomson etal., 1994). The software PHYLIP (version 3.5c; Fel-senstein, 1993) was used for inferring phylogeneticrelationships. DNADIST was used to calculate evol-utionary distance with Kimura 2 parameter ratio of2. The NEIGHBOR JOINING method reconstruc-ted phylogenetic trees from the evolutionary distancedata. Parsimony trees were reconstructed with DNA-PARS. The reliability of the clustering pattern ob-tained in the trees drawn was assessed by 100 boot-strap replicates. The trees were re-done using online(http://bioweb.pasteur.fr/seqanal/phylogeny/phylip-uk.html) latest version of Phylip and were downloadedtoo from Phylip’ s home page, http://evolution.genetics.washington.edu/phylip.html. They were recheckedwith other online tools for phylogenetic analysisincluding GeneBee: Molecular biological serverhttp://www.genebee.msu.su/index.html.
Nucleotide sequence analysis of Alnus amplicons
Alnus sequences were used for the Blast search ofthe GenBank. The sequences used for phylogeneticanalysis are listed in Table 4. The sequences thatwere retrieved from the GenBank and our sequenceswere then aligned together using the multiple se-quence alignment program CLUSTAL W (version1.75, Thomson et al., 1994). Neighbour Joiningtrees were constructed using the program PHYLO-DENDRON (version 0.8d beta, Gilbert, 1999). 1000bootstrap replicates were considered. The programDNADIST of the PHYLIP (version 3.5c; Felsenstein,1993) inference package was used to calculate evol-utionary distances with Kimura-2-parameter having atransition/transversion ratio of 2.0. Parsimony analysiswas carried out using the program DNAPARS of thesame inference package. To be confident of the parsi-mony trees constructed, 500 bootstrap replicates wereconsidered.
Results and Discussion
Sequence analyses
The numbers of samples presented here is small buthave been collected from their natural habitat repres-enting different geographic locations, and hence canbe considered as representative of different sites. Al-though they may not represent the entire range of
223
Table 3. Sequences of bacterial strains and nodule microsymbionts used for the 16SrDNA phylogenetic analysis
Sequence/Host Accession Source/Reference
Number
AnpHR/Alnus nepalensis AJ404866 Present study
AnpNHR/Alnus nepalensis AJ404867 Present study
AnpOR/Alnus nepalensis AJ404868 Present study
AnpUSR/Alnus nepalensis AJ404869 Present study
AntKR/Alnus nitida AJ404870 Present study
AgTR/Alnus glutinosa AJ404871 Present study
ACN1AG/Alnus sp. - Present study
Rugosa/Alnus rugosa L40956 Normand et al., 1996
Dryas/Dryas drummondii L40616 Normand et al., 1996
Myrica/Myrica nagi L40622 Normand et al., 1996
DARJN/Alnus nepalensis U60284 Misra and Normand, 1997∗AVN17S/Alnus sp. L40613 Normand et al., 1996
ArgP5/Alnus rugosa L40612 Normand et al., 1996
ACN14a/Alnus crispa M88466 Johnson, 1992∗ORS020606/Casuarina sp. M58598 Normand et al., 1992
HR27-14/Hippophae rhamnoides L40617 Normand et al., 1996
SCN10a/Shepherdia canandensis L40619 Normand et al., 1996
PtI1/Purshia tridentata L41048 Normand et al., 1996
M.ratis/Mycobacterium ratisbonense AF055331 Reischl et al., 1998∗
∗Sequences are direct submissions to the GenBank and are available at the sitehttp://www.ncbi.nlm.nih.gov.
Table 4. Sequences of 18S-28S ITS region used for phylogenetic analysis of Betulaceae
Genus & species Accession Number Source/Reference
Alnus nepalensis (S.1) - Present study
Alnus nepalensis (S.2) - Present study
Alnus nepalensis (S.3) - Present study
Alnus matsumurae - Normand (Personal Communication)
Alnus glutinosa AF081529 Chen et al., 1999
Alnus incana X68138 Savard et al., 1993
Alnus crispa X68137 Savard et al., 1993
Alnus maritima X68135 Savard et al., 1993
Betula glandulosa X68134 Savard et al. ,1993
Betula pendula AJ006445 Leskinen E, 1999∗Carpinus hupeana AF081521 Chen et al., 1999
Carpinus turczaninowii AF081518 Chen et al., 1999
Corylus chinensis AF081520 Chen et al., 1999
Corylus heterophylla AF081519 Chen et al., 1999
∗Sequences are direct submissions to the GenBank and are available at the sitehttp://www.ncbi.nlm.nih.gov.
224
Frankia strains present in the soil, they do take intoconsideration at least one sample each from the threedifferent species of Alnus mentioned above. The nuc-leotide sequences for the six samples studied havebeen submitted to the EMBL Nucleotide SequenceDatabase. The accession numbers assigned are listedin Table 3. Sequence analysis of partial 16S and 23SrRNA genes (520 bases at 3′ end of 16S rRNA geneand 132 bases at 5′ end of 23S rRNA gene) fromthe analysed samples confirmed the conserved natureof the ribosomal RNA gene for these samples fromFrankia nodulating the three Alnus species. However,when compared with the Frankia strain ORS020606(retrieved from GenBank, Table 3), differences werefound for 16S rRNA gene and 23S rRNA gene. The3′ end of 16S rDNA is the most conserved part of thegene.
Sequence analyses of the 16S–23S rDNA ITSregion revealed variations, with one exception (An-pUSR). The ITS sequence analyses gave only fourgenotypes for the seven samples analysed. All thesamples, except AnpUSR, analysed from Alnusnepalensis (AnpOR, AnpNHR and AnpHR) groupedtogether with Frankia isolate ACN1AG. All thesesamples had similar sequences and exhibited 102 ntdifferences compared to ACN1AG strain used as ref-erence. It may be pertinent to mention that the highernumber of differences observed were due to the pres-ence of more variable ITS region in the amplifiedfragment. In contrast to this, the 16S rDNA analysisshowed differences that only differentiated AnpNHR(2 nt) and ACN1AG (1 nt) samples.
AnpUSR and AgTR showed 100% sequence sim-ilarity for the analysed region of 16S rDNA, althoughthey were obtained from two different Alnus species.However, for these samples, differences were found inthe ITS region (76 nt). Besides this, two differenceswere also seen in 23S rDNA. Further, AntKR sample,obtained from Alnus nitida, showed differences forbases both in the coding and the non-coding regions.The 16S–23S rRNA ITS of this sample showed a longstretch of inserted nucleotides (15 nt).
Sequencing of the Alnus nepalensis sample withprimer ITS1-PLANT gave sequence information ofabout 130–140 bp including the distal region of the18S rRNA gene and part of ITS I. While the sizeof the PCR product was approximately 750 bp, thesequence obtained was only about 130 bp. It waslikely that the enzyme stuttered and failed to proceedfurther due to the presence of several GC residuesaround 130 bp. We, therefore, used the reverse primer
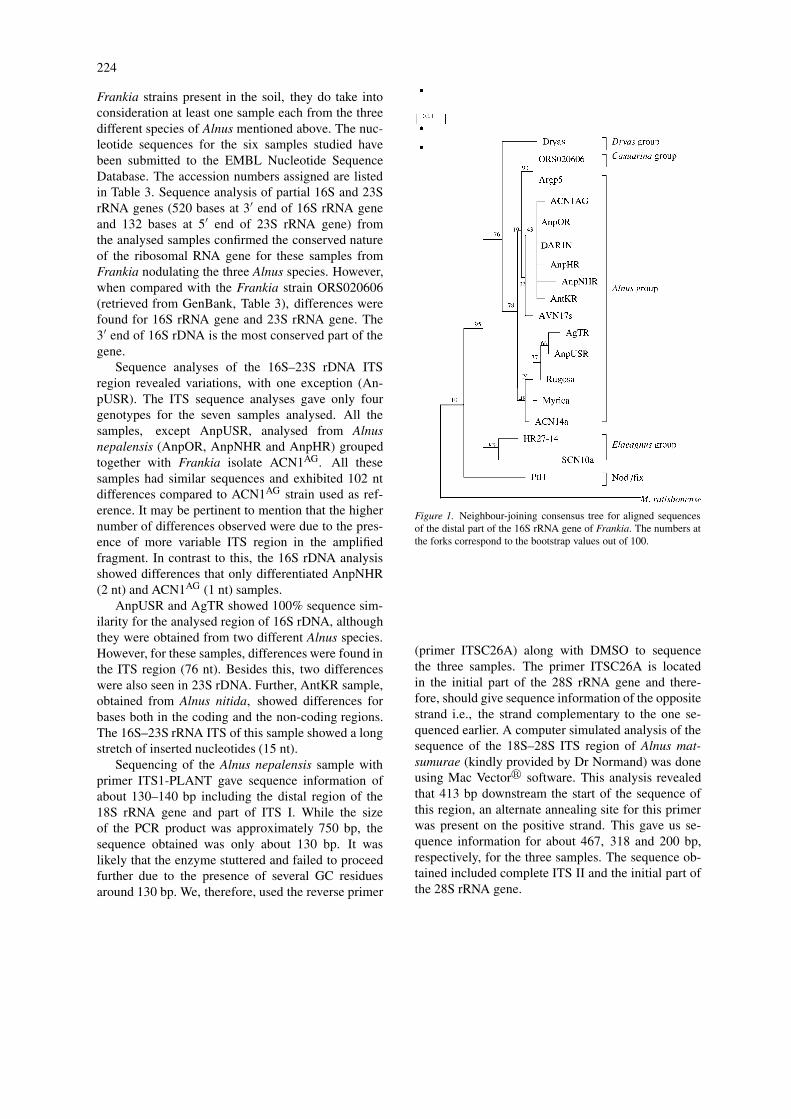
Figure 1. Neighbour-joining consensus tree for aligned sequencesof the distal part of the 16S rRNA gene of Frankia. The numbers atthe forks correspond to the bootstrap values out of 100.
(primer ITSC26A) along with DMSO to sequencethe three samples. The primer ITSC26A is locatedin the initial part of the 28S rRNA gene and there-fore, should give sequence information of the oppositestrand i.e., the strand complementary to the one se-quenced earlier. A computer simulated analysis of thesequence of the 18S–28S ITS region of Alnus mat-sumurae (kindly provided by Dr Normand) was doneusing Mac Vector� software. This analysis revealedthat 413 bp downstream the start of the sequence ofthis region, an alternate annealing site for this primerwas present on the positive strand. This gave us se-quence information for about 467, 318 and 200 bp,respectively, for the three samples. The sequence ob-tained included complete ITS II and the initial part ofthe 28S rRNA gene.
225
Phylogenetic inferences for the microsymbiont
The phylogenetic analyses of the microsymbionts andrelated organisms based on the partial 16S-rDNAsequences were conducted using neighbour-joiningand parsimony analyses. The trees obtained via bothneighbour-joining (Figure 1) and DNA parsimony(tree not presented here) analyses, showed similar to-pology, clustering together of strain/microsymbiontsfrom Alnus species (Betulaceae) with those fromCasuarina sp. (Casuarinaceae) and Myrica sp. (Myr-icaceae). The topology of the tree obtained was sim-ilar to those deduced by Normand et al. (1996) andClawson et al. (1998).
The distant relationship of the AnpUSR with othernodule samples studied from India was clearly re-flected in its rDNA sequence. In the trees drawn,it clustered together with AgTR as close neighbourfollowed by Myrica, Rugosa and ACN14a. TheSCN10a and HR27-14 strains from the Elaeagnusgroup formed a separate cluster of their own. Thisagrees with the inference made by Nazaret et al.(1991) who showed the close relationship of Casu-arina strains with the Alnus infectivity group. Theyalso found that the Alnus infectivity and the Casuarinainfective groups had greater distance from Elaeagnusinfectivity group. Further, nod−/fix− PtI1 strain wasplaced distantly in the tree (Figure 1).
The sequence information of the ITS gave a gen-eral view of relationship between the Frankia nod-ule microsymbionts studied. The obtained sequenceswere aligned with the corresponding sequence ofORS020606, a Casuarina infective strain. The mostvariable region of 450 bases incorporating the 420bases of the ITS, was taken for the comparative se-quence analysis. The samples studied joined the Alnusinfective group. Both neighbour-joining and parsi-mony (trees not presented here) analyses showed thatthe nearest neighbour for the nodule microsymbiontAnpUSR was AgTR.
Thus, the microsymbiont from nodules collectedfrom Upper Shillong, clustered away from the othernodule samples analysed from the same host (Alnusnepalensis). The evolutionary separation of AnpUSRfrom the other samples was reflected in the PCR-RFLPpattern (data not presented here) that was confirmed byrDNA sequence analysis. This is in accordance withthe observation made by Ganesh et al. (1994) whosuggested the possibility of existence of genetically di-verse Frankia strains in this region. It is surprising thatthe microsymbiont AnpUSR showed close relation-
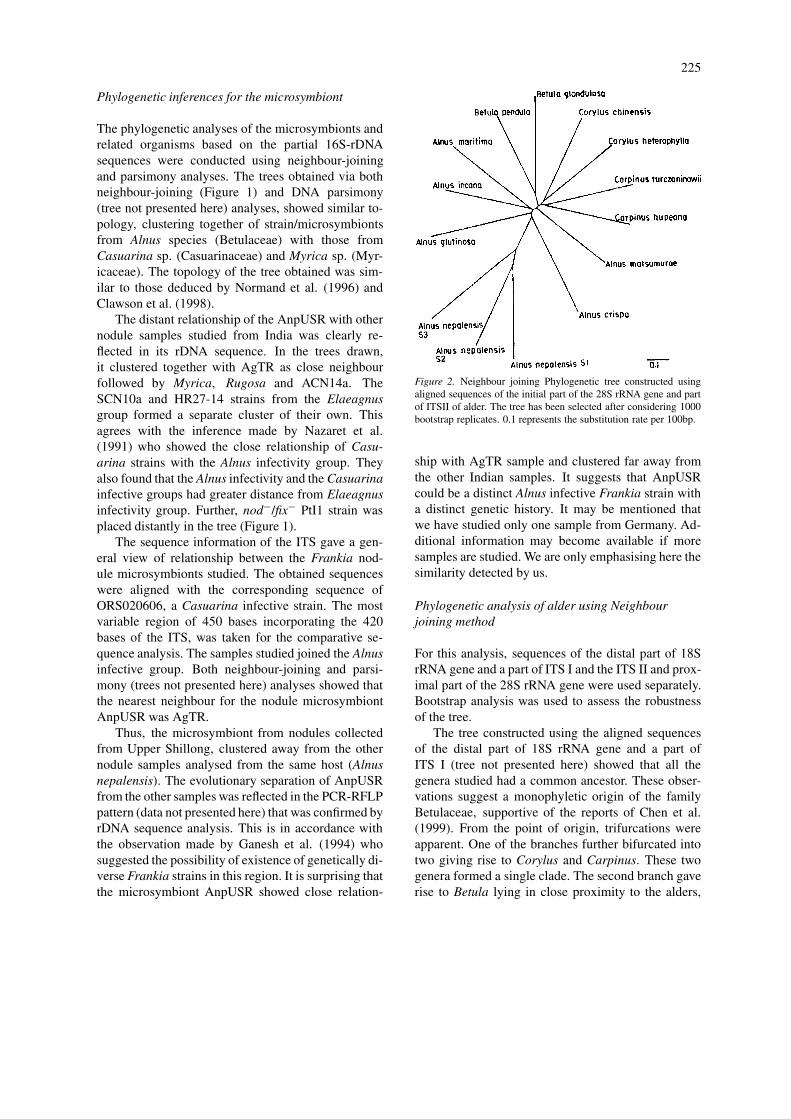
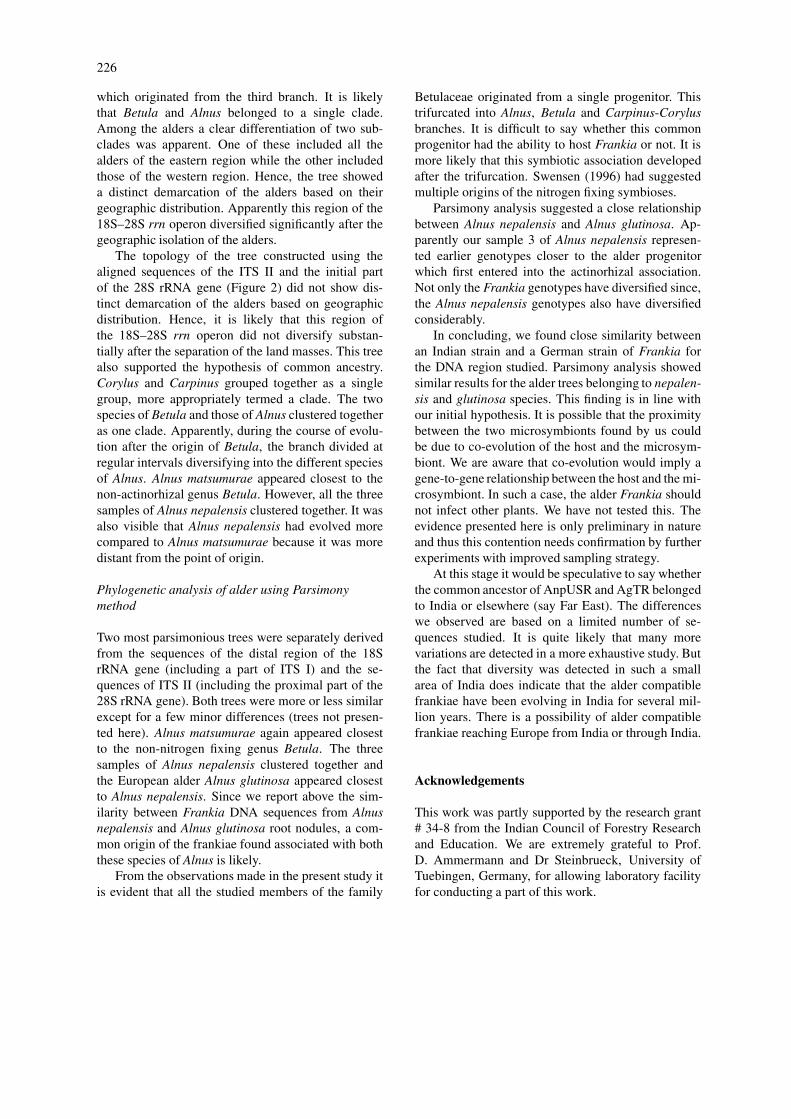
Figure 2. Neighbour joining Phylogenetic tree constructed usingaligned sequences of the initial part of the 28S rRNA gene and partof ITSII of alder. The tree has been selected after considering 1000bootstrap replicates. 0.1 represents the substitution rate per 100bp.
ship with AgTR sample and clustered far away fromthe other Indian samples. It suggests that AnpUSRcould be a distinct Alnus infective Frankia strain witha distinct genetic history. It may be mentioned thatwe have studied only one sample from Germany. Ad-ditional information may become available if moresamples are studied. We are only emphasising here thesimilarity detected by us.
Phylogenetic analysis of alder using Neighbourjoining method
For this analysis, sequences of the distal part of 18SrRNA gene and a part of ITS I and the ITS II and prox-imal part of the 28S rRNA gene were used separately.Bootstrap analysis was used to assess the robustnessof the tree.
The tree constructed using the aligned sequencesof the distal part of 18S rRNA gene and a part ofITS I (tree not presented here) showed that all thegenera studied had a common ancestor. These obser-vations suggest a monophyletic origin of the familyBetulaceae, supportive of the reports of Chen et al.(1999). From the point of origin, trifurcations wereapparent. One of the branches further bifurcated intotwo giving rise to Corylus and Carpinus. These twogenera formed a single clade. The second branch gaverise to Betula lying in close proximity to the alders,
226
which originated from the third branch. It is likelythat Betula and Alnus belonged to a single clade.Among the alders a clear differentiation of two sub-clades was apparent. One of these included all thealders of the eastern region while the other includedthose of the western region. Hence, the tree showeda distinct demarcation of the alders based on theirgeographic distribution. Apparently this region of the18S–28S rrn operon diversified significantly after thegeographic isolation of the alders.
The topology of the tree constructed using thealigned sequences of the ITS II and the initial partof the 28S rRNA gene (Figure 2) did not show dis-tinct demarcation of the alders based on geographicdistribution. Hence, it is likely that this region ofthe 18S–28S rrn operon did not diversify substan-tially after the separation of the land masses. This treealso supported the hypothesis of common ancestry.Corylus and Carpinus grouped together as a singlegroup, more appropriately termed a clade. The twospecies of Betula and those of Alnus clustered togetheras one clade. Apparently, during the course of evolu-tion after the origin of Betula, the branch divided atregular intervals diversifying into the different speciesof Alnus. Alnus matsumurae appeared closest to thenon-actinorhizal genus Betula. However, all the threesamples of Alnus nepalensis clustered together. It wasalso visible that Alnus nepalensis had evolved morecompared to Alnus matsumurae because it was moredistant from the point of origin.
Phylogenetic analysis of alder using Parsimonymethod
Two most parsimonious trees were separately derivedfrom the sequences of the distal region of the 18SrRNA gene (including a part of ITS I) and the se-quences of ITS II (including the proximal part of the28S rRNA gene). Both trees were more or less similarexcept for a few minor differences (trees not presen-ted here). Alnus matsumurae again appeared closestto the non-nitrogen fixing genus Betula. The threesamples of Alnus nepalensis clustered together andthe European alder Alnus glutinosa appeared closestto Alnus nepalensis. Since we report above the sim-ilarity between Frankia DNA sequences from Alnusnepalensis and Alnus glutinosa root nodules, a com-mon origin of the frankiae found associated with boththese species of Alnus is likely.
From the observations made in the present study itis evident that all the studied members of the family
Betulaceae originated from a single progenitor. Thistrifurcated into Alnus, Betula and Carpinus-Corylusbranches. It is difficult to say whether this commonprogenitor had the ability to host Frankia or not. It ismore likely that this symbiotic association developedafter the trifurcation. Swensen (1996) had suggestedmultiple origins of the nitrogen fixing symbioses.
Parsimony analysis suggested a close relationshipbetween Alnus nepalensis and Alnus glutinosa. Ap-parently our sample 3 of Alnus nepalensis represen-ted earlier genotypes closer to the alder progenitorwhich first entered into the actinorhizal association.Not only the Frankia genotypes have diversified since,the Alnus nepalensis genotypes also have diversifiedconsiderably.
In concluding, we found close similarity betweenan Indian strain and a German strain of Frankia forthe DNA region studied. Parsimony analysis showedsimilar results for the alder trees belonging to nepalen-sis and glutinosa species. This finding is in line withour initial hypothesis. It is possible that the proximitybetween the two microsymbionts found by us couldbe due to co-evolution of the host and the microsym-biont. We are aware that co-evolution would imply agene-to-gene relationship between the host and the mi-crosymbiont. In such a case, the alder Frankia shouldnot infect other plants. We have not tested this. Theevidence presented here is only preliminary in natureand thus this contention needs confirmation by furtherexperiments with improved sampling strategy.
At this stage it would be speculative to say whetherthe common ancestor of AnpUSR and AgTR belongedto India or elsewhere (say Far East). The differenceswe observed are based on a limited number of se-quences studied. It is quite likely that many morevariations are detected in a more exhaustive study. Butthe fact that diversity was detected in such a smallarea of India does indicate that the alder compatiblefrankiae have been evolving in India for several mil-lion years. There is a possibility of alder compatiblefrankiae reaching Europe from India or through India.
Acknowledgements
This work was partly supported by the research grant# 34-8 from the Indian Council of Forestry Researchand Education. We are extremely grateful to Prof.D. Ammermann and Dr Steinbrueck, University ofTuebingen, Germany, for allowing laboratory facilityfor conducting a part of this work.
227
References
Baker D D and Schwintzer C R 1990 Introduction. In The Biologyof Frankia and Actinorhizal plants. Eds. C R Schwintzer and J DTjepkema. pp. 1–13. Academic Press, California, USA.
Bosco M, Fernandez M P, Simonet P, Materassi R and NormandP 1992 Evidence that some Frankia sp. strains are able to crossboundaries between Alnus and Elaeagnus host specificity groups.Appl. Environ. Microbiol. 58, 1569–1576.
Byrnes L, Enenkel B, Gannon F and Smith T 1995 Preparation ofDNA for use as probes. In Gene Probes 1: A Practical Approach.Eds. B D Hames and S J Higgins. pp. 17–55. IRL Press. Oxford.UK.
Chauhan V S and Misra, A K 2002 Development of molecular mark-ers for screening Alnus nepalensis (D. Don) genotypes for thenitrogenase activity of the actinorhizal root nodules. Mol. Genet.Genomics 267, 303–312.
Chen Z-D, Manchester S R and Sun H Y 1999 Phylogeny andevolution of the Betulaceae as inferred from DNA sequences,morphology and paleobotany. Am. J. Bot. 86 (8), 1168–1181.
Clawson M L, Caru M and Benson D R 1998 Diversity of Frankiastrains in root nodules of plants from the families Elaeagnaceaeand Rhamnaceae. Appl. Environ. Microbiol. 64, 3539–3543.
Felsenstein J 1993 PHYLIP (Phylogeny Inference Package) Ver-sion 3.5c. Distributed by the author. Department of Ge-netics, University of Washington, Seattle, USA (Site:http://bioweb.pasteur.fr/seqanal/phylogeny/phylip-uk.html).
Ganesh G, Misra A K, Chapelon C and Normand P 1994 Mor-phological and molecular characterisation of Frankia sp. isolatefrom nodules of Alnus nepalensis. Don. Arch. Microbiol. 161,152–155.
Gilbert D G 1999 PHYLODENDRON version 0.8d beta.Biology Department, Indiana University, USA (Site:http://www.es.embnet.org/Doc/phylodendron/clustalform.html).
Lawrence G H M 1967 Taxonomy of vascular plants. Oxford andIBH Publ. Co., New Delhi. India.
Navarro E, Simonet P, Normand P and Bardin R 1992 Characterisa-tion of natural populations of Nitrobacter spp. using PCR-RFLPanalysis of the ribosomal intergenic spacer. Arch. Microbiol.157, 107–115.
Nazaret S, Cournoyer B, Normand P and Simonet P 1991 Phylo-genetic relationships among Frankia genome species determinedby use of amplified 16S rDNA sequences. J. Bacteriol. 173,4072–4078.
Normand P, Orso S, Cournoyer B, Jeannin P, Chapelon C, DawsonJ, Evtushenko L and Misra A K 1996 Molecular phylogeny of thegenus Frankia and related genera and emendation of the familyFrankiaceae. Intl. J. Syst. Bacteriol. 46, 1–9.
Rouvier C, Prin Y, Reddel P, Normand P and Simonet P 1996 Ge-netic diversity among Frankia strains nodulating members of thefamily Casuarinaceae in Australia revealed by PCR and restric-tion fragment length polymorphism analysis with crushed rootnodules. Appl. Environ. Microbiol. 62, 979–985.
Sanger F, Nicklen S and Coulson A R 1977 DNA sequencing withchain termination inhibitors. Proc. Natl. Acad. Sci. USA 74,5463–5467.
Savard L, Michaud M and Bousquet J 1993 Genetic diversity andphylogenetic relationships between birches and alders using ITS,18S rRNA, and rbcL gene sequences. Mol. Phylogenet. Evol. 2(2), 112–118.
Simonet P, Normand P, Moiroud A and Lalonde M 1985 Restrictionenzyme digestion patterns of Frankia plasmids. Plant Soil 87,49–60.
Simonet P, Grosjean M-C, Misra A K, Nazaret S, CournoyerB and Normand P 1991 Frankia genus specific characterisa-tion by polymerase chain reaction. Appl. Env. Microbiol. 57,3278–3286.
Swensen S M 1996 The evolution of actinorhizal symbiosis: Evid-ence for multiple origins of the symbiotic association. Am. J.Bot. 83 (11), 1503–1512.
Thomson J D, Higgins D G and Gibson T J 1994 CLUSTAL W:Improving the sensitivity of progressive multiple sequence align-ment through sequence weighting position specific gap penaltiesand weight matrix choice. Nucleic Acid Res. 22, 4673–4680.
Verghese S K and Misra A K 2000 PCR-RFLP based screeningof Frankia genotypes in alder nodules having different levels ofnitrogenase activity. Symbiosis 28, 337–350.
Wen J and Zimmer E A 1996 Phylogeny and biogeography of PanaxL. (the Ginseng Genus, Araliaceae): Inferences from ITS se-quences of nuclear ribosomal DNA. Mol. Phylogenet. Evol. 6(2), 167–177.