Embed Size (px)
Citation preview
ARTICLE
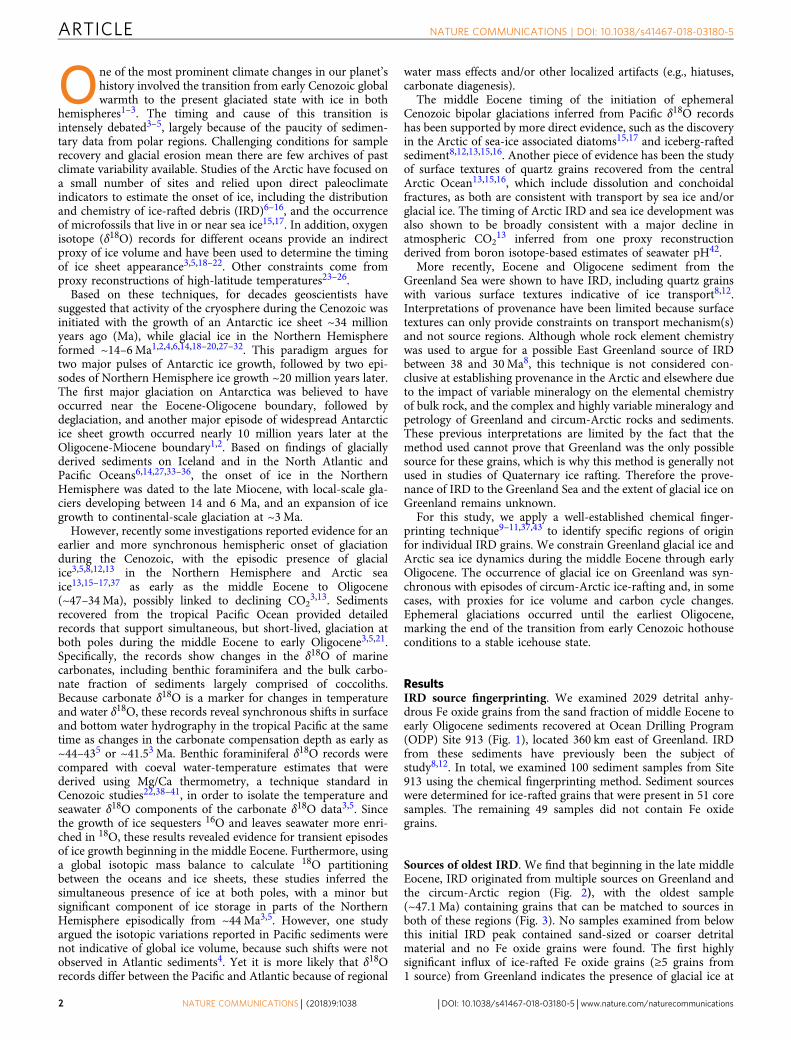
Evidence for ephemeral middle Eocene to earlyOligocene Greenland glacial ice and pan-Arcticsea iceAradhna Tripati1,2 & Dennis Darby3
Earth’s modern climate is defined by the presence of ice at both poles, but that ice is now
disappearing. Therefore understanding the origin and causes of polar ice stability is more
critical than ever. Here we provide novel geochemical data that constrain past dynamics of
glacial ice on Greenland and Arctic sea ice. Based on accurate source determinations of
individual ice-rafted Fe-oxide grains, we find evidence for episodic glaciation of distinct
source regions on Greenland as far-ranging as ~68°N and ~80°N synchronous with ice-rafting
from circum-Arctic sources, beginning in the middle Eocene. Glacial intervals broadly coin-
cide with reduced CO2, with a potential threshold for glacial ice stability near ~500 p.p.m.v.
The middle Eocene represents the Cenozoic onset of a dynamic cryosphere, with ice in both
hemispheres during transient glacials and substantial regional climate heterogeneity. A more
stable cryosphere developed at the Eocene-Oligocene transition, and is now threatened by
anthropogenic emissions.
DOI: 10.1038/s41467-018-03180-5 OPEN
1 Department of Earth, Planetary, and Space Sciences, Department of Atmospheric and Oceanic Sciences, Institute of the Environment and Sustainability,Institute of Geophysics and Planetary Physics, California Nanosystems Institute, University of California, Los Angeles, CA 90095, USA. 2 European Institute ofMarine Sciences (IUEM), Université de Brest, UMR 6538, Domaines Océaniques, Rue Dumont D’Urville, and IFREMER, 29280 Plouzané, France.3 Department of Ocean, Earth, and Atmospheric Sciences, Old Dominion University, Norfolk, VA 23529, USA. These authors contributed equally: AradhnaTripati, Dennis Darby. Correspondence and requests for materials should be addressed to A.T. (email: [email protected])or to D.D. (email: [email protected])
NATURE COMMUNICATIONS | (2018) 9:1038 | DOI: 10.1038/s41467-018-03180-5 | www.nature.com/naturecommunications 1
1234
5678
90():,;
One of the most prominent climate changes in our planet’shistory involved the transition from early Cenozoic globalwarmth to the present glaciated state with ice in both
hemispheres1–3. The timing and cause of this transition isintensely debated3–5, largely because of the paucity of sedimen-tary data from polar regions. Challenging conditions for samplerecovery and glacial erosion mean there are few archives of pastclimate variability available. Studies of the Arctic have focused ona small number of sites and relied upon direct paleoclimateindicators to estimate the onset of ice, including the distributionand chemistry of ice-rafted debris (IRD)6–16, and the occurrenceof microfossils that live in or near sea ice15,17. In addition, oxygenisotope (δ18O) records for different oceans provide an indirectproxy of ice volume and have been used to determine the timingof ice sheet appearance3,5,18–22. Other constraints come fromproxy reconstructions of high-latitude temperatures23–26.
Based on these techniques, for decades geoscientists havesuggested that activity of the cryosphere during the Cenozoic wasinitiated with the growth of an Antarctic ice sheet ~34 millionyears ago (Ma), while glacial ice in the Northern Hemisphereformed ~14–6Ma1,2,4,6,14,18–20,27–32. This paradigm argues fortwo major pulses of Antarctic ice growth, followed by two epi-sodes of Northern Hemisphere ice growth ~20 million years later.The first major glaciation on Antarctica was believed to haveoccurred near the Eocene-Oligocene boundary, followed bydeglaciation, and another major episode of widespread Antarcticice sheet growth occurred nearly 10 million years later at theOligocene-Miocene boundary1,2. Based on findings of glaciallyderived sediments on Iceland and in the North Atlantic andPacific Oceans6,14,27,33–36, the onset of ice in the NorthernHemisphere was dated to the late Miocene, with local-scale gla-ciers developing between 14 and 6 Ma, and an expansion of icegrowth to continental-scale glaciation at ~3Ma.
However, recently some investigations reported evidence for anearlier and more synchronous hemispheric onset of glaciationduring the Cenozoic, with the episodic presence of glacialice3,5,8,12,13 in the Northern Hemisphere and Arctic seaice13,15–17,37 as early as the middle Eocene to Oligocene(~47–34Ma), possibly linked to declining CO2
3,13. Sedimentsrecovered from the tropical Pacific Ocean provided detailedrecords that support simultaneous, but short-lived, glaciation atboth poles during the middle Eocene to early Oligocene3,5,21.Specifically, the records show changes in the δ18O of marinecarbonates, including benthic foraminifera and the bulk carbo-nate fraction of sediments largely comprised of coccoliths.Because carbonate δ18O is a marker for changes in temperatureand water δ18O, these records reveal synchronous shifts in surfaceand bottom water hydrography in the tropical Pacific at the sametime as changes in the carbonate compensation depth as early as~44–435 or ~41.53 Ma. Benthic foraminiferal δ18O records werecompared with coeval water-temperature estimates that werederived using Mg/Ca thermometry, a technique standard inCenozoic studies22,38–41, in order to isolate the temperature andseawater δ18O components of the carbonate δ18O data3,5. Sincethe growth of ice sequesters 16O and leaves seawater more enri-ched in 18O, these results revealed evidence for transient episodesof ice growth beginning in the middle Eocene. Furthermore, usinga global isotopic mass balance to calculate 18O partitioningbetween the oceans and ice sheets, these studies inferred thesimultaneous presence of ice at both poles, with a minor butsignificant component of ice storage in parts of the NorthernHemisphere episodically from ~44Ma3,5. However, one studyargued the isotopic variations reported in Pacific sediments werenot indicative of global ice volume, because such shifts were notobserved in Atlantic sediments4. Yet it is more likely that δ18Orecords differ between the Pacific and Atlantic because of regional
water mass effects and/or other localized artifacts (e.g., hiatuses,carbonate diagenesis).
The middle Eocene timing of the initiation of ephemeralCenozoic bipolar glaciations inferred from Pacific δ18O recordshas been supported by more direct evidence, such as the discoveryin the Arctic of sea-ice associated diatoms15,17 and iceberg-raftedsediment8,12,13,15,16. Another piece of evidence has been the studyof surface textures of quartz grains recovered from the centralArctic Ocean13,15,16, which include dissolution and conchoidalfractures, as both are consistent with transport by sea ice and/orglacial ice. The timing of Arctic IRD and sea ice development wasalso shown to be broadly consistent with a major decline inatmospheric CO2
13 inferred from one proxy reconstructionderived from boron isotope-based estimates of seawater pH42.
More recently, Eocene and Oligocene sediment from theGreenland Sea were shown to have IRD, including quartz grainswith various surface textures indicative of ice transport8,12.Interpretations of provenance have been limited because surfacetextures can only provide constraints on transport mechanism(s)and not source regions. Although whole rock element chemistrywas used to argue for a possible East Greenland source of IRDbetween 38 and 30Ma8, this technique is not considered con-clusive at establishing provenance in the Arctic and elsewhere dueto the impact of variable mineralogy on the elemental chemistryof bulk rock, and the complex and highly variable mineralogy andpetrology of Greenland and circum-Arctic rocks and sediments.These previous interpretations are limited by the fact that themethod used cannot prove that Greenland was the only possiblesource for these grains, which is why this method is generally notused in studies of Quaternary ice rafting. Therefore the prove-nance of IRD to the Greenland Sea and the extent of glacial ice onGreenland remains unknown.
For this study, we apply a well-established chemical finger-printing technique9–11,37,43 to identify specific regions of originfor individual IRD grains. We constrain Greenland glacial ice andArctic sea ice dynamics during the middle Eocene through earlyOligocene. The occurrence of glacial ice on Greenland was syn-chronous with episodes of circum-Arctic ice-rafting and, in somecases, with proxies for ice volume and carbon cycle changes.Ephemeral glaciations occurred until the earliest Oligocene,marking the end of the transition from early Cenozoic hothouseconditions to a stable icehouse state.
ResultsIRD source fingerprinting. We examined 2029 detrital anhy-drous Fe oxide grains from the sand fraction of middle Eocene toearly Oligocene sediments recovered at Ocean Drilling Program(ODP) Site 913 (Fig. 1), located 360 km east of Greenland. IRDfrom these sediments have previously been the subject ofstudy8,12. In total, we examined 100 sediment samples from Site913 using the chemical fingerprinting method. Sediment sourceswere determined for ice-rafted grains that were present in 51 coresamples. The remaining 49 samples did not contain Fe oxidegrains.
Sources of oldest IRD. We find that beginning in the late middleEocene, IRD originated from multiple sources on Greenland andthe circum-Arctic region (Fig. 2), with the oldest sample(~47.1 Ma) containing grains that can be matched to sources inboth of these regions (Fig. 3). No samples examined from belowthis initial IRD peak contained sand-sized or coarser detritalmaterial and no Fe oxide grains were found. The first highlysignificant influx of ice-rafted Fe oxide grains (≥5 grains from1 source) from Greenland indicates the presence of glacial ice at
ARTICLE NATURE COMMUNICATIONS | DOI: 10.1038/s41467-018-03180-5
2 NATURE COMMUNICATIONS | (2018) 9:1038 | DOI: 10.1038/s41467-018-03180-5 | www.nature.com/naturecommunications
43.6 Ma, followed by several notable peaks in fluxes through26Ma (Fig. 3, Supplementary Data 2).
Fingerprinting results for Eocene and Oligocene samples. From47 to 26Ma, there are some intervals when there are largenumbers of Fe oxide grains (up to 75 Fe oxide grains, where 2grains would be statistically significant) matched to two specificsource areas on Greenland (Figs. 2, 3). In addition, although someEocene samples do not contain any IRD from Greenland, all ofthe Oligocene samples we examined do (Table 1), a pattern that isconsistent with ephemeral glacial ice on Greenland during themiddle and late Eocene.
Specific Greenland source areas. Sources include three regionson East and Southeast Greenland (marked as source areas #42,#43, and #46 in Fig. 1). East Greenland (source area #42 on Fig. 1)is represented by the largest number of ice-rafted Fe oxide grains.The largest contributions from this region are from fjords thatcontain notable layered intrusives with unique Fe oxide grain
compositions. These fjords are known to be sources of largeicebergs in recent years44,45. Many of the core samples contain anabundance of Fe oxide grains that can be traced to this smallsource region (Fig. 2). Southeast Greenland (source area #43) isthe source of a significant quantity of Fe oxide grains duringmajor episodes of ice-rafting (Fig. 4; Supplementary Fig. 1–5).The fluxes from this region mimic those from East Greenlandsources (#42 and #46), although the Southeast Greenland valuesare slightly lower than the two combined East Greenland sources.
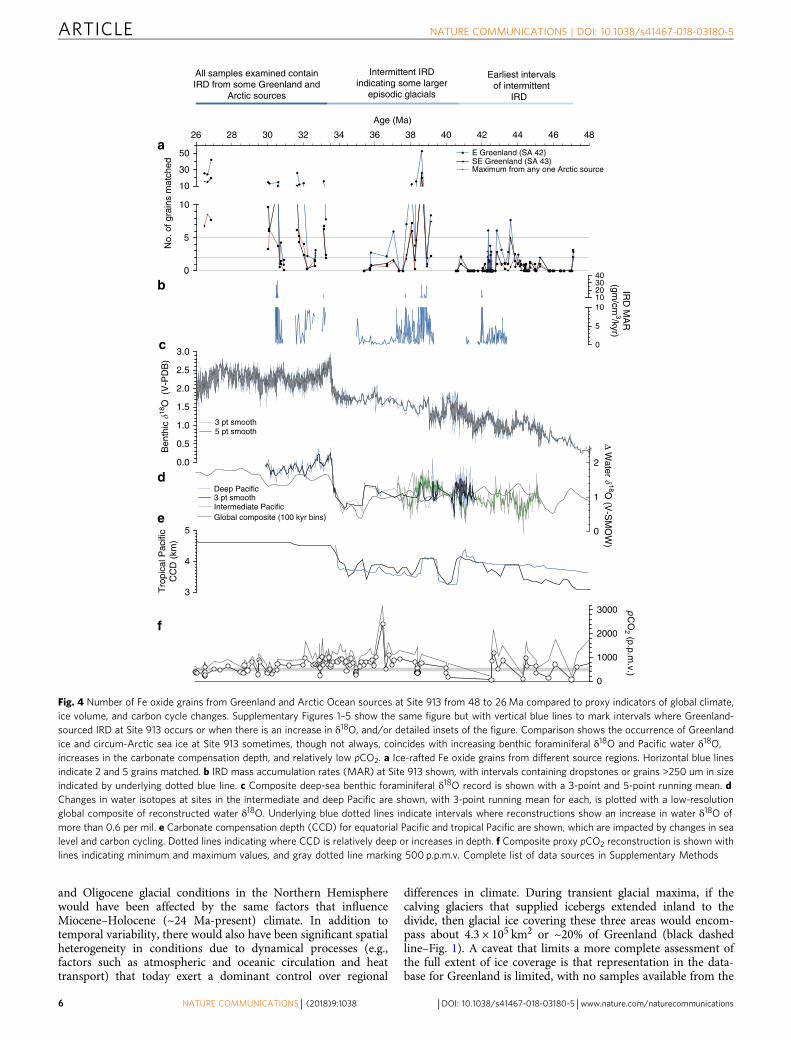
Comparison with published proxy data. Our results werecompared with published proxy data, including indicators ofglobal ice volume. We find that several peaks in IRD sourcedfrom Greenland broadly coincide with times of increasing valuesof benthic foraminiferal δ18O and/or Pacific water δ18O (Fig. 4).Some, though not all, of these IRD peaks are also synchronouswith changes in carbon cycle indices, including increases in thecarbonate compensation depth, and low pCO2 (<500 p.p.m.v.)(Fig. 4; Supplementary Fig. 1–5).
140° 130° 120°
Source areas and samples
Sample type
Grab LandTill
Yenisey R.
15
Kara
Barents
NORTHATLANTIC
913 B
GreenlandSea
DS
14
16
Sea
37 SEVERNAYA
LENA R.
FADDAYEV
INDIGIRKA R.
KOLYMA R.
CAPE SHELAGSK
WRANGELISLAND
MACKENZIE R.
NAN
SEN SO
UN
D
BANKS IS.
VICTORIA IS.
CORNWALI
MELVILLE IS.
BATHURST IS. DEVON
B A F F I NI S L A N D
FUFFRINGNES
XELHEIBERG
ELLESMERE
ZEMLYA
FRANZ
500
500
500
500
JOSEF
LAND
SVALBARD
FRAM STRAIT
17
18
23
2221
20
E
19
40
CHUKCHISEA
ALASKAColville R. GREENLAND
ICELAND
ACEX
44
45
43
46 42Fig. 1a
10
BEAUFORTSEA
38
13
11
9 8
5
257
6
2728
26
243
4
39
41
LAPTEV SEA
SIBERIA
N SEA
1236
3230
31
29
35
1
2
33
34
Sea NORWAY
30°W
60°N
30°E0°
913NOVA
Ob R.
Pechora R.Box or piston
200 2000 400
Kilometer
600 800
110° 100° 90° 80° 70° 60° 50° 40°
130° 120°140°
150°
160°
170°
180°
170°
160°
150°
110° 100° 90° 80° 70° 60° 50° 40°
30°
20°
10°
0°
10°
20°
30°
ZEMLY
A
1000
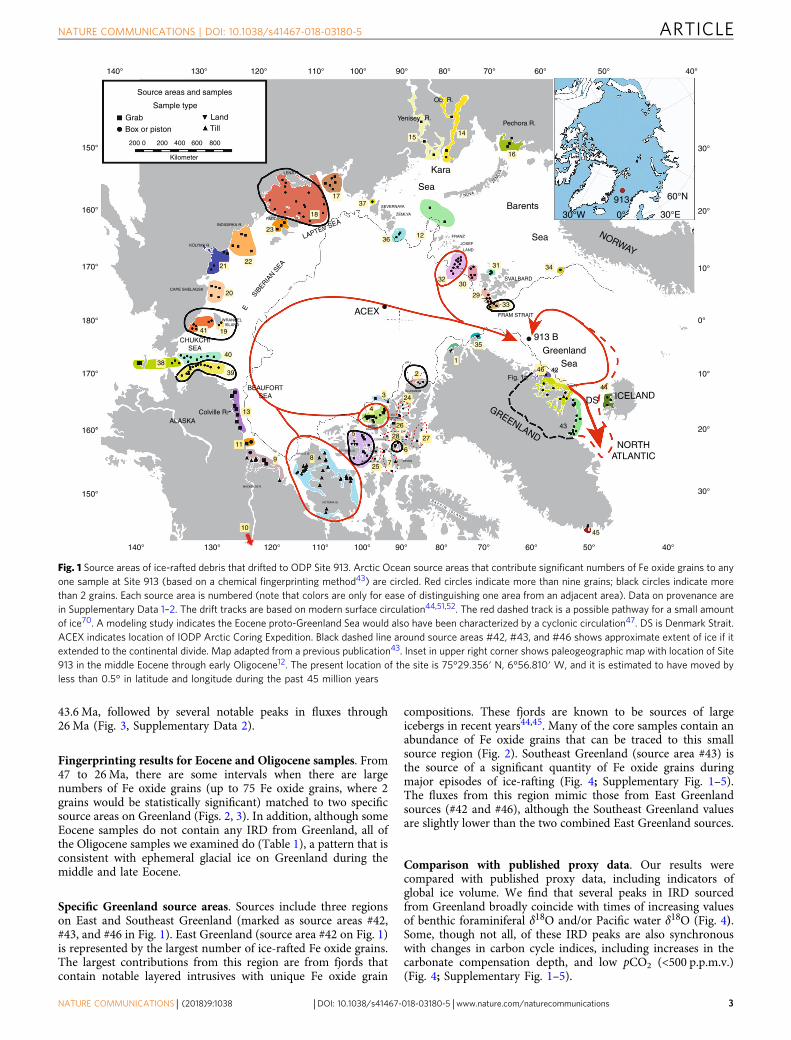
Fig. 1 Source areas of ice-rafted debris that drifted to ODP Site 913. Arctic Ocean source areas that contribute significant numbers of Fe oxide grains to anyone sample at Site 913 (based on a chemical fingerprinting method43) are circled. Red circles indicate more than nine grains; black circles indicate morethan 2 grains. Each source area is numbered (note that colors are only for ease of distinguishing one area from an adjacent area). Data on provenance arein Supplementary Data 1–2. The drift tracks are based on modern surface circulation44,51,52. The red dashed track is a possible pathway for a small amountof ice70. A modeling study indicates the Eocene proto-Greenland Sea would also have been characterized by a cyclonic circulation47. DS is Denmark Strait.ACEX indicates location of IODP Arctic Coring Expedition. Black dashed line around source areas #42, #43, and #46 shows approximate extent of ice if itextended to the continental divide. Map adapted from a previous publication43. Inset in upper right corner shows paleogeographic map with location of Site913 in the middle Eocene through early Oligocene12. The present location of the site is 75°29.356′ N, 6°56.810′ W, and it is estimated to have moved byless than 0.5° in latitude and longitude during the past 45 million years
NATURE COMMUNICATIONS | DOI: 10.1038/s41467-018-03180-5 ARTICLE
NATURE COMMUNICATIONS | (2018) 9:1038 | DOI: 10.1038/s41467-018-03180-5 | www.nature.com/naturecommunications 3
DiscussionOur chemical fingerprinting approach quantitatively measured 14elements43 in each of 2029 sand-sized detrital Fe oxide grains insediment samples from the Greenland Sea. The technique enabledus to determine the precise sources of the Fe oxide grains from inthe circum-Arctic region and within Greenland. We found thatFe oxide grains could be traced to widespread source areasincluding the Laptev and Chukchi Seas, the Canadian ArcticArchipelago, and to multiple regions in East and SoutheastGreenland (source areas #42, #43, and #46). Sea ice is the likelytransport mechanism for grains from many of the circum-Arcticsource regions.
However, the probable source of the Fe oxide grains derivedfrom Greenland are icebergs rafted from glacial ice. Glacial
transport from Greenland source areas is consistent with thecoarse nature of the sediment, the large percentage of quartzgrains with evidence of glacial abrasion, and other textural indi-ces8,12. Although sea ice may have been important locally alongthe Greenland coast for entraining sediments, we note the extentof sea ice in the Greenland Sea today is limited to the shelf alongmost of East Greenland46. During the middle Eocene throughearly Oligocene, when global climate was warmer than today, weassume the extent and thickness of sea ice in this region wouldhave likely been substantially reduced. Modeling studies indicatea cyclonic circulation in the Greenland Sea region for theEocene47, that sea ice was thinner or less extensive than todayunder these substantially warmer climatic conditions, and thatsea-ice drift may have also been significantly faster48. The
NE Greenland sources
Eastern CAA sources
Western CAA sources
SE Greenland sources
Alaskan/Beaufort sources
Chukchi sources
Laptev sources
East Siberian sources
Kara sourcesBarents sources
a
b
c
Greenland and Canadian ArcticArchipelago (CAA)
Western andNorthwestern Arctic
Northeastern andEastern Arctic
Earliest intervals ofintermittent IRDAll samples studied contain
some IRD from Greenland andArctic sources Intermittent IRD indicating episodic glacials
26 28 30 32 34 36 38 40 42 44 46 480
20
40
60
80
100
0
10
20
30
40S
E G
reen
land
Wei
ght %
IRD
All other sourcesW
eight % IR
D
26 28 30 32 34 36 38 40 42 44 46 480
5
10
15
20
0
50
100
Chu
kchi
/Lap
tev
Wei
ght %
IRD
Alaska/B
eaufort/East S
iberiaW
eight % IR
D
26 28 30 32 34 36 38 40 42 44 46 480
10
20
30
0
10
20
30
40
Age (Ma)
Bar
ents
Wei
ght %
IRD
Kara
Weight %
IRD
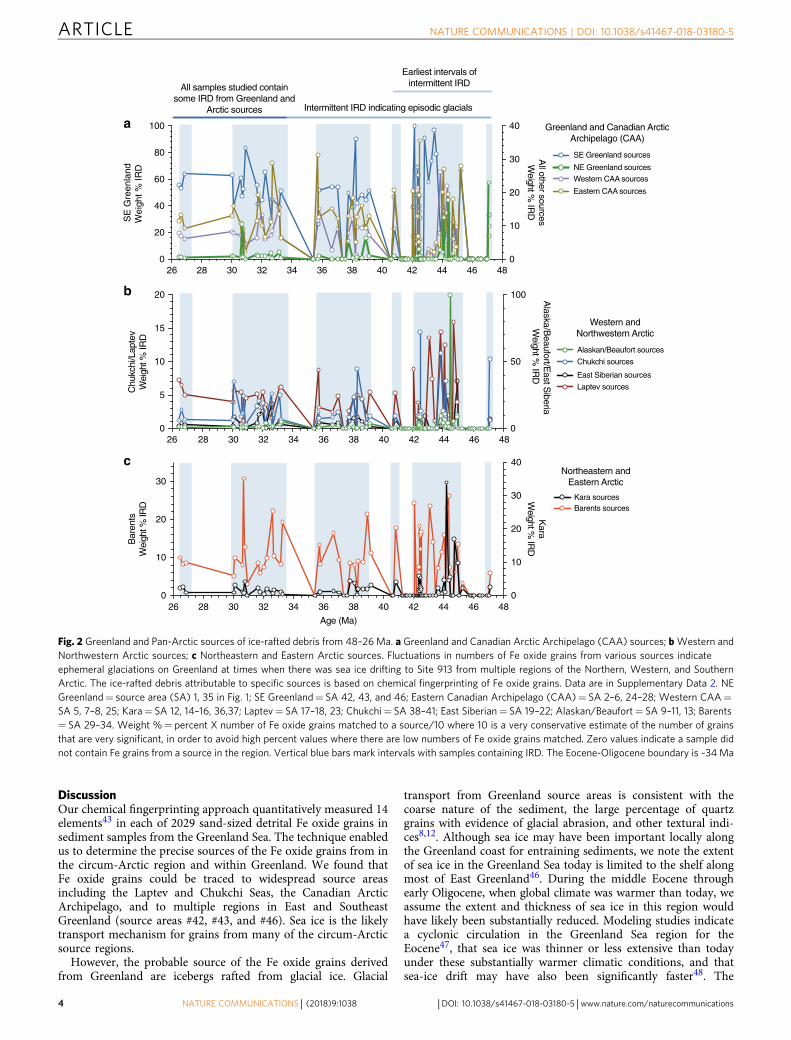
Fig. 2 Greenland and Pan-Arctic sources of ice-rafted debris from 48–26Ma. a Greenland and Canadian Arctic Archipelago (CAA) sources; bWestern andNorthwestern Arctic sources; c Northeastern and Eastern Arctic sources. Fluctuations in numbers of Fe oxide grains from various sources indicateephemeral glaciations on Greenland at times when there was sea ice drifting to Site 913 from multiple regions of the Northern, Western, and SouthernArctic. The ice-rafted debris attributable to specific sources is based on chemical fingerprinting of Fe oxide grains. Data are in Supplementary Data 2. NEGreenland= source area (SA) 1, 35 in Fig. 1; SE Greenland= SA 42, 43, and 46; Eastern Canadian Archipelago (CAA)= SA 2–6, 24–28; Western CAA=SA 5, 7–8, 25; Kara= SA 12, 14–16, 36,37; Laptev= SA 17–18, 23; Chukchi= SA 38–41; East Siberian= SA 19–22; Alaskan/Beaufort= SA 9–11, 13; Barents= SA 29–34. Weight %= percent X number of Fe oxide grains matched to a source/10 where 10 is a very conservative estimate of the number of grainsthat are very significant, in order to avoid high percent values where there are low numbers of Fe oxide grains matched. Zero values indicate a sample didnot contain Fe grains from a source in the region. Vertical blue bars mark intervals with samples containing IRD. The Eocene-Oligocene boundary is ~34Ma
ARTICLE NATURE COMMUNICATIONS | DOI: 10.1038/s41467-018-03180-5
4 NATURE COMMUNICATIONS | (2018) 9:1038 | DOI: 10.1038/s41467-018-03180-5 | www.nature.com/naturecommunications
circuitous route required to reach Site 913 from source areas #42,#43, and #46 makes it likely that grains from these Greenlandsource areas were dominantly transported by icebergs the>400 km distance from the coast to Site 913 (Fig. 1), and notsolely by sea ice, given that only icebergs can survive drifting inopen water for tens to hundreds of kilometers.
At times in the Eocene and during the Oligocene, numerouslarge icebergs would have needed to calve from the East andSoutheast Greenland source areas simultaneously, given that onlya small percentage of icebergs would reach the core site. For themodern surface circulation, ice-drift models suggest that only asmall amount of ice would drift east toward Iceland and thennorth into the Greenland Sea44,45,49. This drift track covers morethan 1000 km and IRD deposition from icebergs decreases dra-matically from calving sites to the last melt-out, similar to thethickness decreases seen at different core sites in Heinrich lay-ers50. In order to reach Site 913, most of the icebergs from theGreenland source areas would have drifted south through Den-mark Strait44,45,49,51,52. Even in the highly unlikely event the EastGreenland Current flowed north instead of south in the past, thestraight-line drift distance from source area #43 to Site 913 wouldbe over 1000 km. Therefore only a small fraction of icebergsoriginating in a given source area on Greenland or elsewherewould have survived to deposit IRD at Site 913. It is likely that
some of the observed intervals of IRD in cores from Site 913,which can be up to 2–4 cm in thickness, would likely correspondto time intervals of intense glaciation.
During some glacial maxima, regions as far south as 68o lati-tude, and at least as far north as source area #46 (~73o latitude),were glaciated. The presence of IRD at Site 913 that was simul-taneously delivered from source areas #42, #43, and #46 indicatesthat glacial ice came from widespread areas across East andSoutheast Greenland. Fe oxide grains measured in this studymatched to every sample cataloged in the database from thesethree source areas (Fig. 1) and therefore can be attributed tospecific locations. Given that other core samples contain no IRD,these results can be best explained if there were some times thatwere ice free, and during other time intervals there wereephemeral glaciations that were intense enough to cover theseareas simultaneously with glacial ice that produced calving ice-bergs. Although Greenland was not likely to have been completelyice-covered as it is now, our data identify regions of Greenlandthat were covered with glaciers during parts of the middle Eocenethrough early Oligocene.
We note the actual distribution of glacial ice at a given timewould reflect a combination of summertime temperatures thatwould largely be controlled by insolation, topography, andgreenhouse gas content, as well as moisture availability. Eocene
Table 1 Key events in Site 913 records from ~47–26Ma
Age Event
47.1 Ma Oldest sample containing ice-rafted grains from Greenland and circum-Arctic sources43.6Ma High influx of ice-rafted grains from Greenland sources35.4Ma Youngest sample examined that is devoid of ice-rafted grains from Greenland sources33.3–26.5Ma All samples examined contain ice-rafted grains from Greenland sources
The first interval of intermittent IRD is in the middle Eocene (~47.1 Ma) and the amplitude of variability in IRD records increases in the late middle Eocene (after 43.6Ma). Every sample examined in thisstudy from the early Oligocene (i.e., after the Oi-1 glaciation) contains IRD from some Greenland and Arctic sources
26 28 30 32 34 36 38 40 42 44 46 48
0
5
101030507090
0
5
10
15
20
25
Age (Ma)
No.
of g
rain
s m
atch
edto
Gre
enla
nd s
ourc
esM
aximum
no. of grains fromany one A
rctic source
All samples studied containsome IRD from Greenland
and Arctic sources Intermittent IRD indicating episodic glacials
0510152025
No. of grains m
atchedto A
rctic source
ACEX
Site 913a
b
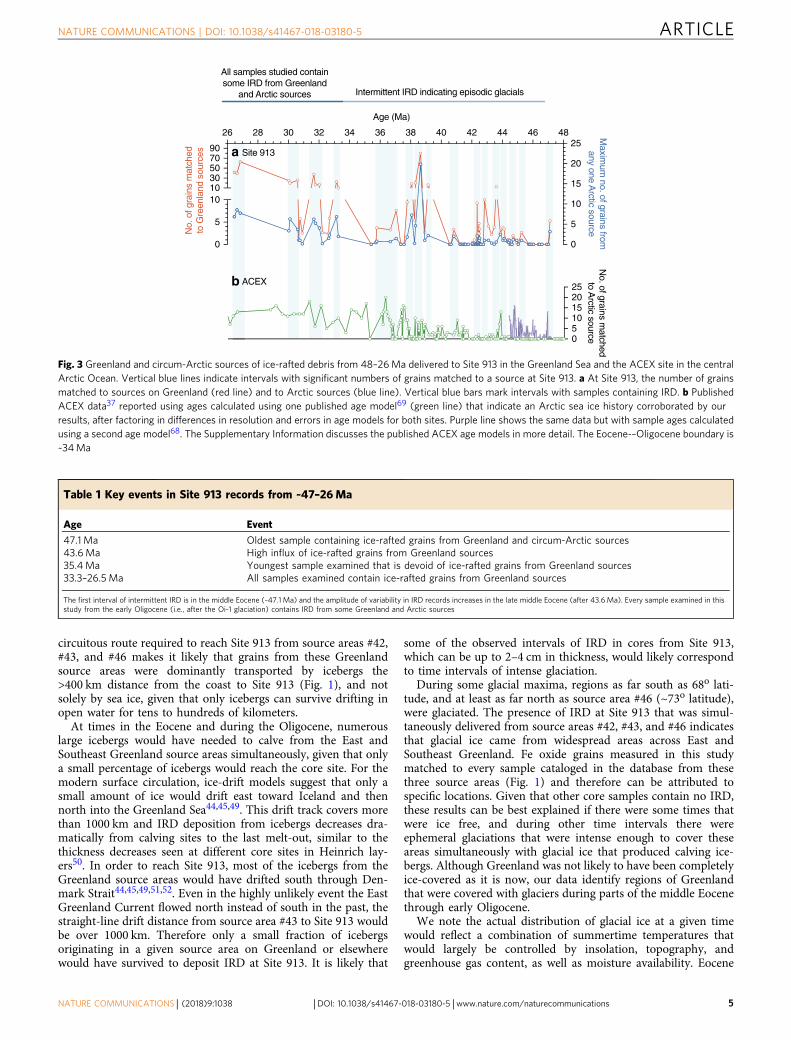
Fig. 3 Greenland and circum-Arctic sources of ice-rafted debris from 48–26Ma delivered to Site 913 in the Greenland Sea and the ACEX site in the centralArctic Ocean. Vertical blue lines indicate intervals with significant numbers of grains matched to a source at Site 913. a At Site 913, the number of grainsmatched to sources on Greenland (red line) and to Arctic sources (blue line). Vertical blue bars mark intervals with samples containing IRD. b PublishedACEX data37 reported using ages calculated using one published age model69 (green line) that indicate an Arctic sea ice history corroborated by ourresults, after factoring in differences in resolution and errors in age models for both sites. Purple line shows the same data but with sample ages calculatedusing a second age model68. The Supplementary Information discusses the published ACEX age models in more detail. The Eocene-–Oligocene boundary is~34Ma
NATURE COMMUNICATIONS | DOI: 10.1038/s41467-018-03180-5 ARTICLE
NATURE COMMUNICATIONS | (2018) 9:1038 | DOI: 10.1038/s41467-018-03180-5 | www.nature.com/naturecommunications 5
and Oligocene glacial conditions in the Northern Hemispherewould have been affected by the same factors that influenceMiocene–Holocene (~24 Ma-present) climate. In addition totemporal variability, there would also have been significant spatialheterogeneity in conditions due to dynamical processes (e.g.,factors such as atmospheric and oceanic circulation and heattransport) that today exert a dominant control over regional
differences in climate. During transient glacial maxima, if thecalving glaciers that supplied icebergs extended inland to thedivide, then glacial ice covering these three areas would encom-pass about 4.3 × 10⁵ km2 or ~20% of Greenland (black dashedline–Fig. 1). A caveat that limits a more complete assessment ofthe full extent of ice coverage is that representation in the data-base for Greenland is limited, with no samples available from the
26 28 30 32 34 36 38 40 42 44 46 48
0
5
10
10
30
50
Age (Ma)
No.
of g
rain
s m
atch
ed SE Greenland (SA 43)E Greenland (SA 42)
Maximum from any one Arctic source
0
1000
2000
3000 pC
O2 (p.p.m
.v.)
0.0
0.5
1.0
1.5
2.0
2.5
3.0
Ben
thic
�18
O (
V-P
DB
)
5 pt smooth3 pt smooth
Global composite (100 kyr bins)Intermediate Pacific3 pt smoothDeep Pacific
0
1
2
Δ Water �
18O (V
-SM
OW
)
Tro
pica
l Pac
ific
CC
D (
km)
5
4
3
a
b
c
d
e
f
0
5
1010203040
IRD
MA
R(gm
/cm3/kyr)
Earliest intervalsof intermittent
IRD
All samples examined containIRD from some Greenland and
Arctic sources
Intermittent IRDindicating some larger
episodic glacials
Fig. 4 Number of Fe oxide grains from Greenland and Arctic Ocean sources at Site 913 from 48 to 26Ma compared to proxy indicators of global climate,ice volume, and carbon cycle changes. Supplementary Figures 1–5 show the same figure but with vertical blue lines to mark intervals where Greenland-sourced IRD at Site 913 occurs or when there is an increase in δ18O, and/or detailed insets of the figure. Comparison shows the occurrence of Greenlandice and circum-Arctic sea ice at Site 913 sometimes, though not always, coincides with increasing benthic foraminiferal δ18O and Pacific water δ18O,increases in the carbonate compensation depth, and relatively low pCO2. a Ice-rafted Fe oxide grains from different source regions. Horizontal blue linesindicate 2 and 5 grains matched. b IRD mass accumulation rates (MAR) at Site 913 shown, with intervals containing dropstones or grains >250 um in sizeindicated by underlying dotted blue line. c Composite deep-sea benthic foraminiferal δ18O record is shown with a 3-point and 5-point running mean. dChanges in water isotopes at sites in the intermediate and deep Pacific are shown, with 3-point running mean for each, is plotted with a low-resolutionglobal composite of reconstructed water δ18O. Underlying blue dotted lines indicate intervals where reconstructions show an increase in water δ18O ofmore than 0.6 per mil. e Carbonate compensation depth (CCD) for equatorial Pacific and tropical Pacific are shown, which are impacted by changes in sealevel and carbon cycling. Dotted lines indicating where CCD is relatively deep or increases in depth. f Composite proxy pCO2 reconstruction is shown withlines indicating minimum and maximum values, and gray dotted line marking 500 p.p.m.v. Complete list of data sources in Supplementary Methods
ARTICLE NATURE COMMUNICATIONS | DOI: 10.1038/s41467-018-03180-5
6 NATURE COMMUNICATIONS | (2018) 9:1038 | DOI: 10.1038/s41467-018-03180-5 | www.nature.com/naturecommunications
northeastern regions of Greenland to compare to Site 913(between source areas #1/35 and #46 on Fig. 1). The abundance ofFe oxide grains in many samples from Site 913 indicates that attimes, large numbers of icebergs were produced, consistent withthe intermittent occurrence of glaciations, with ephemeral glacial
maxima that at times spread far inland and supported calving atthe coast (Figs. 1, 2).
Fluctuations in numbers of Fe oxide grains from various sourceregions in samples from Site 913 indicate that when parts ofGreenland experienced ephemeral glaciations, sea ice from
–1
0
1
2
3 Benthic �
13C (V
-PD
B)
0 5 10 15 20 25 30 35 40 45 50 55 60 65 70
0
10
2020
100
0
10
20N
o. o
f gra
ins
mat
ched
Gre
enla
nd s
ourc
esN
o. of grains matched
Arctic sources
Age (Ma)
0
1000
2000
3000
4000
pC
O2
(p.p
.m.v
.)
0
1
2
3
4
5
Ben
thic
�18
O (
V-P
DB
)
Arctic sea ice
e
Intermediate ave CO2intermediate ΔCO2
Low ave CO2low ΔCO2
High ave CO2high ΔCO2
cAntarctic ice
No dataGreenland ice
d
a
b
Site 913ACEX
Intermittent IRDindicating episodic
glacials
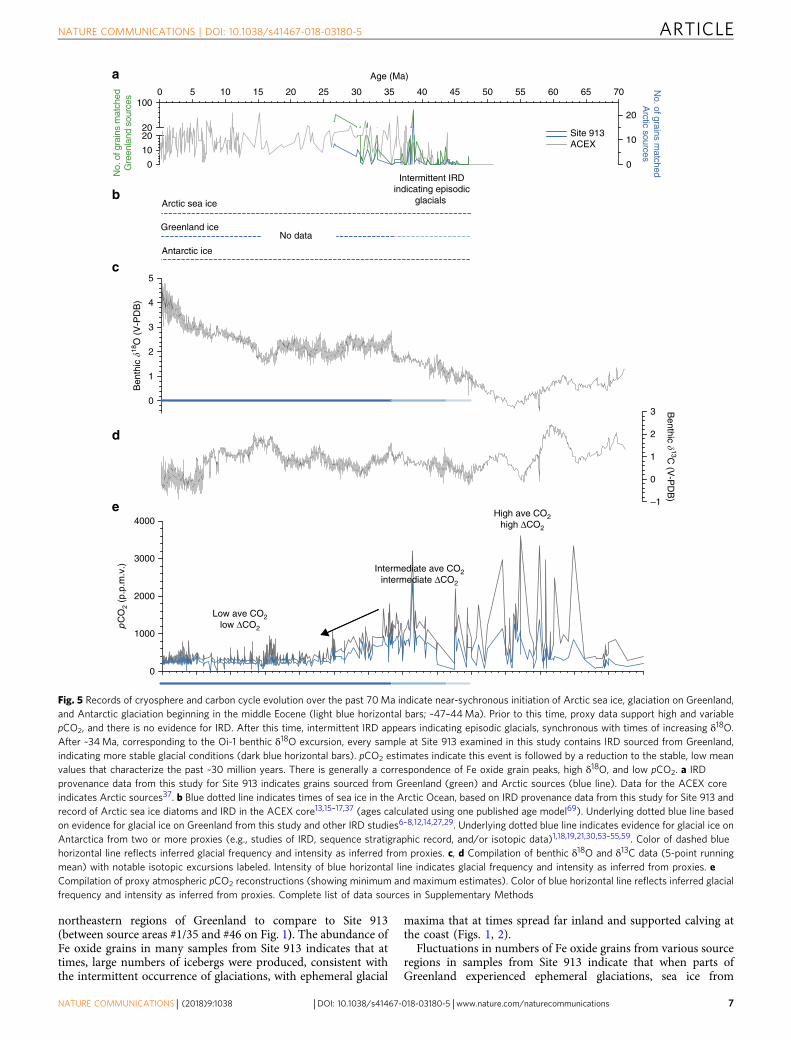
Fig. 5 Records of cryosphere and carbon cycle evolution over the past 70Ma indicate near-sychronous initiation of Arctic sea ice, glaciation on Greenland,and Antarctic glaciation beginning in the middle Eocene (light blue horizontal bars; ~47–44Ma). Prior to this time, proxy data support high and variablepCO2, and there is no evidence for IRD. After this time, intermittent IRD appears indicating episodic glacials, synchronous with times of increasing δ18O.After ~34Ma, corresponding to the Oi-1 benthic δ18O excursion, every sample at Site 913 examined in this study contains IRD sourced from Greenland,indicating more stable glacial conditions (dark blue horizontal bars). pCO2 estimates indicate this event is followed by a reduction to the stable, low meanvalues that characterize the past ~30 million years. There is generally a correspondence of Fe oxide grain peaks, high δ18O, and low pCO2. a IRDprovenance data from this study for Site 913 indicates grains sourced from Greenland (green) and Arctic sources (blue line). Data for the ACEX coreindicates Arctic sources37. b Blue dotted line indicates times of sea ice in the Arctic Ocean, based on IRD provenance data from this study for Site 913 andrecord of Arctic sea ice diatoms and IRD in the ACEX core13,15–17,37 (ages calculated using one published age model69). Underlying dotted blue line basedon evidence for glacial ice on Greenland from this study and other IRD studies6–8,12,14,27,29. Underlying dotted blue line indicates evidence for glacial ice onAntarctica from two or more proxies (e.g., studies of IRD, sequence stratigraphic record, and/or isotopic data)1,18,19,21,30,53–55,59. Color of dashed bluehorizontal line reflects inferred glacial frequency and intensity as inferred from proxies. c, d Compilation of benthic δ18O and δ13C data (5-point runningmean) with notable isotopic excursions labeled. Intensity of blue horizontal line indicates glacial frequency and intensity as inferred from proxies. eCompilation of proxy atmospheric pCO2 reconstructions (showing minimum and maximum estimates). Color of blue horizontal line reflects inferred glacialfrequency and intensity as inferred from proxies. Complete list of data sources in Supplementary Methods
NATURE COMMUNICATIONS | DOI: 10.1038/s41467-018-03180-5 ARTICLE
NATURE COMMUNICATIONS | (2018) 9:1038 | DOI: 10.1038/s41467-018-03180-5 | www.nature.com/naturecommunications 7
multiple regions of the Northern, Western, and Southern Arcticalso drifted to the core site. The same sediments containing grainsderived from Greenland sources also contain IRD from severalcircum-Arctic regions, including the Canadian Arctic Archipe-lago, Western and Northwestern Arctic, and the Northeasternand Eastern Arctic (Figs. 1, 2). These findings are indicative ofsynchronous ice-rafting in from multiple shelf regions around theArctic. Several of these sources are represented by significantnumbers of Fe oxide grains in Site 913 samples. Sources includeBanks and Ellef Ringnes Islands in North America, and FranzJosef Land in Russia (source areas #8, #4, and #32, respectively, inFig. 1). Many other Arctic source areas are represented by thepresence of more than two Fe oxide grains in any one sample(e.g., source areas #2, #5, #18, #19, #33, and #39 in Fig. 1). Someof these areas were probably never glaciated given the lack ofglacial deposits, their locations and elevations and thus it is likelythat at least some of these Arctic Fe oxide grains were transportedby sea ice.
We note that alkenone-based sea surface temperatures derivedfor the ACEX core from the central Arctic Ocean have beeninterpreted to reflect summer temperatures of between 6–20 °Cduring the middle Eocene (~47–38Ma)23. One way to reconcilethese two types of data sets, assuming the temperature estimatesare robust for this region and time interval, is through geographicand/or temporal variability in conditions. This would requireACEX alkenone data and Site 913 IRD peaks to truly be coeval,and for sea ice to have drifted at a much faster rate, given warmerocean temperatures and thinner ice48. Average drift rates wouldneed to be as high as 25 cm/s for some sources near Banks Islandif the drift were along similar trajectories as today; such rates aremore than twice what models predict for near ice-free condi-tions48. Alternatively, it is also feasible that individual data pointsin different proxy records from both sites capture different timeswithin orbital cycles or higher-frequency fluctuations, and toge-ther, the data sets provide a glimpse into climate variabilityduring the middle Eocene (i.e., with times of glacial ice onGreenland, sea ice in the circum-Arctic, and ice-free conditionsrepresented in the different data sets), our slightly favoredexplanation, given that the ocean-climate-cryosphere systemwould have exhibited variability over a range of timescalesincluding millennial and orbital-scale during the Eocene andOligocene, just as it has throughout Earth’s history. Anotherpossibility is that directly correlating our data from Site 913 to thepublished records from ACEX is hampered by limitations on agecontrol. These issues can only be addressed through the recoveryand study of more complete sedimentary successions from dif-ferent regions during future research expeditions.
The provenance data for Site 913 pinpoints the origins of IRDin the Greenland Sea to source regions in East Greenland,Southeast Greenland, and the entire circum-Arctic Ocean, whichepisodically contributed IRD in the middle Eocene and becamemore stable by the early Oligocene (~34Ma, Fig. 2). The coin-cident peaks in our records from these various source regionsindicate that episodic glaciation in Greenland was synchronouswith periods of ice-rafting from multiple regions around theArctic Ocean. Therefore the cold conditions necessary for glaciersto develop on Greenland during these intervals also extended tosome, if not all, of the terrestrial areas around the Arctic Ocean. Apossible analog for the warm glacial regime on Greenland mayinclude present-day British Columbia and Southeastern Alaska,where there are glacial accumulation areas at high elevation withglaciers extending to and calving at sea level, neither of which hasperennial sea ice today.
The large variations in IRD accumulation rate and the con-tribution of IRD from different sources imply that despite it beingreduced in volume compared to the Southern Hemisphere
cryosphere, the Northern Hemisphere cryosphere was highlydynamic. The large variability in fluxes from Greenland andcircum-Arctic sources, with anywhere from 75 to 0 grains mat-ched in a sample, imply a substantially earlier occurrence of iceaccumulation on Greenland than the widely accepted timing of14 to 6Ma. Because the oldest samples of Greenland-derived IRDfrom Site 913 date to ~47Ma, it is likely glacial ice occurredephemerally on Greenland beginning as early as the middleEocene. Not all of the middle and late Eocene (~47–34Ma)samples we examined contain IRD, indicating that at times icemay have disappeared completely (Fig. 4). In some regions, it ispossible that a large ice cap or a small ice sheet was only presentduring cold summer orbits and was initiated in areas of highelevation, with conditions therefore also being conducive to thedevelopment of Arctic sea ice. These results are consistent withthe presence of an ephemeral, highly dynamic cryosphere in theNorthern Hemisphere beginning in the middle Eocene. OnGreenland, episodic glaciations in multiple regions providedadequate ice in the form of icebergs to reach Site 913 duringintervals of the Eocene and stabilized by the Oligocene. Specifi-cally, every sample we examined from the early Oligocene con-tains IRD sourced from Greenland, implying that during andafter the Oi-1 glaciation (~33.8–33.6 Ma), glacial ice on Green-land was likely more stable and less ephemeral (Fig. 4).
Some of the peaks in the Fe oxide grain data from Site 913 arecontemporaneous with known major isotopic excursions in themarine sedimentary record3,22,53–55 (Fig. 4). For example, severalof the maxima in grains from Greenland and circum-Arcticsources delivered to this site (indicated by blue lines in Fig. 4) arecontemporaneous with changes in published records includingpositive excursions in the Pacific δ18O record3,5,21 which largelyreflects temperature and Antarctic ice volume, pCO2
56,57, andvariations in carbonate sedimentation that reflect changes in sealevel and carbon cycling3,58 (Fig. 4; Supplementary Fig. 1–5).These times are also periods when some records show notablechanges in Southern Ocean surface water hydrography and thereare reports of IRD derived from Antarctica59–61 (Fig. 5). Severalof the maxima at Site 913 also broadly line up with changes inpublished IRD records from the central Arctic13,15,16,37, althoughthere are differences in sampling resolution, coring gaps, and agemodel uncertainties (Fig. 3).
Ultimately, our results are consistent with episodic bipolarglaciation and circum-Arctic ice-rafting beginning in the middleEocene and throughout the early Oligocene. Significantly, resultssuggest a broadly concurrent Cenozoic onset and history of Arcticsea ice, glacial ice on Greenland, and glacial ice on Antarctica(Fig. 5). Determining the timing and extent of glaciations in theNorthern Hemisphere can help to constrain the tectonic andenvironmental drivers of climate change2. Some have argued thattectonically forced changes in ocean currents circumscribingAntarctica triggered glaciation during the Eocene and Oligo-cene62,63, while a later onset of Northern Hemisphere glaciationoccurred largely because of current-driven heat transport changesresulting from the emergence of the isthmus of Panama64. Anearlier timing for the onset of ice in the Northern Hemisphereindicates ocean heat transport was not likely the sole or directtrigger for the Cenozoic initiation of the first glaciations onGreenland, although the oceanic meridional overturning circu-lation may have served as a feedback mechanism for ice growthand/or a driver of carbon cycle changes.
Others have argued that greenhouse gas levels may have had arole in driving these transitions2,3,13,65, in part based on thetiming of ice growth relative to reconstructions of CO2 fluctua-tions. During the Cenozoic, falling pCO2 may have resulted intemperatures at both poles dropping below critical thresholds forthe formation of sea ice and glacial ice3,13. Some studies have
ARTICLE NATURE COMMUNICATIONS | DOI: 10.1038/s41467-018-03180-5
8 NATURE COMMUNICATIONS | (2018) 9:1038 | DOI: 10.1038/s41467-018-03180-5 | www.nature.com/naturecommunications
hypothesized the polar regions in both hemispheres had relativelysimilar CO2 thresholds for the onset of glaciation3,13. Alter-natively, substantially different CO2 and temperature thresholdsmay exist for glaciation on Greenland and Antarctica due todifferences in land mass, latitude, and solar insolation66. Our dataallow us not only to test whether there is evidence for CO2 servingas a critical component of the climate system governing cryo-spheric evolution during the Cenozoic, but also to evaluate thesediffering views of thresholds for glaciations.
The IRD source fingerprinting results coincide at times withfluctuations reported in reconstructions of pCO2 derived frommultiple marine and terrestrial proxies (Fig. 4; SupplementaryFig. 1–5). Both types of pCO2 reconstructions show changesduring the middle Eocene through early Oligocene. Some of thechanges observed suggest that at times, maxima in IRD sourcedfrom Greenland coincided with CO2 minima. Comparison withrecords constraining Northern and Southern Hemisphere polarglacial onset indicates that during multiple intervals, whenreconstructed pCO2 values dropped below ~500 p.p.m.v., there isevidence for glacial ice in both hemispheres (Figs. 4, 5). Thus, ourresults may support an occurrence of glaciations with broadlysimilar CO2-equivalent and temperature thresholds in bothhemispheres3,13.
Other factors that link glaciation to CO2 include insolation andlapse rates. For example, during intervals with relatively low CO2
values and orbital parameters favoring cold polar summers, giventhermodynamically constrained values for lapse rates, these timeswould have been associated with precipitation falling as snow atelevation in the surrounding region, including Greenland, leadingto the presence of glacial ice. Figure 5 shows proxy CO2 valuesthat provide a dynamically plausible mechanism for NorthernHemisphere ice during the hothouse-icehouse climate transitionof the early Cenozoic.
Significantly, the source fingerprinting method provides evi-dence that the initiation of glacial ice on Greenland, with apossible large ice cap or even small ice sheet, occurred earlier thanpreviously suggested, and that the occurrence of glacial ice in themiddle Eocene to early Oligocene was synchronous with pan-Arctic sea ice. These new observations allow us to critically ree-valuate our prior understanding, suggesting that previous theorieswere only working hypotheses and allowing us to work towards amore complete interpretation. In fact, the Cenozoic initiation ofglacial ice on Greenland, and sea ice in the Arctic, was close intiming to the development of Antarctic ice. We find evidence forephemeral glacial ice and sea ice in the Northern Hemisphere,and times of ice-free conditions, until the Oi-1 glaciation, and formore stable glacial conditions in the early Oligocene. Futurestudies will provide insights into the history of Northern Hemi-sphere ice and bipolar glaciations during the Eocene andOligocene.
To more fully resolve glacial and sea ice dynamics, given coringgaps in current sedimentary archives and limitations with existingage models, it is critical to recover new and complete Cenozoicsedimentary successions from the Arctic and Southern Ocean.Continuous successions will also enable the development of high-resolution records that could provide constraints on the role oforbital forcing in governing cryospheric stability. The ability togenerate paired records of IRD and carbonate stable isotope ratiosin a single core, which is not possible at Site 913 due to the lack ofpreserved carbonate, may shed light on past changes in the extentof Greenland ice and on the relative timing of glaciation in theNorthern Hemisphere compared to fluctuations in global icebudgets during the Cenozoic. An extension of the Arctic sourcedatabase to include presently undocumented regions, including inNortheastern Greenland, would place more complete constraintson the spatial extent of ice on Greenland in the past, although
some sources may have been eroded away. Such research wouldshed light on the behavior of an ancient Greenland ice cap or icesheet under warm and polythermal glacial regimes that pre-sumably existed during the middle Eocene through Oligocene. Inaddition, the application of the IRD source fingerprinting methodand other techniques including weathering proxies, to new andexisting sediment core sites, will allow us to gain a more completepicture of Greenland glacial ice and Arctic sea ice dynamics underhigher CO2 regimes.
MethodsOverview. To critically test the hypothesis that glacial ice occurred ephemerally onGreenland beginning in the middle Eocene and became more stable after theEocene–Oligocene transition, we applied an accurate, precise, and well-establishedgeochemical fingerprinting technique that allows us to identify the specific regionsof origin for IRD9–11,37,43. By characterizing multi-element signatures of detritaliron oxide minerals that occur in core samples, we are able to isolate sources of IRDover time, determine the sources and shed light on the relative extent of glacial iceon Greenland, and decipher contributions of sea ice from specific circum-Arcticsources during a given interval. We constrain Greenland glacial ice and Arctic seaice dynamics using data from Site 913 during the middle Eocene through earlyOligocene interval (47–26Ma). We also compare our results with published data,including other proxies for sea ice, glacial ice, and ice volume. Our results arecompared to extensive carbon cycle proxy data sets that enable us to study therelationship between Northern Hemisphere cryosphere dynamics and atmosphericpCO2, and to investigate causal mechanisms, such as whether fluctuations in CO2
may have driven the transition to a Cenozoic climate characterized by glacialmaxima in both hemispheres, i.e., episodic bipolar glaciations.
Results were compared with published data on IRD, including massaccumulation rates, dropstone occurrence, and Arctic sea ice diatomoccurrence12,13,15,37. These records are also compared to a global benthic δ18O andδ13C synthesis, a seawater δ18O synthesis, estimates of the carbonate compensationdepth, and reconstructed atmospheric pCO2 from multiple proxies1,3,22,56–58. A fulllist of publications that are the sources of data used for comparison to our results,are listed in the Supplementary Methods.
Fe grain matching. Iron oxides are dominant accessory minerals in most sedi-ments and rocks and are highly durable. Their diverse geochemistry (e.g., withpotential substitutions of several elements for Fe in mineral lattices) gives rise tounique regional chemo-geographic patterns. Therefore the chemistry of individualmineral grains can be used to pinpoint each grain’s region of provenance9,43.
Samples were measured and data analyzed blindly at Old Dominion University.The method for precise source determination uses the chemical signature of 14elements in nine types of iron oxide minerals37,43. The anhydrous detrital Fe oxidegrains (Fe grains) were separated magnetically using a hand magnet and the Frantzmagnetic separator on the sieved 45–250 μm size fractions. These grains were thenmounted in epoxy plugs, polished, and photographed so that each Fe grain couldbe identified as to location on the photo and mineral type for later analysis on theCameca SX100 electron probe microanalyzer (EPMA). The mineral identificationswere checked after EPMA analysis to insure that the microscopic identificationdone with a reflected light microscope (1000×) were correct. Each grain wasanalyzed for 14 elements (Fe, Ti, O, Mn, Mg, Si, Al, Ca, Zn, V, Ni, Cr, Nb, and Ta).Each grain was then matched to grains of the same mineral type from the entireArctic database of over 39,000 Fe grain analyses for all 14 elements for nearshoreand onshore samples taken from 284 sample sites43. These Fe oxides formed inigneous and metamorphic rocks that almost always predated the Eocene (most aremuch older) and have been eroded and deposited in Pleistocene and youngerdeposits where they were sampled for the database. Each element has to be within2 standard deviations of multiple analyses of hundreds of selected grains with highvalues of each element.
This technique enables us to trace each grain to a specific source region (Fig. 1).The uncertainty of this method has been quantified, with an error rate of incorrectmatches of only 1.5%37,43. By characterizing all of the grains in a sediment sample,and by knowing the exact source for each grain, we can determine the multipleregions that contributed IRD present in a sediment sample. When more than onesource Fe grain matched to an Fe grain from a sample, the sources were pro-rationed according to how close the analyses were to all 14 elements. Thisprovenance tool has also been compared to the use of lithic grains for sourcedetermination in several studies with compatible but far more precise results thatare cited in the Supplementary Methods.
Thus, we can ascertain the geographic distribution of glacial ice and sea ice thatrafted grains to Site 913. We note that while it is possible that matched Fe oxidegrains are from unsampled source areas, the probability of Fe oxide grains havingthe same chemical fingerprint as grains represented in the source database is low(<0.01)43. Sample coverage for Northeastern Greenland between source areas #35and #46 is limited, although this region is not known to have recently producedmany icebergs. Source area #46 consists of an inner shelf core (PS2641) with147 samples from every few centimeters down to 266 cm. All Fe oxide grains
NATURE COMMUNICATIONS | DOI: 10.1038/s41467-018-03180-5 ARTICLE
NATURE COMMUNICATIONS | (2018) 9:1038 | DOI: 10.1038/s41467-018-03180-5 | www.nature.com/naturecommunications 9
matched to sources north of Fram Strait were removed from this database in orderto ensure that only Fe oxide grains from East Greenland are represented.
The complete match of all Fe grains in Site 913 samples to Greenland andcircum-Arctic sources can be found in Supplementary Data sets 1–2.
Age model. The sediments recovered from Site 913 have been dated using areliable age model based on paleomagnetics and biostratigraphy8,67.
Comparison with published records of Arctic sea ice from ACEX. There aredata sets for two different sites used to place constraints on Arctic sea ice as shownin Figs. 3–5, and as discussed in the text: (1) Site 913 (IRD provenance datagenerated in this study shown on the Site 913 age model) and (2) the ACEX site(full list of citations in Supplementary Methods). For ACEX, we note there are twodifferent age models proposed68,69 that yield different ages and place the firstappearance of IRD in ACEX a few million years apart, and produce different ice-rafting histories for that site. Therefore we show the results of using each of theseage models in Fig. 3, with the different color lines in the bottom panel, as describedin the figure caption.
Comparison with ACEX IRD source matching. Estimates for number of ACEXIRD grains that can be matched to a source region comes from a publication37.
Comparison with records of Arctic sea ice. Estimates for Arctic sea ice onsetcome from multiple publications. Full list of citations in Supplementary Methods.
Site 913 IRD MAR. Estimates of IRD mass accumulation rates at Site 913 comefrom a publication12.
Comparison with records of Antarctic ice. Estimates for Antarctic ice storagecome from multiple publications. Full list of citations in Supplementary Methods.
Composite deep-sea benthic foraminiferal δ18O and δ13C. Benthic foraminiferalδ18O and δ13C are a compilation from multiple publications. Full list of citationsin Supplementary Methods.
Seawater δ18O. Reconstructed seawater δ18O from multiple publications. Full listof citations in Supplementary Methods.
Carbonate compensation depth. Reconstructed tropical Pacific and equatorialPacific CCD from multiple publications. Full list of citations in SupplementaryMethods.
pCO2. Proxy atmospheric CO2 synthesis contains data from multiple publications.Full list of citations in Supplementary Methods.
Data availability. The data sets generated or analyzed during this study areincluded in Supplementary Data 1–4.
Received: 15 June 2016 Accepted: 24 January 2018
References1. Zachos, J., Dickens, G. R. & Zeebe, R. E. An early Cenozoic perspective on
greenhouse warming and carbon cycle dynamics. Nature 451, 279–283 (2008).2. Zachos, J. C., Pagani, M., Sloan, L. C., Thomas, E. & Billups, K. Trends,
rhythms, and aberrations in global climate 65 Ma to present. Science 292,686–693 (2001).
3. Tripati, A., Backman, J., Elderfield, H. & Ferretti, P. Eocene bipolar glaciationassociated with global carbon cycle changes. Nature 436, 341–346 (2005).
4. Edgar, K. M., Wilson, P. A., Sexton, P. F. & Suganuma, Y. No extreme bipolarglaciation during the main Eocene calcite compensation shift. Nature 448,908–911 (2007).
5. Dawber, C. F. & Tripati, A. K. Constraints on glaciation in the middle Eocene(46–37 Ma) from Ocean Drilling Program (ODP) site 1209 in the tropicalPacific Ocean. Paleoceanography 26, PA2208 (2011).
6. Larsen, H. C. et al. Seven million years of glaciation in Greenland. Science 264,952–956 (1994).
7. Wolf-Welling, T. C. W., Cremer, M., O’Connell, S., Winkler, A. & Thiede, J.Cenozoic arctic gateway paleoclimate variability: indications from changes incoarse-fraction composition. In Proceedings of Ocean Drilling Program,Scientific Results Vol. 151 (eds. Thiede, J., Myhre, A. M., Firth, J. V., Johnson,
G. L. & Ruddiman, W. F.) 515–568 (Ocean Drilling Program, College Station,TX, 1996).
8. Eldrett, J. S., Harding, I. C., Wilson, P. A., Butler, E. & Roberts, A. P.Continental ice in Greenland during the Eocene and Oligocene. Nature. 446,176–179 (2007)
9. Darby, D. A. & Bischof, J. F. A statistical approach to source determination ofLithic and Fe oxide grains: an example from the Alpha Ridge, Arctic Ocean. J.Sediment. Res. 66, 599–607 (1996).
10. Bischof, J. F. & Darby, D. A. Quaternary ice transport in the Canadian Arcticand extent of Late Wisconsinan Glaciation in the Queen Elizabeth Islands.Can. J. Earth. Sci. 36, 2007–2022 (1999).
11. Darby, D. A. The Arctic perennial ice cover over the last 14 million years.Paleoceanography 23, PA1S07 (2008).
12. Tripati, A. K. et al. Evidence for Northern Hemisphere glaciation back to 44Ma from ice-rafted debris in the Greenland Sea. Earth Planet. Sci. Lett. 265,112–122 (2008)
13. St. John, K. Cenozoic ice-rafting history of the central Arctic Ocean:Terrigenous sands on the Lomonosov Ridge. Paleoceanography 23, PA1S05(2008).
14. St. John, K. E. K. Site 918 IRD mass accumulation rate record, late Miocene-Pleistocene. In Proceedings of the Ocean Drilling Program, Scientific ResultsVol 163 (eds. Larsen, H.C., Duncan, R.A., Allan, J.F. & Brooks, K.) 163–166(Ocean Drilling Program, College Station, TX, 1999)
15. Stickley, C. E. et al. Evidence for middle Eocene Arctic sea ice from diatomsand ice-rafted debris. Nature 460, 376–379 (2009).
16. Moran, K. et al. The Cenozoic palaeoenvironment of the Arctic Ocean. Nature441, 601–605 (2006).
17. Stickley, C. E. et al. Variability in the length of the sea ice season in the MiddleEocene Arctic. Geology 40, 727–730 (2012).
18. Miller, K. G., Fairbanks, R. G. & Mountain, G. S. Tertiary oxygen isotopesynthesis, sea level history, and continental margin erosion. Paleoceanography2, 1–19 (1987).
19. Shackleton, N. J. & Kennett, J. P. Paleotemperature history of the Cenozoicand the initiation of Antarctic glaciation: Oxygen and carbon isotope analysesin DSDP sites 277, 279, and 281. In Initial Reports of the Deep Sea DrillingProject 29, 743–755 (1975).
20. Zachos, J. C., Quinn, T. M. & Salamy, K. A. High-resolution(104 years) deep-sea foraminiferal stable isotope records of the Eocene-Oligocene climatetransition. Paleoceanography 11, 251–266 (1996).
21. Coxall, H. K., Wilson, P. A., Palike, H., Lear, C. H. & Backman, J. Rapidstepwise onset of Antarctic glaciation and deeper calcite compensation in thePacific Ocean. Nature 433, 53–57 (2005).
22. Cramer, B. S., Miller, K. G., Barrett, P. J. & Wright, J. D. LateCretaceous–Neogene trends in deep ocean temperature and continental icevolume: Reconciling records of benthic foraminiferal geochemistry (δ18O andMg/Ca) with sea level history. J. Geophys. Res. Oceans 116, C12023 (2011).
23. Stein, R. et al. Cenozoic Arctic ocean climate history: some highlights from theintegrated ocean drilling program Arctic coring expedition. In Earth LifeProcesses Discovered from Subseafloor Environments: A Decade of ScienceAchieved by the Integrated Ocean Drilling Program (IODP) (eds. Stein, R.,Blackman, D. K., Inagaki F. & Larsen, H), 259–293 (2014).
24. Stein, R. et al. Evidence for ice-free summers in the late Miocene central Arcticocean. Nat. Commun. 7, 11148 (2016).
25. Weller, P. & Stein, R. Paleogene biomarker records from the central ArcticOcean (Integrated Ocean Drilling Program Expedition 302): Organic carbonsources, anoxia, and sea surface temperature. Paleoceanography 23, PA1S17(2008).
26. Levy, R. et al. Antarctic ice sheet sensitivity to atmospheric CO2 variations inthe early to mid-Miocene. Proc. Natl Acad. Sci. 113, 3453–3458 (2016).
27. Helland, P. E. & Holmes, M. A. Surface textural analysis of quartz sand grainsfrom ODP Site 918 off the southeast coast of Greenland suggests glaciation ofsouthern Greenland at 11 Ma. Palaeogeog. Palaeoclim. Palaeoecol. 135,109–121 (1997).
28. Miller, K. G. et al. The Phanerozoic record of global sea-level change. Science310, 1293–1298 (2005).
29. Winkler, A., Wolf-Welling, T., Stattegger, K. & Thiede, J. Clay mineralsedimentation in high northern latitude deep-sea basins since the MiddleMiocene (ODP Leg 151, NAAG). Int. J. Earth Sci. 91, 133–148 (2002).
30. Wise Jr, S. W., Breza, J. R., Harwood, D. M., Wei, W., & Zachos, J. Paleogeneglacial history of Antarctica in light of leg 120 drilling results. In Proceedings ofthe Ocean Drilling Program, Scientific Results Vol. 120 (eds. Wise, S. W. et al.)1001–1030 (Ocean Drilling Program, College Station, TX, 1992)
31. Barrett, P. J. Antarctic Cenozoic History from CIROS-1 Drill Hole, McMurdoSound, DSIR Bulletin No. 245 (1989).
32. Barron, E. J. Explanations of the tertiary global cooling trend. Palaeogeogr.Palaeoclimatol. Palaeoecol. 50, 45–61 (1985).
33. McDougall, I. & Wensink, H. Paleomagnetism and geochronology of thePliocene-Pleistocene lavas in Iceland. Earth Planet Sci. Lett. 1, 232–236 (1966).
ARTICLE NATURE COMMUNICATIONS | DOI: 10.1038/s41467-018-03180-5
10 NATURE COMMUNICATIONS | (2018) 9:1038 | DOI: 10.1038/s41467-018-03180-5 | www.nature.com/naturecommunications
34. Shackleton, N. J. et al. Oxygen isotope calibration of the onset of ice-raftingand history of glaciation in the North Atlantic region. Nature 307, 620–623(1984).
35. Ruddiman, W. F. & Raymo, M. E. Northern Hemisphere climate regimesduring the past 3 Ma: possible tectonic connections. Philos. Trans. R. Soc.Lond. B 318, 411–430 (1988).
36. Krissek, L. A. Late Cenozoic ice-rafting records from Leg 145 sites in theNorth Pacific: late Miocene onset, late Pliocene intensification, and Pliocene–Pleistocene events. in Proceedings of the Ocean Drilling Program, ScienceResults Vol. 145 (eds. Rea, D. K., Basov, I. A., Scholl, D. W. & Allan, J. F.)179–194 (Ocean Drilling Program, College Station, TX, 1995).
37. Darby, D. A. Ephemeral formation of perennial sea ice in the Arctic Oceanduring the middle Eocene. Nat. Geosci. 7, 210–213 (2014).
38. Lear, C., Elderfield, H. & Wilson, P. Cenozoic deep-sea temperatures andglobal ice volumes from Mg/Ca in benthic foraminferal calcite. Science 287,269–272 (2000).
39. Elderfield, H. et al. A record of bottom water temperature and seawater δ18Ofor the Southern Ocean over the past 440 kyr based on Mg/Ca of benthicforaminiferal Uvigerina spp. Quat. Sci. Rev. 29, 160–169 (2010).
40. Tripati, A. K. et al. Tropical sea-surface temperature reconstruction for theearly Paleogene using Mg/Ca ratios of planktonic foraminifera.Paleoceanography 18, https://doi.org/10.1029/2003PA000937 (2003).
41. Tripati, A. K. & Elderfield, H. Deep-sea temperature and circulation changesat the Paleocene-Eocene Thermal Maximum. Science 308, 1894–1898(2005).
42. Pearson, P. & Palmer, M. Atmospheric carbon dioxide concentrations over thepast 60 million years. Nature 406, 695–699 (2000).
43. Darby, D. A., Myers, W., Herman, S. & Nicholson, B. ChemicalFingerprinting, A Precise and Efficient Method To Determine SedimentSources. J. Sediment. Res. 85, 247–253 (2015).
44. Andrews, J. T., Bigg, G. R. & Wilton, D. Holocene ice-rafting and sedimenttransport from the glaciated margin of East Greenland (67-70°N) to the NIceland shelves: Detecting and modelling changing sediment sources. Quat.Sci. Rev. 91, 204–217 (2014).
45. Wilton, D., Bigg, G. R. & Hanna, E. Modelling twentieth century global oceancirculation and iceberg flux at 48°N: implications for west Greenland icebergdischarge. Prog. Oceanogr. 138, 194–1210 (2015).
46. Martin, T. & Wadhams, P. Sea-ice flux in the East Greenland Current. DeepSea Res. Part II Top. Stud. Oceanogr. 46, 1063–1082 (1999).
47. Handoh, I. C., Bigg, G. R. & Jones, E. J. W. Evolution of upwelling in theAtlantic Ocean basin. Palaeogeogr. Palaeoclimatol. Palaeoecol. 202, 31–58(2003).
48. Tremblay, L. B., Schmidt, G. A., Pfirman, S., Newton, R. & Derepentigny, P. Isice-rafted sediment in a North Pole marine record evidence for perennial sea-ice cover? Philos. Trans. R. Soc. A 373, 20140168 (2015).
49. Poulain, P.-M., Warn-Varnas, A. & Niiler, P. P. Near-surface circulation of theNordic seas as measured by Lagrangian drifters. J. Geophy Res 101, 237–258(1996).
50. Hemming, S. R. Heinrich events: massive late Pleistocene detritus layers of theNorth Atlantic and their global climate imprint. Rev. Geophys. 42, 1–43(2004).
51. Heburn, G. W. & Johnson, C. D. Simulations of the mesoscale circulation ofthe Greenland-Iceland-Norwegian Seas. J. Geophys. Res. 100, 4921–4941(1995).
52. Aukrust, T. & Oberhuber, J. M. Modeling of the Greenland, Iceland, andNorwegian Seas with a coupled sea ice—mixed layer—isopycnal ocean model.J. Geophys. Res. 100, 4771–4789 (1995).
53. Peters, S. E., Carlson, A. E., Kelly, D. C. & Gingerich, P. D. Large-scaleglaciation and deglaciation of Antarctica during the Late Eocene. Geology 38,723–726 (2010).
54. Pekar, S. F., Hucks, A., Fuller, M. & Li, S. Glacioeustatic changes in the earlyand middle Eocene (51-42 Ma): Shallow-water stratigraphy from ODP Leg189 1171 (South Tasman Rise) and deep-sea d18O records. GSA Bull. 117,1081–1093 (2005).
55. Browning, J., Miller, K. & Pak, D. Global implications of Eocene Greenhouseand Doubthouse sequences on the New Jersey coastal plain; the Icehousecometh. Geology 24, 639–642 (1996).
56. Beerling, D. J. & Royer, D. L. Convergent Cenozoic CO2 history. Nat. Geosci.4, 418–420 (2011).
57. Franks, P. J. et al. New constraints on atmospheric CO2 concentration for thePhanerozoic. Geophys. Res. Lett. 41, 4685–4694 (2014).
58. Pälike, H. et al. A Cenozoic record of the equatorial Pacific carbonatecompensation depth. Nature 488, 609–614 (2012).
59. Ehrmann, W. U. et al. History of Antarctic glaciation: An Indian OceanPerspective. In Synthesis of results from scientific Drilling in the Indian Ocean(eds. Duncan, R. A. & Rea, D.) 423–446 (American Geophysical Union,Washington, D.C., 1992).
60. Ehrmann, W. U. & Mackensen, A. Sedimentologic evidence for the formationof an East Antarctic ice sheet in Eocene/Oligocene time. Palaeogeogr.Palaeoclim. Palaeoecol. 93, 85–112 (1992).
61. Bohaty, S. & Zachos, J. Significant southern ocean warming event in the latemiddle Eocene. Geology 31, 1017–1020 (2003).
62. Kennett, J. P. Cenozoic evolution of antartic glaciation, the circum-AntarticOcean, and their impact on global paleoceanography. J. Geophys. Res. 82,3843–3860 (1977).
63. Lawver, L. A. & Gahagan, L. M. Opening of the Drake Passage and its impacton Cenozoic ocean circulation. In Tectonic Boundary Conditions for ClimateReconstructions (eds. Crowley, T. J. & Burke, K. C.) 212–223 (OxfordUniversity Press, Oxford, UK, 1998).
64. Haug, G. H. & Tiedemann, R. Effect of the formation of the Isthmus ofPanama on Atlantic Ocean thermohaline circulation. Nature 393, 673–676(1998).
65. Lunt, D. J. Late Pliocene Greenland glaciation controlled by a decline inatmospheric CO2 levels. Nature 454, 1102–1105 (2008).
66. DeConto, R. et al. Thresholds for Cenozoic bipolar glaciation. Nature 455,652–656 (2008).
67. Eldrett, J. S., Harding, I. C., Firth, J. V. & Roberts, A. P. Magnetostratigraphiccalibration of Eocene-Oligocene dinoflagellate cyst biostratigraphy from theNorwegian-Greenland Sea. Mar. Geol. 204, 91–127 (2004).
68. Backman, J. et al. Age model and core-seismic integration for the CenozoicArctic Coring Expedition sediments from the Lomonosov Ridge.Paleoceanography. 23, PA1S03 (2008).
69. Poirier, A. & Hillaire-Marcel, C. Improved Os-isotope stratigraphy of theArctic Ocean. Geophys. Res. Lett. 38, L14607 (2011).
70. Valdimarsson, H. & Malmberg, S.-A. Near-surface circulation in Icelandicwaters derived from satellite tracked drifters. Rit Fisk. 16, 23–40 (1999).
AcknowledgementsThis manuscript is dedicated to the memory of Michele Darby. We thank Robert Eaglefor initiating this study, Ruediger Stein, Kate Ledger, Franek Hasiuk, Beth Caissie, and AlWanamaker, Jr. for their comments on earlier drafts of this manuscript. This project usessamples from the Integrated Ocean Drilling Program. The Fe grain analyses were sup-ported by NSF grant NSF-ARC 1107942. A.T. acknowledges support from the Depart-ment of Energy through BES grant DE-FG02-13ER16402 and NSF through CAREERaward EAR-1325054. This work was also supported by the “Laboratoire d’Excellence”LabexMER (ANR-10-LABX-19) and co-funded by a grant from the French governmentunder the program “Investissements d’Avenir”.
Author contributionsA.T. and D.D. contributed equally to this work.
Additional informationSupplementary Information accompanies this paper at https://doi.org/10.1038/s41467-018-03180-5.
Competing interests: The authors declare no competing interests.
Reprints and permission information is available online at http://npg.nature.com/reprintsandpermissions/
Publisher's note: Springer Nature remains neutral with regard to jurisdictional claims inpublished maps and institutional affiliations.
Open Access This article is licensed under a Creative CommonsAttribution 4.0 International License, which permits use, sharing,
adaptation, distribution and reproduction in any medium or format, as long as you giveappropriate credit to the original author(s) and the source, provide a link to the CreativeCommons license, and indicate if changes were made. The images or other third partymaterial in this article are included in the article’s Creative Commons license, unlessindicated otherwise in a credit line to the material. If material is not included in thearticle’s Creative Commons license and your intended use is not permitted by statutoryregulation or exceeds the permitted use, you will need to obtain permission directly fromthe copyright holder. To view a copy of this license, visit http://creativecommons.org/licenses/by/4.0/.
© The Author(s) 2018
NATURE COMMUNICATIONS | DOI: 10.1038/s41467-018-03180-5 ARTICLE
NATURE COMMUNICATIONS | (2018) 9:1038 | DOI: 10.1038/s41467-018-03180-5 | www.nature.com/naturecommunications 11