Embed Size (px)
Citation preview

Population Targeting: Tools for Social Marketing
Geodemographics in ActionWe test drive Mosaic, P2 People &Places and National Statistics 2001 AreaClassifications
Everyone’stalking about...
SocialMarketing> More Inside
bringing together policy, evidence and intelligence
2 Synthesis. December 2006. Issue 6
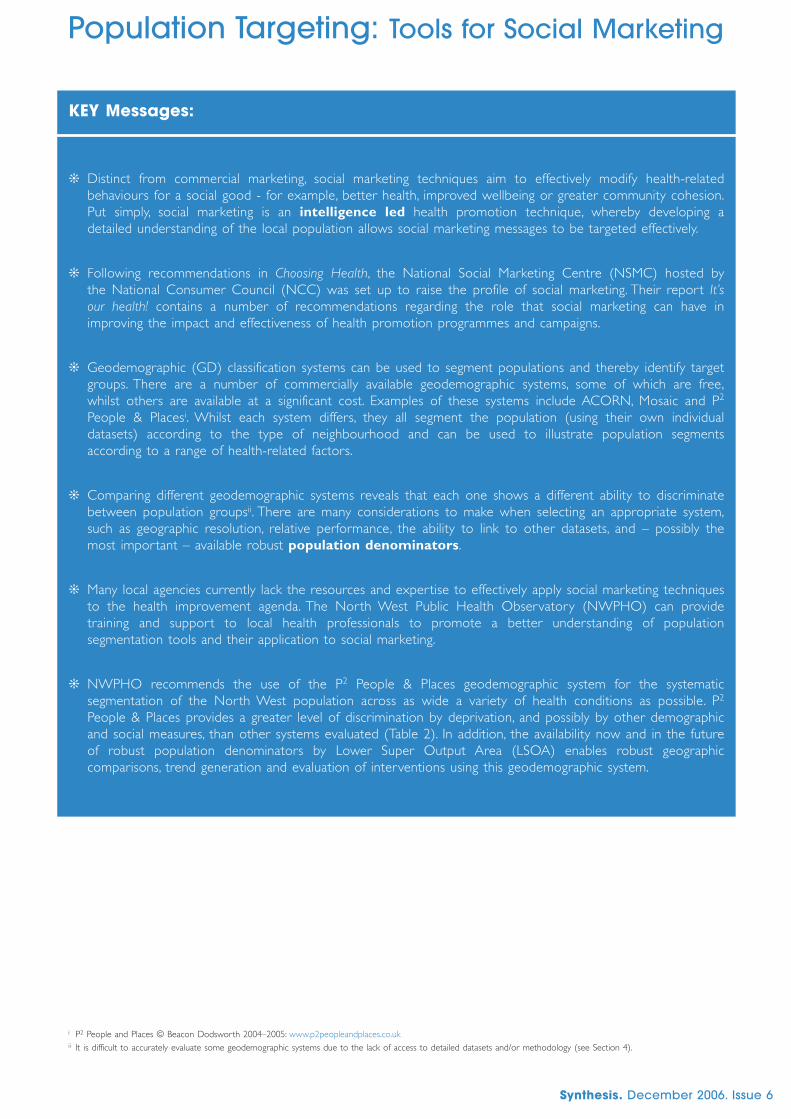
KEY Messages:
� Distinct from commercial marketing, social marketing techniques aim to effectively modify health-relatedbehaviours for a social good - for example, better health, improved wellbeing or greater community cohesion.Put simply, social marketing is an intelligence led health promotion technique, whereby developing adetailed understanding of the local population allows social marketing messages to be targeted effectively.
� Following recommendations in Choosing Health, the National Social Marketing Centre (NSMC) hosted bythe National Consumer Council (NCC) was set up to raise the profile of social marketing. Their report It’sour health! contains a number of recommendations regarding the role that social marketing can have inimproving the impact and effectiveness of health promotion programmes and campaigns.
� Geodemographic (GD) classification systems can be used to segment populations and thereby identify targetgroups. There are a number of commercially available geodemographic systems, some of which are free,whilst others are available at a significant cost. Examples of these systems include ACORN, Mosaic and P2
People & Placesi. Whilst each system differs, they all segment the population (using their own individualdatasets) according to the type of neighbourhood and can be used to illustrate population segmentsaccording to a range of health-related factors.
� Comparing different geodemographic systems reveals that each one shows a different ability to discriminatebetween population groupsii. There are many considerations to make when selecting an appropriate system,such as geographic resolution, relative performance, the ability to link to other datasets, and – possibly themost important – available robust population denominators.
� Many local agencies currently lack the resources and expertise to effectively apply social marketing techniquesto the health improvement agenda. The North West Public Health Observatory (NWPHO) can providetraining and support to local health professionals to promote a better understanding of populationsegmentation tools and their application to social marketing.
� NWPHO recommends the use of the P2 People & Places geodemographic system for the systematicsegmentation of the North West population across as wide a variety of health conditions as possible. P2
People & Places provides a greater level of discrimination by deprivation, and possibly by other demographicand social measures, than other systems evaluated (Table 2). In addition, the availability now and in the futureof robust population denominators by Lower Super Output Area (LSOA) enables robust geographiccomparisons, trend generation and evaluation of interventions using this geodemographic system.
i P2 People and Places © Beacon Dodsworth 2004–2005: www.p2peopleandplaces.co.ukii It is difficult to accurately evaluate some geodemographic systems due to the lack of access to detailed datasets and/or methodology (see Section 4).
Population Targeting: Tools for Social Marketing

3 Synthesis. December 2006. Issue 6
1. INTRODUCTION
The National Social Marketing Centre for Excellence (NSMC) defines social marketing as1:
“the systematic application of marketing concepts and techniques to achieve specific behavioural goalsrelevant to a social good.”[p.4]
The UK cross-Government White Paper, Choosing Health: Making Healthy Choices Easier2,announced a major review of health-related social marketing, and recommended that a nationalstrategy for health should include a social marketing component. As part of the associated deliveryplans and Public Service Agreements (PSAs), the Department of Health (DH) is planning andimplementing a number of social marketing campaigns and initiatives. There is growing evidence,particularly from North America and Australia, for the effectiveness of social marketinginterventions in modifying health-related behaviours.
This report provides a brief introduction to social marketing, with particular reference to the valueof geodemographic (GD) segmentation systems for gaining customer insight and targetinginterventions more effectively.
What is Social Marketing?
Social marketing is the latest addition to the existing range of intervention options (education,legislation, community mobilisation, media advocacy, etc.) for achieving behaviour change. Kotlerand Zaltman introduced the term ‘social marketing’ in 19713, defining it as:
“…the design, implementation, and control of programs calculated to influence the acceptability ofsocial ideas and involving considerations of product planning, pricing, communication, distribution, andmarketing research.” [p.5]
Their paper queried whether marketing concepts and techniques could be applied to ‘sell’ orpromote social objectives such as safe driving or healthy eating. It describes key concepts andrequisite conditions for effective marketing campaigns, encapsulated in the ‘four Ps of marketing’(see Box 1), and how they might be applied to social causes. Theoretical development of this field,particularly in North America, was rapid (and led to a number of attempts to identify additionalareas of influence which build on the ‘four Ps of marketing’4; 5, examples of which can be found inBox 1).
In recent years, a number of alternative definitions for social marketing have been suggested; forexample, the UK Social Marketing Strategy for Health defines it as:
“…integrated, sustained and coordinated approach based on a deep understanding of people’scircumstances, values, desires and their perception of the costs and benefits associated withchange….”6
Both definitions convey the idea of a carefully planned process; for example, long and short-termevaluation phases are integral components of the social marketing intervention. Other, simplerdefinitions have been proposed (as in the introduction above), most of which capture the centralidea of applying commercial marketing techniques to bring about positive health or social change.Health-related social marketing has its own definitions. The one utilised by the DH1 is:
“…the systematic application of marketing concepts and techniques to achieve specific behaviouralgoals relevant to improving health and reducing health inequalities.” [p.31]
Population Targeting: Tools for Social Marketing

4 Synthesis. December 2006. Issue 6
Box 1: The four Ps of marketing4; 5
� Product: having carefully defined the social idea in terms of behaviour change, the marketer must identifyand segment the target market and repackage the idea into a range of more tangible products which thetarget audiences can buy (into).
� Promotion: the marketer uses knowledge of the target markets, and an appreciation of the prevailing socialand political context, to encourage people to buy into the social objective. In this area, there is an importantcontribution to be made by behavioural and social scientists, psychologists, anthropologists and others whodevelop theories about human behaviours and how they can be modified.
� Place: the marketing messages need to be disseminated via channels that are suitable and accessible for thetarget markets. Equally importantly, the marketer needs to provide ‘action channels’, which enable motivatedindividuals to buy the product. Considering the issue of climate change, most people are aware of themessage that something needs to be done. However, the frustration engendered by a perceived lack ofaction channels may eventually lead individuals to ‘switch off ’ whenever the issue is raised.
� Price: represents the costs that an individual must bear when adopting a change in behaviour, orequivalently, the size of the barriers to change.
Other Ps4; 5
� Publics: programmes may need to address more than one ‘public’. The target audience outsideof the organisation may comprise more than one defined group, as well as policymakers and gatekeepers.Within the organisation, other publics include frontline staff involved in implementation, budgetholders, and others involved in approving programmes.
� Partnership: co-ordination among organisations with similar goals leads to a more consistent approach andless chance of confusion due to conflicting messages; ‘threshold effects’ mean that some campaigns areunlikely to be successful unless there a ‘critical mass’ of support for the programme, and this is more likely ifseveral organisations are involved.
� Policy: apply social marketing techniques and media advocacy to encourage policy makers to support a ims .Structural changes as a result of policy development and/or legislation can influence the context inwhich social marketing campaigns take place, and increase the sustainability of individuals’ behaviour change.
� Positioning: consider the ‘psychological distance’ of the product from related products and activities. Forexample, repositioning physical activity as a mode of relaxation may make it more attractive to certainaudiences than if it were touted as a means to achieve better health.
� Purse strings: how the funding for a particular campaign will be obtained.
Social marketing is ultimately an intelligence led health promotion technique. The key element ofthis technique is customer orientation7; 8, obtaining a deep understanding of the local population inorder to target them with appropriate messages. The diversity of populations means thatemploying a ‘one size fits all’ approach is unsuitable; a campaign that runs successfully in Londonmay not be suitable to the population of the North West. Similarly, a campaign targeted at a ruralpopulation may not be successful within an urban population. It is therefore important to gain theright local picture to allow the social marketing campaign to have maximum impact.
In the UK, the NSMC regards six core concepts or principles to be essential for a successful socialmarketing campaign. These concepts are detailed in Box 2.
Population Targeting: Tools for Social Marketing

5 Synthesis. December 2006. Issue 6
Box 2: Six core concepts required for a successful social marketingcampaign1
Strong customer focus: it is important to develop real insight into the lives and experiences of the intendedaudience. Without this insight, the preconceived notions, faulty assumptions, and indeed prejudices, of themarketer towards the audience are likely to dominate and lead to the development of interventions that arenot well suited to the target audience. Focus groups and other kinds of qualitative research are often used todevelop insight about knowledge, attitudes, values and beliefs of target groups. An understanding of the relevantsocial and political context is also important, as is the interaction with individual factors.
Defined behavioural goals/outcomes: the ‘social good’ in health-related campaigns needs to be defined interms of specific, realistic, and measurable changes in behaviour. Successful marketing strategies will include anevaluation or monitoring component, and the better defined a behavioural outcome, the easier this process willbe.
Application of the concept of ‘exchange’: exemplified in the exchange of money for goods or services inthe commercial market, the exchange involved in social marketing may be more difficult to recognise. Adoptingand maintaining behavioural change comes at a cost to the person making the change. These costs might befinancial (e.g. joining a gym, travelling further to find fresh produce), but other types of cost include time andeffort; social consequences (e.g. making one's home a smokefree zone could result in fewer visits from friendswho smoke); and deferral of gratification (e.g. nicotine withdrawal).
Well developed audience ‘segmentation’: segmentation performs a number of functions. First, it helps tofocus on small, relatively homogeneous groups, rather than trying to describe and address the heterogeneity ofthe whole population. This potentially leads to deeper understanding of the audience and consequently a bettertailored marketing mix. It also facilitates the physical targeting of the marketing strategy (in terms of person,place and time).
Encouraging and supporting ‘voluntary actions’: long lasting behavioural change is more likely whenindividuals adopt change through rational choice. Changing behaviour may therefore involve trying to increaseincentives for change or tackling attitudes or beliefs that discourage change. Social marketers are not usually in aposition to introduce legislative changes, which can have a significant impact on a behaviour (e.g. alcohol licensinglaws, or excise duty on tobacco products). However, social marketing techniques may be directed towards keypolicy and decision makers, with the express aim of encouraging them to adopt new legislation which is in linewith public health policy.
Application of the concept of ‘competition’: as consumers with ‘disposable income’ we face a dailybarrage of advertising material because commercial concerns must compete for a share of that disposableincome. In the same way, the ‘offer’ being made in a social marketing campaign will always face competition.Sources of competition can be internal - for example, the pleasure associated with the unhealthy behaviour, or apsychological resistance to symbols of authority. External sources of competition could include direct countermessages (e.g. ‘chocolate helps you unwind’), other health messages, or competition for time and attention.
Population Targeting: Tools for Social Marketing
6 Synthesis. December 2006. Issue 6
2. POLICY CONTEXT
Along with its associated delivery documents and Public Service Agreements (PSAs), ChoosingHealth2 is the single most important policy driver to date for health-related social marketing in theUK. The arguments for adopting a stronger marketing approach towards health improvementinitiatives and activity are laid out in Chapter 2, “Health in the Consumer Economy”. This chapterfocuses on the public as consumers and the influence that the media has within our lives. Itrecognises the need to deliver consistent messages on health (using social marketing techniques)that are easy for individuals to act upon, rather than adding to the already overwhelming amountof information that tells people what is or isn’t ‘good for them’. In addition, it recognises theimportance of understanding different population needs and the variation in choice due todiffering ethnicity, level of deprivation, socio-economic status, etc. The recent Our health, our care,our say9 report builds on the commitments to health promotion and health improvement laid outwithin Choosing Health.
The National Consumer Council (NCC) is the independent non-departmental body charged withdevelopment and implementation of social marketing activity in the UK. Produced by the NCCand commissioned by the DH (as part of its delivery of the commitments detailed in ChoosingHealth), the first National Review of Social Marketing for Health - It’s our health!10 was launched inJune 2006. The report makes recommendations on how health promotion programmes andcampaigns can include social marketing for improved impact and effectiveness. The five strategicobjectives identified within the report are:
1. Enhance a consumer-focused approach using the best social marketing principles andpractice; putting the consumer at centre of all development and delivery.
2. Increase the effective use of resources and their overall impact by better mobilising assets andresources.
3. Improve DH leadership, prioritisation and expert commissioning roles.
4. Build capacity and skills to integrate social marketing within existing strategies and interventionsat national and local level.
5. Reconfigure research and evaluation approaches for improved assessment of behavioural goalsand to generate shared learning.
The National Social Marketing Strategy for Health recommended that the Government shoulddevelop successful campaigns on smoking, sexual health, salt intake and mental wellbeing, whilstincorporating information on obesity, healthy eating and physical activity in different groups. Usingsocial marketing as a health promotion method is not exactly a new concept. Prior to ChoosingHealth, many health promotion campaigns had a social marketing element; they used marketingtechniques to encourage behavioural change, but the campaigns might not necessarily have beenspecifically or locally ‘targeted’. Many of these campaigns were developed in response toGovernment policy and were therefore related to performance targets. Some examples of suchcampaigns are detailed in Section 5.
Population Targeting: Tools for Social Marketing

7 Synthesis. December 2006. Issue 6
3. EVIDENCE
Although a wide range of health promotion and social marketing style campaigns and programmesexist, there are few examples of published reviews or evaluations of this work10. Comments byWanless11 on the relative shortage of experimental or observational evidence for the effectivenessand cost-effectiveness of public health interventions are equally valid for social marketing in theUK. The report It’s our health! highlighted the lack of a commonly applied approach to theevaluation process, and thus recommended that effective research and evaluation should beincorporated into the development of programmes and campaigns to maximise their value. Whenplanning a social marketing campaign it is vital that adequate time and resources are allocated foran evaluation phase to be conducted to allow the impact, outcome, process and cost-effectivenessof the campaign to be determined1. The evaluation of social marketing campaigns can improvetheir credibility by determining what has worked, but just as importantly, what hasn’t.
Whilst there is a clear desire on some parts to place public health practice on the same footingas evidence-based clinical medicine (EBM), several commentators have pointed out obstacles tothis activity, not least the difficulty of synthesising non-randomised evidence from complexinterventions with much ‘softer’ outcomes than are commonly used in clinical trials12. Aside fromthis, there are a number of critiques of EBM which are clearly relevant to public health13. Inresponse to this gap, a number of initiatives are being planned or are underway to improve theevidence base for social marketing, and public health interventions more generally. For sources ofUK and international evidence, see Box 3.
Population Targeting: Tools for Social Marketing
8 Synthesis. December 2006. Issue 6
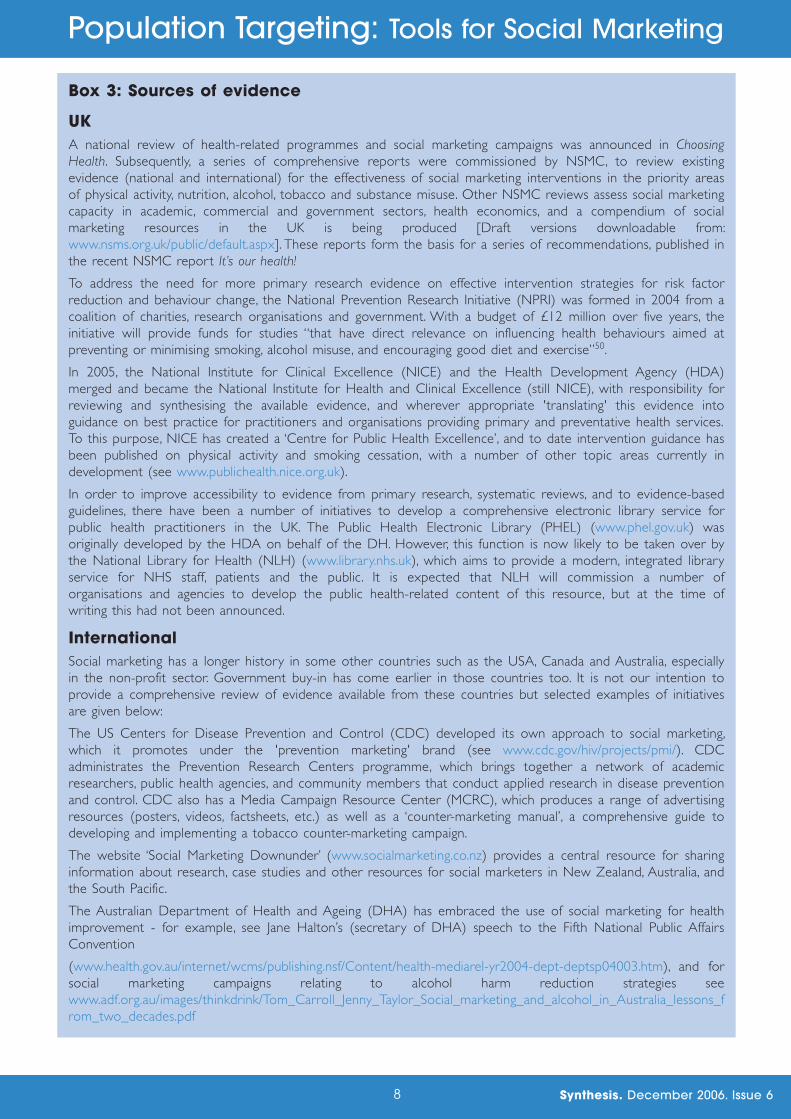
Box 3: Sources of evidence
UKA national review of health-related programmes and social marketing campaigns was announced in ChoosingHealth. Subsequently, a series of comprehensive reports were commissioned by NSMC, to review existingevidence (national and international) for the effectiveness of social marketing interventions in the priority areasof physical activity, nutrition, alcohol, tobacco and substance misuse. Other NSMC reviews assess social marketingcapacity in academic, commercial and government sectors, health economics, and a compendium of socialmarketing resources in the UK is being produced [Draft versions downloadable from:www.nsms.org.uk/public/default.aspx]. These reports form the basis for a series of recommendations, published inthe recent NSMC report It’s our health!
To address the need for more primary research evidence on effective intervention strategies for risk factorreduction and behaviour change, the National Prevention Research Initiative (NPRI) was formed in 2004 from acoalition of charities, research organisations and government. With a budget of £12 million over five years, theinitiative will provide funds for studies “that have direct relevance on influencing health behaviours aimed atpreventing or minimising smoking, alcohol misuse, and encouraging good diet and exercise”50.
In 2005, the National Institute for Clinical Excellence (NICE) and the Health Development Agency (HDA)merged and became the National Institute for Health and Clinical Excellence (still NICE), with responsibility forreviewing and synthesising the available evidence, and wherever appropriate 'translating' this evidence intoguidance on best practice for practitioners and organisations providing primary and preventative health services.To this purpose, NICE has created a ‘Centre for Public Health Excellence’, and to date intervention guidance hasbeen published on physical activity and smoking cessation, with a number of other topic areas currently indevelopment (see www.publichealth.nice.org.uk).
In order to improve accessibility to evidence from primary research, systematic reviews, and to evidence-basedguidelines, there have been a number of initiatives to develop a comprehensive electronic library service forpublic health practitioners in the UK. The Public Health Electronic Library (PHEL) (www.phel.gov.uk) wasoriginally developed by the HDA on behalf of the DH. However, this function is now likely to be taken over bythe National Library for Health (NLH) (www.library.nhs.uk), which aims to provide a modern, integrated libraryservice for NHS staff, patients and the public. It is expected that NLH will commission a number oforganisations and agencies to develop the public health-related content of this resource, but at the time ofwriting this had not been announced.
InternationalSocial marketing has a longer history in some other countries such as the USA, Canada and Australia, especiallyin the non-profit sector. Government buy-in has come earlier in those countries too. It is not our intention toprovide a comprehensive review of evidence available from these countries but selected examples of initiativesare given below:
The US Centers for Disease Prevention and Control (CDC) developed its own approach to social marketing,which it promotes under the 'prevention marketing' brand (see www.cdc.gov/hiv/projects/pmi/). CDCadministrates the Prevention Research Centers programme, which brings together a network of academicresearchers, public health agencies, and community members that conduct applied research in disease preventionand control. CDC also has a Media Campaign Resource Center (MCRC), which produces a range of advertisingresources (posters, videos, factsheets, etc.) as well as a ‘counter-marketing manual’, a comprehensive guide todeveloping and implementing a tobacco counter-marketing campaign.
The website ‘Social Marketing Downunder’ (www.socialmarketing.co.nz) provides a central resource for sharinginformation about research, case studies and other resources for social marketers in New Zealand, Australia, andthe South Pacific.
The Australian Department of Health and Ageing (DHA) has embraced the use of social marketing for healthimprovement - for example, see Jane Halton’s (secretary of DHA) speech to the Fifth National Public AffairsConvention
(www.health.gov.au/internet/wcms/publishing.nsf/Content/health-mediarel-yr2004-dept-deptsp04003.htm), and forsocial marketing campaigns relating to alcohol harm reduction strategies seewww.adf.org.au/images/thinkdrink/Tom_Carroll_Jenny_Taylor_Social_marketing_and_alcohol_in_Australia_lessons_from_two_decades.pdf
Population Targeting: Tools for Social Marketing

9 Synthesis. December 2006. Issue 6
4. INTELLIGENCE: Geodemographics for Population Segmentation
Successful social marketing relies on in-depth knowledge of the target population to ensure thatthe right message is getting to the right people. Currently, the most useful tools for learning moreabout a population are geodemographic (GD) classification systems. These systems are usedextensively in commercial marketing programmes, primarily as a tool for audience segmentationand targeting14. GD systems aim to classify the population according to the type of neighbourhoodin which they live, and are constructed using data from a range of sources, including the 2001Census, socio-economic factors, housing type, consumer behaviours and preferences, and lifestylefactors15. The use of 2001 Census data leads naturally to a classification of Census Output Areas(OAs), but other classifications incorporate additional data from a range of lifestyle and marketresearch databases and other sources, with the intention to generate a classification at unitpostcode level16.
GD systems are of great potential value for social marketing purposes and, as with commercialmarketing, can be put to a use in a number of ways17; 18, such as identifying and locating targetgroups, gaining insight into population behaviour and beliefs, mapping areas/groups with the highestneed and identifying control areas (Box 4).
Box 4: Applications of geodemographic classification systems for socialmarketing purposes� Identifying potential target groups or areas for social marketing interventions27; 30; 51. Further investigationscan then be carried out in order to develop deeper insight into the relevant characteristics of the targetgroups or areas.
� Gaining insight about potential target groups: either using the detailed descriptive data on housing type,careers, income, consumption patterns, media access, attitudes, etc. which is available for each type orcategory in most GD systems, or by linking GD data with other research, marketing, and health-related datasets.
� Mapping potential target groups identified using other means onto a GD classification, to providea powerful visual tool for defining geographical boundaries for an intervention, or for planning and locatingnew services.
� Identifying ‘control’ or comparison areas, made up of similar GD types, but in which nointervention takes place. Such comparisons can be relatively informal, but experimental evidence could beobtained from appropriately designed cluster randomised trials.
Variety of Geodemographic Systems
There are a growing number of commercial GD classification systems (such as ACORN, Mosaic, P2
People & Places, CAMEO, Personicx), as well as the free 2001 Area Classification19 produced bythe Office for National Statistics (ONS) and the School of Geography, University of Leeds(www.geog.leeds.ac.uk/wpapers/05-2.pdf). Box 5 contains descriptions of these commonly usedGD systems and a comparison of their features is detailed in Table 1. Some commercialdevelopers produce more than one classification, or repackage the same system for differenttarget markets, leading to even more choice. Most systems employ a hierarchical structure,identifying broad neighbourhood types that can be further broken down into subtypes accordingto the level of detailed required.
Population Targeting: Tools for Social Marketing
10 Synthesis. December 2006. Issue 6
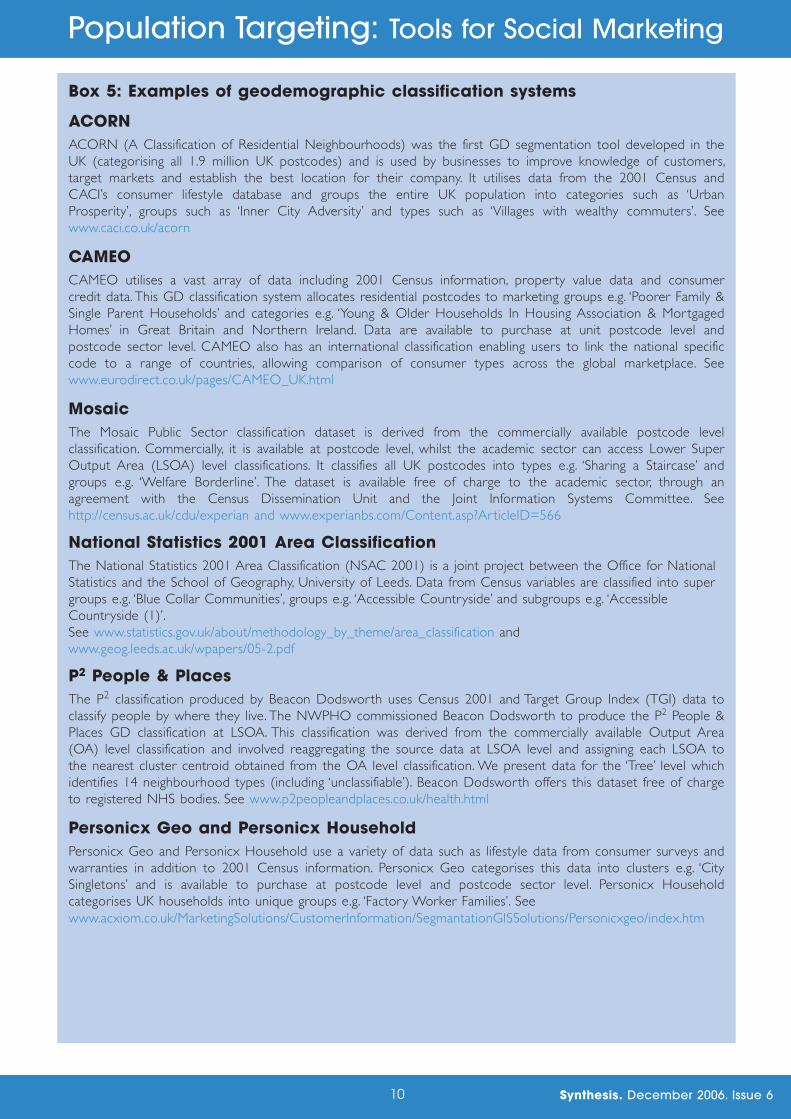
Box 5: Examples of geodemographic classification systems
ACORNACORN (A Classification of Residential Neighbourhoods) was the first GD segmentation tool developed in theUK (categorising all 1.9 million UK postcodes) and is used by businesses to improve knowledge of customers,target markets and establish the best location for their company. It utilises data from the 2001 Census andCACI’s consumer lifestyle database and groups the entire UK population into categories such as ‘UrbanProsperity’, groups such as ‘Inner City Adversity’ and types such as ‘Villages with wealthy commuters’. Seewww.caci.co.uk/acorn
CAMEOCAMEO utilises a vast array of data including 2001 Census information, property value data and consumercredit data. This GD classification system allocates residential postcodes to marketing groups e.g. ‘Poorer Family &Single Parent Households’ and categories e.g. ‘Young & Older Households In Housing Association & MortgagedHomes’ in Great Britain and Northern Ireland. Data are available to purchase at unit postcode level andpostcode sector level. CAMEO also has an international classification enabling users to link the national specificcode to a range of countries, allowing comparison of consumer types across the global marketplace. Seewww.eurodirect.co.uk/pages/CAMEO_UK.html
MosaicThe Mosaic Public Sector classification dataset is derived from the commercially available postcode levelclassification. Commercially, it is available at postcode level, whilst the academic sector can access Lower SuperOutput Area (LSOA) level classifications. It classifies all UK postcodes into types e.g. ‘Sharing a Staircase’ andgroups e.g. ‘Welfare Borderline’. The dataset is available free of charge to the academic sector, through anagreement with the Census Dissemination Unit and the Joint Information Systems Committee. Seehttp://census.ac.uk/cdu/experian and www.experianbs.com/Content.asp?ArticleID=566
National Statistics 2001 Area ClassificationThe National Statistics 2001 Area Classification (NSAC 2001) is a joint project between the Office for NationalStatistics and the School of Geography, University of Leeds. Data from Census variables are classified into supergroups e.g. ‘Blue Collar Communities’, groups e.g. ‘Accessible Countryside’ and subgroups e.g. ‘AccessibleCountryside (1)’.See www.statistics.gov.uk/about/methodology_by_theme/area_classification andwww.geog.leeds.ac.uk/wpapers/05-2.pdf
P2 People & PlacesThe P2 classification produced by Beacon Dodsworth uses Census 2001 and Target Group Index (TGI) data toclassify people by where they live. The NWPHO commissioned Beacon Dodsworth to produce the P2 People &Places GD classification at LSOA. This classification was derived from the commercially available Output Area(OA) level classification and involved reaggregating the source data at LSOA level and assigning each LSOA tothe nearest cluster centroid obtained from the OA level classification. We present data for the ‘Tree’ level whichidentifies 14 neighbourhood types (including ‘unclassifiable’). Beacon Dodsworth offers this dataset free of chargeto registered NHS bodies. See www.p2peopleandplaces.co.uk/health.html
Personicx Geo and Personicx HouseholdPersonicx Geo and Personicx Household use a variety of data such as lifestyle data from consumer surveys andwarranties in addition to 2001 Census information. Personicx Geo categorises this data into clusters e.g. ‘CitySingletons’ and is available to purchase at postcode level and postcode sector level. Personicx Householdcategorises UK households into unique groups e.g. ‘Factory Worker Families’. Seewww.acxiom.co.uk/MarketingSolutions/CustomerInformation/SegmantationGISSolutions/Personicxgeo/index.htm
Population Targeting: Tools for Social Marketing

11 Synthesis. December 2006. Issue 6
Table 1: Comparison of features of geodemographic classification systems
Population Targeting: Tools for Social Marketing
ClassificationSystem
Produced by Geography No of Clusters(excluding'unclassified')***
Availability Constructionvariables*
A Classification ofResidentialNeighbourhoods(ACORN)52
CACIHousehold/Postcode sector/Individual
5 Categories
17 Groups
56 Types
Subscription
400
Census 2001(30%)
CACI consumerlifestyle survey(70%)
CAMEO UK53 CAMEO Unit postcode/Postcode sector
10 Groups
58 Categories Subscription
**Census 2001
Others e.g.consumer creditdata, individualresidency data
Mosaic54 Experian Household/Postcode sector
11 Groups
61 Types
243 Subtypes
Postcode sector:Subscription
~ 400
Census 2001(54%)
Uk ConsumerDynamicDatabase (46%)
LSOA(aggregated):Academic useonly (free)
National Statistics2001 AreaClassification(NSAC 2001)19
ONS Output Area (OA)
7 Super Groups
21 Groups
52 Subgroups
Free
41
Census 2001
P2 People &Places32
BeaconDodsworth
OA 13 Trees
40 Branches
156 Leaves
OA: Subscription ~ 200
Census 2001
Target GroupIndex (TGI) andothers
Lower SuperOutput Area(LSOA)
LSOA: freefor NHS
Personicx Geo55 AcxiomUnit postcode/Postcode sector 60 Clusters Subscription
**Census 2001
Acxiomdemographic,lifestyle andbehaviouraldatabases
PersonicxHousehold55
Acxiom Household 52 Groups Subscription
**Census 2001
Acxiomdemographic,lifestyle andbehaviouraldatabases
* The number of construction variables may not be directly comparable, since some producers do not clearly identify methodology. Thus a single variable listed for onesystem may have many component measures listed as separate variables within another system.
** Number of variables not publicly available.*** For a list of the clusters and their descriptions (where available) see www.nwpho.org.uk/synthesis/dec06
12 Synthesis. December 2006. Issue 6
One of the largest emerging commercial sources of information for GD classification systems isshopper loyalty schemes. The numerous loyalty reward card schemes in the UK gather informationon individual shopping habits, thus allowing companies to implement highly targeted marketingcampaigns, directly to individuals. The data collected also allows GD analysis for the very precisestocking of specific products tailored to local populations and the precise location of new outlets.Social marketing could successfully use these methods to target health campaigns andcollaborations with commercial organisations could be employed to encourage the commercialmarketing of healthy products. In 2005, the three largest loyalty schemes in the UK were asfollows:
1. With an estimated 18 million members20, the Boots Advantage card loyalty scheme is thelargest retail loyalty card scheme in the world. It is the only scheme in the UK that providestargeted, personal in-store offers21.
2. Operated by Loyalty Management UK, the Sainsbury’s Nectar card has some 16 millionmembers22. The scheme has numerous sponsors e.g. Ford, Talk Talk and Thomson23.
3. With a reward scheme membership in the region of 10 million, the supermarket giant Tescoare particularly good at using local population profiles for marketing purposes. They use adatabase called Crucible which contains information (demographics, socio-economic andlifestyle characteristics) on every UK household, regardless of whether they shop at Tesco24; 25.In addition to data provided directly by Tesco (e.g. from Clubcard applications), datafrom the electoral register, Census, land registry and many more is also input onto thedatabase. Profiling and targeting of this data is conducted using a software system known asZodiac, classifying consumers across a variety of categories (e.g. travel, living style, credit) thusrevealing how an individual shops26. Tesco has sold access to its database to other largeconsumer groups such as Sky, Gillette and Orange
24.
Given the enormous variety of GD systems available and the likely expansion in the future, thereare a variety of factors that should be considered when selecting a suitable classification system:geographic resolution, relative performance, the ability to link to other datasets, and possibly themost important for population health and wellbeing, the availability of robust populationdenominators (for more detail, see Box 6).
Population Targeting: Tools for Social Marketing

13 Synthesis. December 2006. Issue 6
Box 6: Factors affecting choice of geodemographic classification system� Granularity, or geographical resolution: generally, the choice of geography is between classifications atpostcode level (averaging around 17 households), and at Output Area (OA) level (around 150 persons). Theincreased detail of a postcode level classification potentially allows more refined targeting of directcommunications once a target group has been defined. However, identification of potential target groups orareas in the first place may involve comparison of illness rates or other health-related data, and reliableestimates of population denominators are not generally available below OA level. Similarly, linkage ofgeodemographics to other datasets requires that both are available at the same geography, and this is morelikely for OAs than for postcodes.
� Performance characteristics: the choice of variables used to construct the classification, and to describethe resultant clusters, and the actual cluster generation method used will determine the performancecharacteristics of the classification. Relative performance should be considered over a range of indicators toidentify systematic differences between classifications. Since few Primary Care Trusts (PCTs) and LocalAuthorities (LAs) will be looking to purchase more than one classification, a major consideration will beusability and potential for linkage to other datasets, rather than the subtle differences in performance.
� Potential for linkage to other datasets: this will be affected by the granularity of the classification. It isalso important to consider the availability of other local or regional datasets that have been mapped usingthe same classification. The potential for linking datasets from unrelated sources is likely to be greatest if localhealth and social care providers adopt the same GD classification or same geographic resolution(i.e. a common currency).
� Availability of denominators: there are currently no robust population denominators available atpostcode or postcode sector areas. Thus, whilst measures of health and wellbeing can be produced for GDclassifications at postcoded levels, age and sex-specific rates or ratios (and sometimes even crude rates),they cannot be produced for resident populations. At other geographies, such as LSOA or larger, age-specificpopulations are available and more robust comparisons between GD classes can be made.
Comparison of Three Geodemographic Systems
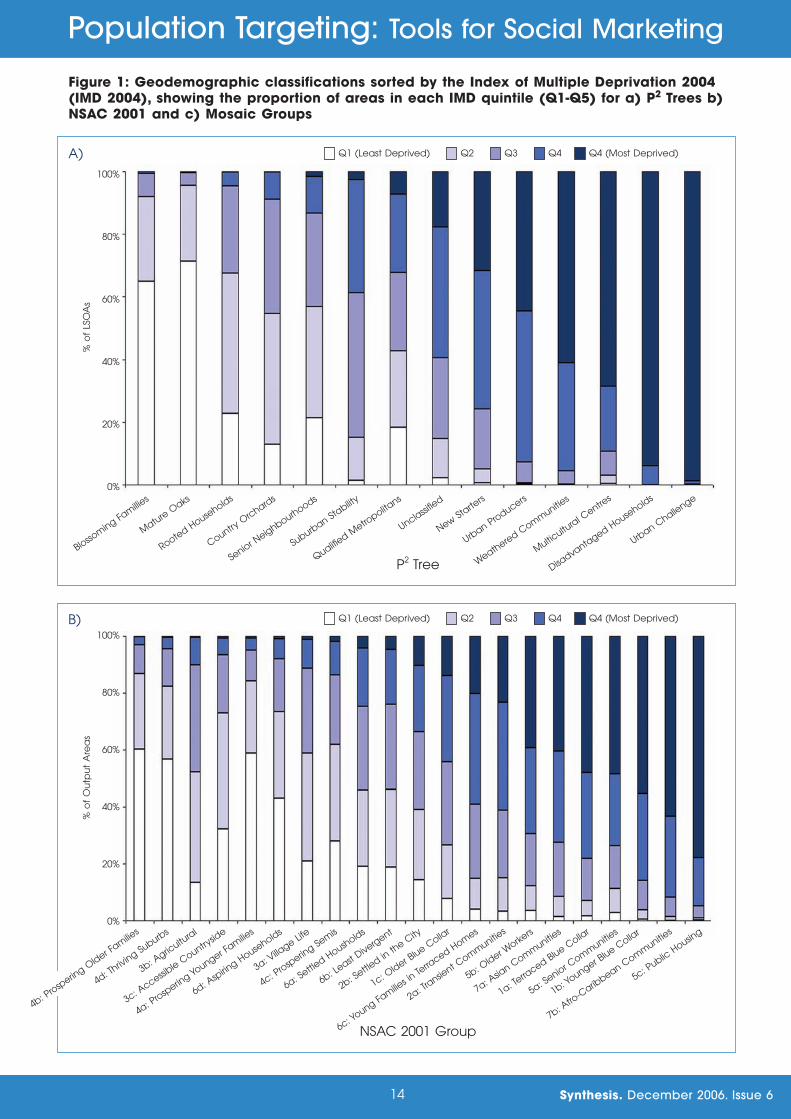
For the purpose of illustration, we have compared three GD classification systems which are eithercurrently in use by public health agencies or are freely available - the National Statistics 2001 AreaClassifications (NSAC 2001), P2 People & Places and Mosaic. Using data from each GD system andthe Index of Multiple Deprivation (IMD 2004) at LSOA level, we calculated the proportion ofLSOAs, OAs or households in each IMD 2004 quintile for the three classifications (Figure 1a-c). Allthree classifications are strongly related to deprivation, which is to be expected since deprivation isstrongly related to consumer behaviour, and all three classifications employ in their construction anumber of variables which are highly correlated with deprivation. The P2 Trees classification showsperhaps the greatest discrimination with respect to IMD, with the proportion of LSOAs in themost deprived IMD quintile ranging from 0% (among ‘Blossoming Families’ neighbourhoods) to99% (among ‘Urban Challenge’). Box 7 shows the numbers of postcode, postcode sector, LSOAand Middle Super Output Area (MSOA) areas within the North West region and variation in thepopulation and number of households within each area type.
Population Targeting: Tools for Social Marketing
14 Synthesis. December 2006. Issue 6
Figure 1: Geodemographic classifications sorted by the Index of Multiple Deprivation 2004(IMD 2004), showing the proportion of areas in each IMD quintile (Q1-Q5) for a) P2 Trees b)NSAC 2001 and c) Mosaic Groups
Population Targeting: Tools for Social Marketing
BlossomingFamillies
Mature O
aks
RootedHouseholds
CountryOrchards
Senior Neighbourhoods
Suburban Stability
QualifiedMetropolitans
Unclassified
NewStarters
UrbanProducers
WeatheredComm
unities
Multicultural Centres
DisadvantagedHouseholds
UrbanChallenge
%ofLSOAs
100%
80%
60%
40%
20%
0%
Q1 (Least Deprived) Q2 Q3 Q4 Q4 (Most Deprived)
P2 Tree
Q1 (Least Deprived) Q2 Q3 Q4 Q4 (Most Deprived)
100%
80%
60%
40%
20%
0%
%ofOutputAreas
4d: Thriving
Suburbs
3b: Agricultural
3c: AccessibleCountryside
4a: Prospering YoungerFamilies
6d: Aspiring H
ouseholds
3a: VillageLife
4c: Prospering Semis
6a: Settled
Housholds
6b: LeastDivergent
2b: Settled
inthe
City
1c: Older Blue
Collar
6c: YoungFamilies in
Terraced
Homes
2a: TransientComm
unities
5b: Older Workers
7a: Asian C
ommunities
1a: TerracedBlue C
ollar
5a: SeniorComm
unities
1b: YoungerBlue C
ollar
7b: Afro-Caribbean C
ommunities
5c: PublicHousing
NSAC 2001 Group
4b: Prospering O
lder Families
A)
B)

15 Synthesis. December 2006. Issue 6
Box 7: The distribution of the North West population and number ofhouseholds between different geographic area types
* Live postcodes, Gridlink Nov 2005. Source: www.statistics.gov.uk/geography/gridlink.asp
** Small user postcodes: collections of (usually) adjacent addresses. A single small user postcode may contain up to 100 addresses, but 15 is a more typical number.Source: www.statistics.gov.uk/geography/postal_geog.asp ~ Numbers estimated from the average number of people per household (2.3).
Population Targeting: Tools for Social Marketing
100%
80%
60%
40%
20%
0%
%ofhouseholds
Q1 (Least Deprived) Q2 Q3 Q4 Q4 (Most Deprived)
RuralIsolation
SymbolsofSuccess
Suburban C
omfort
GreyPerspectives
Happy Famillies
UrbanIntelligence
Tiles of Community
Blue C
ollarEnterprise
TwilightSubsistence
Municiple D
ependency
WelfareBorderline
Mosaic Group
Geography n =Population Households
Average Min Max Average Min Max
Postcode 198,199* ~35 ~230 15** 100**
PoscodeSector
1,478 5,203 210 18,318 ~2,250 ~7,960
LSOA 4,459 1,526 916 5,246 642 401 1,679
MSOA 922 7,346 5,000 12,170 3,106 2,017 5,290
C)

16 Synthesis. December 2006. Issue 6
One of the suggested strengths of GD systems is their ability to segment the population accordingto a range of factors related to population health27-29. Table 2 provides a summary of the ability ofdifferent systems to segment the population according to various characteristics, namelyAsian/Indian subcontinent ethnicity, elderly population, unemployment, and self-reported not goodhealth or limiting long-term illness. For each GD system, we identified the groups with the highestand lowest proportion of their constituent populations having each characteristic, expressing thisas an index relative to a national average of 100. The ratio of this index between the highest andlowest groups indicates whether the classification is able to discriminate efficiently with respect tothe variable of interest (a high ratio indicates greater discriminationiii). Our analysis here (Table 2),consistent with findings from other studies28, indicates that the efficiency of the segmentationvaries according to the GD system used. For each of the characteristics presented, the larger ratiobetween the highest and lowest group for the P2 system suggests a greater discriminatory powerof this system above the other two systems.
Table 2: Comparison of segmentation variables for three geodemographicclassification systems
* Segmentation variables: for each classification, this lists the top and bottom group in terms of the variable described (e.g. unemployment, elderly population). Values inbrackets give the INDEX VALUE for that characteristic, where a value of 100 represents the global average. The ratio (A/B) gives a crude indication of the segmentationability of the classification.
iii Ideally, a weighted variance measure would be applied but because of the lack of access to detailed dataset components for some classifications, this is currently notpossible. A full discussion of methods for evaluating and comparing GD systems is beyond the scope of this report.
Population Targeting: Tools for Social Marketing
Geodemographic System
Segmentation Variable*National Statistics 2001 AreaClassification(NSAC 2001)19
P2 People & Places32 Mosaic54
Ethnicity
A: High
B: Low
Ratio (A/B)
Indian, Pakistani, Bangladeshi
Asian Communities (427)
Agricultural (14)
30.5
Indian, Pakistani, Bangladeshi
Multicultural Centres (648)
Country Orchards (6)
108
Asian/Chinese
Grey Perspectives (188)
Rural Isolation (8)
23.5
Elderly
A: High
B: Low
Ratio (A/B)
Aged 65+y
Senior Communities (136)
Prospering Younger Families (63)
2.2
Aged 75+y
Senior Neighbourhoods (230)
Blossoming Families (39)
5.9
Aged 65-84y
Twilight Subsistence (201)
Happy Families (48)
4.2
Unemployment (age 20-34y)
A: High
B: Low
Ratio (A/B)
Unemployed
Public Housing (160)
Prospering Older Families (63)
2.54
Males unemployed
Urban Challenge (306)
Blossoming Families (40)
7.6
Unemployed
Welfare Borderline (262)
Symbols of Success (45)
5.8
Not good health /Limiting Long TermIllness (LLTI)
A: High
B: Low
Ratio (A/B)
LLTI
Public Housing (111)
Prospering Younger Families (91)
1.22
Not good health/LLTI workingage
Urban Challenge (220)
Blossoming Families (51)
4.3
LLTI working age
Welfare Borderline (185)
Symbols of Success (59)
3.1
17 Synthesis. December 2006. Issue 6
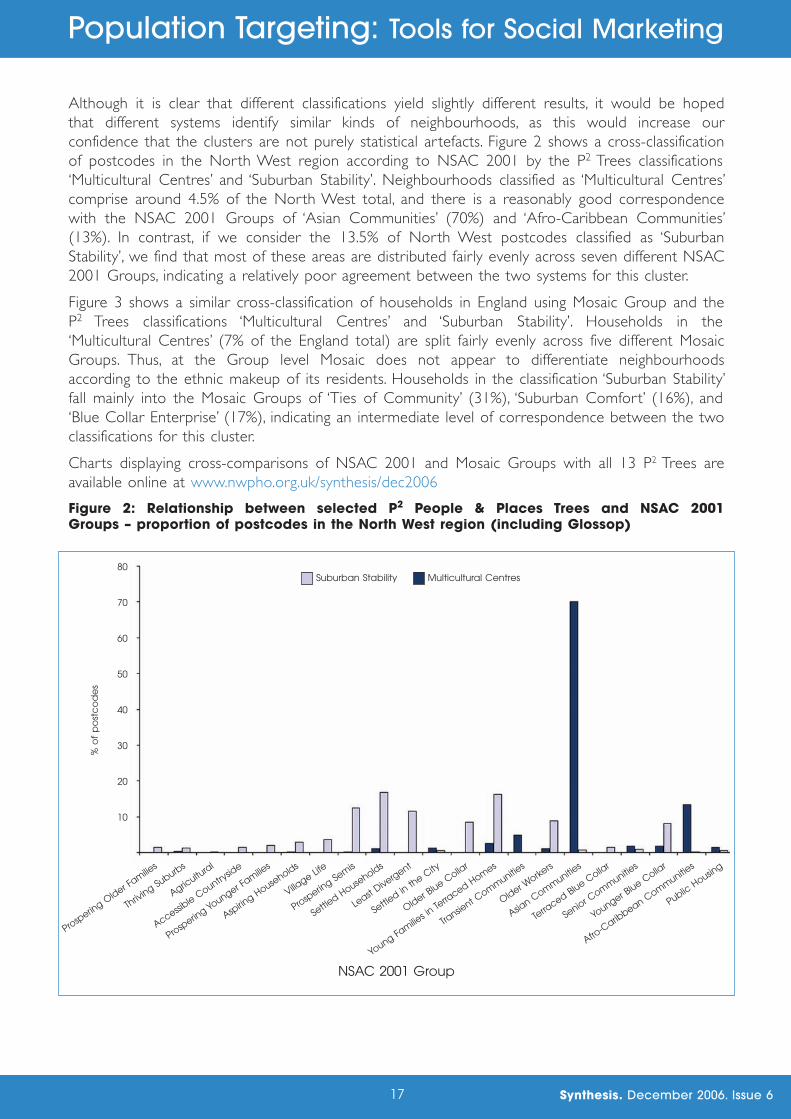
Although it is clear that different classifications yield slightly different results, it would be hopedthat different systems identify similar kinds of neighbourhoods, as this would increase ourconfidence that the clusters are not purely statistical artefacts. Figure 2 shows a cross-classificationof postcodes in the North West region according to NSAC 2001 by the P2 Trees classifications‘Multicultural Centres’ and ‘Suburban Stability’. Neighbourhoods classified as ‘Multicultural Centres’comprise around 4.5% of the North West total, and there is a reasonably good correspondencewith the NSAC 2001 Groups of ‘Asian Communities’ (70%) and ‘Afro-Caribbean Communities’(13%). In contrast, if we consider the 13.5% of North West postcodes classified as ‘SuburbanStability’, we find that most of these areas are distributed fairly evenly across seven different NSAC2001 Groups, indicating a relatively poor agreement between the two systems for this cluster.
Figure 3 shows a similar cross-classification of households in England using Mosaic Group and theP2 Trees classifications ‘Multicultural Centres’ and ‘Suburban Stability’. Households in the‘Multicultural Centres’ (7% of the England total) are split fairly evenly across five different MosaicGroups. Thus, at the Group level Mosaic does not appear to differentiate neighbourhoodsaccording to the ethnic makeup of its residents. Households in the classification ‘Suburban Stability’fall mainly into the Mosaic Groups of ‘Ties of Community’ (31%), ‘Suburban Comfort’ (16%), and‘Blue Collar Enterprise’ (17%), indicating an intermediate level of correspondence between the twoclassifications for this cluster.
Charts displaying cross-comparisons of NSAC 2001 and Mosaic Groups with all 13 P2 Trees areavailable online at www.nwpho.org.uk/synthesis/dec2006
Figure 2: Relationship between selected P2 People & Places Trees and NSAC 2001Groups – proportion of postcodes in the North West region (including Glossop)
Population Targeting: Tools for Social Marketing
80
70
60
50
40
30
20
10
%ofpostcodes
Suburban Stability Multicultural Centres
ProsperingOlder Families
Thriving
Suburbs
Agricultural
AccessibleCountryside
ProsperingYounger Families
Aspiring
Households
Village Life
ProsperingSemis
SettledHouseholds
Least Divergent
Settledinthe
City
Older Blue
Collar
Young Families in
Terraced
Homes
Transient Communities
Older Workers
Asian
Comm
unities
Terraced
Blue C
ollar
Senior Communities
Younger Blue
Collar
Afro-CaribbeanComm
unities
Public H
ousing
NSAC 2001 Group

Figure 3: Relationship between selected P2 People & Places Trees and Mosaic Groups –proportion of households in the North West region (including Glossop)
To further investigate the ability of the three GD classification systems to identify the same type ofneighbourhood, we have mapped clusters of areas around Liverpool (Map 1) and Manchester(Map 2) with the highest expected percentage of persons (age-standardised) with not goodhealth/limiting long-term illness. Each map shows NSAC ‘Public Housing’, P2 ‘Urban Challenge’ andMosaic ‘Welfare Borderline’ (see Table 2). Maps 1b-d and 2b-d use primary colour shading torepresent the individual GD classifications (pale red for P2, blue for NSAC and yellow for Mosaic),whereas Maps 1a and 2a use secondary colours to demonstrate overlapping GD classifications(purple for P2 with NSAC 2001, orange for P2 with Mosaic, green for NSAC with Mosaic, andbrown for an overlap of all three classifications). These illustrations shows that each systemidentifies different geographical areas, and that quite a large number of areas are covered by twoclassifications but relatively few areas are identified by all three systems. Thus, the different GDsystems identify slightly different areas based on not good health/limiting long-term illnessmeasures.
18 Synthesis. December 2006. Issue 6
Population Targeting: Tools for Social Marketing
40
35
30
25
20
15
10
5
%ofhouseholds
RuralIsolation
SymbolsofSuccess
Suburban C
omfort
GreyPerspectives
Happy Families
UrbanIntelligence
Tiles of Community
Blue C
ollarEnterprise
TwilightSubsistence
Municipal Dependency
WelfareBorderlines
Mosaic Group
Suburban Stability Multicultural Centres
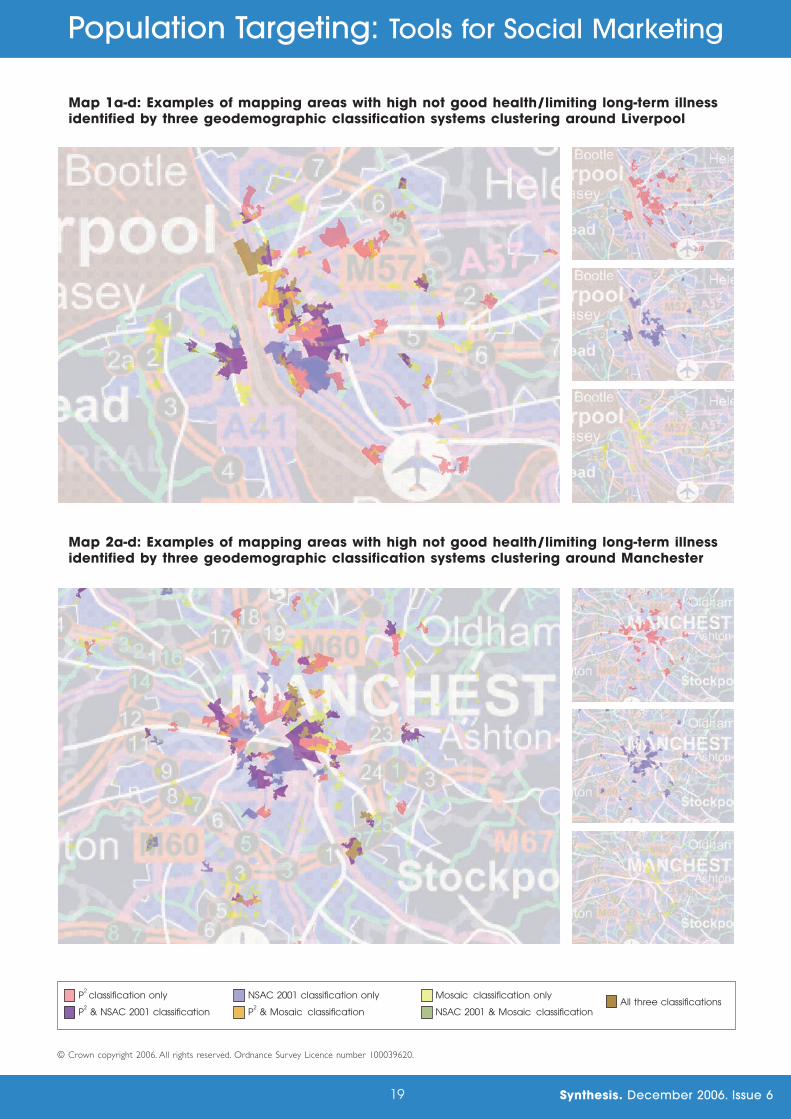
Map 1a-d: Examples of mapping areas with high not good health/limiting long-term illnessidentified by three geodemographic classification systems clustering around Liverpool
Map 2a-d: Examples of mapping areas with high not good health/limiting long-term illnessidentified by three geodemographic classification systems clustering around Manchester
19 Synthesis. December 2006. Issue 6
Population Targeting: Tools for Social Marketing
P2classification only NSAC 2001 classification only Mosaic classification only
P2& NSAC 2001 classification P
2& Mosaic classification NSAC 2001 & Mosaic classification
All three classifications
© Crown copyright 2006. All rights reserved. Ordnance Survey Licence number 100039620.
20 Synthesis. December 2006. Issue 6
Comparison of Health Measures by Three Geodemographic Systems
Table 2 and Maps 1 and 2 investigate the similarities and differences of the GD systems to identifygeographic areas of similar population ‘type’. This section looks at whether the various GD systemsare able to identify similar segments of the population with the highest levels of a particular healthneed. Using the three systems described above, we have compared the same health conditionacross GD gradients to assess the practicality that local users might use these systems to targethealth campaigns.
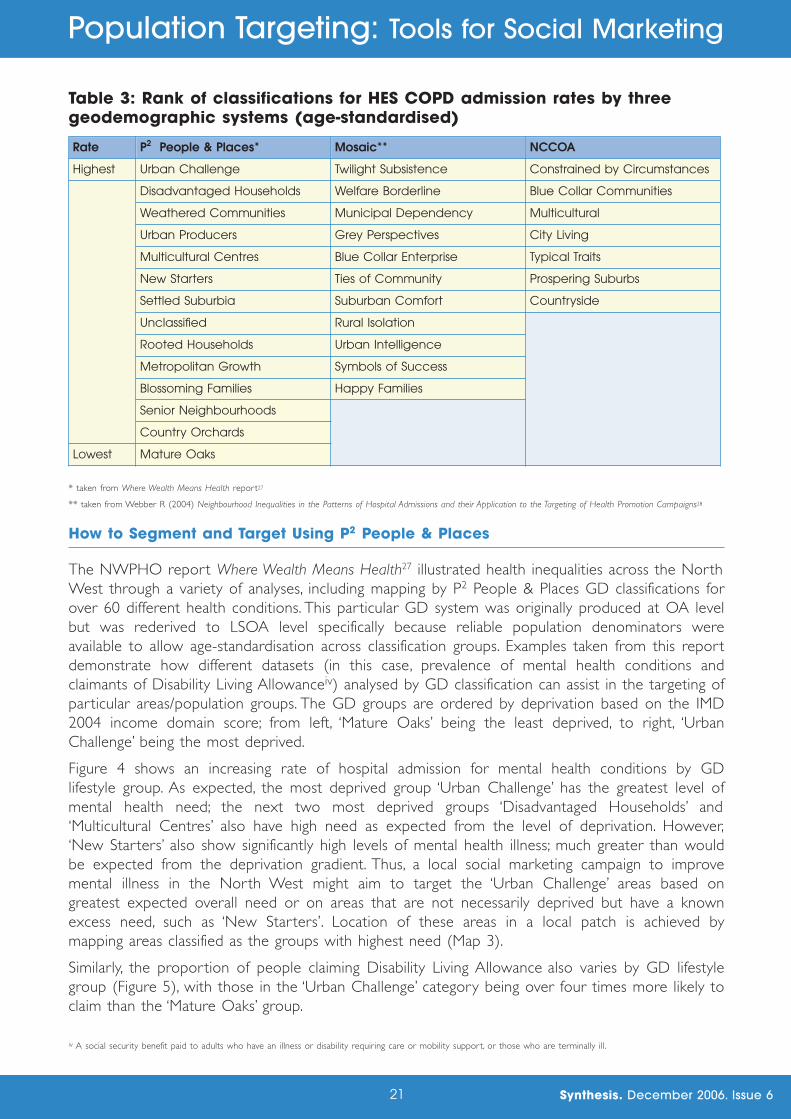
Based on hospital admission, the Centre for Advanced Spatial Analysis found that targeted healthpromotion campaigns (using Mosaic) would be beneficial for conditions such as ChronicObstructive Pulmonary Disease (COPD), as they are concentrated in a narrow set of areas acrossEngland28. Below, we have compared the analysis of COPD for Mosaic Groups to similar measuresfor the other two GD systems (P2 and NSAC 2001) using age-standardised rates of hospitaladmissions for COPD. Table 3 shows the GD groups for the three classifications ranked by thelevel of COPD hospital admission. Thus, as an example, if a local programme was to target thegroup with the highest relative need (Table 3), then using:
� P2 People & Places – the target population would be ‘Urban Challenge’, consisting of oldpeople, living in purpose built flats, council or housing association owned homes, and in smallaccommodation. Unemployment and long-term unemployment is high, as is long-term illness,and incomes are low. This group is extremely likely to smoke. Households mainly consist ofone person, and few own cars. There is a low incidence of qualifications, and those with jobswork in semi-routine and routine occupations30.
� Mosaic – the target population would be ‘Twilight Subsistence’, consisting of people whohave reached the late stage in previously independent lives and now require the support ofhousing and social services departments or state benefits. They either rent their homes fromthe public sector, or use local authority care homes. This reflects their low levels of savings andincome; most do not hold any equity, either in their homes or in financial investments. Housingcan be found in a number of forms: high-rise flats, small enclaves of single-storey units withinlarger council estates, dwellings that are part of a more organised complex in which one of theunits accommodates the warden; or sheltered accommodation with common sitting and diningrooms31.
� NSAC 2001 - the target population would be ‘Constrained by Circumstance’, consisting ofareas with far above the national average proportion of people living in flats or public sectorrented accommodation. These are areas with far below the national average proportion ofpeople living in detached housing, with two or more cars, having gained a higher educationalqualification.
Thus, many similarities emerge for the type of population identified as having the greatest risk ofCOPD by the three GD systems: elderly, low qualifications, living in flat/public sector rentedaccommodation, claiming benefits and low car ownership. Only a few factors are identified by onesystem only: unemployment, smoking and low savings/equity. Thus, all these GD systems wouldseem to enable local agencies to identify the general ‘type’ of person resident in a location withhigh need (at least for COPD). Nevertheless, the most effective local campaigns wouldsupplement this analysis with locally acquired information (from local lifestyle surveys or focusgroups) to enable social marketing to be targeted very specifically to the local population, whichmay differ in characteristic from the average description produced by GD methodology.
Population Targeting: Tools for Social Marketing
21 Synthesis. December 2006. Issue 6
Table 3: Rank of classifications for HES COPD admission rates by threegeodemographic systems (age-standardised)
* taken from Where Wealth Means Health report27
** taken from Webber R (2004) Neighbourhood Inequalities in the Patterns of Hospital Admissions and their Application to the Targeting of Health Promotion Campaigns28
How to Segment and Target Using P2 People & Places
The NWPHO report Where Wealth Means Health27 illustrated health inequalities across the NorthWest through a variety of analyses, including mapping by P2 People & Places GD classifications forover 60 different health conditions. This particular GD system was originally produced at OA levelbut was rederived to LSOA level specifically because reliable population denominators wereavailable to allow age-standardisation across classification groups. Examples taken from this reportdemonstrate how different datasets (in this case, prevalence of mental health conditions andclaimants of Disability Living Allowanceiv) analysed by GD classification can assist in the targeting ofparticular areas/population groups. The GD groups are ordered by deprivation based on the IMD2004 income domain score; from left, ‘Mature Oaks’ being the least deprived, to right, ‘UrbanChallenge’ being the most deprived.
Figure 4 shows an increasing rate of hospital admission for mental health conditions by GDlifestyle group. As expected, the most deprived group ‘Urban Challenge’ has the greatest level ofmental health need; the next two most deprived groups ‘Disadvantaged Households’ and‘Multicultural Centres’ also have high need as expected from the level of deprivation. However,‘New Starters’ also show significantly high levels of mental health illness; much greater than wouldbe expected from the deprivation gradient. Thus, a local social marketing campaign to improvemental illness in the North West might aim to target the ‘Urban Challenge’ areas based ongreatest expected overall need or on areas that are not necessarily deprived but have a knownexcess need, such as ‘New Starters’. Location of these areas in a local patch is achieved bymapping areas classified as the groups with highest need (Map 3).
Similarly, the proportion of people claiming Disability Living Allowance also varies by GD lifestylegroup (Figure 5), with those in the ‘Urban Challenge’ category being over four times more likely toclaim than the ‘Mature Oaks’ group.
Population Targeting: Tools for Social Marketing
Rate P2 People & Places* Mosaic** NCCOA
Highest Urban Challenge Twilight Subsistence Constrained by Circumstances
Disadvantaged Households Welfare Borderline Blue Collar Communities
Weathered Communities Municipal Dependency Multicultural
Urban Producers Grey Perspectives City Living
Multicultural Centres Blue Collar Enterprise Typical Traits
New Starters Ties of Community Prospering Suburbs
Settled Suburbia Suburban Comfort Countryside
Unclassified Rural Isolation
Rooted Households Urban Intelligence
Metropolitan Growth Symbols of Success
Blossoming Families Happy Families
Senior Neighbourhoods
Country Orchards
Lowest Mature Oaks
iv A social security benefit paid to adults who have an illness or disability requiring care or mobility support, or those who are terminally ill.

However, the trend reveals lower than expected levels of claimants in the ‘Qualified Metropolitans’,‘New Starters’ and ‘Multicultural Centres’ groups than the deprivation gradient would suggest. Thus,these three groups might be specifically targeted to encourage a greater level of social benefitclaims to reduce apparent inequities.
Figure 4: Prevalence of hospital admission for mental health conditions - North Westresidents: 1998-2002
22 Synthesis. December 2006. Issue 6
Population Targeting: Tools for Social Marketing
800
700
600
500
400
300
200
100
Standardisedpersonswithconditionper100,000
Mature Oaks
BlossomingFamilies
CountryOrchards
RootedHouseholds
Senior Neighbourhoods
QualifiedMetropolitans
Suburban Stability
NewStarters
UrbanProducers
WeatheredCommunites
Multicultural Centres
DisadvantagedHouseholds
UrbanChallenge
300
250
200
150
100
50StandardisedClaimantRatio(EnglandandWales=100)
Mature Oaks
BlossomingFamilies
CountryOrchards
RootedHouseholds
Senior Neighbourhoods
QualifiedMetropolitans
Suburban Stability
NewStarters
UrbanProducers
WeatheredCommunites
Multicultural Centres
DisadvantagedHouseholds
UrbanChallenge
Figure 5: Disability Living Allowance claimants - North West residents: August 2004
‘People & Places’ locality categorisation
‘People & Places’ locality categorisation

23 Synthesis. December 2006. Issue 6
Map 3: Map showing the Lower Super Output Areas classified by P2 People & Places withthe highest prevalence of mental health conditions (as identified from Figure 4)
Population Targeting: Tools for Social Marketing
Areas (LSOA) of greatest needP2 People & Places
Urban Challenge
Disadvantaged Households
Multicultural Centres
New Starters
All others
Source: 2001 Census, Output Area Boundaries, © Crown copyright 2006.Crown copyright material is reproduced with the permission of the Controller of HMSO.
24 Synthesis. December 2006. Issue 6
5. SOCIAL MARKETING IN ACTION
Historically, there have been many health promotion campaigns that have utilised social marketingtechniques and this is increasingly seen as a way to encourage behavioural change. Astechnological advances continue, commercial marketing techniques are able to rapidly adapt andchange; for example, Tesco increasingly use shopper-collated information to target salespromotions25. Also, the use of online marketing is growing, which is a particularly powerful mediumfor targeting young people. A recent study in the USA analysed online advertising of food tochildren and found that 85% of the top food brands that use TV advertisements to target childrenalso market online via branded websites. Many sites include interactive content such as games andpromotions which young people find appealing32.
Examples of ongoing social marketing campaigns in the North West region are detailed below aswell as some national campaigns that might, at first sight, not seem like social marketing. However,the techniques employed by these campaigns are attempting to use commercial marketingtechniques, where there may be room for improvement if lessons learned from the commercialsector were applied. The successful delivery of health-related campaigns requires up-to-date use ofmodern techniques and media (such as online marketing).
A) NORTH WEST EXAMPLESSeveral groups within the North West are conducting social marketing-based health promotioncampaigns.
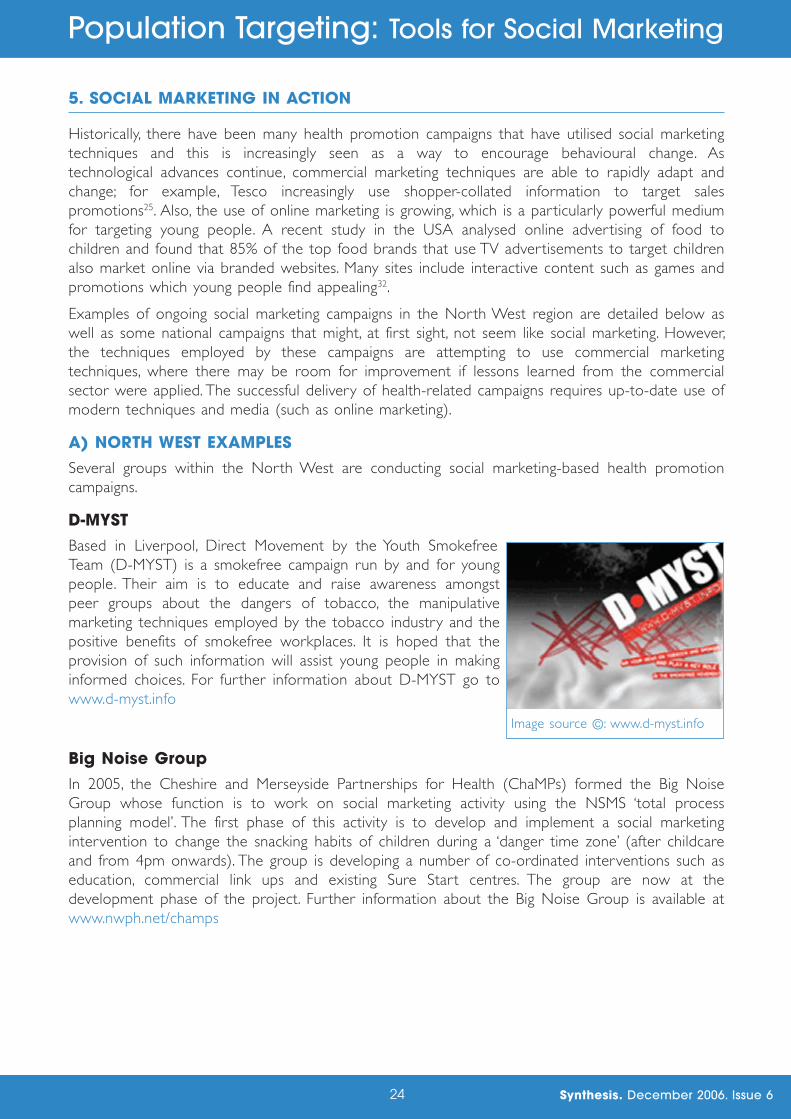
D-MYSTBased in Liverpool, Direct Movement by the Youth SmokefreeTeam (D-MYST) is a smokefree campaign run by and for youngpeople. Their aim is to educate and raise awareness amongstpeer groups about the dangers of tobacco, the manipulativemarketing techniques employed by the tobacco industry and thepositive benefits of smokefree workplaces. It is hoped that theprovision of such information will assist young people in makinginformed choices. For further information about D-MYST go towww.d-myst.info
Big Noise GroupIn 2005, the Cheshire and Merseyside Partnerships for Health (ChaMPs) formed the Big NoiseGroup whose function is to work on social marketing activity using the NSMS ‘total processplanning model’. The first phase of this activity is to develop and implement a social marketingintervention to change the snacking habits of children during a ‘danger time zone’ (after childcareand from 4pm onwards). The group is developing a number of co-ordinated interventions such aseducation, commercial link ups and existing Sure Start centres. The group are now at thedevelopment phase of the project. Further information about the Big Noise Group is available atwww.nwph.net/champs
Population Targeting: Tools for Social Marketing
Image source ©: www.d-myst.info

25 Synthesis. December 2006. Issue 6
Heart of MerseyLaunched in 2003, Heart of Mersey is the largest coronary heart disease prevention programmein England. It is responsible for a number of high profile and often hard-hitting social marketingcampaigns on subjects such as smoking and poor diet. Their most recent campaign is entitled ‘4000reasons’ and provides information to the public about the dangers of secondhand smoke and the4000 dangerous chemicals that it contains. Further information about the Heart of Mersey andtheir social marketing campaigns is available at www.heartofmersey.org.uk andwww.4000reasons.org.uk
Crystal ClearCRYSTAL CLEAR® is a multicomponent social marketingcampaign developed by HIT (a Liverpool-based drugtraining and information centre) with the aim of reducingglass-related injuries and alcohol-related violence in andaround pubs, bars and clubs. This campaign has beenrunning across many parts of the UK, including Merseyside,Cheshire, Blackburn with Darwin, Accrington, andBlackpool. In addition to some of the more standardpromotional materials (e.g. posters, leaflets), the campaignalso uses a wide range of more creative promotional
materials such as beer mats, t-shir ts, football programmes, bus rears, escalator panels, taxis andelectronic advertising at football grounds33. In 1999, an independent evaluation of the campaign34
found that admissions for violently inflicted glass injuries to the main city centre hospital werereduced by over 50% during and after the campaign. As a result, in 2001 the campaign received aTilley Award (under the Crime Reduction category). For further information about HIT and theCRYSTAL CLEAR® see www.hit.org.uk
Population Targeting: Tools for Social Marketing
Image source ©: Heart of Mersey
Image source ©: HIT
26 Synthesis. December 2006. Issue 6
ACTIVATE PendleACTIVATE Pendle is a community development/health trainer project which encourages andsupports people in Pendle to make healthier lifestyle choices with the aim of reducing the highincidence of heart disease and Type 2 diabetes in the population. Consultation identified a needfor a personalised approach, and so Living Well Groups were set up to facilitate small groups ofparticipants to identify and respond to national messages about lifestyle change. These meetingsprovoke thought and discussion around a range of health issues and allow the group to‘spontaneously’ identify how they are going to make personal changes. A second strand of theproject is ‘healthy choices in cafés’ with a number of local cafés working in partnership with PendleEnvironmental Health Department to:
• Highlight healthier choices and encourage cafés to provide morehealthier options;
• Provide healthier messages to people otherwise not reached;
• Support smoking cessation and tobacco control; and
• Support the wider public health agenda.
Further information about ACTIVATE Pendle is available atwww.pendlelearningnetwork.org.uk/providers_info.asp?id=30
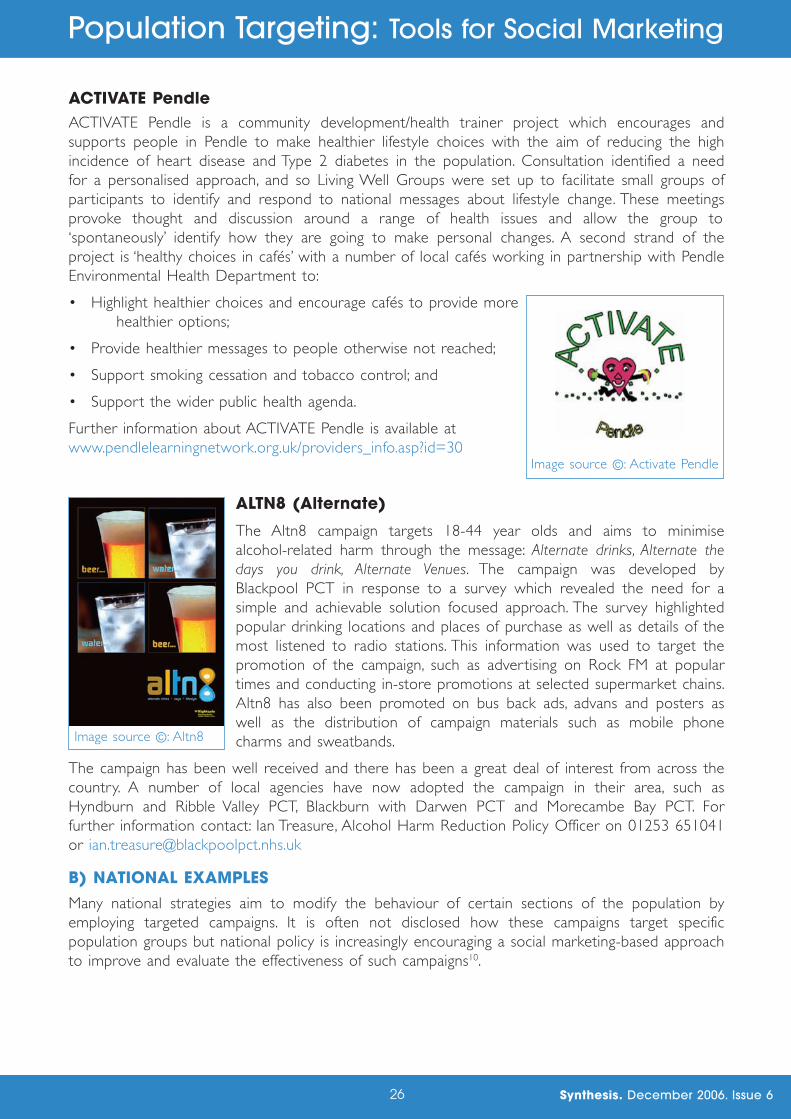
ALTN8 (Alternate)
The Altn8 campaign targets 18-44 year olds and aims to minimisealcohol-related harm through the message: Alternate drinks, Alternate thedays you drink, Alternate Venues. The campaign was developed byBlackpool PCT in response to a survey which revealed the need for asimple and achievable solution focused approach. The survey highlightedpopular drinking locations and places of purchase as well as details of themost listened to radio stations. This information was used to target thepromotion of the campaign, such as advertising on Rock FM at populartimes and conducting in-store promotions at selected supermarket chains.Altn8 has also been promoted on bus back ads, advans and posters aswell as the distribution of campaign materials such as mobile phonecharms and sweatbands.
The campaign has been well received and there has been a great deal of interest from across thecountry. A number of local agencies have now adopted the campaign in their area, such asHyndburn and Ribble Valley PCT, Blackburn with Darwen PCT and Morecambe Bay PCT. Forfurther information contact: Ian Treasure, Alcohol Harm Reduction Policy Officer on 01253 651041or [email protected]
B) NATIONAL EXAMPLESMany national strategies aim to modify the behaviour of certain sections of the population byemploying targeted campaigns. It is often not disclosed how these campaigns target specificpopulation groups but national policy is increasingly encouraging a social marketing-based approachto improve and evaluate the effectiveness of such campaigns10.
Population Targeting: Tools for Social Marketing
Image source ©: Activate Pendle
Image source ©: Altn8
27 Synthesis. December 2006. Issue 6
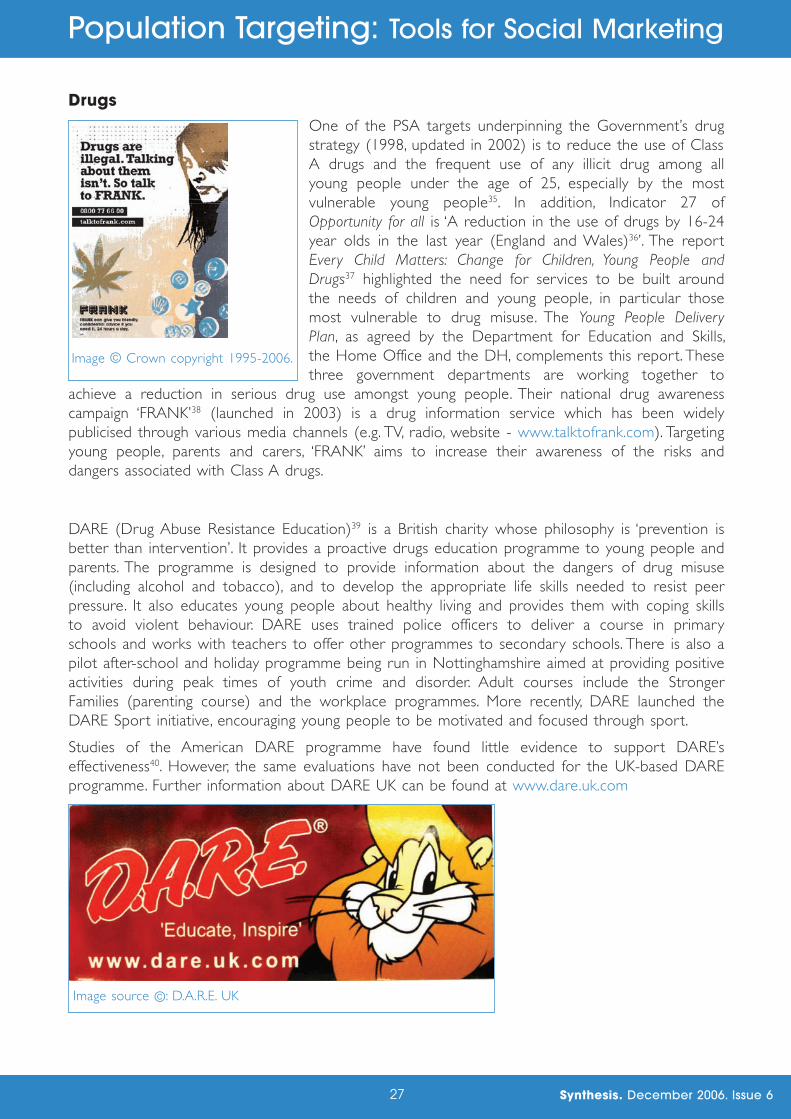
DrugsOne of the PSA targets underpinning the Government’s drugstrategy (1998, updated in 2002) is to reduce the use of ClassA drugs and the frequent use of any illicit drug among allyoung people under the age of 25, especially by the mostvulnerable young people35. In addition, Indicator 27 ofOpportunity for all is ‘A reduction in the use of drugs by 16-24year olds in the last year (England and Wales)36’. The reportEvery Child Matters: Change for Children, Young People andDrugs37 highlighted the need for services to be built aroundthe needs of children and young people, in particular thosemost vulnerable to drug misuse. The Young People DeliveryPlan, as agreed by the Department for Education and Skills,the Home Office and the DH, complements this report. Thesethree government departments are working together to
achieve a reduction in serious drug use amongst young people. Their national drug awarenesscampaign ‘FRANK’38 (launched in 2003) is a drug information service which has been widelypublicised through various media channels (e.g. TV, radio, website - www.talktofrank.com). Targetingyoung people, parents and carers, ‘FRANK’ aims to increase their awareness of the risks anddangers associated with Class A drugs.
DARE (Drug Abuse Resistance Education)39 is a British charity whose philosophy is ‘prevention isbetter than intervention’. It provides a proactive drugs education programme to young people andparents. The programme is designed to provide information about the dangers of drug misuse(including alcohol and tobacco), and to develop the appropriate life skills needed to resist peerpressure. It also educates young people about healthy living and provides them with coping skillsto avoid violent behaviour. DARE uses trained police officers to deliver a course in primaryschools and works with teachers to offer other programmes to secondary schools. There is also apilot after-school and holiday programme being run in Nottinghamshire aimed at providing positiveactivities during peak times of youth crime and disorder. Adult courses include the StrongerFamilies (parenting course) and the workplace programmes. More recently, DARE launched theDARE Sport initiative, encouraging young people to be motivated and focused through sport.
Studies of the American DARE programme have found little evidence to support DARE’seffectiveness40. However, the same evaluations have not been conducted for the UK-based DAREprogramme. Further information about DARE UK can be found at www.dare.uk.com
Image source ©: D.A.R.E. UK
Population Targeting: Tools for Social Marketing
Image © Crown copyright 1995-2006.

28 Synthesis. December 2006. Issue 6
Road SafetyA key target detailed in the Government’s policystrategy document Tomorrow’s roads: safer foreveryone41 is to reduce road deaths and seriousinjuries by 40% (50% for children) by the year2010. The Department for Transport (DfT) isworking towards this target in a variety of ways,and since 2000 has used the banner ‘THINK!’42
to promote road safety messages (walking,driving or riding). There are many ‘THINK!’campaigns on a variety of road safety issues suchas drug driving, seatbelt use, driving tired andchild car seat safety. One of their larger
campaigns is on drink driving. In the UK, drink driving has decreased significantly over the years(1,600 fatalities in 1976 to 590 in 2004). Despite this drop, the Government is aware that theissue must be kept fresh in the mind of the public to prevent complacency. The DfT (supportedby a wide range of organisations) have promoted their drink driving campaign under the brand of‘THINK!’ through various media such as TV, radio, cinema, posters, leaflets, etc. Targeting of thecampaign is determined using monthly tracking reports into driver attitudes and behaviour and isaimed primarily at 17-29 year old males. Further information about ‘THINK!’ is available atwww.thinkroadsafety.gov.uk
Responsible DrinkingThe Government recognises the need to change attitudes towardsirresponsible drinking and behaviour. A number of measures aimedat changing these attitudes were detailed within the Alcohol HarmReduction Strategy for England (2004)43.
Choosing Health identified a number of measures aimed at reducingalcohol misuse, such as working with the Portman Group to cutdown binge drinking, and a new information campaign. The PortmanGroup promotes responsible drinking through campaigns such astheir ‘If you do do drink, don’t do drunk’44 campaign which aims toraise awareness of the adverse consequences of excessive drinkingamongst young people aged 18-24 years. This campaign not onlyutilises the more traditional media channels (TV, radio, posters) but
also uses some more innovative channels such as postcards, advans, viral emails, cinema advertsand even viewrinals (TV in toilets). The Government, alcohol industry and key stakeholders havejoined forces to launch the Drinkaware Trust (www.drinkawaretrust.org.uk), a new independentcharitable organisation aimed at promoting sensible drinking. This project is a development of thePortman Group Trust (a charitable arm of the Portman Group). The drinkaware website(www.drinkaware.co.uk) is the consumer end of the Drinkaware Trust, providing information aboutresponsible drinking to encourage consumers to make informed lifestyle choices in relation totheir drinking habits. For more information about the Portman Group go towww.portmangroup.org.uk
Population Targeting: Tools for Social Marketing
Images © Crown copyright 2006:
Image source ©:The Portman Group

29 Synthesis. December 2006. Issue 6
Food BehaviourFollowing the 2003 Scientific Committee on Nutrition (SACN)report Salt and Health45, the Food Standards Agency (FSA) set atarget to reduce adults average daily salt consumption to 6g by2010. As part of the activity to achieve this target, the FSAinitiated a salt campaign to provide information about healthylevels of dietary salt and encourage adults to meet therecommended targets. The campaign uses a range of mediachannels such as a website (www.salt.gov.uk), various publicationsand its ‘check the label’ TV advertisement. The FSA is working witha number of organisations to promote its campaign anddeveloping salt-related initiatives. For example, the British Dietetic
Association is developing healthy diet recipe cards to educate ethnic groups and those withlearning disabilities and the Blood Pressure Association ran adverts in magazines such as Reader’sDigest linking in with their ‘Know Your Numbers!’ blood pressure testing and awareness week.
Influenza (‘Flu’) CampaignAimed at preventing an Influenza (flu) epidemic, the Governmenthas been running high profile flu campaigns for a number of years.Flu is a highly contagious acute viral infection which is particularlydangerous for the very young and elderly. The Governmentrecommends immunisation for people aged 65 years and over,with an overall national target of 70% uptake of immunisation forpeople of these ages. The winter 2002/03 campaign was frontedby the former heavyweight boxing champion Henry Cooper in abid to appeal to older, at risk groups. Adverts ran in the nationalpress and on daytime television with the slogan ‘Keep your guardup against flu.’ More recently, the winter 2005 flu campaign aimedto promote the importance of immunisation for those most at
risk through a variety of media such as leaflets, posters, bus headliners, television commercials andpress advertisements46. Further information was also made available on the NHS immunisationwebsite www.immunisation.nhs.uk
Population Targeting: Tools for Social Marketing
Image © Crown copyright 2005
Image © Crown copyright 2005
30 Synthesis. December 2006. Issue 6
6. CONCLUSIONS AND RECOMENDATIONS
When planning a social marketing campaign there are a number of important factors that theagencies need to consider, such as:
1. The timing of the campaign, e.g. seasonality - a campaign to promote the use ofsunscreen for prevention of skin cancer would not be appropriate during the winterseason.
2. The language that is used - not just the translation, but also the terminology most suited tothe target audience can greatly affect the success of the campaign.
3. Brand development and protection – if the NHS is conducting campaigns, there must be asuitable level of validation (quality control) to keep their value.
4. Selecting an appropriate spokesperson – the person who fronts the campaign should havethe necessary knowledge to ensure the public has confidence in the campaign, reassuringthem that the campaign’s message is correct and that adopting the suggested changes inbehaviour will be beneficial.
For effective social marketing, appropriate segmentation of the local population is required andgeodemographic (GD) systems are a method to assist with this process. With the growing interestin health and public sector applications of GD segmentation systems, commercial vendors arebeginning to aggressively market their systems to Primary Care Trusts (PCTs), Strategic HealthAuthorities (SHAs) and local authorities (LAs).
In selecting any particular GD classification that enables local campaigns to be effectively targeted,there are a number of issues that need to be addressed, and there are additional caveatsassociated with all GD systems and barriers to their use, for example:
1. There is a bewildering choice of competing classifications, coupled with aggressivemarketing. In Section 5, we have attempted to illustrate some differences between threecommonly used systems that should raise awareness of what local agencies should look forwhen selecting a GD system.
2. It is difficult to systematically evaluate and compare different systems, due to commercialsensitivity of the construction methods and the data used. This synthesis report hassome observations on how different GD systems perform when analysing patterns of thesame health condition (COPD).
3. Access to training and support for the use of various GD systems is currently limited. Withmany time and resource constraints on local analysts, the ability to investigate models ofapplication for new and emerging techniques is limited.
4. Lack of empirical testing and evaluation of the application of GD systems and socialmarketing. All local interventions should undertake an evaluation of the programme.
5. Availability of robust and nationally available population denominators for small geographicareas are crucial to enable not only valid comparisons of health need between groups butalso for the ability to accurately monitor trends and carry out effective evaluations. Theproduction of regular updates to small area populations is also required, which is onereason why GD systems constructed at the LSOA Level provide a greaterlevel of accuracy for analysis.
Population Targeting: Tools for Social Marketing

31 Synthesis. December 2006. Issue 6
Roles of Primary Care Trusts and Local Authorities
Many social marketing campaigns will require a multi-agency and multi-disciplinary approach.However, PCTs or LAs are likely to play a central role, as they are responsible for delivery againstthe targets for population health, wellbeing and inequalities. One issue is that capacity andresources are at an early stage of development. In considering whether to engage in particularcampaigns, these organisations will need to balance local, regional and national targets andpriorities. It will be necessary to assess both the potential impact of a successful campaign, interms of reductions in health inequalities, and the likelihood that the campaign will be successful inthe selected target group(s). As capacity develops in the region, it is expected to generate a needfor new types of information and intelligence to support this activity.
Roles of Public Health Observatories
Public Health Observatories (PHOs) play a central role in the provision and dissemination ofregional and local public health information and intelligence, including in the evaluation and use ofGD techniques. Observatories are promoters of and advocates for the collection of robust highquality health-related information and intelligence, and both Delivering Choosing Health47 and thePublic Health Information and Intelligence Strategy48 recommended strengthened roles for PHOs.
There are a number of ways in which NWPHO might support local and regional social marketinginitiatives. These include:
� Identifying small areas that are known or expected to experience particular health issues. Oneproblem with small area data is that illness rates are difficult to estimate reliably, due to smallnumbers of events. For the analysis presented in Where Wealth Means Health: IllustratingInequality in the North West27, illness and population data from LSOAs are pooled in orderto provide more stable estimates of illness rates within each segment. Information from suchanalyses can be used by PCTs or LAs to select potential target areas where interventionsmight have the greatest impact.
� Using our expertise in Geographical Information (GI) and other mapping techniques, we canconsistently illustrate geographical variation in illness rates at small area level, thus providing apowerful tool for selecting potential targets for social marketing interventions.
� With greater access to various GD systems and the capacity to carry out evaluation andcomparison of different classifications and other segmentation tools, NWPHO can providesupport and training on the use of these methods as well as negotiating access to datasets toimprove region-wide population segmentation. If necessary, we also co-ordinate consortiumpurchases of datasets and licences for local partners.
� NWPHO can collate information from local lifestyle surveys and other population-basedresearch to supplement the detailed information from GD typologies and generate anenhanced picture of the overall health experience in different neighbourhood types49.
� NWPHO can contribute to the evaluation phase of a social marketing intervention in anumber of ways:o Through provision of baseline and longitudinal health-related datasets to monitor temporal trends
before, during, and after the period of the intervention.
o Identification ‘control’ areas which have similar characteristics, but which did not receive the intervention,for comparison with the areas receiving the intervention. This informal ‘benchmarking’ can be extendedto include design of cluster randomised trials.
o Working with partner organisations to develop a region-specific evidence base for public healthinterventions. Local context is extremely important for understanding the target markets, and is notgeneralisable from studies conducted in other populations.
Population Targeting: Tools for Social Marketing

32 Synthesis. December 2006. Issue 6
7. REFERENCES
1. National Social Marketing Centre for Excellence (2005). Social Marketing Pocket Guide.National Consumer Council.
2. Department of Health (2004). Choosing Health: Making Healthier Choices Easier. London:The Stationery Office.
3. Kotler, P and Zaltman, G (1971). Social Marketing: An Approach to Social Change. Journal ofMarketing 35[3], 3-12.
4. Center for Advanced Studies in Nutrition and Social Marketing (2006). Introduction to SocialMarketing [Online] Available at http://socialmarketing-nutrition.ucdavis.edu/ [Accessed 21-8-2006].
5. Nedra Kline Weinreich (1999).What is Social Marketing [Online] Available atwww.social-marketing.com/Whatis.html#anchor1378023 [Accessed 21-8-2006].
6. National Social Marketing Centre (2005) What is Social Marketing? [Online] Available atwww.nsms.org.uk/public/default.aspx?PageID=10 [Accessed 18-7-2006].
7. Grier, S and Bryant, CA (2005). Social Marketing In Public Health. Annual Review of PublicHealth 26[1], 319-339.
8. Hasting, GD and Haywood A (1991). Social marketing and communication in health promotion.Health Promotion International 6[2], 135-145.
9. Department of Health (2006). Our health, our care, our say: a new direction for communityservices. The Stationery Office. ISBN 0101673728.
10. National Consumer Council (2006). It's our health! National Social Marketing Centre.ISBN 1-899581-89-8.
11. Wanless, D (2004). Securing Good Health for the Whole Population: Final Report. London:HM Treasury/Department of Health. ISBN 0-947819-98-3.
12. Kelly, MP, Speller, V, and Meyrick, J (2004). Getting Evidence into Practice in Public Health.London: Health Development Agency. ISBN 1-84279-267-9.
13. Lambert, H, Gordon, EJ, and Bogdan-Lovis, EA (2006). Introduction: Gift horse or Trojan horse?Social science perspectives on evidence-based health care. Social Science & Medicine 62[11],2613-2620.
14. Webber, R (2004). Designing geodemographic classifications to meet contemporary businessneeds. Interactive Marketing 5[3], 219-237.
15. Batey, PWJ and Brown, PJB (1994). Design and construction of geodemographic targetingsystems. Journal of Targeting, Measurement and Analysis for Marketing 3, 105-115.
16. Webber, R and Farr, M (2001). MOSAIC: From an area classification system to householdclassification. Journal of Targeting, Measurement and Analysis for Marketing 10[1], 55-65.
17. Jones, CE, Longley, PA, and Webber, R (2005). Who does not eat their greens?Geodemographics, health promotion and neighbourhood health inequalities.Centre for Advanced Spatial Analysis. University College London.
18. Longley, P (2005). Geographical Information Systems: a renaissance of geodemographics forpublic service delivery. Progress in Human Geography 29, 57-63.
19. Office for National Statistics (2006). National Statistics 2001 Area Classification [Online]Available at www.statistics.gov.uk/about/methodology_by_theme/area_classification/[Accessed 12-7-2006].
Population Targeting: Tools for Social Marketing

33 Synthesis. December 2006. Issue 6
20. Butcher, J (2005). Boots appoint GEO [Online] Available atwww.geoltd.co.uk/default.asp?menuitemID=15 [Accessed 29-8-2006].
21. Branding Asia.com (2006). Boots the Chemist [Online] Available atwww.brandingasia.com/cases/boots.htm [Accessed 29-8-2006].
22. The Independent (2005). A trip to Alton Towers? That'll be £2,000, please. [Online] Available athttp://money.independent.co.uk/personal_finance/loans_credit/article305643.ece[Accessed 29-8-2006].
23. Loyalty Management UK (2006). LMUK Overview [Online] Available atwww.loyalty.co.uk/about_lmuk.html [Accessed 29-8-2006].
24. Dunnhumby (2006). Tesco: Becoming a giant [Online] Available atwww.dunnhumby.com/relevance/case_tesco.htm [Accessed 26-7-0006].
25. Tomlinson, H and Evans, R (2005). Tesco stocks up on inside knowledge of shoppers' lives.[Online] Available at http://business.guardian.co.uk/story/0,3604,1573821,00.html[Accessed 26-7-2006].
26. Hickman, L (2005). Is it OK…to use loyalty reward cards? [Online] Available athttp://money.guardian.co.uk/ethicalliving/story/0,,1579276,00.html [Accessed 26-7-2006].
27. Wood, J, Hennell, T, Jones, A, Hooper, J, Tocque, K, and Bellis, MA (2006). Where Wealth MeansHealth: Illustrating Inequality in the North West. Liverpool: North West Public HealthObservatory. ISBN 1-902051-77-7.
28. Webber, R (2004). Neighbourhood Inequalities in the Patterns of Hospital Admissions and theirApplication to the Targeting of Health Promotion Campaigns. London: UCL. ISBN 1467-1298.
29. Tickle, M., Blinkhorn, A. S., Brown, P. J. B., and Matthews, R. (2000). A geodemographic analysis ofthe Denplan patient population in the North West Region. British Dental Journal 189[9], 494.Nature Publishing Group. 00070610.
30. Beacon Dodsworth UK (2005). People and Places [Online] Available atwww.beacon-dodsworth.co.uk/p2/ [Accessed 20-12-2005].
31. Experian Business Strategies Division (2006). MOSAIC United Kingdom. UK.
32. Henry J. Kaiser Family Foundation (2006). It's Child’s Play: Advergaming and the OnlineMarketing of Food to Children. USA: The Kaiser Family Foundation.
33. HIT (2006). CRYSTAL CLEAR® - Reducing violence and glass-related injury. [Online] Availableat www.hit.org.uk/displayPage.asp?id=20 [Accessed 1-8-2006].
34. Young, C and Hirschfield, A (1999). Crystal Clear - Reducing Glass Related Injury. An evaluationconducted on behalf of the Safer Merseyside Partnership. Department of Civic Design:University of Liverpool.
35. HM Treasury (2004). Spending Review 2004. Public Service Agreements 2005-2008: ActionAgainst Illegal Drugs. London: The Stationery Office.
36. Department for Work and Pensions (2006). Opportunity for all [Online] Available atwww.dwp.gov.uk/ofa/.
37. Department for Education and Skills, Home Office, and Department for Health (2005). EveryChild Matters: Change for Children, Young People and Drugs. Nottingham: DfES Publications.
38. Home Office (2003). FRANK [Online] Available at www.talktofrank.com [Accessed 19-6-2006].
Population Targeting: Tools for Social Marketing

34 Synthesis. December 2006. Issue 6
39. D.A.R.E. UK (2004). Drug Abuse Resistance Education (DARE) [Online] Available atwww.dare.uk.com [Accessed 20-6-2006].
40. Ennett, ST, Tobler, NS, Ringwalt, CL, and Flewelling RL. (1994). How effective is Drug AbuseResistance Education? A meta-analysis of project DARE outcome evaluations. American Journalof Public Health 84[9], 1394-1401.
41. Department for Environment, Transport and Regions (2000). Tomorrow’s roads: Safer forEveryone.
42. Department for Transport (2006). The THINK! Road Safety Website [Online] Available atwww.thinkroadsafety.gov.uk [Accessed 20-6-2006].
43. Prime Minister's Strategy Unit (2004). Alcohol Harm Reduction Strategy for England. London:Strategy Unit.
44. The Portman Group (2006). If you do do drink, don't do drunk [Online] Available atwww.portmangroup.org.uk/campaigns/51.asp [Accessed 21-6-2006].
45. Scientific Advisory Committee on Nutrition (SACN) (2003). Salt and Health. London: TheStationery Office.
46. Department of Health (2006). Summary of Flu immunisation policy. [Online] Available atwww.dh.gov.uk/PolicyAndGuidance/HealthAndSocialCareTopics/Flu [Accessed 1-8-2006].
47. Department of Health (2005). Delivering Choosing Health: Making Healthier Choices Easier.London: Department of Health.
48. Department of Health (2006) Informing healthier choices: Information and intelligence forhealthy populations - A consultation. London: Department of Health.
49. Jones, AM, and Tocque, K (2005). Lifestyle Surveys. Developing a local and regional picture.Synthesis Report: Issue 4. Liverpool John Moores University: North West Public HealthObservatory.
50. Economic and Social Research Council (2004). ESRC in £12m major research to prevent killerdiseases [Online]. Available at: www.esrc.ac.uk/ESRCInfoCentre/PO/releases/2004/october/index4.aspx?ComponentId=6408&SourcePageId=1405 [Accessed 26-10-2006].
51. Dedman, D, Hennell, T, Hooper, J and Tocque, K (2006) Using Geodemographics to IllustrateHealth Inequalities [Online]. Available at:www.nwpho.org.uk/inequalities/Geodem_Inequalities_dr4.pdf [Accessed 26-10-2006].
52. CACI Ltd (2005). ACORN: A classification of residential neighbourhoods [Online]. Available at:www.caci.co.uk/acorn [Accessed 20-12-2005].
53. EuroDirect (2006). CAMEO UK [Online]. Available at:www.eurodirect.co.uk/pages/CAMEO_UK.html [Accessed 26-10-2006].
54. Experian Business Service Division (2005). MOSAIC UK [Online]. Available at:www.experianbs.com/BSHome.asp [Accessed 26-10-2006].
55 Axciom (2006). Personicx Family [Online]. Available at:www.acxiom.co.uk/MarketingSolutions/CustomerInformation/SegmentationGISSolutions/PersonicxFamily/index.html [Accessed 26-10-2006].
Population Targeting: Tools for Social Marketing
35 Synthesis. November 2006. Issue 6
We welcome your feedback on both content and style of the Synthesis Report series.
This report and all other NWPHO reports are available on our website www.nwpho.org.uk
Acknowledgements
Many thanks to the staff at the North West Public Health Observatory and the Centre for PublicHealth for their help and support, in particular Neil Potter, Beccy Manning, Lynn Deacon, DianaLeighton, Michela Morleo, Lee Tisdall and Tom Hennell for comments on and contributions to thecontent of this report.
We are also very grateful for the input into this report from Anne Shirley (Burnley, Pendle andRossendale PCT), Nicola Murphy (Hyndburn and Ribble Valley PCT), Elaine Michel (East LancashirePCT), Ian Treasure (Blackpool PCT), Jane Thomas (Liverpool PCT), Nikki Edwards (Department forTransport), Peter Batey and Peter Brown (University of Liverpool) and Beacon Dodsworth for theuse of P2 People & Places © Geodemographic classifications.
Authors: Dan Dedman,Alyson Jones, Karen Tocque, Mark A Bellis
Contact:
North West Public Health Observatory. Centre for Public Health, North Street, Liverpool L3 2AY
Tel: 0151 231 4454 Email: [email protected] Website: www.nwpho.org.uk
ISBN: 1-902051-40-8
STAFF OF THE NORTH WEST PUBLIC HEALTH OBSERVATORY
Professor Mark A Bellis, Director [email protected] +44 151 231 4511
Dr Karen Tocque, Director of Science and Strategy [email protected] +44 151 231 4506
Jeremy Hooper, Public Health Information Project Manager [email protected] +44 151 231 4508
Daniel Dedman, Public Health Information Analyst [email protected] +44 151 231 4552
Gillian Kelly, Public Health Information Analyst [email protected] +44 151 231 4552
Claire McCormick, Research Assistant [email protected] +44 151 231 4552
Karen Murphy, Public Health Information Analyst [email protected] +44 151 231 4552
Craig Timpson, Research Assistant [email protected] +44 151 231 4552
SachaWyke, Data Manager [email protected] +44 151 231 4472
Lynn Deacon, Knowledge & Communications Project Manager [email protected] +44 151 231 4239
Sara Hughes, Public Health Intelligence Specialist [email protected] +44 151 231 4384
Alyson Jones, Senior Project Officer [email protected] +44 151 231 4445
Rebecca Manning, Regional Researcher [email protected] +44 151 231 4445
Stephen Rogers, ICT Project Manager [email protected] +44 151 231 4430
Wayne Murray,Web Developer & Programmer [email protected] +44 151 231 4388
Neil Potter,Web Developer & Programmer [email protected] +44 151 231 4388
Jodie Sharrock,Website Content Co-ordinator [email protected] +44 151 231 4454
Tom Hennell, Consultant Analyst GONW [email protected] +44 161 952 4359
Alison Ledger, NWPHO Administrator [email protected] +44 151 231 4055
Sharon Schofield, Business and Financial Support [email protected] +44 151 231 4507
Population Targeting: Tools for Social Marketing
North West Public Health Observatory is a member of the Association of Public Health Observatories
Population Targeting: Tools for Social MarketingYour cut out and keep guide to keeping your life junk free1. Keep health promotion leaflets around the house: your GP and other local health
services will have plenty on healthy eating, smart drinking, stopping smoking, exercising andsafe sex (or see below for other sources).
2. Complain if you see irresponsible advertising of food, alcohol or anything else:any inappropriate advertising, especially to children, should be reported to the relevantauthorities (see below).
3. Help market good health yourself: give encouragement to friends who are trying toexercise more, eat better or cut down on the booze and fags.
4. Turn off the volume during TV adverts: teach the kids to do the same.
5. Bin or recycle the junk mail advertising: you can stop it being delivered permanentlyby contacting the Mailing Preference Service (details below).
6. Never shop hungry: you can end up buying more high sugar and snack foods.
7. Don't just give the kids money: buy them what they need, or if they have money takea healthy interest in what they buy.
8. Don’t buy food that comes with toys: it can make kids ask for food they don't reallywant.
9. Get the local community involved: not just at a health event but any event at anyvenue (even if it’s a school fayre, sports day or car boot sale) can have a stall “selling” healthadvice.
10. Where possible, recycle packaging, free advertising posters and even vouchers:they are often adverts for food and drink you don’t need - out of sight and out of mind.
Useful sources of informationTo complain about an advert that you have seen or to stop direct mail (post, fax, text or email) or if you have problems getting goods or arefund for items bought by mail order or on shopping channels contact the Advertising Standards Authority by visiting www.asa.org.uk ortelephone 020 7492 2222.
To stop unwanted mail, telephone calls and faxes, register with the Mailing Preference Service online at www.mpsonline.org.uk or register byphone on 0845 703 4599 (mail preference) or 0845 070 0702 (telephone and fax preference).
For help and advice on:
� Food and healthy eating: visit www.eatwell.gov.uk or call the Food Standards Agency Helpline on 020 7276 8829.
� Debt: call the National Debtline on 0808 808 4000 or visit www.nationaldebtline.co.uk. Help is also available from the Citizens AdviceBureaux (CAB) at www.adviceguide.org.uk or by contacting your local CAB office, details of which can be found in the Yellow Pages.
� Alcohol: visit the NHS site www.wrecked.co.uk or see the Advice for Alcohol Problems site www.apas.org.uk or contact them on0115 948 5570.
� Drugs: talk to FRANK by visiting the website www.talktofrank.com, emailing [email protected], calling 0800 77 66 00 or textphone0800 917 8765.
� Gambling: visit www.gamcare.org.uk or call 0845 6000 133.
� Exercise: visit the British Heart Foundation website www.bhf.org.uk or call their Heart Information Line on 08450 70 80 70.For other sources of UK information and support visit www.patient.co.uk/showdoc/287
� Smoking: visit www.givingupsmoking.co.uk or call the NHS Smoking Helpline on 0800 169 0169.
� Sexual Health: contact the Family Planning Association on 0845 310 1334 or visit www.fpa.org.uk
North West Public Health ObservatoryCentre for Public Health, Liverpool John Moores University, Castle House, North Street, Liverpool L3 2AYTel: 0151 231 4454 Website: www.nwpho.org.uk