Embed Size (px)
Citation preview

J. Fluid Mech. (1999), vol. 382, pp. 63–86. Printed in the United Kingdom
c© 1999 Cambridge University Press
63
Evaporation waves in superheated dodecane
By J. R. S I M O E S-M O R E I R A1 AND J. E. S H E P H E R D2†1 Departamento de Engenharia Mecanica, SISEA – Alternative Energy Systems Laboratory,
Escola Politecnica da USP, caixa postal 61548, Sao Paulo, SP, Brazile-mail: [email protected]
2 Graduate Aeronautical Laboratory, California Institute of Technology, Pasadena,CA 91125, USA
e-mail: [email protected]
(Received 3 February 1997 and in revised form 18 September 1998)
We have observed propagating adiabatic evaporation waves in superheated liquiddodecane, C12H26. Experiments were performed with a rapid decompression apparatusat initial temperatures of 180–300◦C. Saturated dodecane in a tube was suddenlydepressurized by rupturing a diaphragm. Motion pictures and still photographicimages, and pressure and temperature data were obtained during the evaporationevent that followed depressurization. Usually, a front or wave of evaporation started atthe liquid free surface and propagated into the undisturbed regions of the metastableliquid. The evaporation wave front moved with a steady mean velocity but thefront itself was unstable and fluctuating in character. At low superheats, no waveswere observed until a threshold superheat was exceeded. At moderate superheats,subsonic downstream states were observed. At higher superheats, the downstream flowwas choked, corresponding to a Chapman–Jouguet condition. At the most extremesuperheat tested, a vapour content of over 90% was estimated from the measureddata, indicating a nearly complete evaporation wave. Our results are interpreted bymodelling the evaporation wave as a discontinuity, or jump, between a superheatedliquid state and a two-phase liquid–vapour downstream state. Reasonable agreementis found between the model and observations; however, there is a fundamentalindeterminacy that prevents the prediction of the observed wave speeds.
1. IntroductionIn certain situations, the pressure of a liquid may suddenly be reduced far below
the saturation condition without immediate occurrence of boiling. As a result, theliquid becomes superheated or metastable. The superheat is characterized by thedifference between the actual liquid temperature and the temperature of the saturatedliquid at that pressure. Superheats of up to 200◦C are possible. Following a briefincubation period, explosive evaporation results. Such steam or physical explosionsare implicated (Reid 1976, 1983) in some types of industrial accidents.
Under specific conditions, described below, a superheated liquid will evaporate ina wave-like process; that is, the phase change process is confined to a discrete andobservable zone, which moves into the undisturbed metastable liquid and a two-phasemixture is observed downstream of the wave front (Terner 1962; Grolmes & Fauske1974; Thompson et al. 1987; Hill 1991; Simoes-Moreira 1994; Simoes-Moreira &
† Author to whom correspondence should be addressed.

64 J. R. Simoes-Moreira and J. E. Shepherd
Shepherd 1994). The occurrence of the evaporation wave depends on several factors:the thermodynamic properties of the substance, the degree of superheat, the absenceof activated nucleation sites, and the depressurization time scale. Evaporation waveshave also been observed (Shepherd & Sturtevant 1982; Frost & Sturtevant 1986;Frost 1988; Nguyen, Furzeland & Ijpelaar 1988) at a small scale within superheateddroplets. Other terms used to designate the phenomenon are boiling discontinuitiesor boiling shocks (Labuntsov & Avdeev 1981, 1982), boiling front propagation (Das,Bhat & Arakeri 1987) and flash boiling.
The evaporation waves we are considering can be idealized as adiabatic phasetransitions with the latent heat of vapourization supplied from the energy storedin the metastable liquid. The vapourization process is self-sustaining due to thesuperheated nature of the liquid. In this sense, evaporation waves are analogousto combustion fronts such as flames, in which the energy is stored in the chemicalbonds of the reactants and the flame process is self-sustaining due to the metastablenature of a fuel–oxidizer mixture or molecular explosive. This analogy immediatelysuggests the possibility of analysing evaporation waves using control volume conceptsand jump conditions, just as in the case of deflagrations and detonations. We haveinterpreted our experiments using this notion together with a realistic equation ofstate and two-phase flow models for the flow downstream of the wave front. Anexposition of this simple model is given in § 2. In § 5, we propose an extension of thissimple theory to include the effect of velocity slip in the two-phase flow downstreamof the wave.
The simple model predicts, and large-superheat experiments confirm, that there is amaximum mass flux through an evaporation wave. In analogy with the simple theoryof deflagration waves, the choked solution is called the Chapman–Jouguet (CJ) point.The CJ point is a unique solution to the jump conditions for which the downstreamflow is sonic or choked in relation to the moving deflagration wave. Some previousresearchers (Chaves 1984; Thompson et al. 1987) have focused on the CJ point asdefining a unique evaporation wave speed. However, the pioneering study of Hill (Hill& Sturtevant 1990; Hill 1991) demonstrated, and the present experiments confirm,that a range of evaporation wave speeds is possible depending on the pressure dropacross the wave and the degree of superheat of the upstream liquid. These findingsare in agreement with previous experimental results (Hill & Sturtevant 1990; Hill1991) and indicate that both subsonic and sonic solutions are possible, depending onthe initial thermodynamic conditions and the fluid boundary conditions.
This paper reports results and analyses of experiments carried out with saturateddodecane at temperatures of 180–300◦C. The distinction of the present study isthe systematic examination of the effect of superheat and reservoir pressure onevaporation wave characteristics, the use of a highly retrograde pure substance(dodecane) as the working fluid and consideration of velocity slip due to wall effects.The experimental setup is described in § 3 and the results are given in § 4. Ourchoice (Simoes-Moreira, McCahan & Shepherd 1993) of dodecane is related to thetheoretical possibility of obtaining a complete evaporation wave due to its retrogradebehaviour. A complete evaporation wave will have only the vapour phase in thedownstream flow. The retrograde property is associated with molecular complexityand is macroscopically characterized by a positive slope of the vapour branch ofthe temperature–entropy saturation line. Therefore, a retrograde liquid can undergocomplete evaporation in an isentropic expansion process, which is an impossibilityfor regular substances such as water. A discussion of this aspect of the experimentsis given in § 6.

Evaporation waves in superheated dodecane 65
Evaporationwave
Control volume
Metastable liquid
V1
Liquid–vapourmixture
V2
U
Figure 1. Control volume enclosing the evaporation wave. The evaporation wave is moving to theleft with an average velocity U.
2. Control-volume analysisThe analysis is based on an integral formulation of the conservation relations for
a control volume, CV, enveloping a quasi-one-dimensional steady evaporation wave.Figure 1 illustrates the geometry of the model. The wave progresses steadily intothe quiescent superheated liquid with velocity U. The CV is fixed in relation to theevaporation wave and moves with the wave as seen from a laboratory frame. Thedownstream flow is taken to be in thermal equilibrium and gravitational force effectsare neglected. Transverse velocity components are considered small compared to themain axial velocity, and wall friction forces are neglected. In the experiments, the flowis observed to be slightly unsteady and spatially non-uniform. We will not considerthese effects in this report; discussion of these issues can be found in Simoes-Moreira(1994) and McCahan (1992).
In the wave frame, the superheated liquid enters the CV with velocity U + V1
and a two-phase mixture leaves the CV with velocity U + V2. Subscript 1 refers tosuperheated liquid upstream of the wave and subscript 2 the flow downstream of thewave. Define the relative velocities W as
W1 = U + V1, (1)
and
W2 = U + V2. (2)
In the current experiments, the liquid was stationary and the velocity V1 was zero. Letsquare brackets, [ ], indicate a jump in the enclosed property, that is, [f] = f2 − f1.Then the conservation equations for mass, momentum and energy can be written as
[J] = 0, (3)
[P + JW ] = 0, (4)
and
[h+ 12W 2] = 0, (5)
where h is the specific enthalpy and J is the superficial mass flux
J =W1
v1
=W2
v2
, (6)

66 J. R. Simoes-Moreira and J. E. Shepherd
where vi is the corresponding upstream or downstream average specific volume.Combining the balance equations, one can obtain the Rayleigh equation,
J2 = − [P ]
[v], (7)
and the Rankine–Hugoniot equation,
[h] =v1 + v2
2[P ]. (8)
An equation of state must be supplied to estimate the downstream thermodynamicproperties. For single-phase states, a conventional P (v, T ) equation and ideal gasheat capacity cigp (T ) suffice. For two-phase states, some assumptions must be madeabout the relationship between the phases. The simplest notion is to assume thatthe phases are in mechanical and thermal equilibrium. Then the relevant extensivethermodynamic variables can be computed by mass averages of the properties ofthe individual phases. An additional variable, the quality or vapour mass fraction x,is introduced and an additional constraint, the saturation condition P = Pσ(T ), isadded. The saturated vapour pressure is denoted by Pσ(T ). The issue of mechanicalequilibrium, i.e. relative motion between liquid and vapour phases, in the downstreamflow will be discussed in § 5.
In either the single- or two-phase regions, there is one more variable than there areequations so that these equations do not uniquely determine the wave speed unless adownstream property can be specified. Evaporation wave speed at a given time will bea function of the initial and boundary conditions for that flow. Only in special casescan the wave speed be considered to be uniquely fixed without taking into accountdetails of the flow field. In general, a family of solutions will be found, and these areparameterized by either the wave speed or a downstream property. In addition to (7)and (8), the entropy constraint, s2 > s1, must also be satisfied.
Our formulation of the control-volume analysis of an evaporation wave is similarto that of a subsonic deflagration wave in a combusting gas. The energy stored in thesuperheated liquid plays the same role as the energy stored in the molecular bonds ofthe reactants. The solution to (7) and (8) lies on an evaporation adiabat or Hugoniotcurve. A graphical analysis of these equations is shown in the P , v diagram in figure 2.P1 is the upstream metastable pressure; from the initial state (P1, v1) the Rayleigh line,R, extends downward. The slope of the Rayleigh line is given by (7) and represents thesquare of the superficial mass flux J . The curved line passing through points A, B, andC is the evaporation adiabat which is the locus of downstream states that satisfies (8).
Possible downstream states are given by the intersection (points A, B and C) ofthe Rayleigh line with the evaporation adiabat. For Rayleigh lines R with slopeslarger than R′, two solutions, A and C , represent possible downstream states. As thesuperficial mass flux J increases, a limiting case is reached when the Rayleigh lineis tangent to the evaporation adiabat and only one solution B exists, known as thelower Chapman–Jouguet or CJ point. No solutions exist for flow rates larger thanthis value. An upper branch of the adiabat representing compression waves also exists(Shepherd, McCahan & Cho 1990) and associated with it is a second (upper) CJpoint. However, in general, these solutions do not appear relevant to the evaporationwave problem (Shepherd et al. 1990; McCahan & Shepherd 1993), therefore the CJpoint referred to subsequently is always the lower one.
The standard (Thompson 1972) thermodynamic analysis of the CJ point is appli-cable to this situation. At the point B, the mass flow rate is a maximum and the

Evaporation waves in superheated dodecane 67
P1
R
A
CB
R′
Initial metastablestate
Rayleigh line R, R′
Evaporationadiabat
Lower CJ point
Specific volumev1
Pre
ssur
e
Figure 2. Graphical illustration of possible downstream solutions for an evaporation wave with aknown upstream state.
flow is sonic, i.e. the flow velocity downstream (relative to the wave) is equal to theequilibrium sound speed. For each solution A to the left of the CJ-point B, there is acorresponding point C on the right-hand side of the CJ point. These points representsubsonic (A) and supersonic (C) downstream solutions, respectively. In the presentexperiments, only downstream states of the type A or B were obtained.
It can be shown that the CJ point is a local entropy maximum. For a fixedupstream state, the Rankine–Hugoniot relation (8) is differentiated and combinedwith the fundamental relation of thermodynamics,
dh2 = T2ds2 + v2dP2, (9)
to obtain
ds2 =[v]2
2T2
dJ2. (10)
Consequently, the entropy variation has the same sign and trend as the variationof the square of the superficial mass flux J . At the CJ point, the graphical analysisof figure 2 demonstrates that J is a maximum. Therefore, an entropy maximumis reached at the lower CJ point for a fixed upstream state. This implies that theisentrope, Hugoniot curve and Rayleigh line are all tangent at the CJ point, whichleads us to the conclusion that the downstream flow travels at the local speed ofsound relative to the wave.
An important simplification is obtained when the vapour phase of the downstreamflow behaves as an ideal gas, with v2 ≈ vV � vL, which is generally true for states

68 J. R. Simoes-Moreira and J. E. Shepherd
sufficiently far away from the critical point. Then, the Rayleigh equation yields
J2 =
(W2
v2
)2
≈ − [P ]
v2
. (11)
Further simplification is possible at the CJ point where W2 = C2 = (γRT2)1/2, the
local speed of sound. Combining these relations and substituting into (11), we obtain
P2 ≈ P1
1 + γ. (12)
The specific heats ratio γ for ideal gases is always in the range 1 to 5/3, which meansthat P2 is 37–50% of the metastable pressure P1. We found that this is a useful ruleof thumb for estimating the downstream pressure in our experiments.
3. Experimental setup and procedureA schematic of the test facility is shown in figure 3. The main components were a
heated glass test cell and a low-pressure chamber. The test cell consisted of a roundPyrex glass tube, whose dimensions were 340 mm long by 15 mm diameter. Glass waschosen because its surface was smooth enough to suppress undesirable heterogeneousnucleation and made photographic documentation possible. Circulation of hot air ina square glass jacket partially enclosing the cell was used to heat the system to the de-sired temperature. To ensure the uniformity of the initial temperature, a thermocouplewas traversed within the test cell, and the heat supply was adjusted as necessary.
A diaphragm, made of Kapton in most experiments and aluminium in a few cases,closed the top part of the cell and served to isolate the test liquid from a low-pressurechamber. Each experiment involved discharging about 50 cm3 of liquid dodecanefrom the test cell into the low-pressure chamber (0.227 m3). We began the experimentby piercing the diaphragm, which rapidly depressurized the liquid (see figure 6) andinitiated evaporation. The diaphragm was pierced by using an arrow with four knifeblades driven by a compressed-air piston actuated by a solenoid valve. The bladeswere at a shallow angle to the horizontal (5◦) so that the total piercing time of thediaphragm was a few milliseconds.
Substantial efforts were made to suppress nucleation at the bottom of the cell.The pressure and temperature transducers located in the bottom flange were efficientnucleation sites as was the gasket between the flange and the glass cell. The ultimatesolution to premature nucleation at the cell bottom consisted of cooling the bottomportion of the test cell and allowing it to protrude below the heated section. Thisintroduced a temperature gradient into the last 2 cm of test liquid and data fromevaporation in this portion of the cell were not used.
Pressure transducers were located at the bottom of the cell and near the cell exit.The bottom transducer was mounted flush with the flange. The exit transducer wasmounted remotely in a small aluminium block and water cooled to prevent thermaldamage. The exit pressure signal was transmitted through a small steel tube (3.18 mmdiameter and about 100 mm long) from the test cell to the pressure transducer. Exittemperatures were obtained using a T-type thermocouple with a bead diameter of0.6 mm, which had an estimated response time of 50–100 ms. Signals were amplifiedand then recorded using a digital data acquisition system.
We obtained simultaneous still photographs using two cameras and a short-duration(0.5 µs) light source. One camera imaged a front view of the test cell and the other

Evaporation waves in superheated dodecane 69
Tovacuumpump
Diaphragm
Upperflange
Lowerflange
Exitthermocouple
Square glass
Hot air in
Cooling water
Thermocouple
Hot air out
Bottom pressure transducer
Test cell
Hot air in
To exit pressure transducer
Closing clamps
Piercing device
Air piston
Low-pressurereservoir
Figure 3. Diagram of the test facility.
imaged the evaporation wave at 30◦ to the wave plane. The light triggering signalcame from a photosensor that was illuminated by a laser beam passing through thetest cell. As soon as the evaporation wave passed by, it blocked off the beam causingthe photosensor circuit to generate an electrical pulse, which then triggered the lightsource. Motion pictures with a framing rate of 3000 frames per second were alsoobtained. These films revealed details of the development of the evaporation waveand enabled accurate measurements of the wave speed. Video recording was usedin many experiments to get a quick indication of the results. Diffuse lighting frombehind the cell was used in all cases to minimize refractive effects.
70 J. R. Simoes-Moreira and J. E. Shepherd
(a) (b) (c)
(d) (e) ( f )
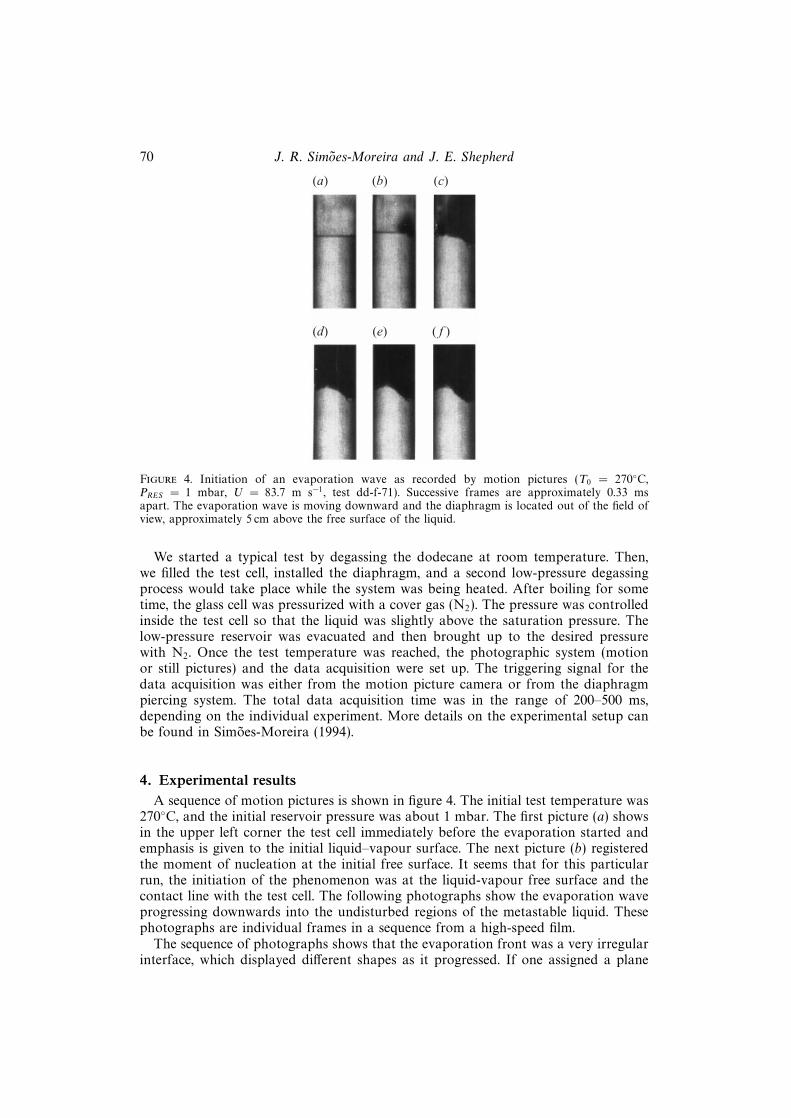
Figure 4. Initiation of an evaporation wave as recorded by motion pictures (T0 = 270◦C,PRES = 1 mbar, U = 83.7 m s−1, test dd-f-71). Successive frames are approximately 0.33 msapart. The evaporation wave is moving downward and the diaphragm is located out of the field ofview, approximately 5 cm above the free surface of the liquid.
We started a typical test by degassing the dodecane at room temperature. Then,we filled the test cell, installed the diaphragm, and a second low-pressure degassingprocess would take place while the system was being heated. After boiling for sometime, the glass cell was pressurized with a cover gas (N2). The pressure was controlledinside the test cell so that the liquid was slightly above the saturation pressure. Thelow-pressure reservoir was evacuated and then brought up to the desired pressurewith N2. Once the test temperature was reached, the photographic system (motionor still pictures) and the data acquisition were set up. The triggering signal for thedata acquisition was either from the motion picture camera or from the diaphragmpiercing system. The total data acquisition time was in the range of 200–500 ms,depending on the individual experiment. More details on the experimental setup canbe found in Simoes-Moreira (1994).
4. Experimental resultsA sequence of motion pictures is shown in figure 4. The initial test temperature was
270◦C, and the initial reservoir pressure was about 1 mbar. The first picture (a) showsin the upper left corner the test cell immediately before the evaporation started andemphasis is given to the initial liquid–vapour surface. The next picture (b) registeredthe moment of nucleation at the initial free surface. It seems that for this particularrun, the initiation of the phenomenon was at the liquid-vapour free surface and thecontact line with the test cell. The following photographs show the evaporation waveprogressing downwards into the undisturbed regions of the metastable liquid. Thesephotographs are individual frames in a sequence from a high-speed film.
The sequence of photographs shows that the evaporation front was a very irregularinterface, which displayed different shapes as it progressed. If one assigned a plane

Evaporation waves in superheated dodecane 71
to the average evaporation front, a normal vector to this plane fluctuated about theaxial direction. Nevertheless, it was always possible to observe a mean evaporationwave region with a well-defined velocity of propagation characterized by a standarddeviation of 1% to 2%. The velocity of propagation was obtained from motionpictures using the method of least squares for fitting the position vs. time data. Thetime reference for the motion pictures was obtained from the 10 ms timing-lightmarks on the film.
The downstream region can be characterized by three distinct portions visible inthe motion pictures. Streaks of low-speed liquid could be seen flowing along the testcell walls. The core region was formed by the flow of high-speed vapour phase andfine droplets entrained in the mean stream. In the terminology of two-phase flow,the closest classification would be annular flow with liquid entrainment. The fartherdownstream the two-phase flow was from the evaporation front, the less light wasscattered, which was also confirmed by some still pictures. This can be interpreted asthe presence of a considerable dense mist of fine droplets right behind the evaporationfront and its dissipation downstream either by evaporation or by attachment to theliquid structures flowing at the wall.
The still pictures of figure 5 show front views of evaporation waves at six differenttest conditions spanning the range of initial temperatures covered in our experiments.The wave is moving from top to bottom. The evaporation front is a highly-disturbedregion formed by many interconnected hemispherical surfaces that resemble portionsof bubbles. The still pictures alone cannot precisely resolve the upper portion of thesestructures sufficiently to determine whether they are open or closed. Motion picturesand videos† give a distinct impression of a somewhat jerky microscopic motion atlow superheats that becomes smoother (and faster) with increasing superheat.
Hill obtained the first high-resolution photographs (Hill & Sturtevant 1990; Hill1991) of the wave initiation and startup process in refrigerants R12 and R114. Ourphotographs are strikingly similar to his, indicating that the structure of the frontis not dependent on substance. Hill found, as we did, that the front appeared to becomposed of bubble-like structures and bursting of these structures gave rise to a‘streak’ of droplets in the two-phase flow region downstream of the wave. This isparticularly evident in the motion pictures and videos. A certain amount of liquidis also obviously attached to the test vessel surfaces and moving at a lower velocitythan the free stream. These observations are incorporated into the model for velocityslip that is developed in § 5.
Analysis of the still pictures revealed that the average size of hemispherical struc-tures in the front decreased as the test temperature increased. At the same time, thetwo-phase flow region appeared to become more homogeneous and less ‘streaky’. Insome photographs, there are artifacts, longitudinal streaks, due to the refraction andlensing effect of the cylindrical test cell. It is difficult to precisely quantify the distribu-tion of hemispherical structure sizes. Inspection of the photographs indicated that thestructures had a maximum size of up to 5 mm (diameter) at low (200◦C) superheatsand less than 1 mm at the highest superheat (290◦C) studied. A spectrum of sizeswas visible, down to the smallest scales, less than 100 µm, that could be resolved bythe photography. These structures appear to be very similar in appearance to thoseobserved by Hill (1991) and comparable in size, 0.1 to 1 mm. The structure lifetime
† A video tape of the motion pictures for selected experiments is available for the cost ofhandling. Contact the authors at [email protected].

72 J. R. Simoes-Moreira and J. E. Shepherd
(a) (b) (c)
(d) (e) ( f )
Figure 5. Selected still pictures, front views. (a) T0 = 180◦C, PRES = 1 mbar, test dd-p-109;(b) T0 = 200◦C, PRES = 1 mbar, test dd-p-110; (c) T0 = 230◦C, PRES = 1 mbar, test dd-p-112;(d) T0 = 250◦C, PRES = 1 mbar, test dd-p-113; (e) T0 = 270◦C, PRES = 1 mbar, test dd-p-114;(f ) T0 = 290◦C, PRES = 1 mbar, test dd-p-115.
measured in the present experiments was in the order of 1 ms, comparable to thatobserved by Hill.
Earlier studies (Shepherd & Sturtevant 1982; Frost & Sturtevant 1986; Frost 1988)on vapourization waves in superheated droplets also demonstrated the existenceof highly-disturbed evaporating surfaces and two-phase flows in other superheatedhydrocarbons such as butane and ether. Those observations were interpreted interms of the instability of a strongly evaporating surface. The reasoning applied inthose cases is equally valid in the present flow but our observations are not sufficientlydetailed to determine how instabilities such as the Landau mechanism play a role. Thestructure and dynamics of unstable evaporation waves still remains to be elucidated.Additional discussion on this point is provided in Chapter 6 of Simoes-Moreira(1994).
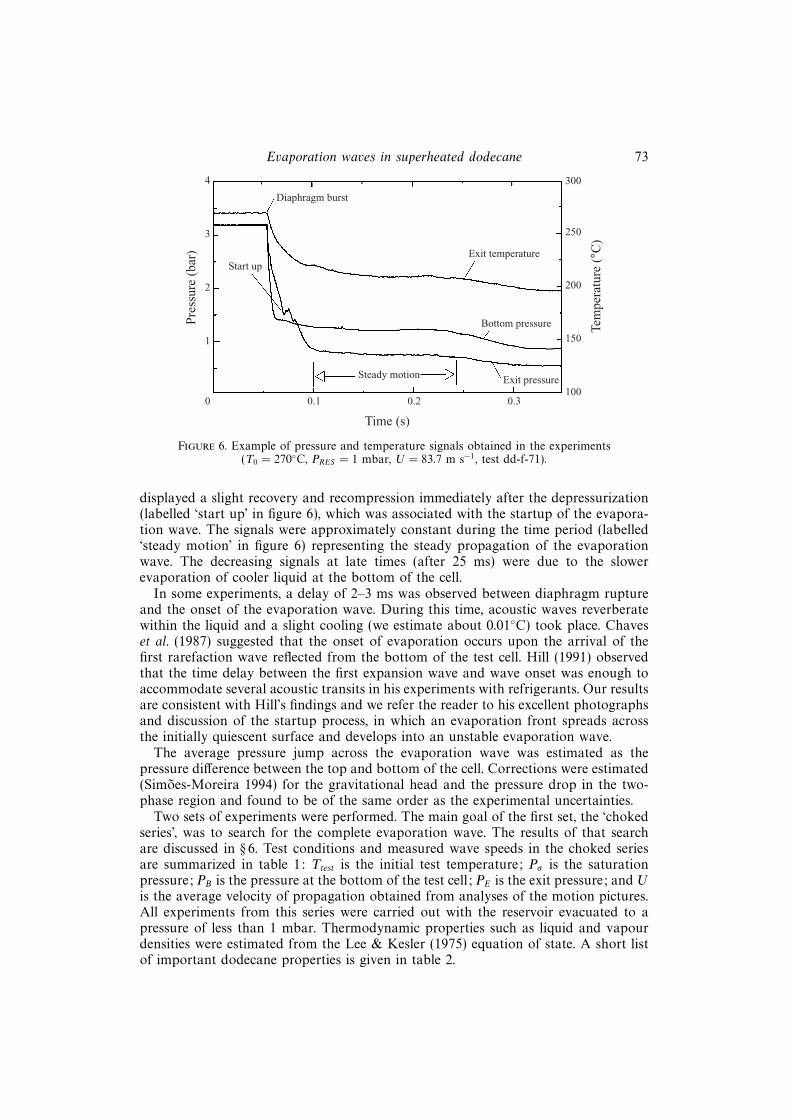
Pressure and temperature traces obtained in test dd-f-71 are shown in figure 6,corresponding to the motion picture frames of figure 4. Sharp drops in pressure andexit temperature occurred when the diaphragm burst. Typically, the exit pressure
Evaporation waves in superheated dodecane 73
4
3
2
1
0 0.1 0.2 0.3100
150
200
250
300
Tem
pera
ture
(°C
)
Time (s)
Pre
ssur
e (b
ar)
Diaphragm burst
Start up
Steady motion Exit pressure
Bottom pressure
Exit temperature
Figure 6. Example of pressure and temperature signals obtained in the experiments(T0 = 270◦C, PRES = 1 mbar, U = 83.7 m s−1, test dd-f-71).
displayed a slight recovery and recompression immediately after the depressurization(labelled ‘start up’ in figure 6), which was associated with the startup of the evapora-tion wave. The signals were approximately constant during the time period (labelled‘steady motion’ in figure 6) representing the steady propagation of the evaporationwave. The decreasing signals at late times (after 25 ms) were due to the slowerevaporation of cooler liquid at the bottom of the cell.
In some experiments, a delay of 2–3 ms was observed between diaphragm ruptureand the onset of the evaporation wave. During this time, acoustic waves reverberatewithin the liquid and a slight cooling (we estimate about 0.01◦C) took place. Chaveset al. (1987) suggested that the onset of evaporation occurs upon the arrival of thefirst rarefaction wave reflected from the bottom of the test cell. Hill (1991) observedthat the time delay between the first expansion wave and wave onset was enough toaccommodate several acoustic transits in his experiments with refrigerants. Our resultsare consistent with Hill’s findings and we refer the reader to his excellent photographsand discussion of the startup process, in which an evaporation front spreads acrossthe initially quiescent surface and develops into an unstable evaporation wave.
The average pressure jump across the evaporation wave was estimated as thepressure difference between the top and bottom of the cell. Corrections were estimated(Simoes-Moreira 1994) for the gravitational head and the pressure drop in the two-phase region and found to be of the same order as the experimental uncertainties.
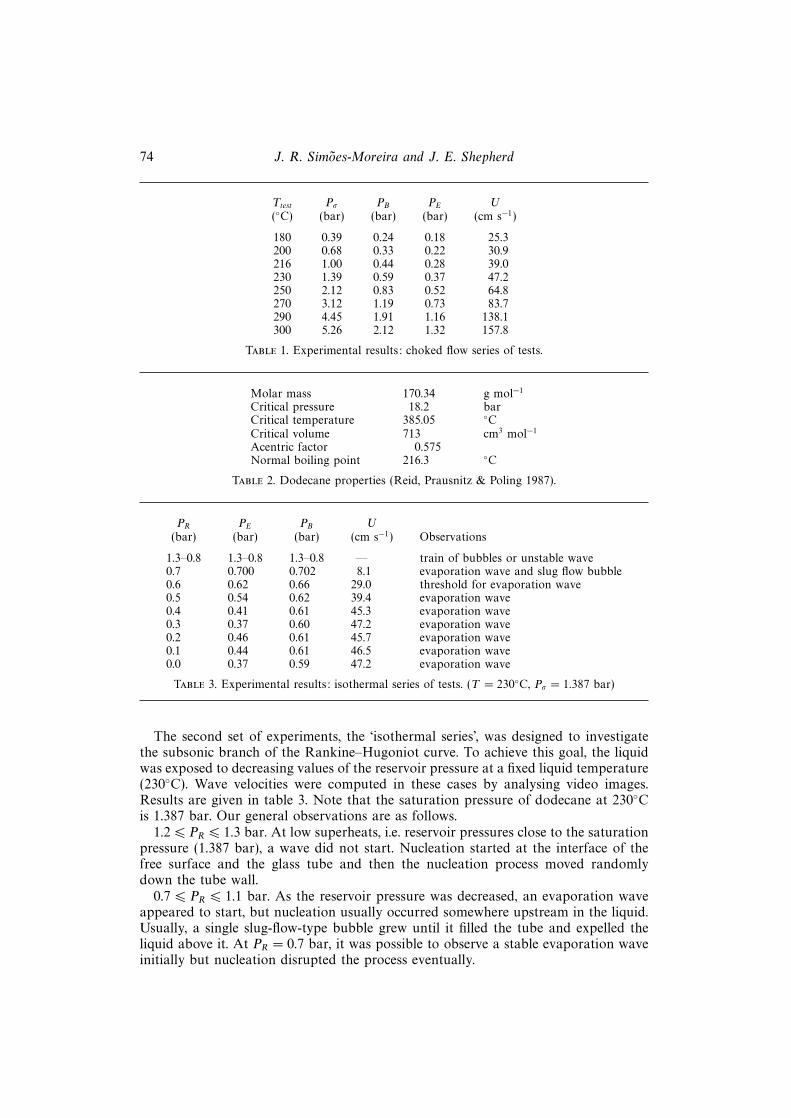
Two sets of experiments were performed. The main goal of the first set, the ‘chokedseries’, was to search for the complete evaporation wave. The results of that searchare discussed in § 6. Test conditions and measured wave speeds in the choked seriesare summarized in table 1: Ttest is the initial test temperature; Pσ is the saturationpressure; PB is the pressure at the bottom of the test cell; PE is the exit pressure; and Uis the average velocity of propagation obtained from analyses of the motion pictures.All experiments from this series were carried out with the reservoir evacuated to apressure of less than 1 mbar. Thermodynamic properties such as liquid and vapourdensities were estimated from the Lee & Kesler (1975) equation of state. A short listof important dodecane properties is given in table 2.
74 J. R. Simoes-Moreira and J. E. Shepherd
Ttest Pσ PB PE U(◦C) (bar) (bar) (bar) (cm s−1)
180 0.39 0.24 0.18 25.3200 0.68 0.33 0.22 30.9216 1.00 0.44 0.28 39.0230 1.39 0.59 0.37 47.2250 2.12 0.83 0.52 64.8270 3.12 1.19 0.73 83.7290 4.45 1.91 1.16 138.1300 5.26 2.12 1.32 157.8
Table 1. Experimental results: choked flow series of tests.
Molar mass 170.34 g mol−1
Critical pressure 18.2 barCritical temperature 385.05 ◦CCritical volume 713 cm3 mol−1
Acentric factor 0.575Normal boiling point 216.3 ◦C
Table 2. Dodecane properties (Reid, Prausnitz & Poling 1987).
PR PE PB U(bar) (bar) (bar) (cm s−1) Observations
1.3–0.8 1.3–0.8 1.3–0.8 — train of bubbles or unstable wave0.7 0.700 0.702 8.1 evaporation wave and slug flow bubble0.6 0.62 0.66 29.0 threshold for evaporation wave0.5 0.54 0.62 39.4 evaporation wave0.4 0.41 0.61 45.3 evaporation wave0.3 0.37 0.60 47.2 evaporation wave0.2 0.46 0.61 45.7 evaporation wave0.1 0.44 0.61 46.5 evaporation wave0.0 0.37 0.59 47.2 evaporation wave
Table 3. Experimental results: isothermal series of tests. (T = 230◦C, Pσ = 1.387 bar)
The second set of experiments, the ‘isothermal series’, was designed to investigatethe subsonic branch of the Rankine–Hugoniot curve. To achieve this goal, the liquidwas exposed to decreasing values of the reservoir pressure at a fixed liquid temperature(230◦C). Wave velocities were computed in these cases by analysing video images.Results are given in table 3. Note that the saturation pressure of dodecane at 230◦Cis 1.387 bar. Our general observations are as follows.
1.2 6 PR 6 1.3 bar. At low superheats, i.e. reservoir pressures close to the saturationpressure (1.387 bar), a wave did not start. Nucleation started at the interface of thefree surface and the glass tube and then the nucleation process moved randomlydown the tube wall.
0.7 6 PR 6 1.1 bar. As the reservoir pressure was decreased, an evaporation waveappeared to start, but nucleation usually occurred somewhere upstream in the liquid.Usually, a single slug-flow-type bubble grew until it filled the tube and expelled theliquid above it. At PR = 0.7 bar, it was possible to observe a stable evaporation waveinitially but nucleation disrupted the process eventually.

Evaporation waves in superheated dodecane 75
PR 6 0.6 bar. Lower reservoir pressure resulted in the consistent formation ofevaporation waves. Waves started promptly and propagated with a characteristicvelocity. No nucleation upstream was observed.PR 6 0.3 bar. Beyond a certain point, the exit pressure would be independent of
the reservoir pressure. The evaporation wave properties were insensitive to furtherdecreasesy in the reservoir pressure. We believe that this was due to the two-phaseflow reaching a choking condition.
These results are in agreement with the earlier experiments in water (Grolmes& Fauske 1974), perfluoro-heptane (PP1) (Thompson et al. 1987), and refrigerants12 and 114 (Hill & Sturtevant 1990; Hill 1991). There was a noticeable threshold,at which an evaporation wave could be formed and sustained. There were alsodefinite limits of minimum and maximum superheats for which we reliably observedevaporation waves. Outside these limits, nucleation upstream of the wave woulddisrupt our observations. At low superheats, the evaporation wave was slow andthere was a long dwell time before the onset of the wave. This required metastablefluid to be in the test cell for a long period of time, and heterogeneous nucleationwould occur. At moderate superheats, the wave would start promptly and movequickly enough that heterogeneous nucleation upstream of the wave would not occur.At high superheats, the nucleation rate became so high that despite high evaporationwave speeds, heterogeneous nucleation occurred upstream of the wave.
5. Modelling the velocity slipThe jump conditions (§ 2) can be used to solve for the downstream state given
the upstream conditions and one other piece of information, such as the wavespeed or downstream pressure. An important case that admits such a solution isthe situation of an equilibrium homogeneous two-phase flow state downstream. Inthis case, the condition of mechanical equilibrium implies that the relative averagedownstream velo- city is common between phases, W2 = WL2 = WV2. The conditionof thermodynamic equilibrium implies that the average downstream thermodynamic(specific) properties f are obtained using the mixture rule f = xfV + (1− x)fL, wherex is the vapour quality, fV is the saturated vapour thermodynamic property, and fLis the saturated liquid thermodynamic property. The jump equations (3)–(5) can besolved to obtain the vapour quality explicitly
x =h1 − hL2 + (vL2 + v1)[P ]/2
hLV2 − vLV2[P ]/2, (13)
where vLV = vV − vL and hLV = hV − hL.Equation (13) allows the direct solution of the jump conditions in the case of a
homogeneous downstream state. This was first pointed out by Thompson & Sullivan(1975) in the context of liquefaction shock waves. There are no a priori limitationson the thermodynamic properties that would prevent the quality from being unity,i.e. a single-phase (vapour) downstream state. The implications of this are exploredin more detail in the subsequent section. If the downstream state is a single phase,then a numerical solution of the jump conditions will generally be required.
The homogeneous equilibrium model is appealing for its simplicity but our motionpictures suggest that the downstream flow is not in mechanical equilibrium. Asdiscussed in § 4, three regions were observed downstream of the flow: (i) a slowlymoving liquid phase attached to the wall, (ii) a faster moving vapour phase in thecore region, and (iii) entrained liquid droplets in the core region, which were assumed

76 J. R. Simoes-Moreira and J. E. Shepherd
to flow at the speed of the vapour phase. In terms of traditional two-phase flowterminology, the flow can be classified as an annular flow with liquid entrainment.
A more realistic model should allow for the velocity of the liquid film (at the wall)and the vapour phase to be different. This can be accomplished by straightforwardextensions based on classical two-phase flow modelling (Wallis 1969; Hewitt & Hall-Taylor 1970). Property and velocity values are treated as uniform within a phasedomain but the phases have different velocities. Define a slip parameter
DW =WL2
WV2
, (14)
which is related to the thermodynamic state through an empirical correlation such asFauske’s (1962)
DA =
(vL2
vV2
)1/2
. (15)
The parameter D is reference-frame dependent, the subscript W is used whenever theparameter refers to the wave frame and the subscript A is used when the value isreferred to the absolute or laboratory frame. In terms of a moving reference frame,the slip ratio DW can be written as
DWWV2 −UWV2 −U =
(vL2
vV2
)1/2
. (16)
A sensitivity analysis was carried out assuming different values for the ratio betweenspecific volumes. Varying the slip ratio by factor of 103 results in only a 20%variation in the wave speed. Fauske’s expression maximizes the superficial mass fluxand therefore the evaporation wave speed. Some researchers prefer the cube rootexpression, which falls slightly lower than the square root expression. See figure 7.12of Simoes-Moreira (1994) for further details.
The mass flow rate of liquid along the wall must be distinguished from the liquiddroplets in the main two-phase flow. In the present study, the film thickness wasnot measured. Suggestions for future work include using either light extinction orimpedance techniques to quantify the liquid film. Two additional parameters areintroduced into the model in order to account for the mass of liquid within thefilm. The void fraction α is defined as the time-average of the fraction of thecross-sectional area occupied by the vapour phase. The parameter β specifies thetime-average fraction of cross-sectional area occupied by the liquid film attached tothe wall. Parameters α and β are invariant with respect to the reference frame. Interms of these parameters, the fraction of liquid droplet mass flow relative to the totalliquid mass flow is
EW =
(1 +
βDW
1− α− β)−1
. (17)
Clearly, this will also be frame dependent.Using these definitions, the conservation equations can be used to derive modified
jump relations:
J =W1
v1
= WV2
{α
vV2
+1− α− β
vL2
+βDW
vL2
}, (18)
P1 +W 2
1
v1
= P2 +W 2V2
{α
vV2
+1− α− β
vL2
+βD2
W
vL2
}, (19)

Evaporation waves in superheated dodecane 77
0.8
0.6
0.4
0.2
0 0.2 0.4 0.6 0.8 1.0
Choked flow
Upstreampressure
(0.83 bar)
Experimentalresult
EW =1homogeneous
Maximum massflow rate (EW =1)
CJ point
Supersonicbranch (EW =1)
EW = 0pure
annular
EW =0.1
EW
Exit pressure, P2 (bar)
Wav
e sp
eed,
U (
m s
–1)
Figure 7. Numerical solution of the wave speed as function of the downstream pressure.The fraction of liquid droplets EW is varied parametrically. The initial temperature is T0 = 250◦C.
and
W1
v1
(h1 +
W 21
2
)=αWV2
vV2
(hV2 +
W 2V2
2
)+βDWWV2
vL2
(hL2 +
(DWWV2)2
2
)+
(1− α− β)WV2
vL2
(hL2 +
W 2V2
2
). (20)
Equations (18)–(20) and the slip correlation (16) were solved numerically (Simoes-Moreira 1994) for a given upstream condition. The thermodynamic properties ofdodecane were computed (Simoes-Moreira 1994) using the Lee & Kesler (1975)equation of state. A family of solutions is shown in figure 7 as a function of theentrainment parameter EW and the downstream pressure P2. The homogeneous two-phase flow model is the case EW = 1 and the annular two-phase flow without liquidentrainment is the case EW = 0. It can be seen in this and subsequent figures that thetwo limiting models envelop all solutions for different values of the liquid entrainedparameter, EW . In these solutions, the flow has been represented as choked (constantmass flux) when the pressure P2 is less than the CJ pressure. One case of supersonicflow (dashed line) is shown to illustrate this type of solution. One data point is shownon this plot from the choked test series.
Figure 8 shows the graphical construction of the CJ solution for the two extremesEW = 1 and 0. The tangent intersection of the Rayleigh line and the evaporationadiabat or Hugoniot is shown for both cases.
Comparisons of the model and experiment pressure and evaporation wave speed atthe CJ condition (table 1) are shown in figures 9 and 10. The lower limit correspondsto numerical results for EW = 1 and the upper limit corresponds to EW = 0.Comparisons of computed and measured wave speeds (table 3) for the isothermaltest series are shown in figure 11. For each case in table 3, the measured downstream

78 J. R. Simoes-Moreira and J. E. Shepherd
0.8
0.6
0.4
0.2
0 0.2 0.4 0.6
Specific volume (m3 kg–1)
Pre
ssur
e (b
ar)
1.0
Saturationline (liquid)
Rayleigh lines
Saturationline (vapour)
Adiabats orRankine–Hugoniot
curves
Homogeneous
Pure annular
CJ – homog.
CJ – annular
Metastable
Figure 8. Rankine–Hugoniot curves or adiabats and Rayleigh lines for the CJ cases. Numericalsolution for T0 = 250◦C.
1.5
1.0
0.5
0 0.5 1.0 1.5
Downstream pressure (bar) (measured)
Dow
nstr
eam
pre
ssur
e (b
ar)
(sim
ulat
ion)
Experimental result
Numerical simulationfor entrainment EW inthe range 0 –1
EW =1 – homogeneoustwo-phase flow
(lower limit)
EW = 0 – pure annulartwo-phase flow
(upper limit)
Figure 9. Comparisons of the numerical solution of the CJ pressure with the measured values forthe choked series of tests (see table 1).
pressure was used as input to the computation to determine the wave speed for thesubsonic family of solutions.
Figures 9 and 10 show that the annular flow model without liquid entrainmenttends to overestimate both the downstream pressure and wave speed at the CJ point,while the homogeneous model tends to underestimate those quantities. On the other

Evaporation waves in superheated dodecane 79
1.5
1.0
0.5
0 0.5 1.0 1.5
Wave speed (m s–1) (measured)
Wav
e sp
eed
(m s
–1)
(sim
ulat
ion)
Experimental result
Numerical simulationfor entrainment EW inthe range 0 – 1
EW =1 – homogeneoustwo-phase flow
(lower limit)
EW = 0 – pure annulartwo-phase flow
(upper limit)
Figure 10. Comparisons of the numerical solution of the CJ wave speed with the measured valuesfor the choked series of tests (see table 1).
0.7
0.6
0.5
0 0.1 0.2
Wave speed (m s–1) (measured)
Wav
e sp
eed
(m s
–1)
(sim
ulat
ion)
Experimental result
Numerical simulationfor entrainment EW inthe range 0 – 1
EW =1 – homogeneoustwo-phase flow
(lower limit)
EW = 0 – pure annulartwo-phase flow
(upper limit)
0.4
0.3
0.2
0.1
0.3 0.4 0.5 0.6 0.7
Figure 11. Comparisons of the numerical solution of the CJ wave speed with the measured valuesfor the isothermal series of tests (see table 3).
hand, wave speeds (figure 11) were predicted reasonably well by the homogeneousmodel for the isothermal series of tests. A possible explanation for the differences inthe numerical results may be related to the trend of the wave speed vs. downstreampressure curves (figure 7). The inclination of the subsonic branch (to the right of the

80 J. R. Simoes-Moreira and J. E. Shepherd
400
350
300
250
200
150
1000 0.5 1.0 1.5 2.0 2.5
2
1
2
1Water
CP CP
Dodecane
Process 1 U 2 is anisentropic expansion
Normalized specific entropy
Tem
pera
ture
(°C
)
Figure 12. Temperature–entropy diagrams of: (a) regular substance (water); (b) retrogradesubstance (dodecane). CP denotes the critical point.
CJ point) is quite steep and a small perturbation in measured pressure value willresult in a large change in wave speed.
6. Complete evaporation wavesThe form of (13) suggests the possibility of complete evaporation waves, i.e. a
vapour quality x of unity. This possibility is intimately related to the thermodynamicbehaviour of the fluid, in particular the characteristics of the saturation properties.Visual inspection of the saturation dome in the temperature–entropy plane (figure 12)suggests that as the molecular complexity, i.e. the number of atoms per molecule,increases, the saturation region tilts to the right. A substance such as dodecane witha characteristic saturation curve of the type illustrated on the right of figure 12 isreferred to as retrograde. The vague term regular is used to classify substances likewater with a characteristic saturation dome of the type shown on the left of figure 12.The retrograde property is precisely that the slope of the vapour saturation line ispositive,
dS
dT
∣∣∣∣σ,V
> 0, (21)
where the subscript σ, V refers to the saturated vapour line.Retrograde and regular fluids are distinguished by the qualitative differences in
behaviour during an adiabatic process, see figure 12. Regular fluids evaporate whena liquid-vapour mixture is adiabatically compressed (2 → 1), while retrograde fluidsevaporate when adiabatically expanded (1→ 2).
From the geometry of the T–S diagram it is apparent that if a fluid is sufficientlyretrograde, complete adiabatic phase change is possible (Thompson & Sullivan 1975).Physically, this occurs when the amount of energy stored in the intramolecular degrees

Evaporation waves in superheated dodecane 81
of freedom is comparable to, or greater than, the intermolecular attraction that is theorigin of the enthalpy of vapourization. In other words, a fluid is retrograde when thenumber of atoms and the associated vibrational degrees of freedom are sufficientlyhigh. A dimensionless heat capacity may be defined (Thompson & Sullivan 1975) tocharacterize retrograde behaviour:
Cv =C0v (Tc)
R, (22)
where C0v (Tc) is the ideal gas heat capacity at constant volume at the critical point
and R the universal gas constant. The higher Cv , the more pronounced the retrogradebehaviour. Thompson & Sullivan (1975) found that retrograde behaviour is possiblefor Cv > 11 and a complete adiabatic liquefaction (Dettleff et al. 1979) is possiblefor Cv > 24. For adiabatic evaporation waves, complete evaporation (Shepherdet al. 1990) can occur for Cv > 33. Dodecane has a value of Cv ≈ 60.4.
One of the goals of the present study was the possibility of experimentally observingcomplete evaporation waves in a one-dimensional geometry. Previous experimentalstudies (Chaves et al. 1985; Hill 1991) in confined flows have resulted only in two-phase downstream states. Kurschat, Chaves & Meier (1992) were able to obtaincomplete evaporation when they allowed highly-superheated liquid to expand radiallyas a supersonic jet in a low-pressure chamber. We believe that there is no fundamentalreason why one-dimensional complete evaporation waves cannot occur within aconfined tube-like geometry also. Our computations indicate that if the initial andfinal conditions and a suitable fluid are carefully selected, complete evaporation ispossible.
An experimental investigation of complete evaporation waves in constant-areaone-dimensional flow presents special problems. Several constraints must be satisfied:
(i) The fluid must have sufficient molecular complexity, i.e. the parameter Cv mustbe large enough (Cv > 33, for instance).
(ii) The amount of superheat must be sufficiently large to store enough energy inthe molecules to supply the latent heat of evaporation, i.e. the Jakob number mustbe greater than one, where Ja = Cp∆T/hLV .
(iii) The degree of superheat cannot be too high since explosive boiling will occurif T is higher than about 90% of the critical temperature.
(iv) The surface finish and interfacial properties must be chosen to suppressnucleation.
Conditions (i) and (ii) are fundamentally questions of thermodynamic properties ofthe test fluid. It has been estimated (Shepherd et al. 1990) that octane, C8H18, is thesimplest fluid for which complete evaporation would be possible. However, the cal-culations in Shepherd et al. (1990) indicated that octane is not a practical choice forexperiments since a large superheat is required, violating condition (iii) Further study(Simoes-Moreira et al. 1993) of this issue determined that dodecane was a more practi-cal choice. Figures 13 and 14 show the results of direct and inverse evaporation adiabatcomputations which demonstrate the potential for complete evaporation waves.
There exists a range of metastable states that will result in pure vapour downstreamstates, that is, evaporation waves with upstream states inside such regions would resultin a downstream state of vapour. These regions are shown shaded in figures 13–15.The left side of the shaded region is bounded by the minimum degree of metastabilitythat would give a dry saturated vapour downstream. The right boundary is the liquidspinodal line.

82 J. R. Simoes-Moreira and J. E. Shepherd
20
15
10
5
00.001 0.01 0.1 1
Saturationline
Spinodal
Evaporationadiabat for A
Evaporationadiabat for B
A
BBCJ
ACJ
Pre
ssur
e (b
ar)
Specific volume (m3 kg–1)
Figure 13. Pressure–volume diagram with two representative starting states and the resulting evap-oration adiabats for superheated dodecane. Initial conditions which result in complete evaporationare shown as the shaded region.
10.0
1.0
200
Saturationline
Spinodal
A
B
BCJ
ACJ
Pre
ssur
e (b
ar)
Specific enthalpy (kJ kg–1)
400 600 800 1000 12000
Case A
Case B
Figure 14. Enthalpy–pressure diagram with two representative starting states and the resulting evap-oration adiabats for superheated dodecane. Initial conditions which result in complete evaporationare shown as the shaded region.
Evaporation waves in superheated dodecane 83
Liquidspinodal
Completeevaporation
region
Saturation line
Minimum condition forcomplete evaporation
PBOT experimental
5
4
3
2
1
0100 150 200 250 300 350 400
Initial temperature (°C)
Pre
ssur
e (b
ar)
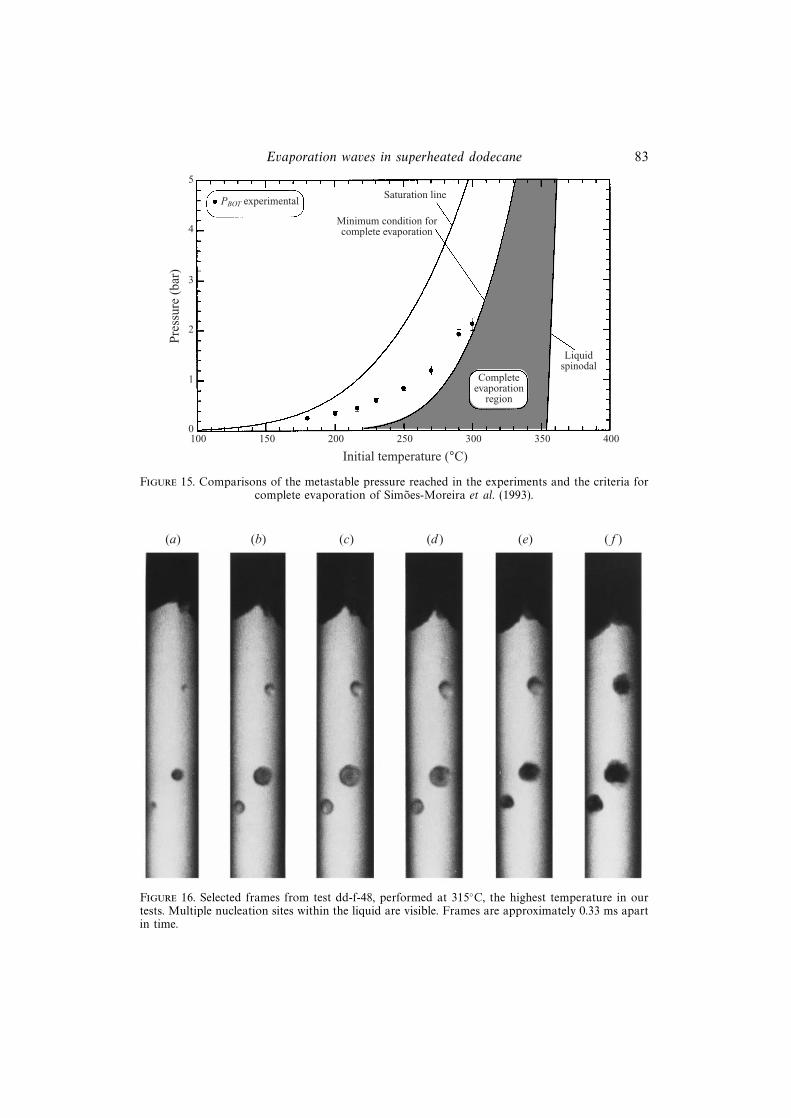
Figure 15. Comparisons of the metastable pressure reached in the experiments and the criteria forcomplete evaporation of Simoes-Moreira et al. (1993).
(a) (b) (c) (d ) (e) ( f )
Figure 16. Selected frames from test dd-f-48, performed at 315◦C, the highest temperature in ourtests. Multiple nucleation sites within the liquid are visible. Frames are approximately 0.33 ms apartin time.

84 J. R. Simoes-Moreira and J. E. Shepherd
180 200 220 240 260 280 3000
20
40
60
80
100V
apou
r qu
alit
y (%
) (s
imul
atio
n)
Initial temperature (°C)
EW =1 – homogeneoustwo-phase flow
(lower limit)
Numerical simulationfor entrainment EW inthe range 0 –1
EW = 0 – pure annulartwo-phase flow
(upper limit)
Figure 17. Estimated mass vapour quality x as function of initial temperature.
Our experimental results are shown in figure 15. As the initial liquid temperaturewas increased, complete evaporation was approached but was not actually obtained.Extrapolating the experimental trend, a complete evaporation wave would be antici-pated in the temperature range of 310–320◦C. Two trials were done at 315◦C andboth resulted in nucleation either within the fluid or at the test cell wall upstreamof the liquid–vapour interface. Photographic evidence of this behaviour is shown infigure 16. Based on our thermodynamic computations, we had expected to be ableto reach the complete evaporation condition at much lower superheats. However, theunexpected increase of the liquid pressure prevented us from attaining the predictedsuperheats. We attribute the increase in pressure to flow losses within the exit sectionof the apparatus due to the very non-ideal configuration of the connection to thelow-pressure reservoir (see figure 3).
In the present experiments, vapour quality was not directly measured but could beestimated from solutions to the jump conditions. The estimated vapour quality x forthe choked test series, figure 17, confirms the approach toward complete evaporationas the initial temperature increased. The difference between the two models is muchless pronounced for the vapour quality than for the evaporation wave velocity anddownstream pressure (figures 9 and 10). The estimated vapour quality at 180◦C isnearly 27% for both models and 91–94% at T = 300◦C. In agreement with theprevious analysis on minimum metastable pressure (figure 15), it is predicted thatcomplete evaporation (x = 1) would occur between 310 and 320◦C.
7. ConclusionsOur experiments have extended previous work on evaporation waves to a highly
retrograde material, dodecane. At modest superheats, we have obtained results similarto previous studies with regular fluids. We have systematically explored the effect ofdownstream conditions and have shown how a maximum mass flux condition isapproached as the superheat is increased. Comparisons of the experiments to a

Evaporation waves in superheated dodecane 85
simple control-volume model reveal that the flow is best simulated as an annulartwo-phase flow with some degree of liquid entrainment.
We fell short of the most ambitious goal of our project, which was to obtaincomplete evaporation waves. Although we were able to obtain a downstream statethat we estimate to be over 90% vapour, nucleation prevented attaining a sufficientlysuperheated upstream state. Our computations and the trends of the experimentaldata do not indicate that there are any fundamental barriers to obtaining a completeevaporation wave.
The mechanism of the evaporation front instability and propagation still remainsto be clarified. Our observations are very similar to Hill’s and strongly suggest auniversal mechanism that causes a very frothy front with bursts of droplets beingflung into the flow. However, the spatial and temporal resolution is not sufficientto distinguish if nucleation occurs within the front or if a more subtle instability isoperating.
The first author thanks CNPq, Conselho Nacional de Desenvolvimento Cientificoe Tecnologico, Brazil, for the financial support and the Department of MechanicalEngineering of Escola Politecnica da Universidade de Sao Paulo, Brazil, for grantinghim a leave of absence. This research was carried out at the Graduate AeronauticalLaboratory of the California Institute of Technology and supported by the Powellfund at Caltech. Both authors would like to acknowledge the importance of the ideasof Philip A. Thompson. Philip’s vision of compressible fluid dynamics and deep insightinto the role of thermodynamics in these flows have had a profound influence on us.
REFERENCES
Chaves, H. 1984 Phasenubergange und Wellen bei der Entspannung von Fluiden hoher spezifischerWarme. Dissertation, Georg August Universitat, Gottingen.
Chaves, H., Lang, H., Meier, G. E. A. & Speckman, H. D. 1985 Adiabatic phase transition andwave splitting in fluids of high specific heat. In Flow of Real Fluids (ed. G. E. Meier & P. A.Thompson). Springer.
Das, P. K., Bhat, G. S. & Arakeri, V. H. 1987 Investigations on the propagation of rapiddepressurization of subcooled liquid. Intl J. Heat Mass Transfer 6, 975–984.
Dettleff, G., Thompson, P. A., Meier, G. E. A. & Speckmann, H. D. 1979 An experimental studyof liquefaction shock waves. J. Fluid Mech. 95, 279–304.
Fauske, H. K. 1962 Contribution to the theory of two-phase, one-component critical flow. ArgonneNational Laboratory Rep. ANL–6633.
Frost, D. 1988 Dynamics of explosive boiling of a droplet. Phys. Fluids 31, 2554–2561.
Frost, D. & Sturtevant, B. 1986 Effects of ambient pressure on the instability of liquid boilingexplosively at the superheat limit. Trans. ASME, 108, 418–424.
Grolmes, M. A. & Fauske, H. K. 1974 Axial propagation of free surface boiling into superheatedliquids in vertical tubes. Proc. 5th Intl Heat Transfer Conf. (Tokyo), Vol. IV, pp. 30–34. TheJapan Society of Mechanical Engineers.
Hewitt, G. F. & Hall-Taylor, N. S. 1970 Annular Two-Phase Flow. Pergamon.
Hill, L. G. 1991 An experimental study of evaporation waves in a superheated liquid. PhD thesis,California Institute of Technology, Pasadena, CA.
Hill, L. G. & Sturtevant, B. 1990 An experimental study of evaporation waves in a superheatedliquid. In Adiabatic Waves in Liquid-Vapor Systems (ed. G. E. A. Meier & P. A. Thompson),pp. 25–37. Springer.
Kurschat, Th., Chaves, H. & Meier, G. E. A. 1992 Complete adiabatic evaporation of highlysuperheated liquid jets. J. Fluid Mech. 236, 43–59.
Labuntsov, D. A. & Avdeev, A. A. 1981 Theory of boiling discontinuity. Teplofizika VysokikhTemperatur 19, 552–556.

86 J. R. Simoes-Moreira and J. E. Shepherd
Labuntsov, D. A. & Avdeev, A. A. 1982 Mechanism of flow blockage involving shock boiling ofliquids. Teplofizika Vysokikh Temperatur 20, 88–95.
Lee, B. I. & Kesler, M. G. 1975 A generalized thermodynamic correlation based on three-parametercorresponding states. AIChE J. 21, 510–527.
McCahan, S. M. 1992 Thermodynamic applications: rapid evaporation and reacting flow. PhD.thesis, Rensselaer Polytechnic Institute, Troy, NY.
McCahan, S. & Shepherd, J. E. 1993 Models of rapid evaporation in nonequilibrium mixtures oftin and water. Prog. Astronaut. Aeronaut. 154, 432–448.
Nguyen, V. T., Furzeland, R. M. & Ijpelaar, M. J. M. 1988 Rapid evaporation at the superheatlimit. Intl J. Heat Mass Transfer 31, 1687–1700.
Reid, R. C. 1976 Superheated liquids. American Scientist 64, 146.
Reid, R. C. 1983 Rapid phase transition from liquid to vapor. Adv. Chem. Engng 12, 105.
Reid, R. C., Prausnitz, J. M. & Poling, B. E. 1987 The Properties of Gases and Liquids, 4th Edn.McGraw-Hill.
Shepherd, J. E., McCahan. S. & Cho, J. 1990 Evaporation wave model for superheated liquids. InAdiabatic Waves in Liquid-Vapor Systems (ed. G. E. A. Meier & P. A. Thompson), pp. 3–12.Springer.
Shepherd, J. E. & Sturtevant, B. 1982 Rapid evaporation at the superheat limit. J. Fluid Mech.121, 379–402.
Simoes-Moreira, J. R. 1994 Adiabatic evaporation waves. PhD thesis, Rensselaer PolytechnicInstitute, Troy, NY.
Simoes-Moreira, J. R., McCahan, S. & Shepherd, J. E. 1993 Complete evaporation waves.Presented at ASME Fluid Engineering Conference, Paper 93–FE–7 ASME, Washington, DC.
Simoes-Moreira, J. R. & Shepherd, J. E. 1994 Adiabatic evaporation waves. J. Brazilian Soc.Mech. Sci. XVI(4), 445–451.
Terner, E. 1962 Shock-tube experiments involving phase changes. Indust. Engng Chem. ProcessDesign Dev. 1, 84–86.
Thompson, P. A. 1972 Compressible Fluid Dynamics, pp. 347–352. McGraw-Hill.
Thompson, P. A., Chaves, H., Meier, G. E. A., Kim, Y. G. & Speckmann, H. D. 1987 Wave splittingin a fluid of large heat capacity. J. Fluid Mech. 185, 385–414.
Thompson, P. A. & Sullivan, D. A. 1975 On the possibility of complete condensation shock wavesin retrograde fluids. J. Fluid Mech. 70, 639–649.
Wallis, G. B. 1969 One-Dimensional Two-Phase Flow. McGraw-Hill.