Embed Size (px)
Citation preview
Evaluation of the Space Heating and Cooling Energy Savings of Smart
Thermostats in a Hot-Humid Climate using Long-term Data
FSEC-RR-647-16
August 2016
Authors
Danny Parker, Karen Sutherland, and Dave Chasar Florida Solar Energy Center
Presented at
2016 ACEEE Summer Study on Energy Efficiency in Buildings
Copyright © 2016 American Council for an Energy Efficient Economy All rights reserved. No part of this work may be reproduced without consent of the Publisher:
ACEEE 529 14th Street, N.W., Suite 600, Washington, D.C. 20045
phone: 202.507.4000 • fax: 202.429.2248 • e-mail: [email protected] • web: www.aceee.org
Disclaimer The Florida Solar Energy Center/University of Central Florida nor any agency thereof, nor any of their employees, makes any warranty, express or implied, or assumes any legal liability or responsibility for the accuracy, completeness, or usefulness of any information, apparatus, product, or process disclosed, or represents that its use would not infringe privately owned rights. Reference herein to any specific commercial product, process, or service by trade name, trademark, manufacturer, or otherwise does not necessarily constitute or imply its endorsement, recommendation, or favoring by the Florida Solar Energy Center/University of Central Florida or any agency thereof. The views and opinions of authors expressed herein do not necessarily state or reflect those of the Florida Solar Energy Center/University of Central Florida or any agency thereof.
Evaluation of the Space Heating and Cooling Energy Savings of Smart Thermostats in a Hot-Humid Climate using Long-term Data
D. Parker, K. Sutherland, D. Chasar Florida Solar Energy Center
ABSTRACT
“Smart” thermostats regulate the home temperature by self-programming using heuristic evaluation of user habits and occupancy. Within the Phased Deep Retrofit (PDR) Project in Florida, a total of 26 NEST thermostats and two Lyric thermostats were installed in participating homes. Unlike previous evaluations, a full year of sub-metered hourly temperature and heating and cooling system operation data was available prior to the install of the smart thermostat allowing detailed evaluation of temperature-related changes. Overall measured heating and cooling energy savings averaged 9.5%.
Unrealized Potential of Programmable Thermostats
As thermostats are the central switch that control operation of heating and cooling systems—commonly the largest energy end use in homes—understanding how the occupants and thermostat interact is key to controlling energy use. However, this potential is complex, made up of the control hardware and how homeowners use it (behavior). That energy setup/setback has potential for energy savings has been demonstrated repeatedly in well-controlled measurements. For example, experimental work by Levins at Oak Ridge National Laboratory (Levins 1988) showed 20% measured heating savings from thermostat setback in the highly instrumented and unoccupied test homes. More recently, detailed National Research Council Canada test homes in Canada (Manning et al. 2007) showed that both thermostat setback (winter) and setup (summer) reliably produce savings of 13% and 11% respectively. Until the advent of smart thermostats, however, such savings levels have depended on the willingness of occupants to manage their thermostats and make effective control decisions. For example, Blasnik as cited by Bailes (2012) found heating savings of 5%-8% in multiple studies in many occupied homes in the northeastern United States from 1998–2008- less than half of identified potentials. Also, Roberts and Lay (2013) also showed that in 20 homes in New York, the measured interior nighttime temperatures were only about 3°F lower than midday temperatures and, in a similar sample of Florida homes for cooling, the often unoccupied daytime setup was only about 2°F. Thus, achieved temperature setback/ set-ups appear much lower than the potentials, given existing thermostat controls and associated behavior.
From 1999–2001, a large monitoring project in central Florida for Florida Power Corporation evaluated 150 sub-metered homes and found that homes with programmable thermostats actually used more space cooling than those with manual slide thermostats because homeowners were more likely to change the daily settings on the manual thermostats due to the nuisance of programming (Nevius 2000). Verifying this finding, the influence of thermostats and load controls was evaluated in Florida homes by utilities desiring to enhance load control. These findings from utilities also showed that programmable thermostats led to increased cooling consumption (Lopes and Agnew 2010). The problems were not confined to Florida, as data from
8-1©2016 ACEEE Summer Study on Energy Efficiency in Buildings
Minnesota showed much the same contradictory result from programmable thermostats (Nevius and Pigg 2000). Other efforts (Vastamaki, Sinkkonen, and Leinonen 2005) (Meier et al. 2011) indicated that much of the problem stems from an overly complex user interface for programmable thermostat, with only one in four households programming them.
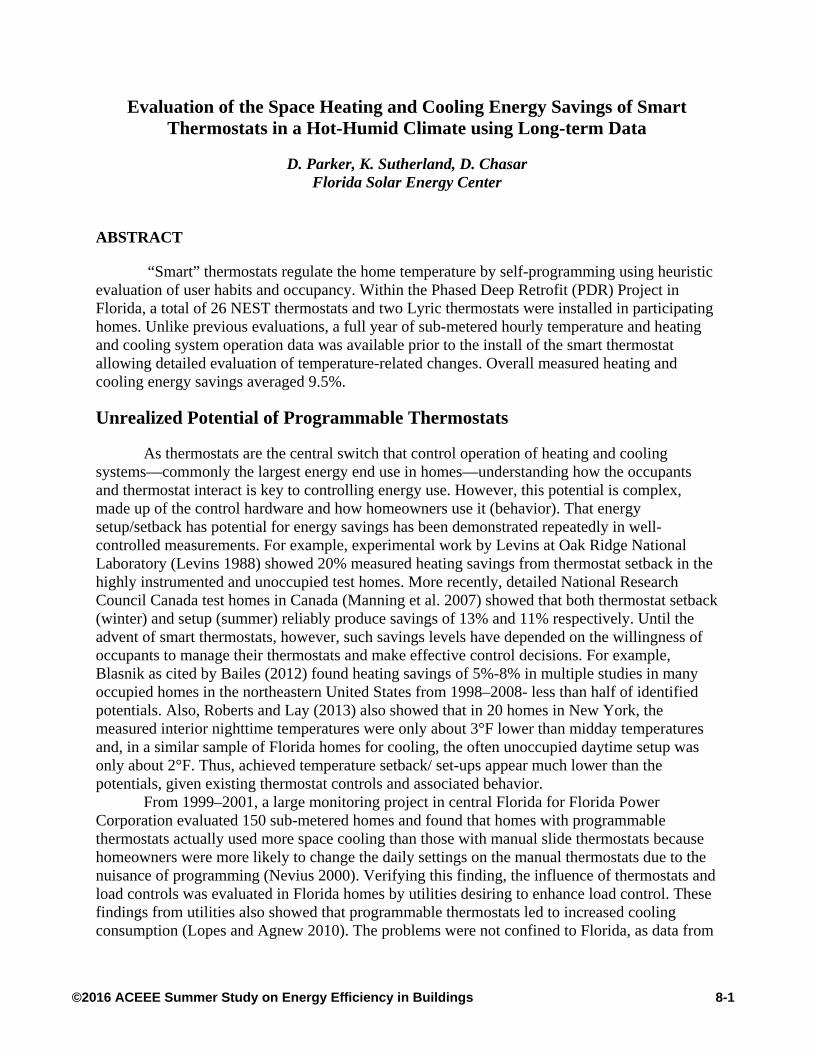
Figure 1. The Nest learning thermostat installed at one of the PDR sites showing portable logger recording temperature/humidity right by original thermostat & smart replacement.
Smart Thermostats
Newer “smart” thermostats get around these problems by self-programming depending on heuristic or machine learning evaluation of user control habits as well as sensed occupancy. Such smart thermostats include Nest (see Figure 1), Lyric, and Ecobee. These modern devices use a combination of data on occupancy, weather, and thermostat-setting preference to help consumers with automated setback/setup schedules. These devices have also been shown in other studies in other regions to produce cooling energy savings. For example, the Nest thermostats have been shown to provide savings of 1.16 kWh/day or 11.3% in a very large sample of homes in Southern California (Nest 2014). However, there are reasons to believe savings may differ in Florida, with different demographics, construction practices, and intense cooling consumption. Thus, this paper aims to evaluate the energy savings and peak demand impacts of smart thermostats in a highly metered field project in Florida.
Installation Campaign
The Phased Deep Retrofit project (PDR) in Florida installed a series of energy efficiency improvements in 56 homes over a three year period to estimate individual and combined technology impacts. Study sites for Nest or Lyric “smart” thermostat were chosen based on homeowner acceptance, compatibility, and the proviso that no confounding measures be installed in the home over the two year evaluation period
Among the 38 smart thermostats installed in the PDR project, nine sites received Nests within the deep retrofits, 22 received a Nest or Lyric in 2014, and seven sites a Nest in 2015. Within the analysis, we carefully reduced confounding influences by removing sites from analysis with issues that would bias results. Three sites had the evaluation time periods limited due to a change out of the air conditioning equipment (very visible within the sub-metered data).
8-2 ©2016 ACEEE Summer Study on Energy Efficiency in Buildings
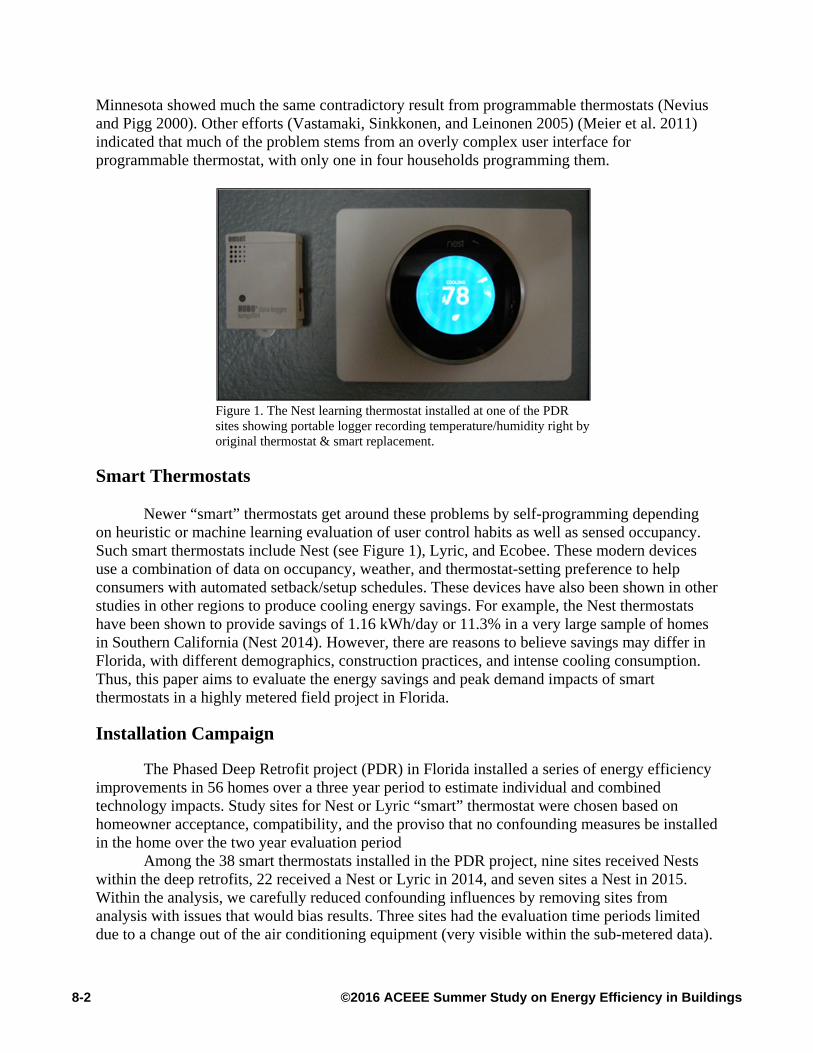
The nine homes that had Nest thermostats installed in the summer of 2013 as part of the deep retrofits are also not included in this analysis because the thermostats were installed as a part of a much larger group of retrofit measures. This left 25 Nest sites and two Lyric sites for the final evaluation. A subset of three Nest installs installed in 2015 in homes with supplemental mini-split heat pumps operating and controlled independently were evaluated, but are not considered part of the main sample. Site characteristics for the installations are summarized in Table 1; HVAC characteristics are provided in Table 2.
Table 1. Smart thermostat general site characteristics
Site # City
Year
Built
Liv-ing
Area (ft2)
No. of
Occu. StoriesCeiling
Insulation
Wall Cons-
truction
House Air-
tightness (ACH50)
Year of
AHU/Comp
AC Size
(tons) AC
SEER4 Melbourne 1971 1,166 2 1 R-19 CMU 11.5 2000 2.5 14.0 6 Palm Bay 1981 1,542 2 1 R-25 CMU 8.9 2006 3.0 13.0
11 Cocoa Beach 1958 1,672 3 1 R-6 CMU 10.9 1998/ 2002
3.0 < 12
12 Port Orange 1984 1,594 3 1 R-6 CMU 12.0 2000 3.0 < 12 16 Indialantic 1982 2,231 3 1 R38 Frame 12.7 2002 4.0 13.5
15 Melbourne Beach
1975 1,359 2 1 R-15 CMU 8.2 1997 3.0 13.5
17 Indialantic 1964 1,456 2 1 R-30 CMU 8.4 2002 3.0 19.0 18 Cocoa 1995 1,802 2 1 R-21 CMU 6.2 2008 3.0 14.0 21 Cocoa Beach 1981 1,628 2 1 R-30 CMU 6.9 2013 3.5 13.0 22 Cocoa Beach 1955 1,743 2 1 R-19 CMU 11.0 2001 2.5 12.0 24 Cocoa 1986 1,978 3 2 R-25 Frame 9.5 2010 3.5 15.0 27 Palm Bay 1995 2,050 2 1 R-30 Frame 8.0 2008 5.0 12.0 28 Merritt Island 1966 2,622 2 1 R-16 CMU 8.9 1999 5.0 10.0 29 Cocoa 1985 1,215 2 1 R-30 Frame 10.2 1985 2.5 < 10
34 Pembroke Pines
1978 1,651 2 1 R-8 CMU 9.3 2011 3.0 15.0
35 Plantation 1993 1,625 2 2 R-19 CMU/ Frame
6.6 1993/ 1998
3.5 < 10
42 Naples 2001 1,666 3 2 R-30 Frame 6.1 2002 3.0 10.0 45 Davie 1987 1,299 2 1 R-19 CMU 9.1 2006 2.5 13.0
47 Fort Myers 1990 1,088 4 1 R-15 Frame 5.5 1999/ 2004
2.5 < 10
48 Naples 1973 1,436 4 1 R-38 CMU 13.2 2006 3.0 13.0 50 Melbourne 1958 2,168 4 1 R-30 CMU 5.5 2005 4.0 14.0 52 Cocoa 2000 1,696 2 1 R-30 Frame 7.0 2012 3.0 13.0 56 Merritt Island 1963 1,000 3 1 R-19 CMU 13.5 2005 2.5 10.0 58 Rockledge 1979 2,020 2 1 R13 CMU 13.3 2003 3.5 13.0
59 Melbourne Beach
1985 2,298 2 1 R-19 Frame 7.1 2005 4.0 14.0
43 Fort Myers 2000 1,383 2 1 R-25 CMU 6.5 1999 2.5 10.0 44 Naples 1998 1,627 2 1 R-19 CMU 4.7 1998 4.0 10.0
8-3©2016 ACEEE Summer Study on Energy Efficiency in Buildings
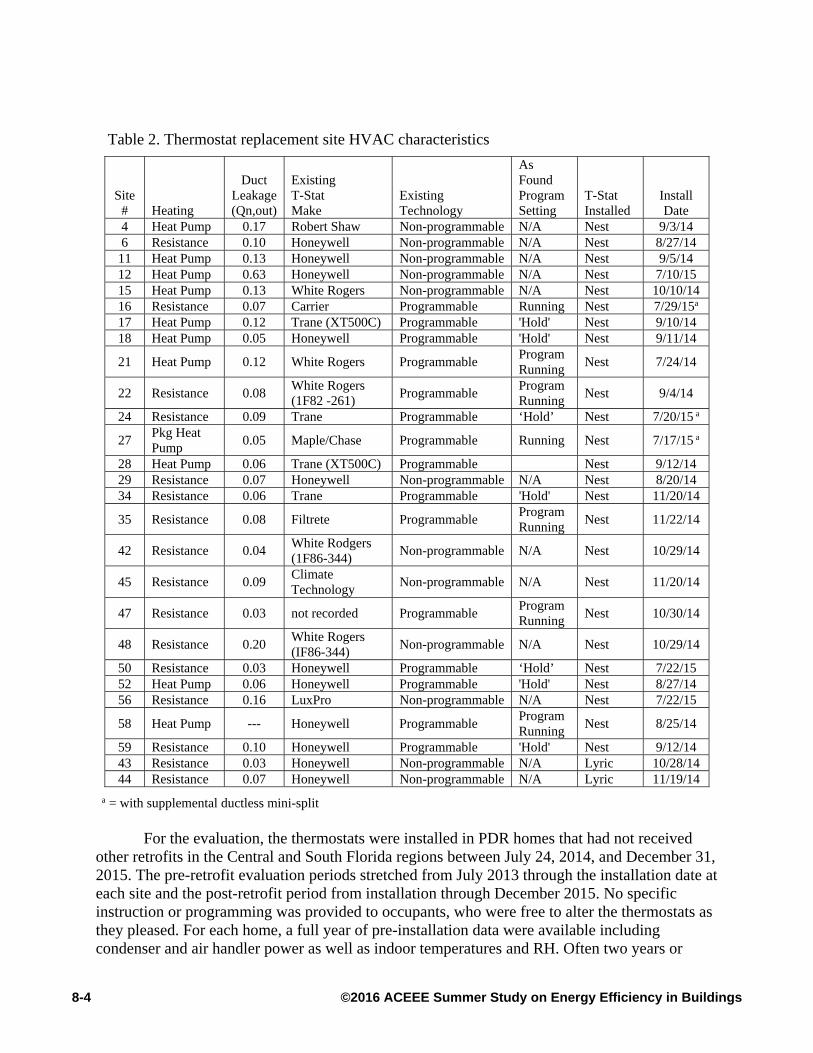
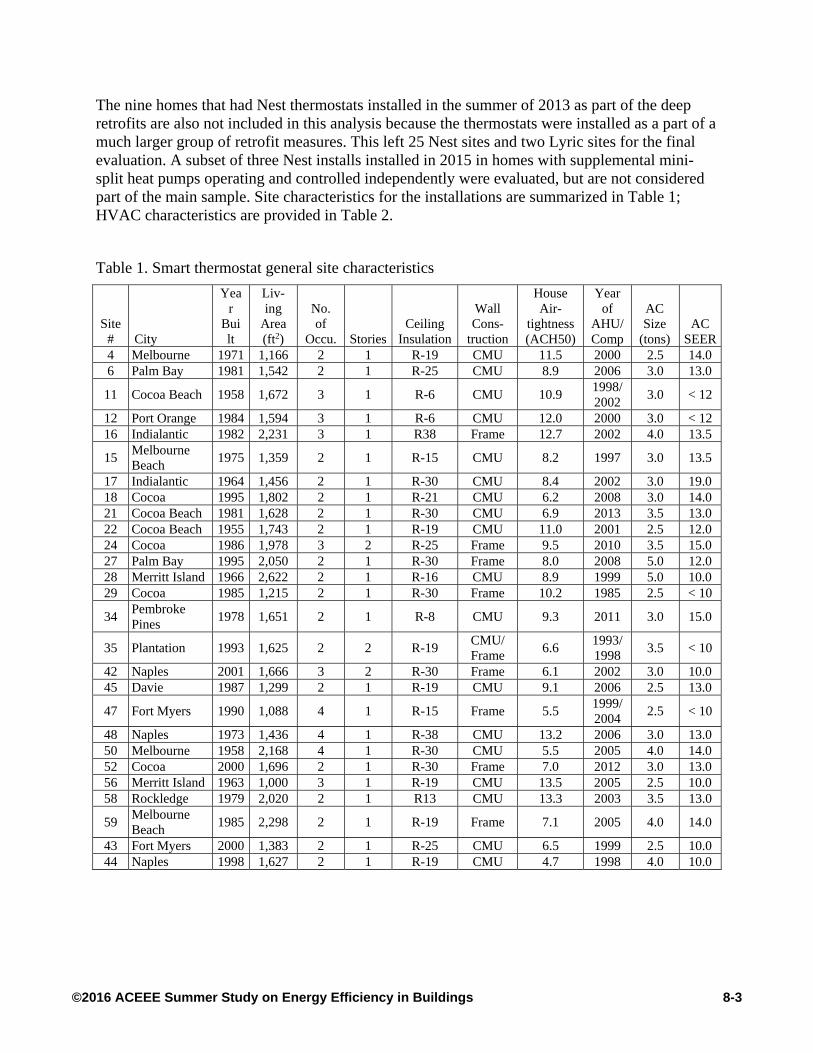
Table 2. Thermostat replacement site HVAC characteristics
Site # Heating
Duct Leakage (Qn,out)
Existing T-Stat Make
Existing Technology
As Found Program Setting
T-Stat Installed
Install Date
4 Heat Pump 0.17 Robert Shaw Non-programmable N/A Nest 9/3/14 6 Resistance 0.10 Honeywell Non-programmable N/A Nest 8/27/14
11 Heat Pump 0.13 Honeywell Non-programmable N/A Nest 9/5/14 12 Heat Pump 0.63 Honeywell Non-programmable N/A Nest 7/10/15 15 Heat Pump 0.13 White Rogers Non-programmable N/A Nest 10/10/14 16 Resistance 0.07 Carrier Programmable Running Nest 7/29/15a 17 Heat Pump 0.12 Trane (XT500C) Programmable 'Hold' Nest 9/10/14 18 Heat Pump 0.05 Honeywell Programmable 'Hold' Nest 9/11/14
21 Heat Pump 0.12 White Rogers Programmable Program Running
Nest 7/24/14
22 Resistance 0.08 White Rogers (1F82 -261)
Programmable Program Running
Nest 9/4/14
24 Resistance 0.09 Trane Programmable ‘Hold’ Nest 7/20/15 a
27 Pkg Heat Pump
0.05 Maple/Chase Programmable Running Nest 7/17/15 a
28 Heat Pump 0.06 Trane (XT500C) Programmable Nest 9/12/14 29 Resistance 0.07 Honeywell Non-programmable N/A Nest 8/20/14 34 Resistance 0.06 Trane Programmable 'Hold' Nest 11/20/14
35 Resistance 0.08 Filtrete Programmable Program Running
Nest 11/22/14
42 Resistance 0.04 White Rodgers (1F86-344)
Non-programmable N/A Nest 10/29/14
45 Resistance 0.09 Climate Technology
Non-programmable N/A Nest 11/20/14
47 Resistance 0.03 not recorded Programmable Program Running
Nest 10/30/14
48 Resistance 0.20 White Rogers (IF86-344)
Non-programmable N/A Nest 10/29/14
50 Resistance 0.03 Honeywell Programmable ‘Hold’ Nest 7/22/15 52 Heat Pump 0.06 Honeywell Programmable 'Hold' Nest 8/27/14 56 Resistance 0.16 LuxPro Non-programmable N/A Nest 7/22/15
58 Heat Pump --- Honeywell Programmable Program Running
Nest 8/25/14
59 Resistance 0.10 Honeywell Programmable 'Hold' Nest 9/12/14 43 Resistance 0.03 Honeywell Non-programmable N/A Lyric 10/28/14 44 Resistance 0.07 Honeywell Non-programmable N/A Lyric 11/19/14
a = with supplemental ductless mini-split
For the evaluation, the thermostats were installed in PDR homes that had not received other retrofits in the Central and South Florida regions between July 24, 2014, and December 31, 2015. The pre-retrofit evaluation periods stretched from July 2013 through the installation date at each site and the post-retrofit period from installation through December 2015. No specific instruction or programming was provided to occupants, who were free to alter the thermostats as they pleased. For each home, a full year of pre-installation data were available including condenser and air handler power as well as indoor temperatures and RH. Often two years or
8-4 ©2016 ACEEE Summer Study on Energy Efficiency in Buildings
more of pre-retrofit data were available, but only a full year was used for reasons described below. Plotted data revealed a balance point for each building between heating and cooling.
Time-Related Degradation in Air Conditioning Performance
In evaluating the smart thermostat sites with often two years of pre-data before the installation, we were careful to look for changes over the pre or post retrofit period to the air conditioning system—specifically AC replacement as it could severely bias results. However, in doing so with regression models tied to outdoor weather, we soon noted that performance of the cooling system at most sites seemed to be worse in the year leading up to the Nest install than it was the second year before. This was measureable given the regression techniques along with the monitored pure HVAC circuits.
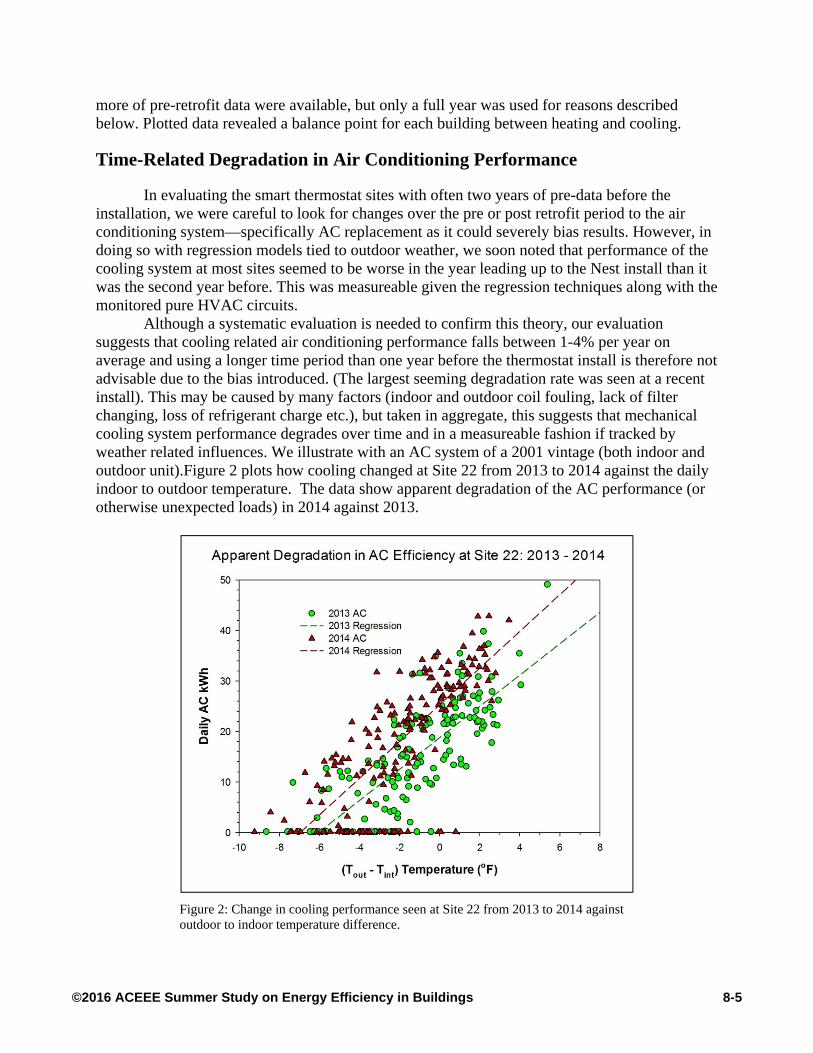
Although a systematic evaluation is needed to confirm this theory, our evaluation suggests that cooling related air conditioning performance falls between 1-4% per year on average and using a longer time period than one year before the thermostat install is therefore not advisable due to the bias introduced. (The largest seeming degradation rate was seen at a recent install). This may be caused by many factors (indoor and outdoor coil fouling, lack of filter changing, loss of refrigerant charge etc.), but taken in aggregate, this suggests that mechanical cooling system performance degrades over time and in a measureable fashion if tracked by weather related influences. We illustrate with an AC system of a 2001 vintage (both indoor and outdoor unit).Figure 2 plots how cooling changed at Site 22 from 2013 to 2014 against the daily indoor to outdoor temperature. The data show apparent degradation of the AC performance (or otherwise unexpected loads) in 2014 against 2013.
Figure 2: Change in cooling performance seen at Site 22 from 2013 to 2014 against outdoor to indoor temperature difference.
8-5©2016 ACEEE Summer Study on Energy Efficiency in Buildings
Not only was this seen in Site 22, but in most sites where it could be examined—a trend of increasing consumption from one year to the next, even controlling for weather and interior temperature preferences. Accordingly, we decided it best to use one year of pre data along with one year of post data regardless of length of the data trail available.
Smart Thermostat Evaluation
The analysis method used to evaluate the performance of each Nest or Lyric installation was to summarize the pre-year data and compare daily measured space-conditioning energy to outdoor temperature. To help understand how energy use changed before and after the smart thermostat installation, the indoor temperatures being maintained were also compared to the outdoor temperatures in an attempt to identify specific thermostat control effects. These changes were explored extensively for cases where energy use actually increased.
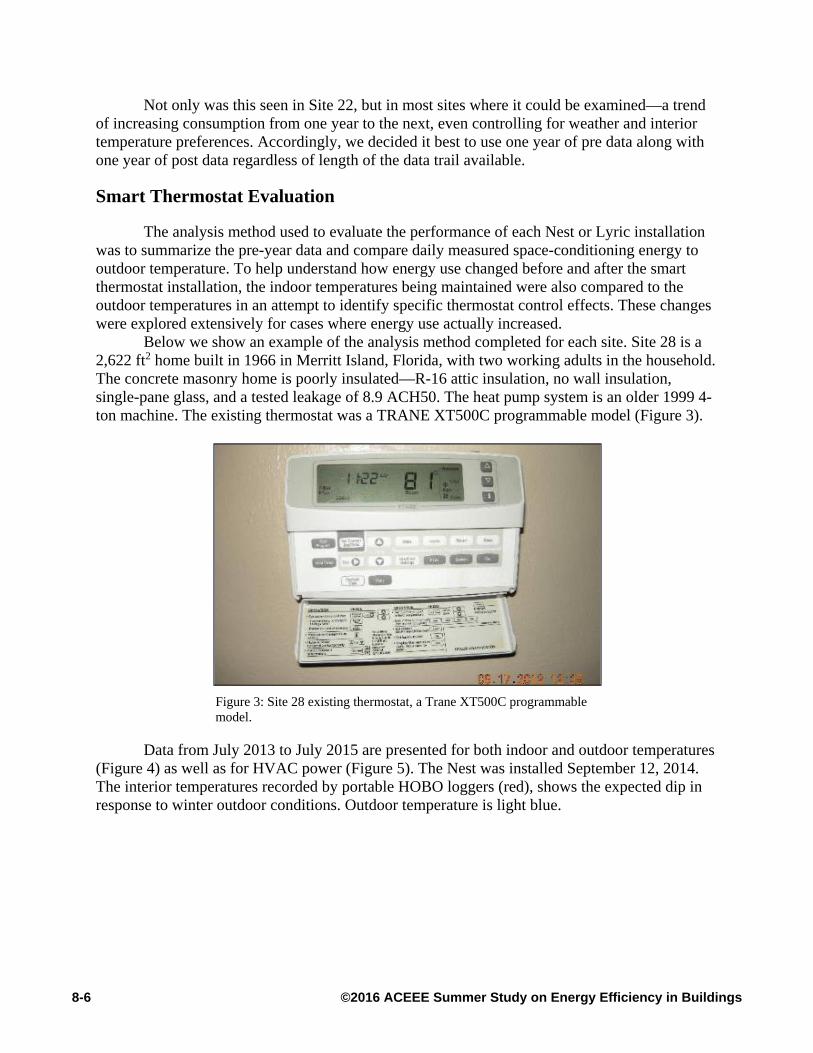
Below we show an example of the analysis method completed for each site. Site 28 is a 2,622 ft2 home built in 1966 in Merritt Island, Florida, with two working adults in the household. The concrete masonry home is poorly insulated—R-16 attic insulation, no wall insulation, single-pane glass, and a tested leakage of 8.9 ACH50. The heat pump system is an older 1999 4-ton machine. The existing thermostat was a TRANE XT500C programmable model (Figure 3).
Figure 3: Site 28 existing thermostat, a Trane XT500C programmable model.
Data from July 2013 to July 2015 are presented for both indoor and outdoor temperatures (Figure 4) as well as for HVAC power (Figure 5). The Nest was installed September 12, 2014. The interior temperatures recorded by portable HOBO loggers (red), shows the expected dip in response to winter outdoor conditions. Outdoor temperature is light blue.
8-6 ©2016 ACEEE Summer Study on Energy Efficiency in Buildings
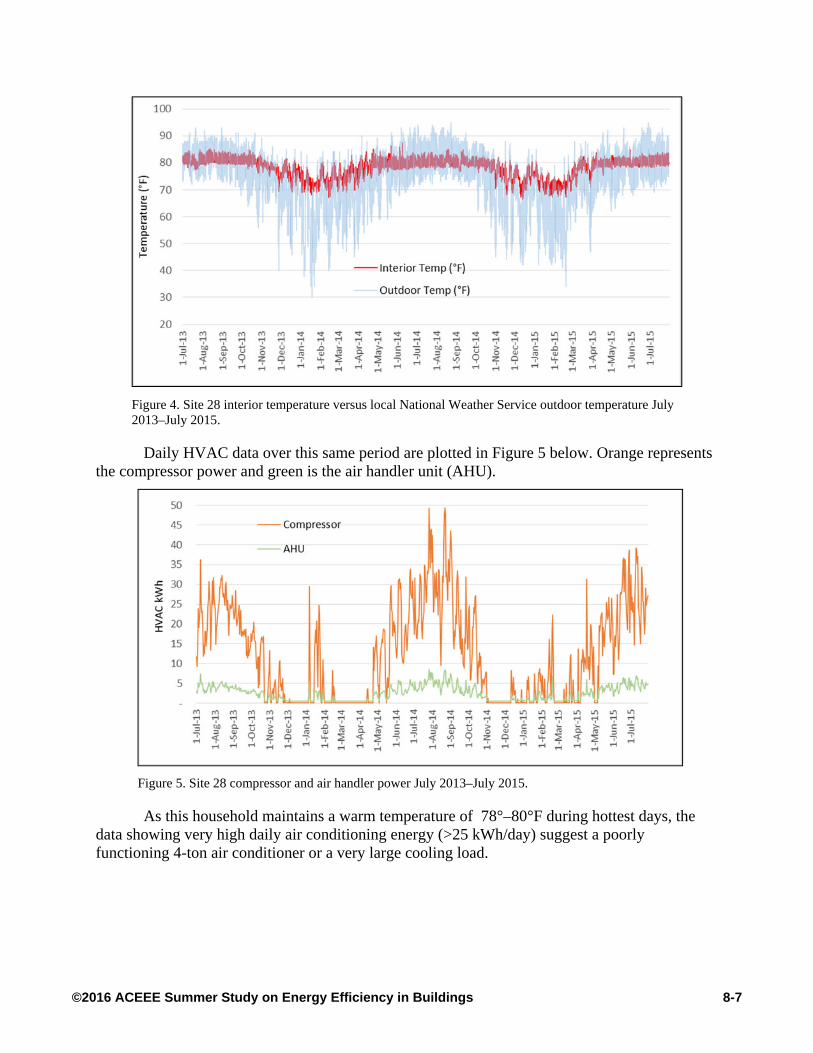
Figure 4. Site 28 interior temperature versus local National Weather Service outdoor temperature July 2013–July 2015.
Daily HVAC data over this same period are plotted in Figure 5 below. Orange represents the compressor power and green is the air handler unit (AHU).
Figure 5. Site 28 compressor and air handler power July 2013–July 2015.
As this household maintains a warm temperature of 78°–80°F during hottest days, the data showing very high daily air conditioning energy (>25 kWh/day) suggest a poorly functioning 4-ton air conditioner or a very large cooling load.
8-7©2016 ACEEE Summer Study on Energy Efficiency in Buildings
Analysis of Heating and Cooling Savings
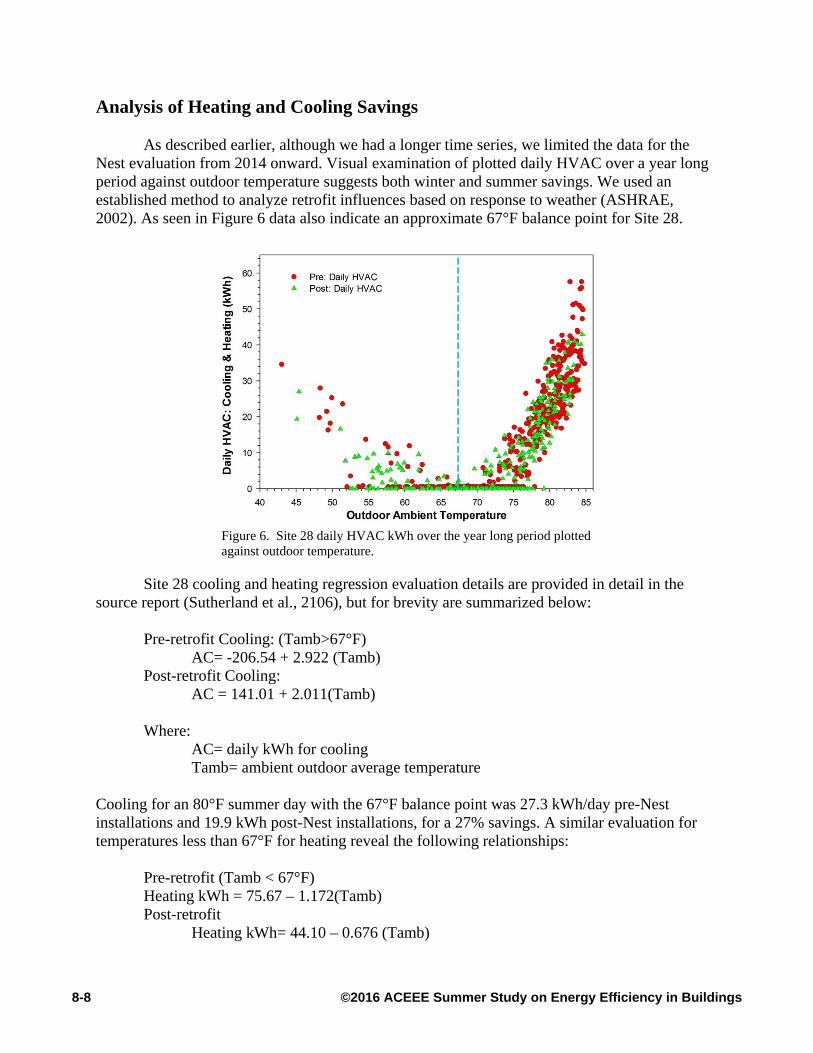
As described earlier, although we had a longer time series, we limited the data for the Nest evaluation from 2014 onward. Visual examination of plotted daily HVAC over a year long period against outdoor temperature suggests both winter and summer savings. We used an established method to analyze retrofit influences based on response to weather (ASHRAE, 2002). As seen in Figure 6 data also indicate an approximate 67°F balance point for Site 28.
Figure 6. Site 28 daily HVAC kWh over the year long period plotted against outdoor temperature.
Site 28 cooling and heating regression evaluation details are provided in detail in the source report (Sutherland et al., 2106), but for brevity are summarized below:
Pre-retrofit Cooling: (Tamb>67°F)
AC= -206.54 + 2.922 (Tamb) Post-retrofit Cooling:
AC = 141.01 + 2.011(Tamb)
Where: AC= daily kWh for cooling Tamb= ambient outdoor average temperature Cooling for an 80°F summer day with the 67°F balance point was 27.3 kWh/day pre-Nest installations and 19.9 kWh post-Nest installations, for a 27% savings. A similar evaluation for temperatures less than 67°F for heating reveal the following relationships:
Pre-retrofit (Tamb < 67°F)
Heating kWh = 75.67 – 1.172(Tamb) Post-retrofit Heating kWh= 44.10 – 0.676 (Tamb)
8-8 ©2016 ACEEE Summer Study on Energy Efficiency in Buildings
The heating the regression analysis indicated the following heating energy use savings: Pre-Nest installation was 17.1 kWh at 50°F; post-nest installation was 10.3 kWh, for 5.6 kWh or 60% savings due to many days with no heating with the Nest, likely due to vacancy.
Evaluation of Changes to Indoor Temperatures
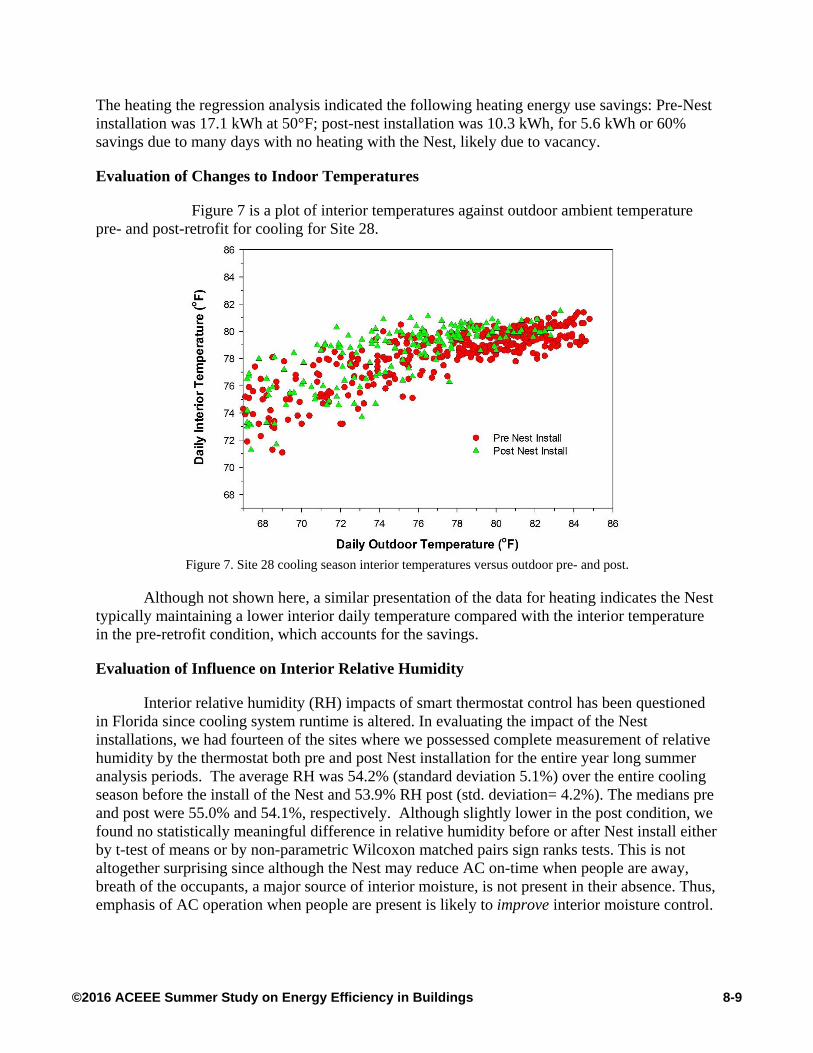
Figure 7 is a plot of interior temperatures against outdoor ambient temperature pre- and post-retrofit for cooling for Site 28.
Figure 7. Site 28 cooling season interior temperatures versus outdoor pre- and post.
Although not shown here, a similar presentation of the data for heating indicates the Nest typically maintaining a lower interior daily temperature compared with the interior temperature in the pre-retrofit condition, which accounts for the savings.
Evaluation of Influence on Interior Relative Humidity
Interior relative humidity (RH) impacts of smart thermostat control has been questioned in Florida since cooling system runtime is altered. In evaluating the impact of the Nest installations, we had fourteen of the sites where we possessed complete measurement of relative humidity by the thermostat both pre and post Nest installation for the entire year long summer analysis periods. The average RH was 54.2% (standard deviation 5.1%) over the entire cooling season before the install of the Nest and 53.9% RH post (std. deviation= 4.2%). The medians pre and post were 55.0% and 54.1%, respectively. Although slightly lower in the post condition, we found no statistically meaningful difference in relative humidity before or after Nest install either by t-test of means or by non-parametric Wilcoxon matched pairs sign ranks tests. This is not altogether surprising since although the Nest may reduce AC on-time when people are away, breath of the occupants, a major source of interior moisture, is not present in their absence. Thus, emphasis of AC operation when people are present is likely to improve interior moisture control.
8-9©2016 ACEEE Summer Study on Energy Efficiency in Buildings
Summary of Home-by-Home Analysis
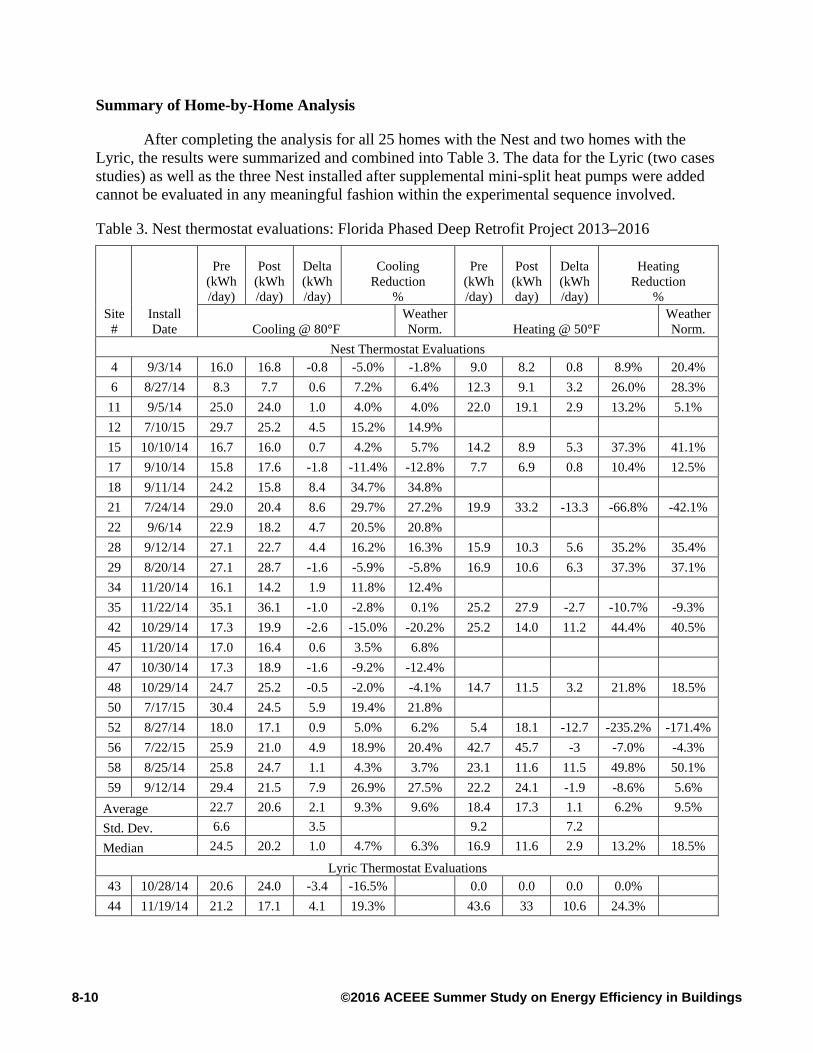
After completing the analysis for all 25 homes with the Nest and two homes with the Lyric, the results were summarized and combined into Table 3. The data for the Lyric (two cases studies) as well as the three Nest installed after supplemental mini-split heat pumps were added cannot be evaluated in any meaningful fashion within the experimental sequence involved.
Table 3. Nest thermostat evaluations: Florida Phased Deep Retrofit Project 2013–2016
Site #
Install Date
Pre (kWh /day)
Post (kWh/day)
Delta (kWh/day)
Cooling Reduction
%
Pre (kWh/day)
Post (kWh day)
Delta (kWh/day)
Heating Reduction
%
Cooling @ 80°F Weather Norm. Heating @ 50°F
Weather Norm.
Nest Thermostat Evaluations 4 9/3/14 16.0 16.8 -0.8 -5.0% -1.8% 9.0 8.2 0.8 8.9% 20.4%
6 8/27/14 8.3 7.7 0.6 7.2% 6.4% 12.3 9.1 3.2 26.0% 28.3%
11 9/5/14 25.0 24.0 1.0 4.0% 4.0% 22.0 19.1 2.9 13.2% 5.1%
12 7/10/15 29.7 25.2 4.5 15.2% 14.9%
15 10/10/14 16.7 16.0 0.7 4.2% 5.7% 14.2 8.9 5.3 37.3% 41.1%
17 9/10/14 15.8 17.6 -1.8 -11.4% -12.8% 7.7 6.9 0.8 10.4% 12.5%
18 9/11/14 24.2 15.8 8.4 34.7% 34.8%
21 7/24/14 29.0 20.4 8.6 29.7% 27.2% 19.9 33.2 -13.3 -66.8% -42.1%
22 9/6/14 22.9 18.2 4.7 20.5% 20.8%
28 9/12/14 27.1 22.7 4.4 16.2% 16.3% 15.9 10.3 5.6 35.2% 35.4%
29 8/20/14 27.1 28.7 -1.6 -5.9% -5.8% 16.9 10.6 6.3 37.3% 37.1%
34 11/20/14 16.1 14.2 1.9 11.8% 12.4%
35 11/22/14 35.1 36.1 -1.0 -2.8% 0.1% 25.2 27.9 -2.7 -10.7% -9.3%
42 10/29/14 17.3 19.9 -2.6 -15.0% -20.2% 25.2 14.0 11.2 44.4% 40.5%
45 11/20/14 17.0 16.4 0.6 3.5% 6.8%
47 10/30/14 17.3 18.9 -1.6 -9.2% -12.4%
48 10/29/14 24.7 25.2 -0.5 -2.0% -4.1% 14.7 11.5 3.2 21.8% 18.5%
50 7/17/15 30.4 24.5 5.9 19.4% 21.8%
52 8/27/14 18.0 17.1 0.9 5.0% 6.2% 5.4 18.1 -12.7 -235.2% -171.4%
56 7/22/15 25.9 21.0 4.9 18.9% 20.4% 42.7 45.7 -3 -7.0% -4.3%
58 8/25/14 25.8 24.7 1.1 4.3% 3.7% 23.1 11.6 11.5 49.8% 50.1%
59 9/12/14 29.4 21.5 7.9 26.9% 27.5% 22.2 24.1 -1.9 -8.6% 5.6%
Average 22.7 20.6 2.1 9.3% 9.6% 18.4 17.3 1.1 6.2% 9.5%
Std. Dev. 6.6 3.5 9.2 7.2
Median 24.5 20.2 1.0 4.7% 6.3% 16.9 11.6 2.9 13.2% 18.5%
Lyric Thermostat Evaluations 43 10/28/14 20.6 24.0 -3.4 -16.5% 0.0 0.0 0.0 0.0%
44 11/19/14 21.2 17.1 4.1 19.3% 43.6 33 10.6 24.3%
8-10 ©2016 ACEEE Summer Study on Energy Efficiency in Buildings
A total of 22 Nest sites lend themselves to summary. Here, the average savings for cooling (2.1 kWh/day at an outdoor daily temperature of 80°F) was 9.3%, but with a very high degree of variation. Indeed, the analysis showed that seven out of 22 sites experienced negative savings, which appeared largely as an artifact of pre-retrofit thermostat habits. These included homes where the existing programmable thermostat was properly setup (a distinct minority) or those with manual control that had been aggressively managed. In an aggregate distribution, for the sites that had positive savings, those savings were larger in magnitude than those experiencing negative savings. Not surprisingly, analysis of pre- and post-retrofit interior temperatures versus outdoor temperatures revealed that sites without savings often maintained lower indoor temperatures in the post-Nest installation period.
Weather Normalization and Extension to Utility Service Territory.
To compute the Nest savings, the regressions developed in the foregoing analysis for each site were then applied to the weather data from the typical meteorological year (TMY3) observations for the identified representative Florida locations. The results were then weighted by utility customer weights for those regions to estimate a final savings for Nest related cooling and heating in the overall PDR sample. Results of this evaluation are summarized in the “Weather Normalized” columns of Table 3.
The results indicate an average 9.6% or 498 kWh/year savings on cooling and 9.5% or 39 kWh/year given Florida’s limited heating season. The median results for cooling were lower due to the log-normal shape of annual consumption (lots of homes with low to moderate energy use, but with a long-tail of hi-users) 6.3% (219 kWh/year). Median results for space heating were 18.5%. Although there was a large difference between the mean and median for heating, the absolute savings numbers are quite small given Florida’s limited heating season (35 kWh/year).
Total annual savings would indicate kWh approximately $60 at $0.12/kWh. Simple payback for the Nest installation in this example would be about four years with an annual rate of return 24% – excellent for a low-cost retrofit measure. Our results advocate installing smart thermostats as part of the simple utility retrofit measures.
Whereas Nest evaluations in other U.S. regions showed annual savings of about 11%–15% (Nest 2015), the PDR indicated savings level was somewhat lower in this study of Florida single-family homes. We speculate, this likely stems from three factors:
• Florida homes tend to have high thermal capacitance, with slab-on-grade floors and concrete masonry walls that respond slowly to thermostat changes.
• The identified degradation rate of heat pump performance identified will tend to bias from one year before/after experiments with all measures, likely by 1-2%.
• Seasonal residents (about 4% of state population) were excluded from the PDR sample. Such residents, with long vacancy periods, would experience higher savings rates.
• Florida single-family homeowners are older than average (many retirees) and have higher occupancy rates (spend more time at home). These circumstances result in less savings from thermostat changes compared with other U.S. demographic groups.
That said, attached homes and rental homes in Florida have vacancy rates much higher
(13.2%) than other single-family homes (3.8%) in this study (Mazur and Wilson 2011). This is at least partly due to older Florida residents who migrate seasonally—so called “snowbirds”—and inflate the winter population by nearly 800,000 people (4% increase in temporary population),
8-11©2016 ACEEE Summer Study on Energy Efficiency in Buildings
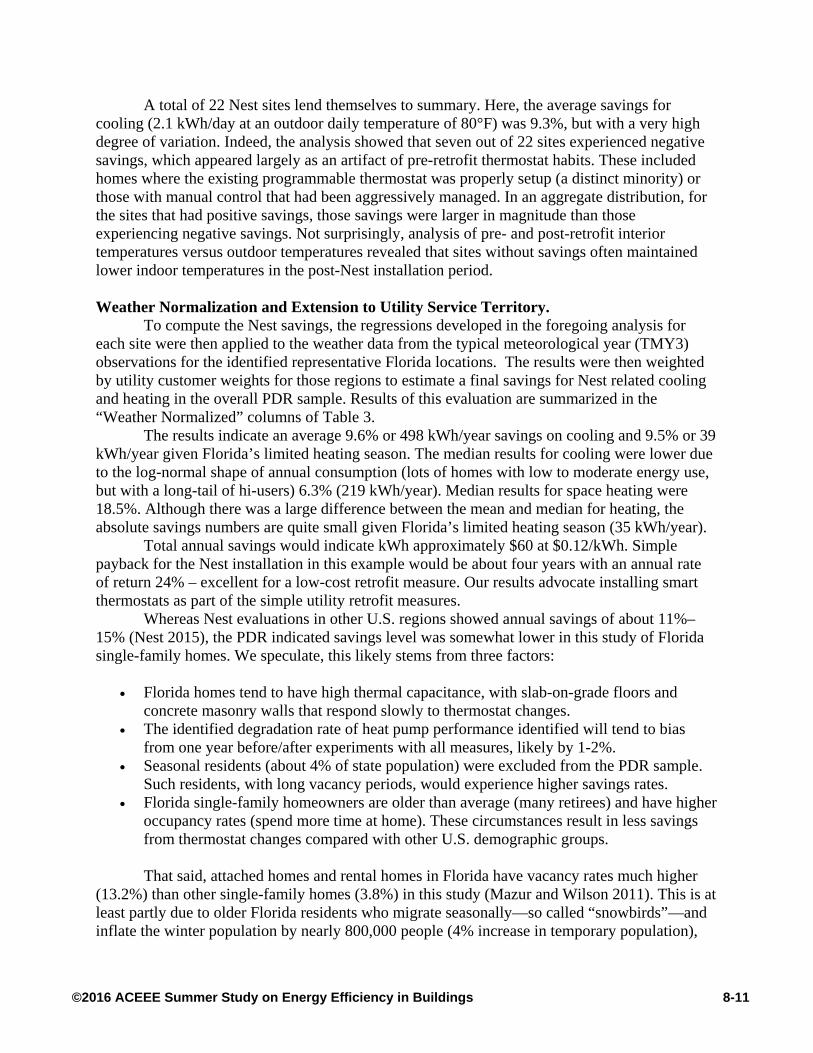
but are largely gone during the AC-intensive summer season (Smith and House 2006). Snowbirds may experience higher savings levels from smart thermostats, though not part of the evaluation. During the single-family analysis it was clear from data examination that the Nest thermostat achieved significant savings during longer periods of vacancy as seen in Figure 8.
Figure 8: Pre & post temperatures at Site 59 plotted against daily outdoor temperature; note 2-week period with higher set points with Nest (upper right).
Finally, it is important to note that Florida Power & Light Co., recently reported on its own internal monitoring evaluation of the smart thermostats in a separate project. This showed very similar results with estimated annual cooling energy savings of 450 kWh/year (Agnew, 2016), and would be considered statistically indistinguishable from the results shown here.
Smart Thermostat Impact on Summer &Winter Peak Demand
To examine Nest’s impact on peak demand, power demand at utility peak hours in 2014 were compared to those of 2015. Modest reductions to utility coincident peak electrical demand were seen – even though the Nest thermostats were not operating within their “Rush Hour Rewards” program which seeks to provide greater utility peak benefits. Figure 9 compares peak summer days for the 16 sites to receive their Nest installation between the summer peak of July 28, 2014 (pre) and August 20, 2015 (post). The reduction is 0.39 kW or 16% from 4 to 5 p.m.
8-12 ©2016 ACEEE Summer Study on Energy Efficiency in Buildings
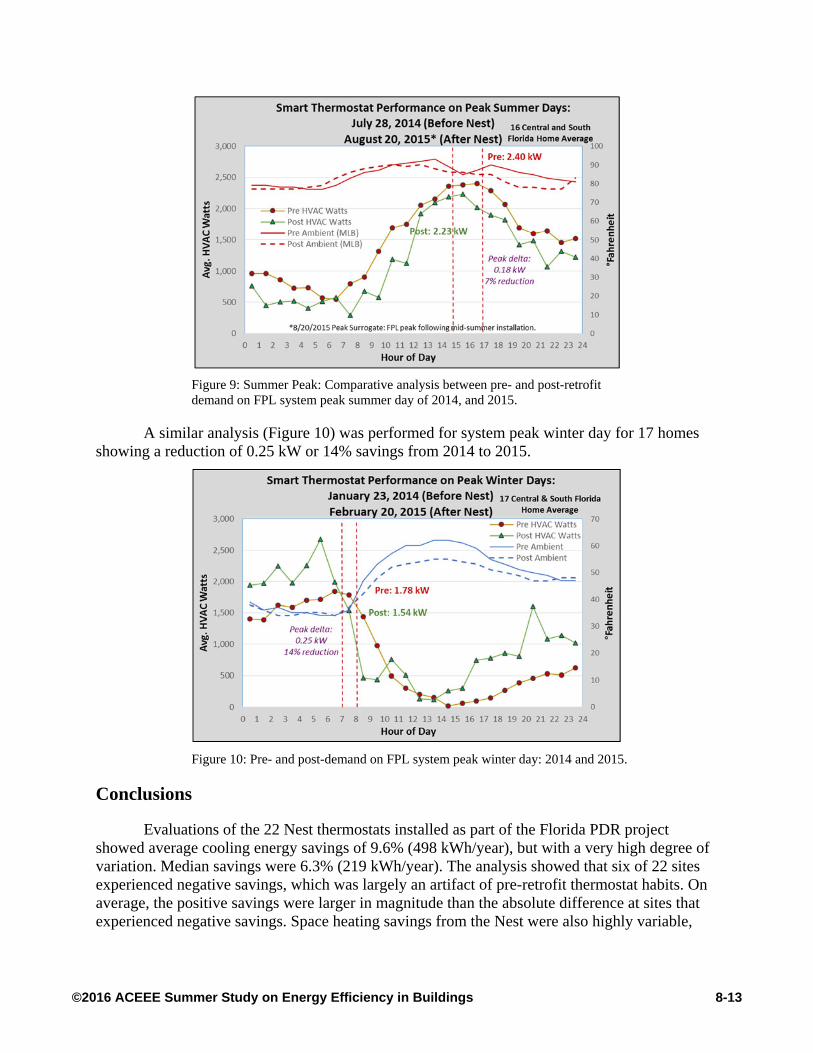
Figure 9: Summer Peak: Comparative analysis between pre- and post-retrofit demand on FPL system peak summer day of 2014, and 2015.
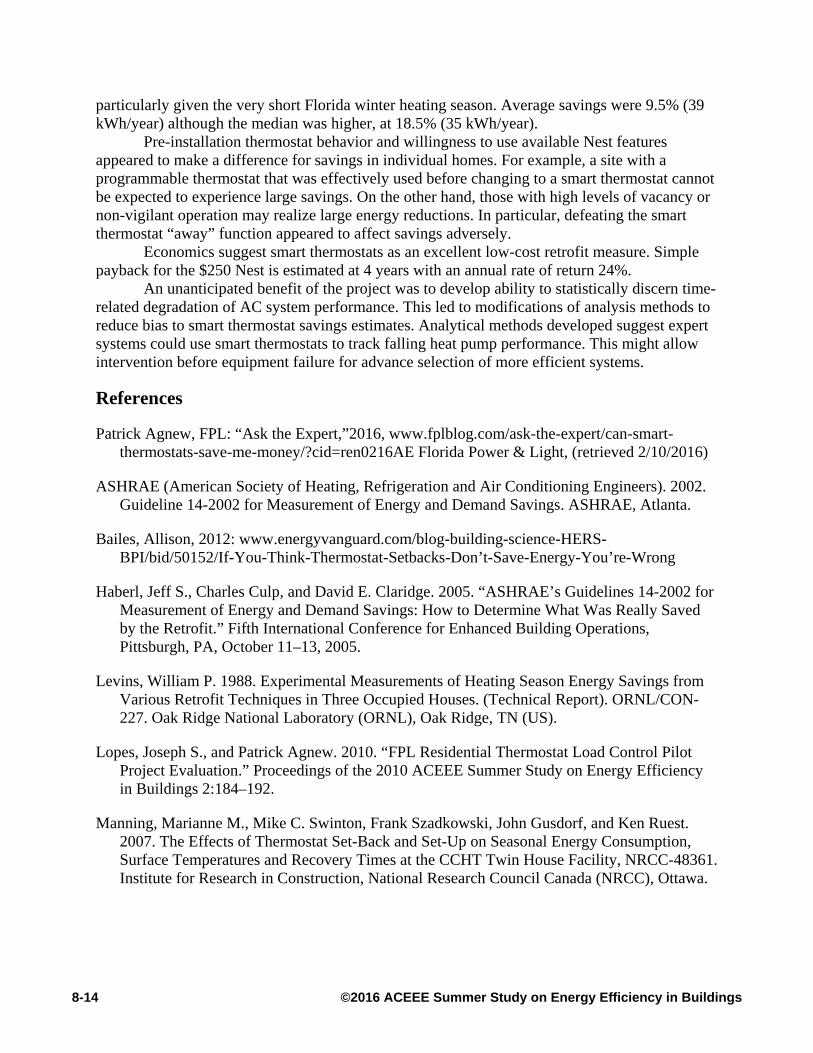
A similar analysis (Figure 10) was performed for system peak winter day for 17 homes showing a reduction of 0.25 kW or 14% savings from 2014 to 2015.
Figure 10: Pre- and post-demand on FPL system peak winter day: 2014 and 2015.
Conclusions
Evaluations of the 22 Nest thermostats installed as part of the Florida PDR project showed average cooling energy savings of 9.6% (498 kWh/year), but with a very high degree of variation. Median savings were 6.3% (219 kWh/year). The analysis showed that six of 22 sites experienced negative savings, which was largely an artifact of pre-retrofit thermostat habits. On average, the positive savings were larger in magnitude than the absolute difference at sites that experienced negative savings. Space heating savings from the Nest were also highly variable,
8-13©2016 ACEEE Summer Study on Energy Efficiency in Buildings
particularly given the very short Florida winter heating season. Average savings were 9.5% (39 kWh/year) although the median was higher, at 18.5% (35 kWh/year).
Pre-installation thermostat behavior and willingness to use available Nest features appeared to make a difference for savings in individual homes. For example, a site with a programmable thermostat that was effectively used before changing to a smart thermostat cannot be expected to experience large savings. On the other hand, those with high levels of vacancy or non-vigilant operation may realize large energy reductions. In particular, defeating the smart thermostat “away” function appeared to affect savings adversely.
Economics suggest smart thermostats as an excellent low-cost retrofit measure. Simple payback for the $250 Nest is estimated at 4 years with an annual rate of return 24%.
An unanticipated benefit of the project was to develop ability to statistically discern time-related degradation of AC system performance. This led to modifications of analysis methods to reduce bias to smart thermostat savings estimates. Analytical methods developed suggest expert systems could use smart thermostats to track falling heat pump performance. This might allow intervention before equipment failure for advance selection of more efficient systems.
References
Patrick Agnew, FPL: “Ask the Expert,”2016, www.fplblog.com/ask-the-expert/can-smart-thermostats-save-me-money/?cid=ren0216AE Florida Power & Light, (retrieved 2/10/2016)
ASHRAE (American Society of Heating, Refrigeration and Air Conditioning Engineers). 2002. Guideline 14-2002 for Measurement of Energy and Demand Savings. ASHRAE, Atlanta.
Bailes, Allison, 2012: www.energyvanguard.com/blog-building-science-HERS-BPI/bid/50152/If-You-Think-Thermostat-Setbacks-Don’t-Save-Energy-You’re-Wrong
Haberl, Jeff S., Charles Culp, and David E. Claridge. 2005. “ASHRAE’s Guidelines 14-2002 for Measurement of Energy and Demand Savings: How to Determine What Was Really Saved by the Retrofit.” Fifth International Conference for Enhanced Building Operations, Pittsburgh, PA, October 11–13, 2005.
Levins, William P. 1988. Experimental Measurements of Heating Season Energy Savings from Various Retrofit Techniques in Three Occupied Houses. (Technical Report). ORNL/CON-227. Oak Ridge National Laboratory (ORNL), Oak Ridge, TN (US).
Lopes, Joseph S., and Patrick Agnew. 2010. “FPL Residential Thermostat Load Control Pilot Project Evaluation.” Proceedings of the 2010 ACEEE Summer Study on Energy Efficiency in Buildings 2:184–192.
Manning, Marianne M., Mike C. Swinton, Frank Szadkowski, John Gusdorf, and Ken Ruest. 2007. The Effects of Thermostat Set-Back and Set-Up on Seasonal Energy Consumption, Surface Temperatures and Recovery Times at the CCHT Twin House Facility, NRCC-48361. Institute for Research in Construction, National Research Council Canada (NRCC), Ottawa.
8-14 ©2016 ACEEE Summer Study on Energy Efficiency in Buildings
Meier, Alan, Cecilia Aragon, Therese Peffer, Daniel Perry and Marco Pritoni. 2011. “Usability of Residential Thermostats: Preliminary Investigations.” Building and Environment. 46(10):1891–1898.
Nest. 2014. Energy Savings from Nest: The Impact of Having a Nest Learning Thermostat. (White Paper Summary). Nest Labs, Inc., Palo Alto, CA (US). .
Nest. 2015. Energy Savings from the Nest Learning Thermostat: Energy Bill Analysis Results. (White Paper Summary). Nest Labs, Inc., Palo Alto, CA (US).
Nevius, Monica J., and Scott Pigg. 2000. “Programmable Thermostats that Go Berserk? Taking a Social Perspective on Space Heating in Wisconsin.” Paper presented at the 2000 ACEEE Summer Study on Energy Efficiency in Buildings, Pacific Grove, California, August 20–25.
Nevius, Monica. 2000. “An Unexpected Setback for Programmable Thermostats.” Energy Design Update 20 (November):1–4.
NWS (National Weather Service). 2014. “Requirements and Standards for Climate Observation.” National Weather Service Instruction 10-1302, National Oceanic & Atmospheric Administration, November 14.
Parker, D., K. Sutherland, D. Chasar, J. Montemurno, B. Amos, and J. Kono 2016. Phased Retrofits in Existing Homes in Florida Phase I: Shallow and Deep Retrofits. National Renewable Energy Laboratory (NREL), Golden, CO (US), February 2016.
Roberts, David, and Kerylyn Lay. 2013. Variability in Measured Space Temperatures in 60 Homes. NREL/TP-5500-58059. National Renewable Energy Laboratory, Golden, CO.
Smith, Stanley K., and Mark House. 2006. “Snowbirds, Sunbirds and Stayers: Seasonal Migration of Elderly Adults in Florida.” Journal of Gerontology 61B(5):S232–S239.
Sutherland, K., D. Parker, E. Martin, D. Chasar, B. Amos. 2016. “Phased Retrofits in Existing Homes in Florida Phase II: Shallow Plus Retrofits (February 2016)” National Renewable Energy Laboratory (NREL), Golden, CO (US).
Vastamaki, R., Sinkkonen, I. and Leinonen, C., 2005. “A Behavioural Model of Temperature Controller Usage and Energy Saving.” Personal and Ubiquitous Computing 9(4):250–259.
8-15©2016 ACEEE Summer Study on Energy Efficiency in Buildings