Embed Size (px)
Citation preview
84
ISSN 1392-1258. EKONOMIKA 2014 Vol. 93(3)
EVALUATION OF THE PERSONAL INCOME PROGRESSIVE TAXATION AND THE SIZE OF TAX-EXEMPT AMOUNT IN LITHUANIA1
Egidijus Bikas*, Rasa Subačienė, Ieva Astrauskaitė, Greta Keliuotytė-StaniulėnienėVilnius University, Lithuania
Abstract. The tax systems of the European Union countries differ in many features. However, for taxing personal income, many EU countries use the method of progressive taxation. Progressive taxation is aimed to shift the tax burden from those with a relatively low income to those whose income is sufficiently high. Such personal income taxation system creates the prerequisites for social justice. In addition to different income tax rates, in a progressi-ve tax system, a crucial role is played by the size of tax-exempt amount. In this article, personal income progressive taxation and the tax-exempt amount are analyzed as one of the progressive taxation tools. The study was con-ducted using the method of descriptive analysis as well as forecasting and modeling techniques.
Key words: tax-exempt amount, personal income tax, impact on public finance
Introduction
Government revenue is the key mechanism ensuring economic growth and development. Government revenue is especially closely related with tax policy, because through taxes the economic factors that affect the national market and social policy and allow reducing social exclusion between the rich and the poor sections of society are controlled. In this case, taxes are the internal guarantee of social development in the country as well.
One of the most important elements of the tax system is the system of personal in-come taxation in which the importance of personal income taxes is revealed. On the one hand, it is important to choose the right system of personal income tax rates – regressive, proportional, and progressive – in order to mitigate the tax burden for persons with a low income. On the other hand, as indicated by J. Slemrod (1996), the issue of tax inci-dence has been the object of tax philosophy for more than a century; however, despite
1 Acknowledgement This research was funded by a grant (No. IEP-01/2012) from the Research Council of Lithuania.
* Corresponding author:Faculty of Economics, Department of Economic Policy, Vilnius University, Sauletekio Ave. 9, LT-10222 Vilnius, Lithuania. E-mail: [email protected]
85
numerous discussions on theoretical, practical and, political levels, there still exists a lack of consensus. According to J. Slemrod, the final answer to this question depends not only on ethical judgments for which the science of economics provides no insight, but also on the fundamental economic issues such as the nature and extent of income inequality and the behavioral response of taxpayers.
Personal income tax is one of the most important taxes in the Lithuanian tax sys-tem in terms of fiscal efficiency. The EU countries with high standards of living apply personal income taxes with a progressive rate structure, while Lithuania, along with Bulgaria, Romania and several other EU countries is trying to maintain the international competitive advantage by applying proportional tax rates.
Another Lithuania’s personal income tax distinctiveness among the EU countries is the application of the size of tax-exempt amount (TEA). The purpose of the size of TEA is to increase the income of persons whose annual income is minimal. From the social point of view, this element of personal income taxation is very important; however, the realities pre-suppose that this size is not significant enough, because this exemption is actually available and relevant only to individuals in the group of lowest income. Another important aspect of the size of TEA is that the application of this exemption distorts the actual fiscal burden.
In Lithuania, the major part of household income is related to labor; thus, it is likely that the analysis of this particular part of the personal income taxation system can help to identify the debatable issues.
The purpose of this article is to evaluate the personal income progressive taxation and the impact of the size of TEA application. To reach this goal, we used the following methods: analysis and synthesis of scientific literature and legislation, graphical and statistical data analysis, forecasting and modeling techniques. For the analysis, the fol-lowing factors of the research object were used: the number of employees in different gross income groups; the size of tax-exempt amount (in the analysis of revenues col-lected from the personal income tax); the personal income tax rate. The data period used for the analysis is 2004–20142.
Proportional and progressive taxation of personal income
When forming and reforming the tax system, one of the most important decisions is to choose the tax rate structure (proportional3, progressive4, or regressive5). While re-gressive tax rates are recognized as socially unjust6, the eligibility of proportional and
2 Prognostic values for the year 2014.3 The whole object (every taxable unit) is taxed with the same percentage rate; such taxes are called flat taxes.4 The rate increases with increasing the tax object. 5 The rate decreases with increasing the tax object.6 However, some authors (for example, Leontjeva, 2009) consider regressive taxation justified and useful, using
the term of “fee for the failure”.
86
progressive tax rates is widely discussed – the free market proponents are in favor of proportional rates and the proponents of social justice – in favor of progressive rates.
It is important to note that progressivity is primarily associated with vertical equality; however, the horizontal dimension of equality (equal persons are treated equally) should not be forgotten in the evaluation of tax progressivity in relation with tax fairness. In terms of income taxation, according to the requirement of horizontal equality, persons with the same income should pay the same amount of taxes. Using a wide definition of income, tax liability should not depend on the income source. However, the tax system’s abilities to reach different sources of income are unequal, what causes inability to fully tax capital income and not only leads to horizontal inequality among individuals with the same total income (with different capital income shares), but also reduces the progressiv-ity of income taxation in the upper scale of income distribution where the importance of capital income is the greatest. Failure to ensure horizontal equality in this case has also a negative impact on the implementation of vertical equality (Musgrave, 1996).
In the economic literature, there is a distinction between two approaches to how the tax burden should be distributed – by the benefit principle or by the ability-to-pay princi-ple. According to the principle of benefit, taxes are treated as a compensation for services provided by government to citizens (i.e. public goods). In this case, in order to distribute the tax burden properly, it is necessary to evaluate the benefit that a certain person gets from public goods (evaluation problem); moreover, this principle does not provide any practical guidelines to tax the progressivity issue. The ability-to-pay principle provides some practical guidelines to the issue of tax burden distribution. According to this prin-ciple, the tax burden should be allocated according to the ability to pay rather than to the benefit received, what means that taxes should increase together with income. However, as it is stated by J. Slemrod (1996), the modern approach to tax progressivity is focused on a balance between the social benefit of the equality of income distribution and eco-nomical costs induced by high marginal tax rates (the effect of negative incentive).
It is not disputed that in a progressive tax system the average tax rates increase with the income. However, as it is noted by W. W. Gale (1996), in order to assess the degree of progressivity in a certain tax system, it is necessary to define the terms accurately, i.e. what should be considered as a tax (it is a very important question if social security contributions are considered as a tax or excluded into a separate category) and what should be considered as income (the author presents an opinion that the lifetime income as compared with the annual income better reflects the taxpayer’s ability to pay taxes and therefore is a more accurate measure of tax progressivity). Using the size of lifetime income in the calculations of progressivity affects the results in such a way that a longer time period reduces the dispersion of tax rates. It is important to evaluate how much the lifetime income differs from the annual income (as it is suggested by D. Fullerton,
87
D. L. Rogers (1991)); it should be taken into account that calculations based on lifetime income can change the nature of some taxes, i.e. some taxes may prove to be more pro-gressive, less regressive, etc. For instance, it is estimated that the burden of sales, fuel, and excise taxes calculated on the basis of lifetime income is less regressive that the same tax burden based on annual income and can be proportional or even progressive (Metcalf, 1996; Poterba, 1991).
In addition, given the fact that social benefits are, at least partially, related to social contributions, in the evaluation of tax burden and the degree of taxation progressiv-ity, it is difficult to take into account these contributions in the same way as the other tax payments, i.e. by their nature social contributions are hardly treated as taxes (Gale, 1996). According to E. C. Steuerle (1996), when social security contributions and social benefits are assessed jointly, a tax system seem to be more progressive; on the other hand, R. A. Musgrave (1996) claims that in assessing changes of tax progressivity it is important to analyze changes of the pre-tax income distribution, especially if the degree of progressivity is considered to be the measure of taxation influence to income inequal-ity. R. A. Musgrave (1996) also notes that it is not correct to assess the distribution of the tax burden (conditioned by a tax system) without any relation to the expenditures of the budget; this becomes especially obvious while considering social security contribution (which tax base has clearly distinctive features and is of contractual nature).
Tax progressivity is usually measured by comparing the ratios of taxes paid and household income (in a broad sense) in different income groups (Scholz, 1996). When statutory marginal tax rates are very high, tax payers in the upper income groups seek to reduce their tax liabilities by investing in the assets which are the subjects of tax reliefs. Wealthy tax payers also can benefit from high marginal tax rates by reducing borrow-ing costs so that the post-tax borrowing costs would be lower than the pre-tax return on investment. If changes of investment portfolio composition as a response to tax changes are widespread, the actual progressivity of taxation can be much lower that the progres-sivity of statutory tax rates (Scholz, 1996).
In the analysis of tax burden distribution, the Suits index (individual indicator for a certain tax and aggregate indicator of multiple taxes) can be useful and informative. The Suits index is an analogue of the Gini coefficient designed on the tax basis. The Suits index is determined from the income concentration curve showing the relation between the aggregate tax burden and the aggregate income (Suits, 1977). In the case of a strictly proportional tax, the concentration curve corresponds to the straight line inclined by 45 degrees; a progressive tax will be below the 45 degree line; a regressive tax will be above the 45 degree line. The Suits index is calculated as follows: 1 minus the ratio of the area below the income concentration curve and the area below the 45 degree line. The calculated index value varies in the range from –1 to 1; the negative value indicates
88
a regressive taxation, the zero value shows a proportional taxation, and the positive value means a progressive taxation.
However, the taxation impact on the rising income inequality (a phenomenon when the rich are becoming richer and the poor more impoverished) is treated differently in the scientific literature. L. A. Karoly (1996) states that the increase of the marginal tax rate for the wealthiest individuals perhaps could allow poor people to feel better; however, its effect on income inequality decrease would be doubtful, i.e. the tax policy plays only a minor role in the upward trend of income inequality. L. Katz and K. Murphy (1992) analyzed the correlation of pre-tax salary size and the number of hours worked in dif-ferent groups of employees in the Unites States in the 1970–1980s and found a strong positive relationship between the increase of wages and increased unemployment, i.e. the demand better than taxes explains the rising income inequality.
The scientific economic literature deals with the issue of the optimal structure of a personal income tax (according to income equality and effectiveness) (for example, Slemrod, 1990). According to this theory, the optimal tax rate should be determined tak-ing into account the desired balance between an increased social welfare (due to a more even distribution of income) and losses of economic efficiency (caused by redistribu-tion).
The Lithuanian and foreign scientific literature usually identifies the following ad-vantages of proportional taxation:
• proportional taxation is relatively simple, clear an cheap in terms of tax adminis-tration (Hall et. al., 1995);
• proportional taxes protect the freedom of individuals as equally affecting all tax-payers, what reduces the possibility for the government to influence the activities of certain individuals and preferences, and does not distort the income distribution in the market (Shapiro, 1996);
• the application of proportional tax rates reduces the number of cases of tax eva-sion (Paulus et al., 2008);
• charging a uniform rate for all income groups can be considered as an incentive to work and earn more, what increases productivity (Leontjeva, 2009).
On the other hand, A. Paulus et al. (2008) indicate that proportional taxation results in a higher relative tax burden for taxpayers with a low income, because both rich and poor individuals are taxed by the same rate regardless of their income level. This means that such taxation has a negative effect on social justice and increases income inequality. Despite the simplicity of implementation of a purely proportional taxation, this taxation method is uncommonly used in practice, since it is likely that the perception of social justice and equality in society would contradict the general proportional tax. This re-quires setting at least a minimum level of tax-exempt. Such exemption, combined with
89
a flat rate, leads to different effective tax rates than in the case of a purely proportional tax (Musgrave, 1996).
R. J. Shapiro (1996) points out that progressive taxation is considered to be more favorable to social justice because it implements the objective of income distribution better than do proportional taxes, because individuals with a low income are charged at a smaller sum of tax than individuals with a higher income, thus improving the living conditions of the poor. The main disadvantages of progressive taxation are as follows:
• progressive taxes impede incentives and the growth of productivity – people are not intended to work more and efficiently as rising incomes increase the sum of tax payable (Progresiniai mokesčiai..., 2009; Gentry, Hubbard, 2004);
• progressive taxation is usually more complicated and difficult, which in turn leads to higher costs of tax administration (however, it must be recognized that the sim-plicity and clarity of the tax system depends not only on the choice of tax rates, but also on the number of tax benefits and exemptions applied – the clarity and simplicity of a progressive tax can be achieved by reducing the number of tax brackets in the progressive tax structure (The case of flat taxes..., 2005).
R. P. Inman (1996) describes the progressivity of taxation as a measure to describe the tax incidence in a certain tax system. Progressivity and the majority of its numerical expressions, according to R. P. Inman (1996), primarily is focused on economic fairness, i.e. on the concept related to the distribution of resources, specifically to what resources people have before they start the private consumption of goods and services; the question should be answered if each person has fair and equitable opportunities to acquire what one personally considers to be most acceptable.
Due to the fact that the scientific approach to the degree of government involvement in economic processes, as well as the need of the functioning income redistribution and the cost of this function is not unanimous, there is no consensus about the right, fair, and optimal degree of progressivity. The degree of progressivity chosen when forming the tax system of a certain country may depend on the pre-tax income inequality. In this case, the taxation tends to be more progressive.
As it is argued by J. C. Conesa and D. Krueger (2005), the introduction of a progres-sive income taxation can potentially contribute to a more equal income distribution, which, in turn, can lead to a more equal distribution of consumption, wealth, and overall welfare. On the other hand, the same authors note that progressive taxation has some undesirable effect expressed as distortions of individual and corporate saving decisions and labor supply incentives. The appropriate balance of these effects is very difficult to find both theoretically and practically.
When dealing with the problem of progressive taxation and trying to decide whether rich people should be charged higher tax rates, it is necessary to determine whether it
90
is practically possible. If the increase of tax rate for the wealthiest individuals does not lead to the increase of income tax revenues, such change of taxation will have no benefit for society (Slemrod, 1996); if higher tax rates lead to higher collected tax revenues but cause a strong behavioral response of taxpayers, the economic costs of increased tax revenues may be rather high and even exceed the benefit of increased tax revenues. K. P. Sabirianova el. al. (2009) have examined the taxation of personal income in 189 countries in 1981–2005 and have found that in high-income countries there exists a posi-tive relation between the rates of a personal income tax and the collected tax revenues, although this relation is much weaker in countries with a lower economic development and weaker institutions.
The literature often deals with issues closely related to progressive taxation – the fac-tors influencing the choice of taxation progressivity and its degree. R. Musgrave (1996) argues that the desired degree of progressivity should be floated before determining the structure of a certain tax system. The same author indicates that complex systems of personal income or expenditure taxation can be justified only when a certain degree of taxation progressivity is desired. J. Slemrod (1996) notes that before deciding about the size of tax burden and the degree of progressivity, the real (actual) tax incidence, i.e. the possibility of tax transfer, should be evaluated.
Lithuanian and foreign scientists distinguish such main advantages of progressive taxation as the focus of the system on economic fairness, income redistribution, social justice, and such disadvantages as a complicated taxation system, which leads to higher costs, rising incomes, increases the sum of tax payable and thus leads to inefficient work.
Tax-exempt amount as a tool of personal income progressivity
The varying degree of progressivity of personal income taxation, even in case of propor-tional tax rate, is ensured by the application of the size of tax-exempt amount. As stated by G. M. Pajuodienė (1996), this size should be set so as to ensure minimum consump-tion needs (for employees as well as retirees and recipients of social benefits) which, in turn, could help to reduce the necessity of some social benefits, i.e. the cross-flow of personal income tax payments and social benefits.
In terms of personal income taxation, G. M. Pajuodienė (1996) points out that it is necessary to find such a structure of personal income taxation at which the tax burden would not increase and even become more equal at different types of income (as well as partially for urban and rural households and for different social types of households). According to the author, personal income taxation using a proportional tax rate and the size of tax-exempt amount ensures a significant taxation progressivity in low income groups, but the degree of progressivity becomes much lower when the income increases (in groups of high income).
91
Lithuania as a member of the European Union is also part of this community’s sys-tem. The Treaty of Economic Community does not deal with the harmonization of direct taxes, which is why tax incentives in the EU countries are significantly divergent both by tax rates and the conditions of taxation (Gedvilienė, Šalkauskienė, 2009). The member states determine the taxation regime, tax base, tax rates, and tax exemptions as well as different competing ways of operating by themselves.
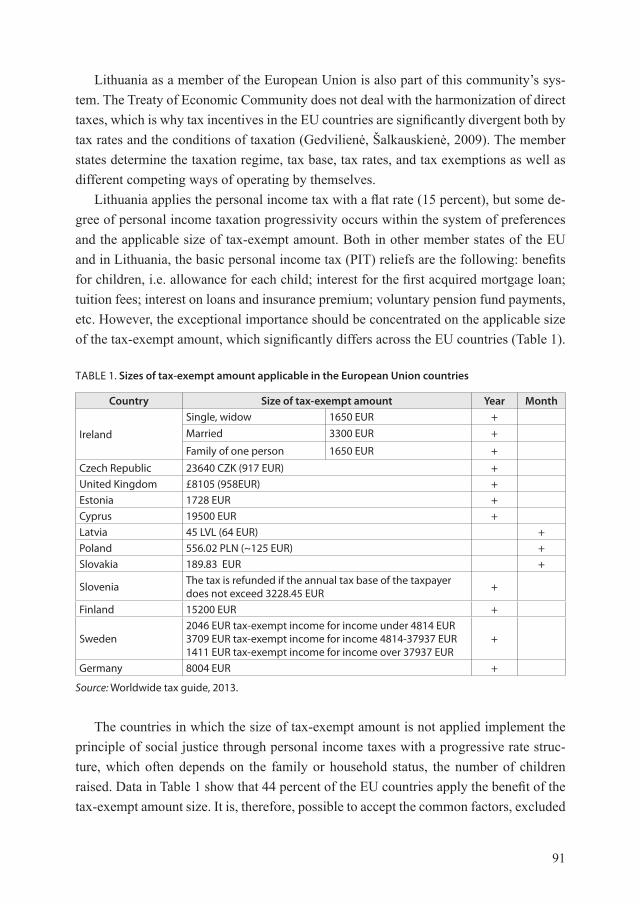
Lithuania applies the personal income tax with a flat rate (15 percent), but some de-gree of personal income taxation progressivity occurs within the system of preferences and the applicable size of tax-exempt amount. Both in other member states of the EU and in Lithuania, the basic personal income tax (PIT) reliefs are the following: benefits for children, i.e. allowance for each child; interest for the first acquired mortgage loan; tuition fees; interest on loans and insurance premium; voluntary pension fund payments, etc. However, the exceptional importance should be concentrated on the applicable size of the tax-exempt amount, which significantly differs across the EU countries (Table 1).
TABLE 1. Sizes of tax-exempt amount applicable in the European Union countries
Country Size of tax-exempt amount Year Month
Ireland
Single, widow 1650 EUR +Married 3300 EUR +
Family of one person 1650 EUR +
Czech Republic 23640 CZK (917 EUR) +United Kingdom £8105 (958EUR) +Estonia 1728 EUR +Cyprus 19500 EUR +Latvia 45 LVL (64 EUR) +Poland 556.02 PLN (~125 EUR) +Slovakia 189.83 EUR +
Slovenia The tax is refunded if the annual tax base of the taxpayer does not exceed 3228.45 EUR +
Finland 15200 EUR +
Sweden2046 EUR tax-exempt income for income under 4814 EUR3709 EUR tax-exempt income for income 4814-37937 EUR1411 EUR tax-exempt income for income over 37937 EUR
+
Germany 8004 EUR +
Source: Worldwide tax guide, 2013.
The countries in which the size of tax-exempt amount is not applied implement the principle of social justice through personal income taxes with a progressive rate struc-ture, which often depends on the family or household status, the number of children raised. Data in Table 1 show that 44 percent of the EU countries apply the benefit of the tax-exempt amount size. It is, therefore, possible to accept the common factors, excluded
92
by M. Gedvilienė and L. Šalkauskienė (2009), which affect the taxable income: tax re-liefs for families with children; tax-exempt amount size for single persons, disabled, people with limited ability, etc., individually set in each country.
In Lithuania, there is applied the size of tax-exempt amount, the additional size of the tax-exempt amount depending on the number of children, as well as deducible ex-penditures from the taxable income such as interests for the first acquired mortgage loan, computer purchase, life insurance premium, etc.
In the context of the changing economic conditions, the Lithuanian tax system was reformed at the end of 2008. Among other legislative corrections, changes of the Law of Personal Income Tax were adopted as well. These legislative changes influenced the application of preferences (LR Gyventojų..., 2008). These changes meant a fundamental reform of personal income taxation when not only the rate of the personal income tax was reduced, but also the model of the applicable size of the tax-exempt amount was changed (i.e. the limit of the maximum income to which the tax exempt size can be applied was established), as well as the income tax base was expanded, particularly by excluding of the number of tax incentives and including more taxpayers (Sudavičius, 2010).
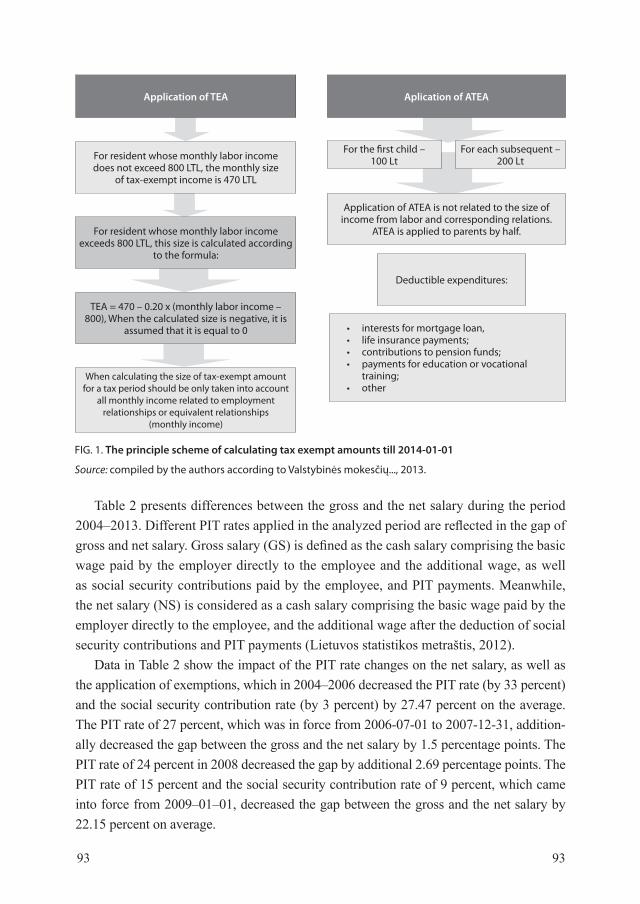
According to the tax reform, the labor income taxation scheme is based on the cal-culation and application of the size of tax-exempt amounts as it is provided for in Ar-ticle 20 of Law of Personal Income Tax. It is stated that when calculating the size of the tax-exempt amount for a tax period, all monthly income related to employment relationships or equivalent relationships (monthly income) should be only taken into account. The amount of monthly income determining the applicable monthly size of the tax-exempt amount includes wage, bonuses, premium (month, quarter, annual), sickness benefit for the first two days, compensation for unused vacation, payment for overtime work on holidays, weekends and at night, payment for downtime, wage for holidays, daily subsistence allowances which exceed the statutory limits, as well as all other ad-ditional earnings paid by the employer directly to the employee for his work (Valstybinės mokesčių..., 2013). The principle scheme of calculating the size of tax-exempt amount is presented in Fig. 1.
Since January 2014, this calculation procedure has been changed: the basic and ad-ditional sizes of the tax-exempt amount are calculated in accordance with the following provisions (Valstybinės mokesčių inspekcijos..., 2013):
1) for a resident whose monthly labor income does not exceed 1000 LTL, the month-ly size of the tax-exempt income is 570 LTL;
2) for a resident whose monthly labor income exceeds 1000 LTL, the monthly size of the tax-exempt income is calculated as TEA = 570 – 0.26 x (monthly labor income – 1000). When the calculated size is negative, it is assumed that it is equal to 0.
9393
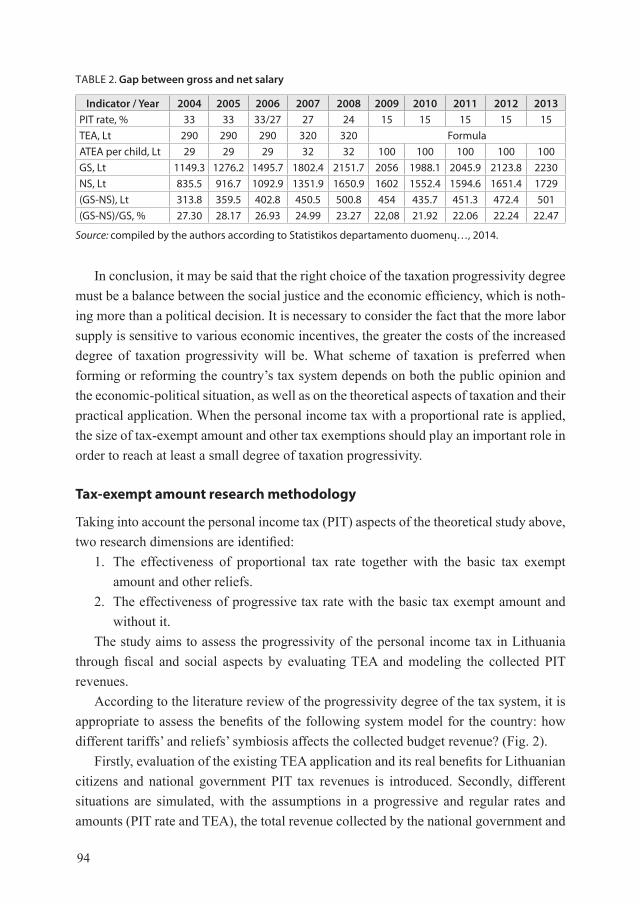
Table 2 presents differences between the gross and the net salary during the period 2004–2013. Different PIT rates applied in the analyzed period are reflected in the gap of gross and net salary. Gross salary (GS) is defined as the cash salary comprising the basic wage paid by the employer directly to the employee and the additional wage, as well as social security contributions paid by the employee, and PIT payments. Meanwhile, the net salary (NS) is considered as a cash salary comprising the basic wage paid by the employer directly to the employee, and the additional wage after the deduction of social security contributions and PIT payments (Lietuvos statistikos metraštis, 2012).
Data in Table 2 show the impact of the PIT rate changes on the net salary, as well as the application of exemptions, which in 2004–2006 decreased the PIT rate (by 33 percent) and the social security contribution rate (by 3 percent) by 27.47 percent on the average. The PIT rate of 27 percent, which was in force from 2006-07-01 to 2007-12-31, addition-ally decreased the gap between the gross and the net salary by 1.5 percentage points. The PIT rate of 24 percent in 2008 decreased the gap by additional 2.69 percentage points. The PIT rate of 15 percent and the social security contribution rate of 9 percent, which came into force from 2009–01–01, decreased the gap between the gross and the net salary by 22.15 percent on average.
FIG. 1. The principle scheme of calculating tax exempt amounts till 2014-01-01
Source: compiled by the authors according to Valstybinės mokesčių..., 2013.
Application of TEA Aplication of ATEA
For resident whose monthly labor income does not exceed 800 LTL, the monthly size
of tax-exempt income is 470 LTL
For resident whose monthly labor income exceeds 800 LTL, this size is calculated according
to the formula:
TEA = 470 – 0.20 x (monthly labor income – 800), When the calculated size is negative, it is
assumed that it is equal to 0
When calculating the size of tax-exempt amount for a tax period should be only taken into account
all monthly income related to employment relationships or equivalent relationships
(monthly income)
For the first child – 100 Lt
For each subsequent – 200 Lt
Application of ATEA is not related to the size of income from labor and corresponding relations.
ATEA is applied to parents by half.
Deductible expenditures:
• interestsformortgageloan,• lifeinsurancepayments;• contributionstopensionfunds;• paymentsforeducationorvocational
training;• other
94
In conclusion, it may be said that the right choice of the taxation progressivity degree must be a balance between the social justice and the economic efficiency, which is noth-ing more than a political decision. It is necessary to consider the fact that the more labor supply is sensitive to various economic incentives, the greater the costs of the increased degree of taxation progressivity will be. What scheme of taxation is preferred when forming or reforming the country’s tax system depends on both the public opinion and the economic-political situation, as well as on the theoretical aspects of taxation and their practical application. When the personal income tax with a proportional rate is applied, the size of tax-exempt amount and other tax exemptions should play an important role in order to reach at least a small degree of taxation progressivity.
Tax-exempt amount research methodology
Taking into account the personal income tax (PIT) aspects of the theoretical study above, two research dimensions are identified:
1. The effectiveness of proportional tax rate together with the basic tax exempt amount and other reliefs.
2. The effectiveness of progressive tax rate with the basic tax exempt amount and without it.
The study aims to assess the progressivity of the personal income tax in Lithuania through fiscal and social aspects by evaluating TEA and modeling the collected PIT revenues.
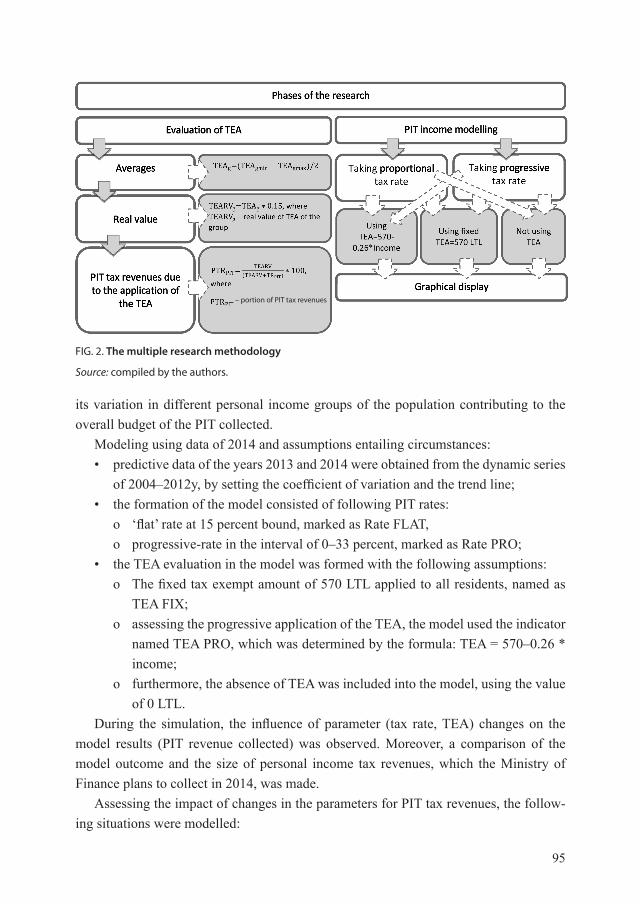
According to the literature review of the progressivity degree of the tax system, it is appropriate to assess the benefits of the following system model for the country: how different tariffs’ and reliefs’ symbiosis affects the collected budget revenue? (Fig. 2).
Firstly, evaluation of the existing TEA application and its real benefits for Lithuanian citizens and national government PIT tax revenues is introduced. Secondly, different situations are simulated, with the assumptions in a progressive and regular rates and amounts (PIT rate and TEA), the total revenue collected by the national government and
TABLE 2. Gap between gross and net salary
Indicator / Year 2004 2005 2006 2007 2008 2009 2010 2011 2012 2013PIT rate, % 33 33 33/27 27 24 15 15 15 15 15TEA, Lt 290 290 290 320 320 FormulaATEA per child, Lt 29 29 29 32 32 100 100 100 100 100GS, Lt 1149.3 1276.2 1495.7 1802.4 2151.7 2056 1988.1 2045.9 2123.8 2230NS, Lt 835.5 916.7 1092.9 1351.9 1650.9 1602 1552.4 1594.6 1651.4 1729(GS-NS), Lt 313.8 359.5 402.8 450.5 500.8 454 435.7 451.3 472.4 501(GS-NS)/GS, % 27.30 28.17 26.93 24.99 23.27 22,08 21.92 22.06 22.24 22.47
Source: compiled by the authors according to Statistikos departamento duomenų…, 2014.
95
its variation in different personal income groups of the population contributing to the overall budget of the PIT collected.
Modeling using data of 2014 and assumptions entailing circumstances: • predictive data of the years 2013 and 2014 were obtained from the dynamic series
of 2004–2012y, by setting the coefficient of variation and the trend line; • the formation of the model consisted of following PIT rates:
o ‘flat’ rate at 15 percent bound, marked as Rate FLAT, o progressive-rate in the interval of 0–33 percent, marked as Rate PRO;
• the TEA evaluation in the model was formed with the following assumptions: o The fixed tax exempt amount of 570 LTL applied to all residents, named as
TEA FIX; o assessing the progressive application of the TEA, the model used the indicator
named TEA PRO, which was determined by the formula: TEA = 570–0.26 * income;
o furthermore, the absence of TEA was included into the model, using the value of 0 LTL.
During the simulation, the influence of parameter (tax rate, TEA) changes on the model results (PIT revenue collected) was observed. Moreover, a comparison of the model outcome and the size of personal income tax revenues, which the Ministry of Finance plans to collect in 2014, was made.
Assessing the impact of changes in the parameters for PIT tax revenues, the follow-ing situations were modelled:
FIG. 2. The multiple research methodology
Source: compiled by the authors.
– portion of PIT tax revenues
96
• application of the “flat” PIT rate and fixed TEA; • application of the progressive PIT rate and fixed TEA; • application of the “flat” PIT rate and progressive scheme of TEA; • application of the progressive PIT rate and progressive scheme of TEA;• application of the “flat” PIT rate without any TEA; • application of the progressive PIT rate without any TEA.Regarding these six simulations, the collected PIT revenue extremes in accordance
with the criteria (staff size, TEA, tax rate) changes were monitored and graphically de-picted in the Tornado chart.
The impact of TEA relief on citizens’ and state income
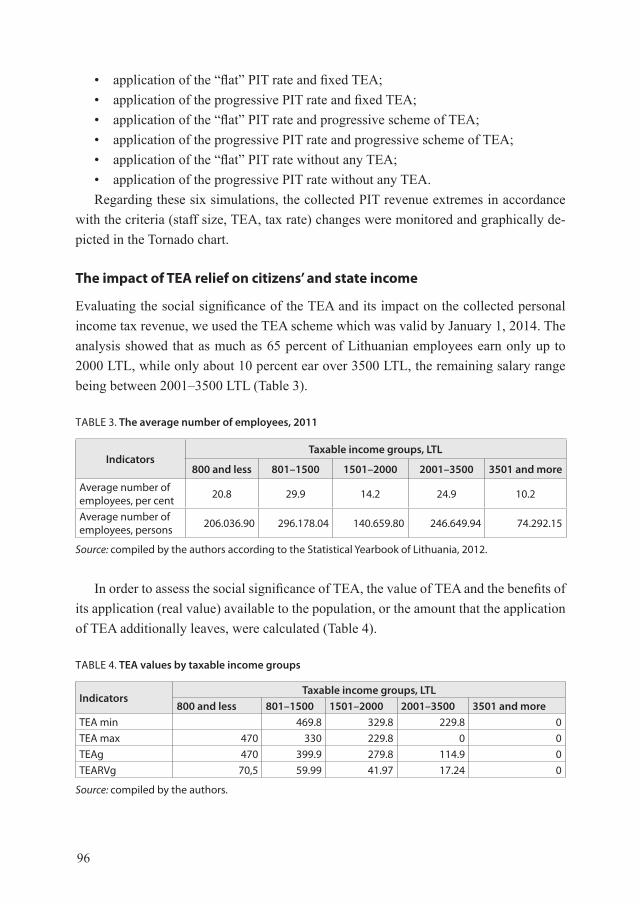
Evaluating the social significance of the TEA and its impact on the collected personal income tax revenue, we used the TEA scheme which was valid by January 1, 2014. The analysis showed that as much as 65 percent of Lithuanian employees earn only up to 2000 LTL, while only about 10 percent ear over 3500 LTL, the remaining salary range being between 2001–3500 LTL (Table 3).
TABLE 3. The average number of employees, 2011
IndicatorsTaxable income groups, LTL
800 and less 801–1500 1501–2000 2001–3500 3501 and more
Average number of employees, per cent 20.8 29.9 14.2 24.9 10.2
Average number of employees, persons 206.036.90 296.178.04 140.659.80 246.649.94 74.292.15
Source: compiled by the authors according to the Statistical Yearbook of Lithuania, 2012.
In order to assess the social significance of TEA, the value of TEA and the benefits of its application (real value) available to the population, or the amount that the application of TEA additionally leaves, were calculated (Table 4).
TABLE 4. TEA values by taxable income groups
IndicatorsTaxable income groups, LTL
800 and less 801–1500 1501–2000 2001–3500 3501 and moreTEA min 469.8 329.8 229.8 0TEA max 470 330 229.8 0 0TEAg 470 399.9 279.8 114.9 0TEARVg 70,5 59.99 41.97 17.24 0
Source: compiled by the authors.
97
It should be noted that the income of the Lithuanian population is a subject of a proportional tax rate, which aims to reduce social exclusion and increase the minimum wage-earning employment income. However, the results show that in 2011 this exemp-tion was used by only 20.8% of the working population. It can be argued that TEA fully implement the principle of social justice and do not reflect the more progressive taxation as the income increase minimizes the degree of progressivity.
While assessing the real value of the TEA in different taxable income groups, a com-mon TEA real value, which represents 42.448.454 LTL, was set. This is 1.13 percent of the overall PIT revenue (LR Finansų ministerijos nacionalinio..., 2014). This indicator can be regarded as a lack of significant size; therefore, it can be said that the practical ap-plication of TEA has no significant influence on the national government PIT revenues.
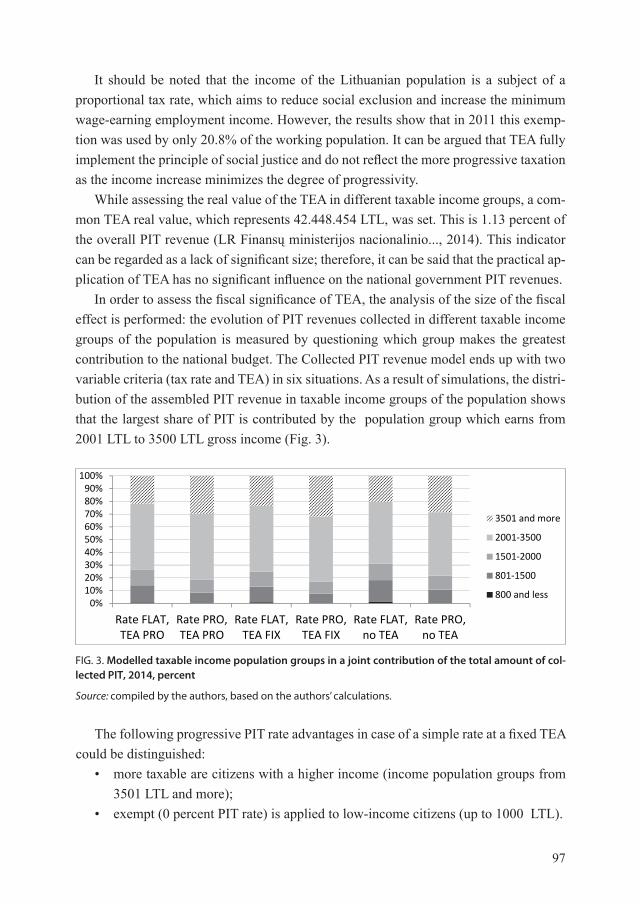
In order to assess the fiscal significance of TEA, the analysis of the size of the fiscal effect is performed: the evolution of PIT revenues collected in different taxable income groups of the population is measured by questioning which group makes the greatest contribution to the national budget. The Collected PIT revenue model ends up with two variable criteria (tax rate and TEA) in six situations. As a result of simulations, the distri-bution of the assembled PIT revenue in taxable income groups of the population shows that the largest share of PIT is contributed by the population group which earns from 2001 LTL to 3500 LTL gross income (Fig. 3).
FIG. 3. Modelled taxable income population groups in a joint contribution of the total amount of col-lected PIT, 2014, percent
Source: compiled by the authors, based on the authors’ calculations.
17
Fig.3. Modelled taxable income population groups in a joint contribution of the total amount of collected PIT, 2014, percent
Source: compiled by the authors, based on the authors' calculations
The biggest variation in structure of the PIT revenue collected is caused by the changes of tax
rate. While changing TEA application scheme (progressive, fixed or no TEA) significant changes were
not identified.
The conclusion of the small changes of total personal income tax revenue collected when
changing the TEA (fixed or progressive values) is tested by assembled PIT revenue growth rates
varying in the rage of [-2, 1] per cent.
Simulated total PIT revenues assembled to the national budget are presented in Figure 4.
Fig.4. Modelled and planned to collect amounts of PIT in 2014, LTL Source: compiled by the authors, based on the authors' calculations
0%10%20%30%40%50%60%70%80%90%
100%
Rate FLAT,TEA PRO
Rate PRO,TEA PRO
Rate FLAT,TEA FIX
Rate PRO,TEA FIX
Rate FLAT,no TEA
Rate PRO,no TEA
3501 and more
2001-3500
1501-2000
801-1500
800 and less
0,001000000,002000000,003000000,004000000,005000000,006000000,007000000,008000000,00
RateFLAT,TEAPRO
RatePRO,TEAPRO
RateFLAT,TEAFIX
RatePRO,TEAFIX
RateFLAT,
no TEA
RatePRO,
no TEA
Assembled PIT revenues
It is planned to assemble in2014 m.
The following progressive PIT rate advantages in case of a simple rate at a fixed TEA could be distinguished:
• more taxable are citizens with a higher income (income population groups from 3501 LTL and more);
• exempt (0 percent PIT rate) is applied to low-income citizens (up to 1000 LTL).
98
The biggest variation in the structure of the collected PIT revenue is caused by chang-es of the tax rate. While changing the TEA application scheme (progressive, fixed, or no TEA), no significant changes were identified.
The conclusion on small changes of the total personal income tax revenue collected when changing the TEA (fixed or progressive values) is tested by the collected assem-bled PIT revenue growth rates varying in the rage of [-2, 1] per cent.
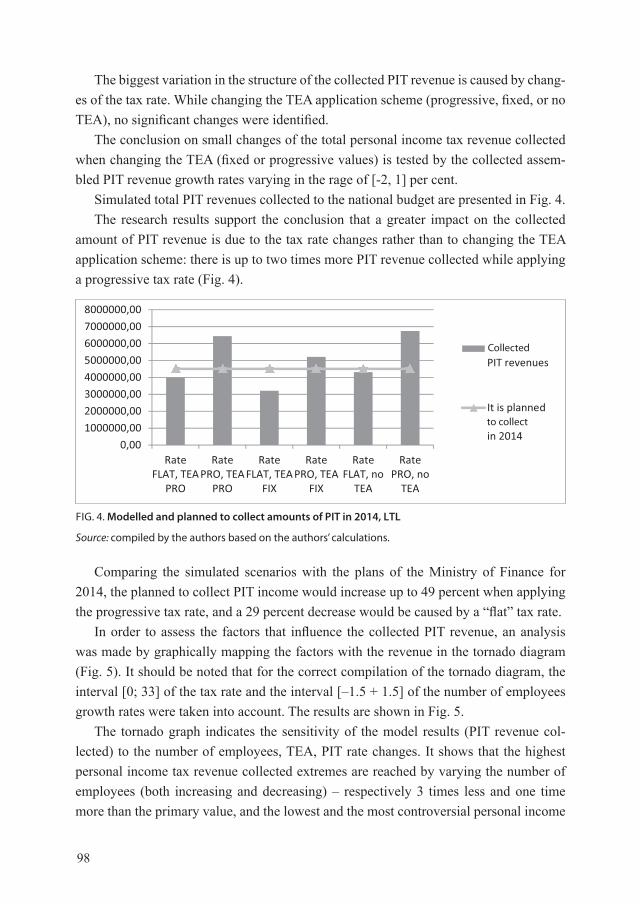
Simulated total PIT revenues collected to the national budget are presented in Fig. 4.The research results support the conclusion that a greater impact on the collected
amount of PIT revenue is due to the tax rate changes rather than to changing the TEA application scheme: there is up to two times more PIT revenue collected while applying a progressive tax rate (Fig. 4).
FIG. 4. Modelled and planned to collect amounts of PIT in 2014, LTL
Source: compiled by the authors based on the authors’ calculations.
0,00
1000000,00
2000000,00
3000000,00
4000000,00
5000000,00
6000000,00
7000000,00
8000000,00
RateFLAT, TEA
PRO
RatePRO, TEA
PRO
RateFLAT, TEA
FIX
RatePRO, TEA
FIX
RateFLAT, no
TEA
RatePRO, no
TEA
AssembledPIT revenues
It is plannedto assemblein 2014
Comparing the simulated scenarios with the plans of the Ministry of Finance for 2014, the planned to collect PIT income would increase up to 49 percent when applying the progressive tax rate, and a 29 percent decrease would be caused by a “flat” tax rate.
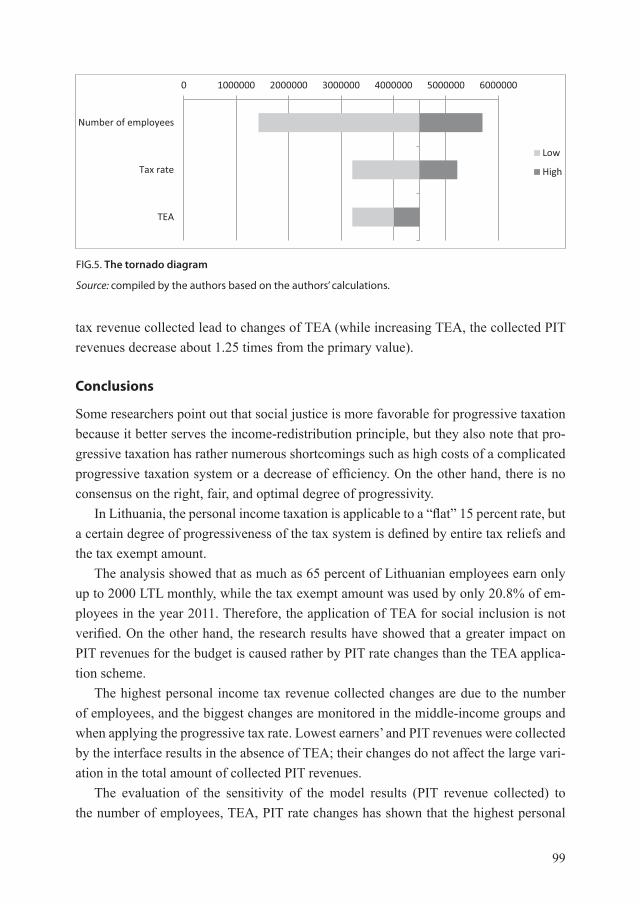
In order to assess the factors that influence the collected PIT revenue, an analysis was made by graphically mapping the factors with the revenue in the tornado diagram (Fig. 5). It should be noted that for the correct compilation of the tornado diagram, the interval [0; 33] of the tax rate and the interval [–1.5 + 1.5] of the number of employees growth rates were taken into account. The results are shown in Fig. 5.
The tornado graph indicates the sensitivity of the model results (PIT revenue col-lected) to the number of employees, TEA, PIT rate changes. It shows that the highest personal income tax revenue collected extremes are reached by varying the number of employees (both increasing and decreasing) – respectively 3 times less and one time more than the primary value, and the lowest and the most controversial personal income
Collected
to collect
99
tax revenue collected lead to changes of TEA (while increasing TEA, the collected PIT revenues decrease about 1.25 times from the primary value).
Conclusions
Some researchers point out that social justice is more favorable for progressive taxation because it better serves the income-redistribution principle, but they also note that pro-gressive taxation has rather numerous shortcomings such as high costs of a complicated progressive taxation system or a decrease of efficiency. On the other hand, there is no consensus on the right, fair, and optimal degree of progressivity.
In Lithuania, the personal income taxation is applicable to a “flat” 15 percent rate, but a certain degree of progressiveness of the tax system is defined by entire tax reliefs and the tax exempt amount.
The analysis showed that as much as 65 percent of Lithuanian employees earn only up to 2000 LTL monthly, while the tax exempt amount was used by only 20.8% of em-ployees in the year 2011. Therefore, the application of TEA for social inclusion is not verified. On the other hand, the research results have showed that a greater impact on PIT revenues for the budget is caused rather by PIT rate changes than the TEA applica-tion scheme.
The highest personal income tax revenue collected changes are due to the number of employees, and the biggest changes are monitored in the middle-income groups and when applying the progressive tax rate. Lowest earners’ and PIT revenues were collected by the interface results in the absence of TEA; their changes do not affect the large vari-ation in the total amount of collected PIT revenues.
The evaluation of the sensitivity of the model results (PIT revenue collected) to the number of employees, TEA, PIT rate changes has shown that the highest personal
FIG.5. The tornado diagram
Source: compiled by the authors based on the authors’ calculations.
0 1000000 2000000 3000000 4000000 5000000 6000000
Number of employees
Tax rate
TEA
Low
High
100
income tax revenue collected extremes are reached by varying the number of employees (both increasing and decreasing), and the lowest and the most controversial personal income tax revenue collected lead to changes of TEA (while increasing TEA and thus decreasing the collected PIT revenues).
REFERENCES
Conesa, J. C., Krueger, D. (2005). On the optimal progressivity of the income tax code. CFS Work-ing Paper, No. 2005/10. 57 p.
Gale, W. W. (1996). Comments on “Trends in Federal Tax Progressivity.” Kasten R., Sammartino F., Toder E. In Slemrod J., (ed.) Tax Progressivity and Income Inequality. Cambridge: 1996, p. 51–58.
Gedvilienė, M., Šalkauskienė, L. Darbo užmokesčio mokestinių lengvatų taikymo ypatumai Lietu-voje ir ES šalyse. Vadyba (Journal of Management) 2009, Nr. 3(16), p. 19–24. ISSN 1648-7974. The internet link: http://www.vlvk.lt/private/Vadybos%20turiniai/Vadyba_3%2816%29.pdf
Gentry, W. M., Hubbard, R. G. (2004). The effects of progressive income taxation on job turnover. Journal of Public Economics, Vol. 88(11), p. 2301–2322.
Hall, R. E., Rabushka, A. (1995). The Flat Tax (2nd ed.). Stanford: Hoover Institution Press. 152 p. Fullerton, D., Rogers, D. L. (1991). Lifetime versus annual perspective on tax incidence. National
Tax Journal, Vol. 44, No. 3, p. 277–287.Karoly, L. A. (1996). Trends in income inequality: the impact of, and implications for, tax policy.
Tax Progressivity and Income Inequality. Cambridge: 1996, p. 95–129.Katz, L., Murphy, K. (1992). Changes in relative wages, 1963–1987: supply and demand factors.
The Quarterly Journal of Economics, Vol. 107, No. 1, p. 35–78.Inman, R. P. (1996). Comments on “The lifetime incidence of state and local taxes: measuring
changes during the 1980s.“ by Metcalf G. E. in Slemrod J. (ed.). Tax Progressivity and Income Inequal-ity. Cambridge, p. 89–94.
Leontjeva K. (2009). Progresinių mokesčių pažadai. Mokesčių žinios, Nr. 13 (625). The inter-net link: http://www.lrinka.lt/index.php/meniu/ziniasklaidai/straipsniai_ir_komentarai/progresiniu_mokesciu_pazadai/5263;from_topic id;19.
Lietuvos Respublikos Gyventojų pajamų mokesčio įstatymo 2, 3, 5, 6, 7, 8, 9, 10, 12, 131, 16, 17, 18, 19, 20, 21, 22, 23, 27, 29, 30 straipsnių pakeitimo ir papildymo ir įstatymo papildymo 18¹ straipsniu įstatymas 2008 m. gruodžio 23 d. Nr. XI-111. The internet link: http://www3.lrs.lt/pls/inter3/dokpaies-ka.showdoc_l?p_id=334556&p_query=&p_tr2=2
Lietuvos statistikos metraštis (2012). Lietuvos statistikos departamentas. p. 149–181. ISSN 2029-3631. The internet link: http://web.stat.gov.lt/uploads/metrastis/1_LSM_2012.pdf
LR Finansų ministerijos nacionalinio biudžeto duomenys, (2014). The internet link: <www.finmin.lt>
LR gyventojų pajamų mokesčio įstatymas, 2002. The internet link: http://www3.lrs.lt/pls/inter3/dokpaieska.showdoc_l?p_id=464346
Metcalf, G. E. (1996). The lifetime incidence of state and local taxes: measuring changes during the 1980s. Tax Progressivity and Income Inequality. Cambridge, p. 59–88.
Musgrave, R. A. (1996). Progressive taxation, equity, and tax design. Tax Progressivity and Income Inequality. Cambridge: 1996, p. 341–356.
Pajuodienė, G. M. (1996). Gyventojų apmokestinimo ryšys su jų piniginėmis pajamomis. Vilnius: Lietuvos informacijos institutas. 60 p.
Paulus, A., Peichl, A. (2008). Effects of flat tax reforms in Western Europe on equity and efficiency. FiFo-CPE Discussion Paper, No. 08-4. 36 p.
101
Poterba, J. M. (1991). Is the gasoline tax regressive? NBER Working Paper, No. 3578. 37 p.Progresiniai mokesčiai – grįžimas į praeitį (2009). The internet link: http://www.lrinka.lt/index.
php/analitiniai_darbai/progresiniai_mokesciai__grizimas_i_praeiti/5254;from_topic_id;19Sabirianova, K. P., Buttrick, S., Duncan, D. (2009). Global reform of personal income taxation,
1981–2005: evidence from 189 countries. Andrew Young School of Policy Studies Research Paper Series No. 08-08. 53 p.
Scholz, J. K. (1996). Tax progressivity and household portfolios: descriptive evidence from the Survey of Consumer Finances. Tax Progressivity and Income Inequality. Cambridge, p. 219–267.
Shapiro, R. J. (1996). Why Fairness Matters: Progressive Versus Flat Taxes. Progressive Policy Institute. 48 p.
Slemrod, J. (1990). Optimal taxation and optimal tax systems. Journal of Economic Perspectives, No. 4 (Winter 1990), p. 157–178.
Slemrod, J. (1996). On the high-income Laffer curve. Tax Progressivity and Income Inequality. Cambridge, p. 177–210.
Statistikos departamento duomenys (2014). The internet link: http://www.stat.gov.ltSteuerle, C. E. (1996). Comments “On the high-income Laffer curve” by Slemrod, J In: Slemrod,
J. (ed.). Tax Progressivity and Income Inequality. Cambridge, p. 211–217.Sudavičius, B. (2010). Mokesčių lengvatos Lietuvos mokesčių teisės kontekste. Teisė Nr. 76, p. 100–
114. The internet link: http://etalpykla.lituanistikadb.lt/fedora/objects/LT-LDB-0001:J.04~2010~136717Suits, D. B. (1977). Measurement of Tax Progressivity. American Economic Review, Vol. 67 (4),
p. 747–752.The case for flat taxes – simplifying tax systems (2005). The Economist, 2005-04-14. The internet
link: http://findarticles.com/p/articles/mi_hb5037/ is_200504/ai_n18257009/ Valstybinės mokesčių inspekcijos duomenys (2014). The internet link: www.vmi.lt Valstybinės mokesčių inspekcijos konsultacinės medžiagos duomenų bazė (2013) – Konsultacinės
medžiagos katalogas / Valstybinė mokesčių inspekcija (2013). The internet link: http://mic.vmi.lt/docu-mentpublicone.do?&id=1000125907&tree_id=1000007584
Worldwide Tax Guide PKF (2012). The internet link: http://www.pkf.com/publications/tax-guides