Embed Size (px)
Citation preview
Evaluation of the Intel Westmere-EP server processor Sverre Jarp, Alfio Lazzaro, Julien Leduc, Andrzej Nowak CERN openlab, April 2010 – updated version 1.1
Executive Summary In this paper we report on a set of benchmark results recently obtained by CERN openlab when comparing the 6-core “Westmere-EP” processor with Intel’s previous generation of the same microarchitecture, the “Nehalem-EP”. The former is produced in a new 32nm process, the latter in 45nm. Both platforms are dual-socket servers. Multiple benchmarks were used to get a good understanding of the performance of the new processor. We used both industry-standard benchmarks, such as SPEC2006, and specific High Energy Physics benchmarks, representing both simulation of physics detectors and data analysis of physics events. Before summarizing the results we must stress the fact that benchmarking of modern processors is a very complex affair. One has to control (at least) the following features: processor frequency, overclocking via Turbo mode, the number of physical cores in use, the use of logical cores via Simultaneous Multi-Threading (SMT), the cache sizes available, the memory configuration installed, as well as the power configuration if throughput per watt is to be measured. We have tried to do a good job of comparing like with like. In summary, we see good scaling with the core count. We observed a very appreciable throughput increase of up to 61% when using the in-house benchmarks, compared to the previous processor generation. Our variant of the SPEC benchmark rate, “HEPSPEC06”, gives 32% more throughput. HEPSPEC per watt is measured to improve by up to 23% which is less than the improvement when going from Harpertown to Nehalem (36%). Benefits of SMT were seen to be of similar significance as in the previous processor generation.
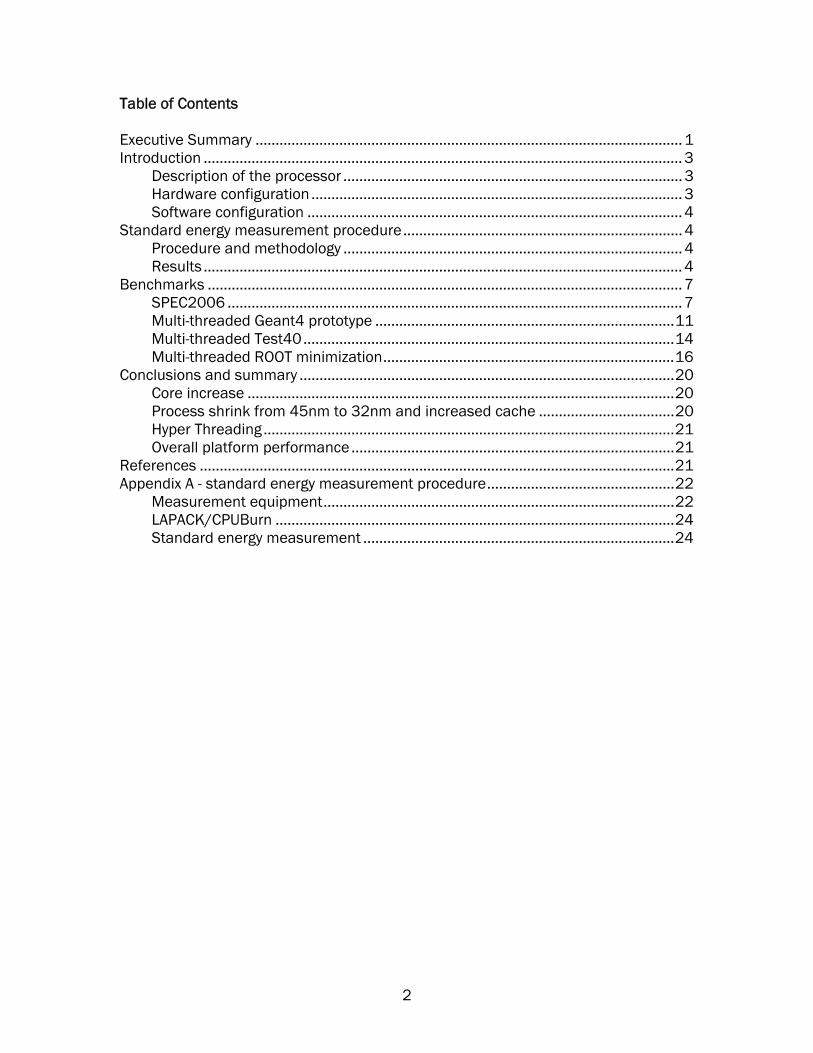
Table of Contents Executive Summary ...........................................................................................................1 Introduction ........................................................................................................................3
Description of the processor ..................................................................................... 3 Hardware configuration .............................................................................................3 Software configuration ..............................................................................................4
Standard energy measurement procedure...................................................................... 4 Procedure and methodology .....................................................................................4 Results ........................................................................................................................ 4
Benchmarks .......................................................................................................................7 SPEC2006 ..................................................................................................................7 Multi-threaded Geant4 prototype ...........................................................................11 Multi-threaded Test40.............................................................................................14 Multi-threaded ROOT minimization.........................................................................16
Conclusions and summary ..............................................................................................20 Core increase ...........................................................................................................20 Process shrink from 45nm to 32nm and increased cache ..................................20 Hyper Threading.......................................................................................................21 Overall platform performance.................................................................................21
References .......................................................................................................................21 Appendix A - standard energy measurement procedure...............................................22
Measurement equipment........................................................................................22 LAPACK/CPUBurn ....................................................................................................24 Standard energy measurement ..............................................................................24
2
Introduction Description of the processor The codename for Intel’s current Intel64 microarchitecture is “Nehalem”. The initial Nehalem processors (Xeon 5500s) used the same 45 nm manufacturing process as the “Penryn” processors. According to Intel’s well-known “tick-tock” model, the latest microarchitecture evolution is a “tick”, which corresponds to a shrink of the manufacturing process. “Westmere” is the name given to this 32 nm die shrink of Nehalem. The first new property of the Westmere (Xeon 5600) comes directly from the die shrink, allowing Intel to pack 50% more cores in each die (reaching 6 cores in total), and also 50% more of the shared L3 cache (reaching 12MB), compared to the Xeon 5500 processors. Moreover, Intel managed to add these 2 cores, and the 4MB bigger L3 cache, with no penalty in term of frequency, while keeping power consumption within the designed thermal envelope. In this paper we compare the Westmere-EP X5670, with 6 cores (12 threads) running at 2.93 GHz with a Thermal Design Power (TDP) of 95W, and the corresponding Nehalem-EP, the X5570, also at 2.93 GHz with a TDP of 95W and 4 cores (8 threads). These two processors have even more features in common: they are both equipped with two Quick Path Interconnect (QPI) links at 6.4 GT/s, and they both fit in the same LGA-1366 socket. Both support Simultaneous Multithreading (SMT) which allows two hardware threads to be scheduled on each core and both support Turbo-boost mode which allows the processor to increase its frequency when only few of the cores are in use, while maintaining power within the designed envelope. Westmere benefits from some features in addition to the ones inherited from the Nehalem:
Support for Huge pages of 1 GB A new set of instructions aimed at accelerating encryption and decryption
using the AES algorithm. Improved virtualization capabilities
Hardware configuration As mentioned above, the processor evaluated in this paper is an X5670 running at 2.93 GHz. Thanks to all its similarities with the previous generation, Intel mounted this processor on the same motherboard as its previous Nehalem-EP platform, using the same Intel 5520 (“Tylersburg”) chipset to connect the 2 QPI links to peripheral devices:
3
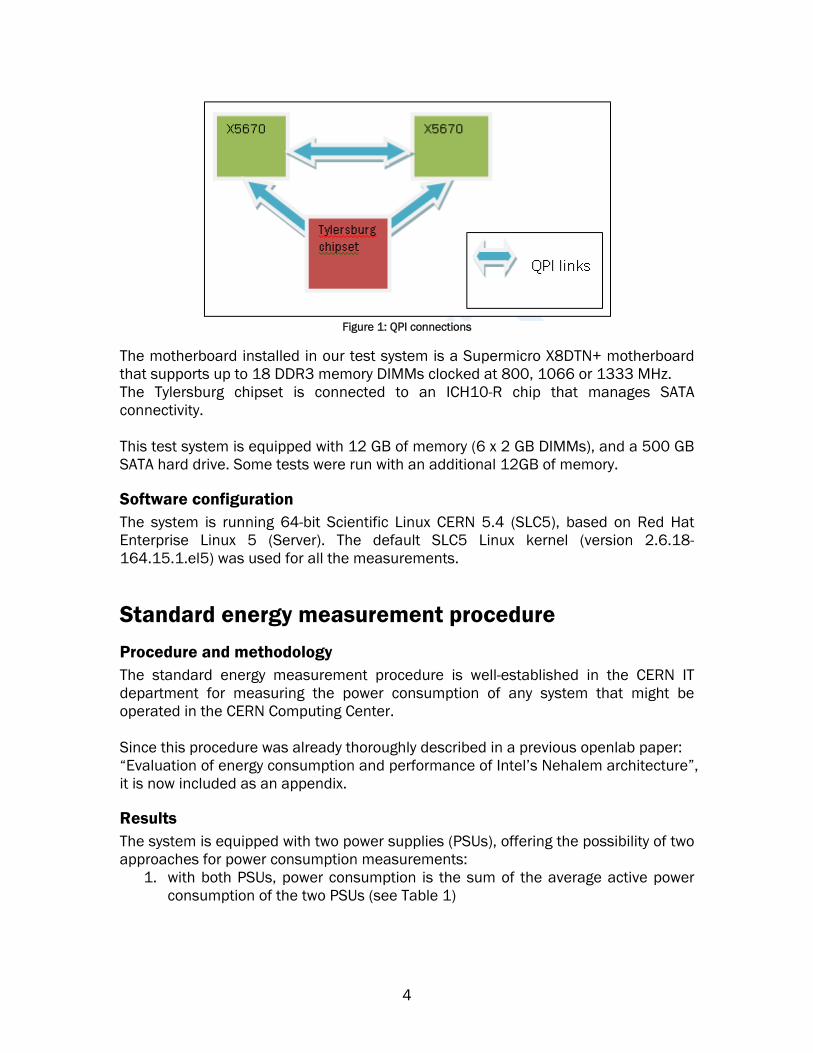
Figure 1: QPI connections
The motherboard installed in our test system is a Supermicro X8DTN+ motherboard that supports up to 18 DDR3 memory DIMMs clocked at 800, 1066 or 1333 MHz. The Tylersburg chipset is connected to an ICH10-R chip that manages SATA connectivity. This test system is equipped with 12 GB of memory (6 x 2 GB DIMMs), and a 500 GB SATA hard drive. Some tests were run with an additional 12GB of memory.
Software configuration The system is running 64-bit Scientific Linux CERN 5.4 (SLC5), based on Red Hat Enterprise Linux 5 (Server). The default SLC5 Linux kernel (version 2.6.18-164.15.1.el5) was used for all the measurements.
Standard energy measurement procedure Procedure and methodology The standard energy measurement procedure is well-established in the CERN IT department for measuring the power consumption of any system that might be operated in the CERN Computing Center. Since this procedure was already thoroughly described in a previous openlab paper: “Evaluation of energy consumption and performance of Intel’s Nehalem architecture”, it is now included as an appendix.
Results The system is equipped with two power supplies (PSUs), offering the possibility of two approaches for power consumption measurements:
1. with both PSUs, power consumption is the sum of the average active power consumption of the two PSUs (see Table 1)
4
2. with only one PSU: power consumption is the average active power of that single unit, the other one being unplugged from the electric outlet (see Table 2)
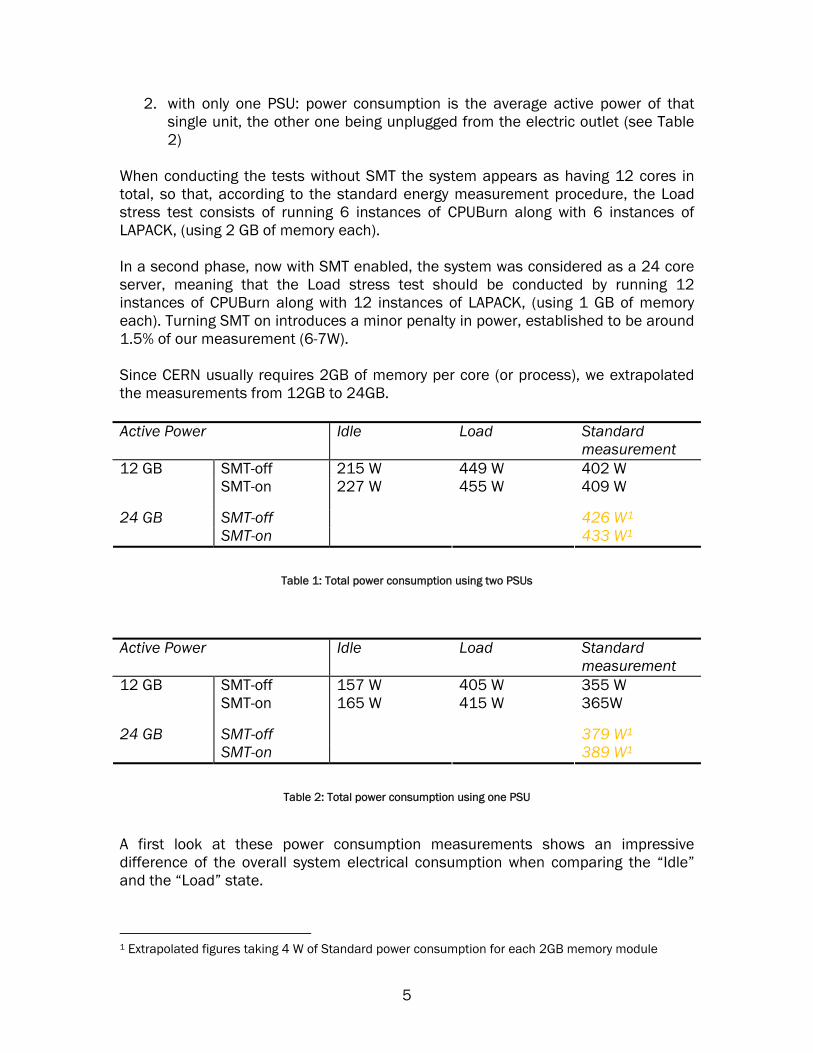
When conducting the tests without SMT the system appears as having 12 cores in total, so that, according to the standard energy measurement procedure, the Load stress test consists of running 6 instances of CPUBurn along with 6 instances of LAPACK, (using 2 GB of memory each). In a second phase, now with SMT enabled, the system was considered as a 24 core server, meaning that the Load stress test should be conducted by running 12 instances of CPUBurn along with 12 instances of LAPACK, (using 1 GB of memory each). Turning SMT on introduces a minor penalty in power, established to be around 1.5% of our measurement (6-7W). Since CERN usually requires 2GB of memory per core (or process), we extrapolated the measurements from 12GB to 24GB. Active Power Idle Load Standard
measurement SMT-off 215 W 449 W 402 W 12 GB SMT-on 227 W 455 W 409 W
SMT-off 426 W1 24 GB SMT-on 433 W1
Table 1: Total power consumption using two PSUs
Active Power Idle Load Standard
measurement SMT-off 157 W 405 W 355 W 12 GB SMT-on 165 W 415 W 365W
SMT-off 379 W1 24 GB SMT-on 389 W1
Table 2: Total power consumption using one PSU
A first look at these power consumption measurements shows an impressive difference of the overall system electrical consumption when comparing the “Idle” and the “Load” state.
1 Extrapolated figures taking 4 W of Standard power consumption for each 2GB memory module
5
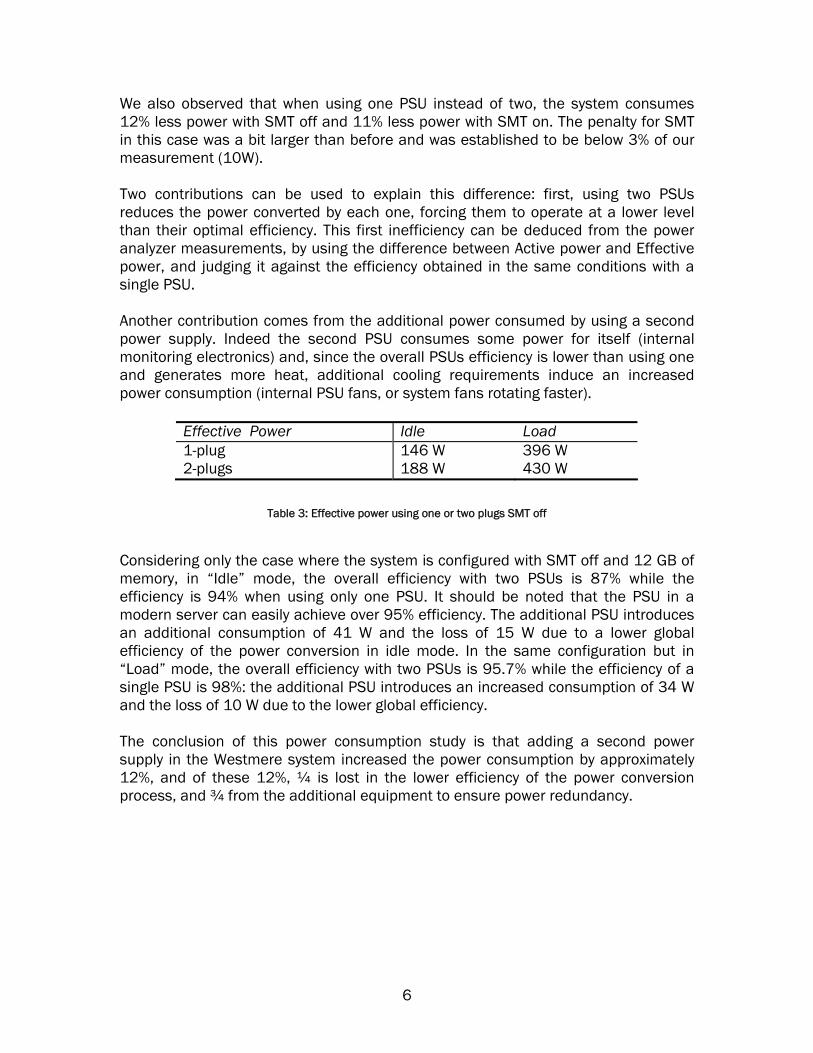
We also observed that when using one PSU instead of two, the system consumes 12% less power with SMT off and 11% less power with SMT on. The penalty for SMT in this case was a bit larger than before and was established to be below 3% of our measurement (10W). Two contributions can be used to explain this difference: first, using two PSUs reduces the power converted by each one, forcing them to operate at a lower level than their optimal efficiency. This first inefficiency can be deduced from the power analyzer measurements, by using the difference between Active power and Effective power, and judging it against the efficiency obtained in the same conditions with a single PSU. Another contribution comes from the additional power consumed by using a second power supply. Indeed the second PSU consumes some power for itself (internal monitoring electronics) and, since the overall PSUs efficiency is lower than using one and generates more heat, additional cooling requirements induce an increased power consumption (internal PSU fans, or system fans rotating faster).
Effective Power Idle Load 1-plug 2-plugs
146 W 188 W
396 W 430 W
Table 3: Effective power using one or two plugs SMT off
Considering only the case where the system is configured with SMT off and 12 GB of memory, in “Idle” mode, the overall efficiency with two PSUs is 87% while the efficiency is 94% when using only one PSU. It should be noted that the PSU in a modern server can easily achieve over 95% efficiency. The additional PSU introduces an additional consumption of 41 W and the loss of 15 W due to a lower global efficiency of the power conversion in idle mode. In the same configuration but in “Load” mode, the overall efficiency with two PSUs is 95.7% while the efficiency of a single PSU is 98%: the additional PSU introduces an increased consumption of 34 W and the loss of 10 W due to the lower global efficiency. The conclusion of this power consumption study is that adding a second power supply in the Westmere system increased the power consumption by approximately 12%, and of these 12%, ¼ is lost in the lower efficiency of the power conversion process, and ¾ from the additional equipment to ensure power redundancy.
6
Benchmarks SPEC2006 One of the important performance benchmarks in the IT industry is SPEC CPU2006 benchmark from the SPEC Corporation2. This benchmark can be used to measure both individual CPU performance and the throughput rate of servers. It is an industry standard benchmark suite, designed to stress a system’s processor, the caches and the memory subsystem. The benchmark suite is based on real user applications, and the source code is commercially available. A High Energy Physics (HEP) working group has demonstrated good correlation between the SPEC results and High Energy Physics applications when using the C++ subset of the tests from the SPEC CPU2006 benchmark suite [WLCG09]. As a result the HEP community has decided to use the C++ subset of SPEC2006, “HEPSPEC06” rather than internal benchmarks because SPEC2006 is readily available, and its results can be directly generated by computer manufacturers to evaluate the performance of a system aimed at running HEP applications. In this set of benchmarks it was compiled with GCC 4.1.2 in 64-bit mode, the standard compiler available with SLC5 and the performance measurements were carried out using with SMT disabled or enabled, and with Turbo mode on. Since SPEC CPU2006 benchmark execution flow consists in serially launching several single threaded applications, several independent instances have to be launched simultaneously to evaluate the system scalability. This means that the HEPSPEC06 benchmark is indeed a rate measurement.
2 Standard Performance Evaluation Corporation (http://www.spec.org)
7
0
80
145
161
171
192
215
238
300
0 4 8 12 16 20 24
HE
PS
PE
C
#CPUs
WSM-EP X5670NHM-EP X5570
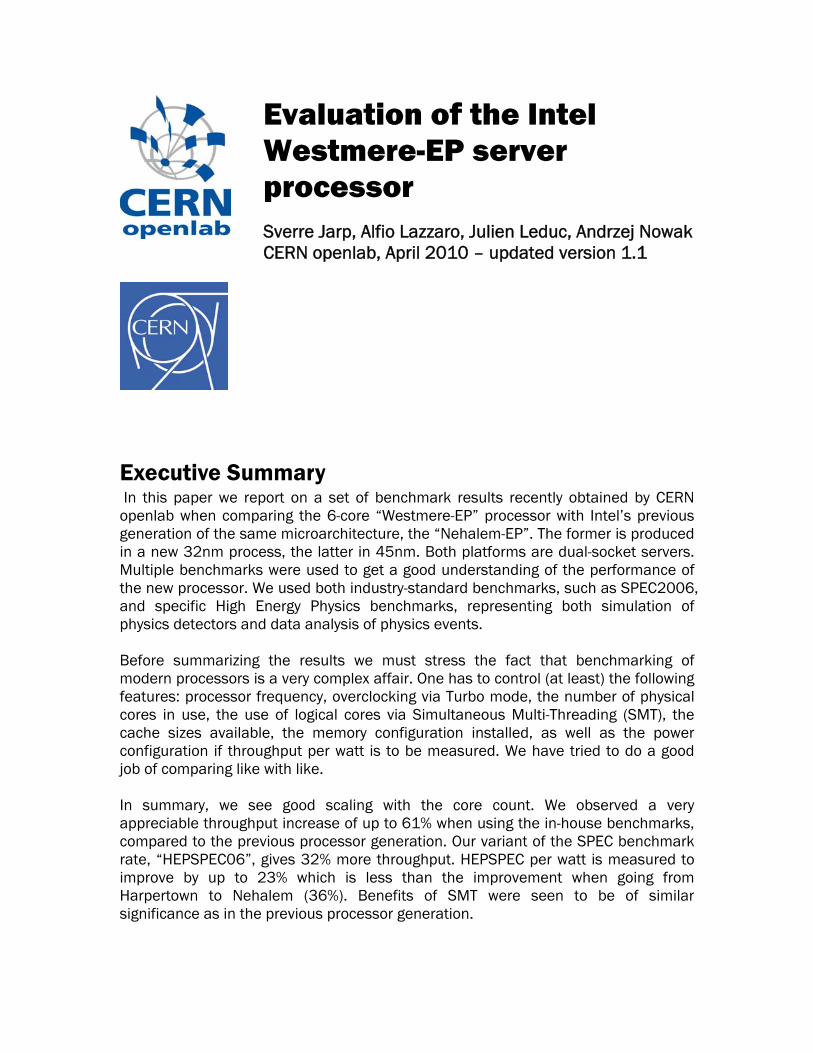
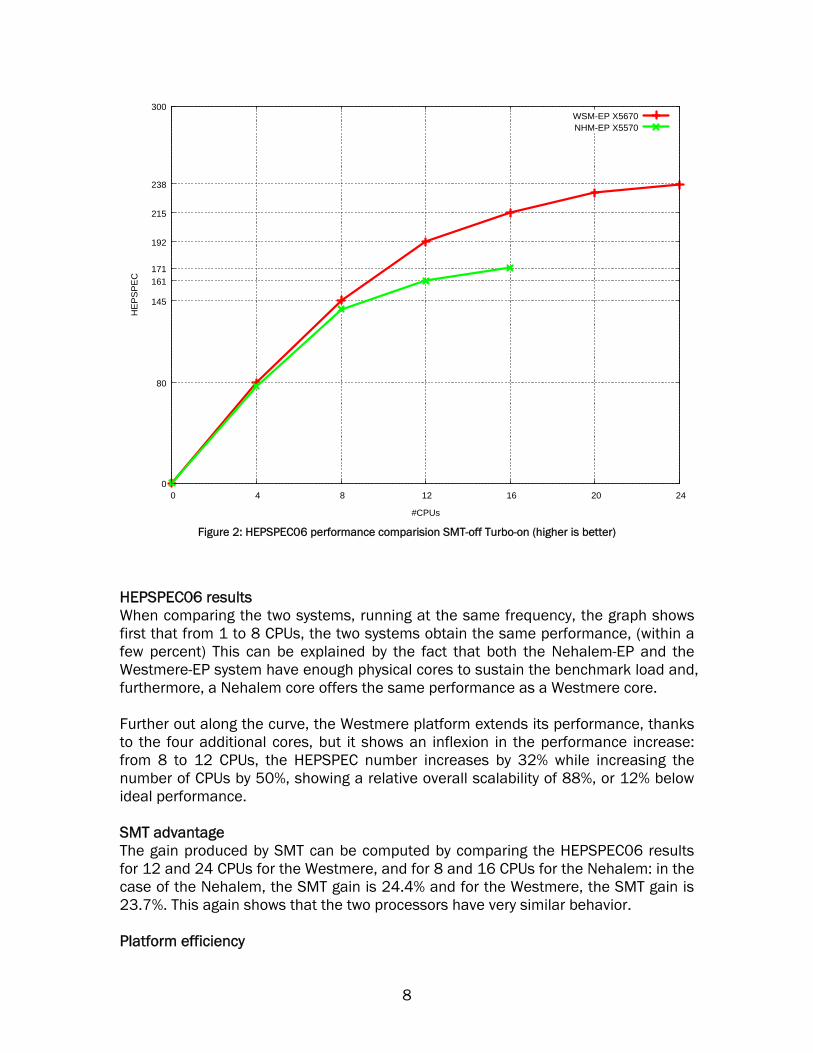
Figure 2: HEPSPEC06 performance comparision SMT-off Turbo-on (higher is better)
HEPSPEC06 results When comparing the two systems, running at the same frequency, the graph shows first that from 1 to 8 CPUs, the two systems obtain the same performance, (within a few percent) This can be explained by the fact that both the Nehalem-EP and the Westmere-EP system have enough physical cores to sustain the benchmark load and, furthermore, a Nehalem core offers the same performance as a Westmere core. Further out along the curve, the Westmere platform extends its performance, thanks to the four additional cores, but it shows an inflexion in the performance increase: from 8 to 12 CPUs, the HEPSPEC number increases by 32% while increasing the number of CPUs by 50%, showing a relative overall scalability of 88%, or 12% below ideal performance. SMT advantage The gain produced by SMT can be computed by comparing the HEPSPEC06 results for 12 and 24 CPUs for the Westmere, and for 8 and 16 CPUs for the Nehalem: in the case of the Nehalem, the SMT gain is 24.4% and for the Westmere, the SMT gain is 23.7%. This again shows that the two processors have very similar behavior. Platform efficiency
8
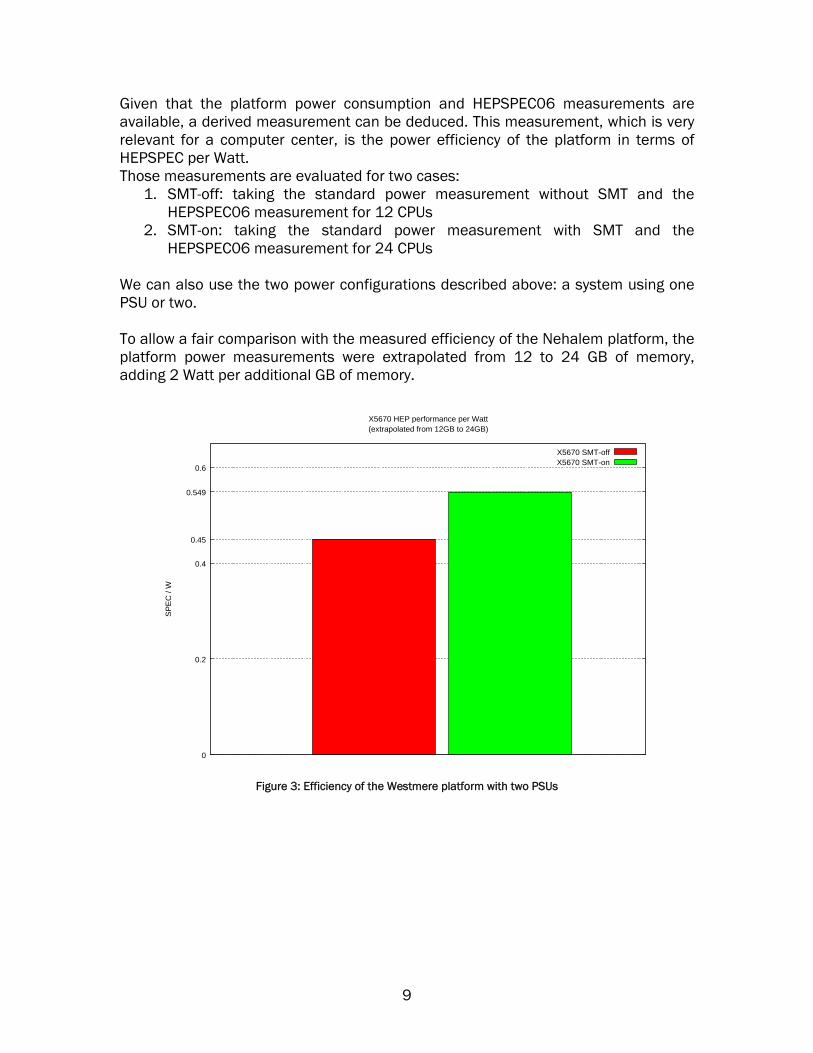
Given that the platform power consumption and HEPSPEC06 measurements are available, a derived measurement can be deduced. This measurement, which is very relevant for a computer center, is the power efficiency of the platform in terms of HEPSPEC per Watt. Those measurements are evaluated for two cases:
1. SMT-off: taking the standard power measurement without SMT and the HEPSPEC06 measurement for 12 CPUs
2. SMT-on: taking the standard power measurement with SMT and the HEPSPEC06 measurement for 24 CPUs
We can also use the two power configurations described above: a system using one PSU or two. To allow a fair comparison with the measured efficiency of the Nehalem platform, the platform power measurements were extrapolated from 12 to 24 GB of memory, adding 2 Watt per additional GB of memory.
0
0.2
0.4
0.45
0.549
0.6
SP
EC
/ W
X5670 HEP performance per Watt(extrapolated from 12GB to 24GB)
X5670 SMT-offX5670 SMT-on
Figure 3: Efficiency of the Westmere platform with two PSUs
9
0
0.2
0.4
0.5059
0.611
0.8
SP
EC
/ W
X5670 HEP performance per Watt(extrapolated from 12GB to 24GB)
X5670 SMT-offX5670 SMT-on
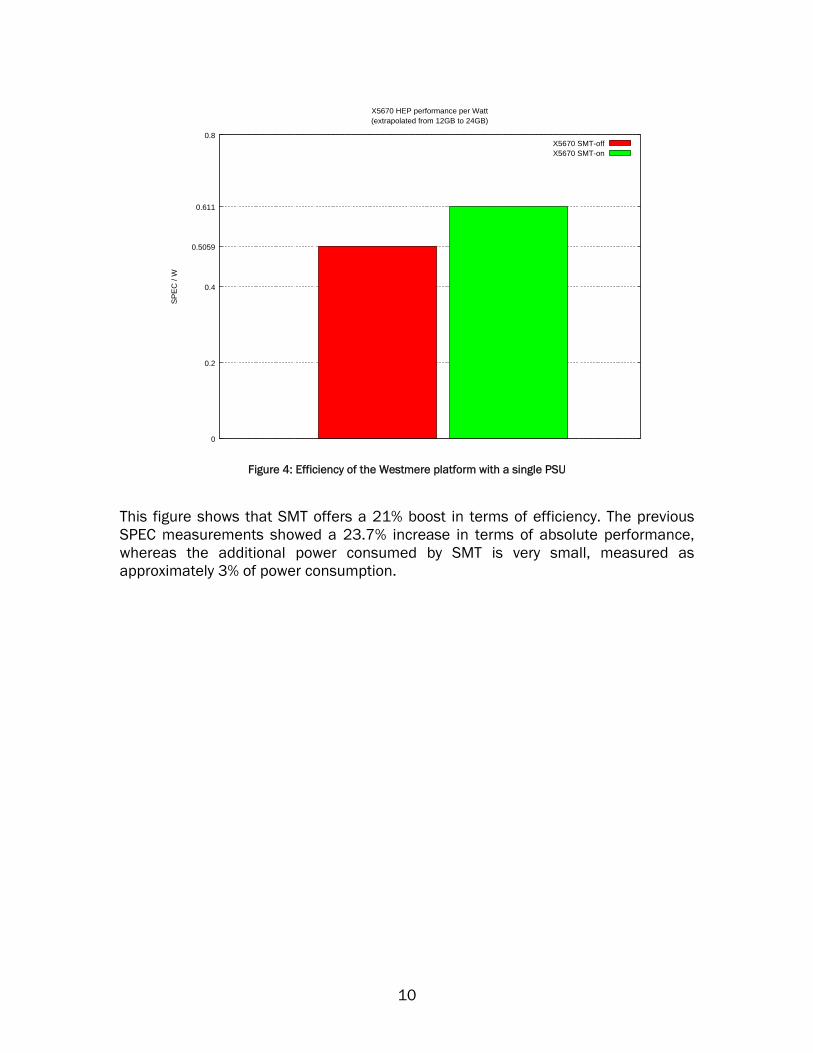
Figure 4: Efficiency of the Westmere platform with a single PSU
This figure shows that SMT offers a 21% boost in terms of efficiency. The previous SPEC measurements showed a 23.7% increase in terms of absolute performance, whereas the additional power consumed by SMT is very small, measured as approximately 3% of power consumption.
10
0
0.2
0.304
0.389
0.411
0.6
SP
EC
/ W
L5520X5570E5410
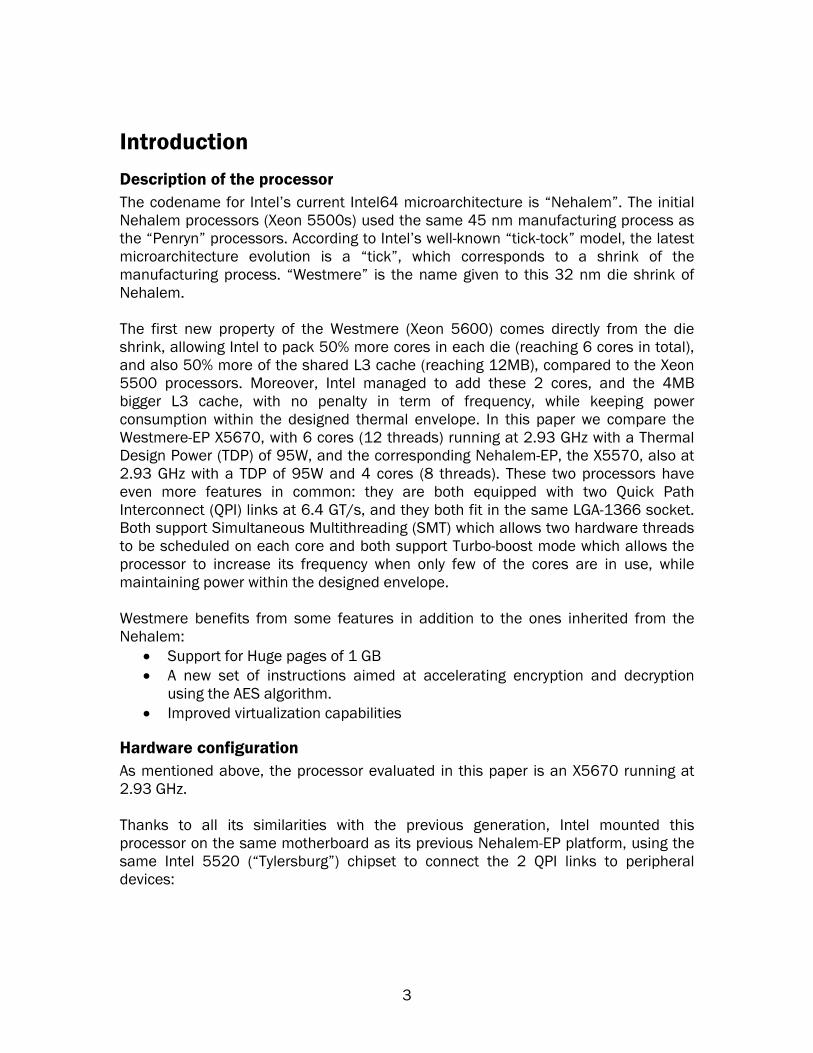
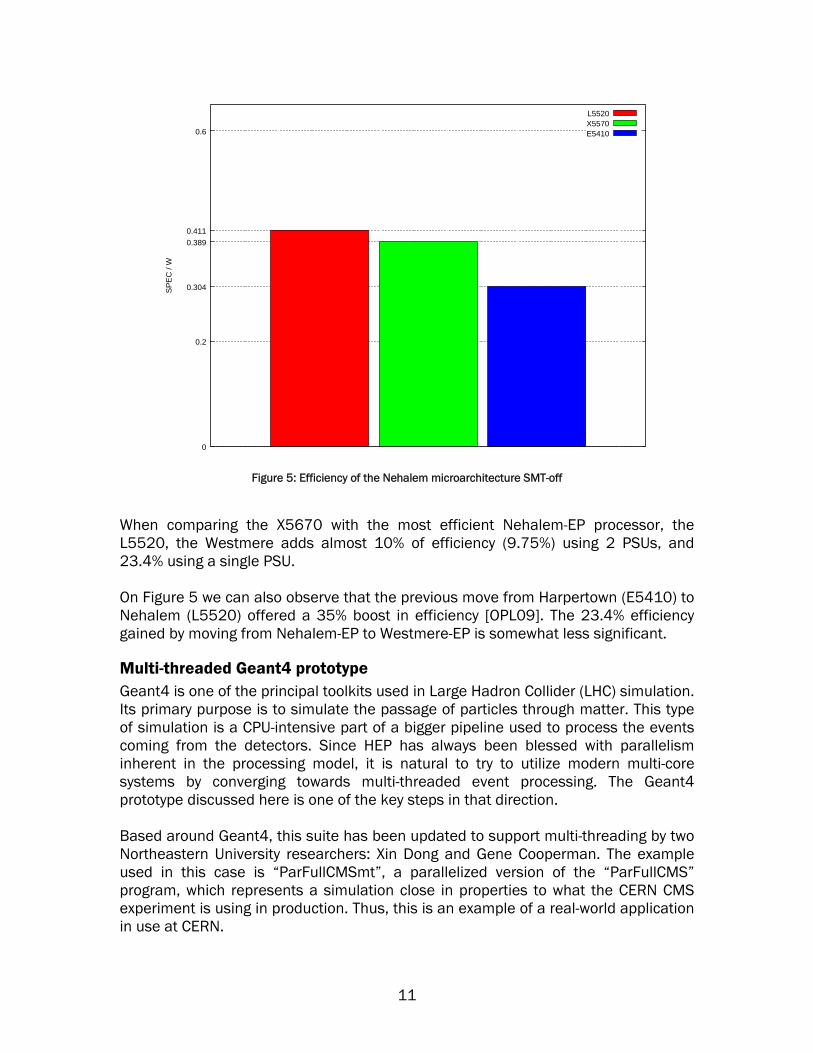
Figure 5: Efficiency of the Nehalem microarchitecture SMT-off
When comparing the X5670 with the most efficient Nehalem-EP processor, the L5520, the Westmere adds almost 10% of efficiency (9.75%) using 2 PSUs, and 23.4% using a single PSU. On Figure 5 we can also observe that the previous move from Harpertown (E5410) to Nehalem (L5520) offered a 35% boost in efficiency [OPL09]. The 23.4% efficiency gained by moving from Nehalem-EP to Westmere-EP is somewhat less significant.
Multi-threaded Geant4 prototype Geant4 is one of the principal toolkits used in Large Hadron Collider (LHC) simulation. Its primary purpose is to simulate the passage of particles through matter. This type of simulation is a CPU-intensive part of a bigger pipeline used to process the events coming from the detectors. Since HEP has always been blessed with parallelism inherent in the processing model, it is natural to try to utilize modern multi-core systems by converging towards multi-threaded event processing. The Geant4 prototype discussed here is one of the key steps in that direction. Based around Geant4, this suite has been updated to support multi-threading by two Northeastern University researchers: Xin Dong and Gene Cooperman. The example used in this case is “ParFullCMSmt”, a parallelized version of the “ParFullCMS” program, which represents a simulation close in properties to what the CERN CMS experiment is using in production. Thus, this is an example of a real-world application in use at CERN.
11
One of the key metrics of a parallel application and the underlying parallel platform is scalability. The tests described in this chapter focus on the scalability of the multi-threaded Geant4 prototype, which is defined as throughput. In principle, a single-threaded process has a specified average time it takes to process 100 events. Thus we measure the influence of the number of processes (and implicitly the number of processing units engaged) on the processing time of 100 events. In an ideal case, as more processes with more work are added, one would expect the throughput to grow proportionally to the added resources, and so the processing time of 100 events would remain unchanged (per thread). Another key metric considered in this case is “efficiency”, which is defined as the scaling of the software relative to the serial runtime, confronted with ideal scaling determined by the core count. In cases where multiple hardware threads are being used, perfect scaling is defined by the maximum core count of the system (12). Technical test setup The threads were pinned to the cores running them, and the throughput defining factor was the average time it takes to process one 300 GeV pi- event in a predefined geometry. The system was SMT-enabled, which means that the hardware threading feature was activated and used during the tests. Thus, if there were no more physical cores available, the jobs would be pinned to hardware threads, still maximizing the amount of physical cores used. The tested framework was based on Geant4 4.9.2p01, CLHEP 2.0.4.2 and XercesC 2.8.0, and was compiled using the GCC 4.3.3 compiler. Scalability testing Testing revealed excellent scalability up until full physical core count. When running with 12 software threads on 12 cores, the scaling factor was 11.3x, which means that the setup was 94% efficient. Detailed scalability data reveals good scaling, as expected, all the way between 1 and 12 processes:
1.95x for 2 processes (98% efficiency) 3.86x for 4 processes (97% efficiency) 5.70x for 6 processes (95% efficiency) 7.69x for 8 processes (96% efficiency)
As it is apparent from the figures above, the efficiency drop was not uniform and subject to measurement error of 1-2%, but it was within expected bounds. The graph below (Figure 6) shows the total simulation time curve in blue and the efficiency (scalability) curve in green. Towards its end, the efficiency curve surpasses 100%, since for thread counts higher than 12 expected scalability is fixed to 12x. Thus a final value of 111% indicates that the system loaded with 24 threads of the benchmark yields 11% more throughput than a perfectly scaled serial version on 12 physical cores.
12
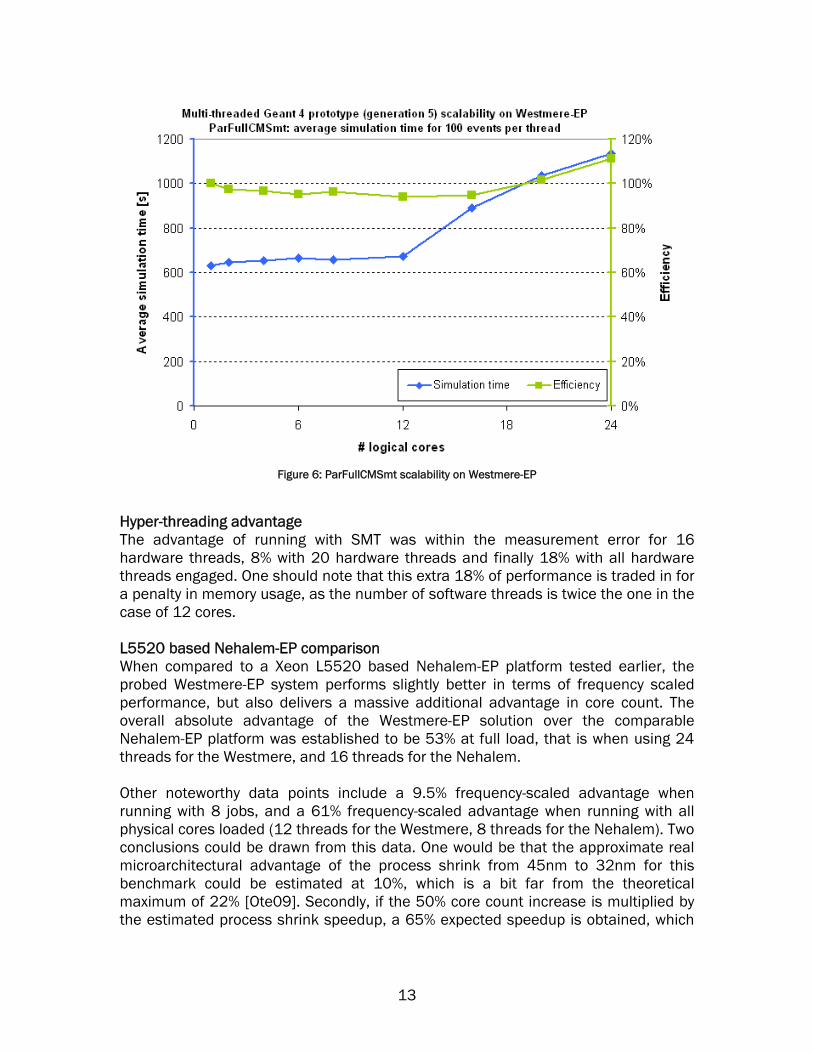
Figure 6: ParFullCMSmt scalability on Westmere-EP
Hyper-threading advantage The advantage of running with SMT was within the measurement error for 16 hardware threads, 8% with 20 hardware threads and finally 18% with all hardware threads engaged. One should note that this extra 18% of performance is traded in for a penalty in memory usage, as the number of software threads is twice the one in the case of 12 cores. L5520 based Nehalem-EP comparison When compared to a Xeon L5520 based Nehalem-EP platform tested earlier, the probed Westmere-EP system performs slightly better in terms of frequency scaled performance, but also delivers a massive additional advantage in core count. The overall absolute advantage of the Westmere-EP solution over the comparable Nehalem-EP platform was established to be 53% at full load, that is when using 24 threads for the Westmere, and 16 threads for the Nehalem. Other noteworthy data points include a 9.5% frequency-scaled advantage when running with 8 jobs, and a 61% frequency-scaled advantage when running with all physical cores loaded (12 threads for the Westmere, 8 threads for the Nehalem). Two conclusions could be drawn from this data. One would be that the approximate real microarchitectural advantage of the process shrink from 45nm to 32nm for this benchmark could be estimated at 10%, which is a bit far from the theoretical maximum of 22% [Ote09]. Secondly, if the 50% core count increase is multiplied by the estimated process shrink speedup, a 65% expected speedup is obtained, which
13
is very close to the obtained practical 61% figure. Such predictable scalability is a very sought-after feature in our market segment. In essence, we found for this benchmark that the Westmere is around 10% faster than an equivalent Nehalem core at the same frequency, while overall the system provides between 53% and 61% more throughput. In contrast, the advantage of Hyper Threading was found to be higher on the Nehalem (24%) than on the Westmere system (18%). This is not necessarily indicative of better Hyper Threading performance on the Nehalem, since the hardware implementation has not changed. The exact hardware effects in this case remain to be investigated.
Multi-threaded Test40 The multi-threaded test40 benchmark is a fusion of the classic test40 test used at openlab for quick performance studies, and the prototype of the parallel Geant4 processing framework. It focuses on a particle gun inside a simple detector geometry, still representing a substantial part of a physics simulation. It could be considered as a simplified version of a full-fledged processing framework, nevertheless bearing key characteristics of commonly used HEP software. The parallelization technology used is identical to the case described in the previous section, and has been carried out by Xin Dong. The test was executed with 200 events per thread. Other software and hardware conditions also match those from the previous test. As previously, this scenario tests the wall clock runtime per event and efficiency. The test was run 10 times and the results were averaged over each core count. The standard deviation did not exceed 4% of the average sample value for all data points. Scalability testing The efficiency of the system loaded with 12 threads was established at 97%, which is equivalent to a scaling factor of 11.7x. Intermediate scaling values are as follows:
2.00x for 2 processes (100% efficiency) 3.97x for 4 processes (99% efficiency) 5.87x for 6 processes (98% efficiency) 7.76x for 8 processes (97% efficiency)
The decrease in efficiency is in line with the expectations and is monotonic. The graph below (Figure 7) shows the total simulation time curve in blue and the efficiency (scalability) curve in green. Towards its end, the efficiency curve surpasses 100%, since for thread counts higher than 12 expected scalability is fixed to 12x. Thus a final value of 112% indicates that the system loaded with 24 threads of the benchmark yields 12% more throughput than a perfectly scaled serial version on 12 physical cores.
14
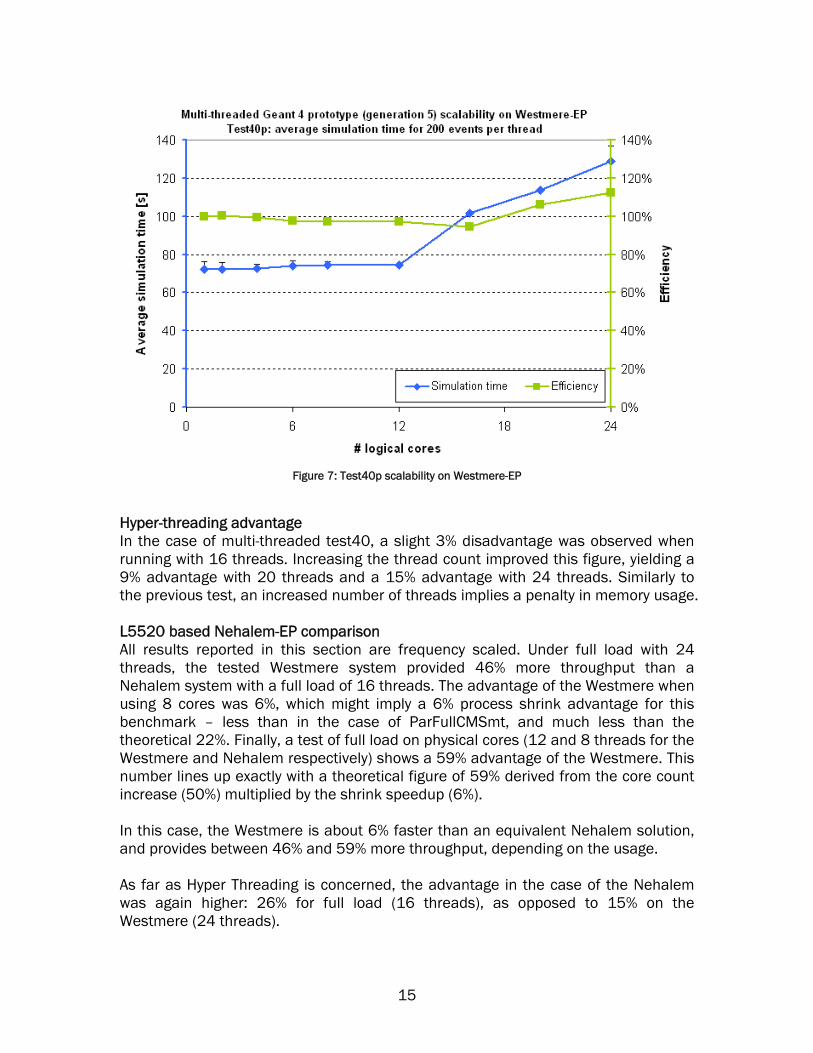
Figure 7: Test40p scalability on Westmere-EP
Hyper-threading advantage In the case of multi-threaded test40, a slight 3% disadvantage was observed when running with 16 threads. Increasing the thread count improved this figure, yielding a 9% advantage with 20 threads and a 15% advantage with 24 threads. Similarly to the previous test, an increased number of threads implies a penalty in memory usage. L5520 based Nehalem-EP comparison All results reported in this section are frequency scaled. Under full load with 24 threads, the tested Westmere system provided 46% more throughput than a Nehalem system with a full load of 16 threads. The advantage of the Westmere when using 8 cores was 6%, which might imply a 6% process shrink advantage for this benchmark – less than in the case of ParFullCMSmt, and much less than the theoretical 22%. Finally, a test of full load on physical cores (12 and 8 threads for the Westmere and Nehalem respectively) shows a 59% advantage of the Westmere. This number lines up exactly with a theoretical figure of 59% derived from the core count increase (50%) multiplied by the shrink speedup (6%). In this case, the Westmere is about 6% faster than an equivalent Nehalem solution, and provides between 46% and 59% more throughput, depending on the usage. As far as Hyper Threading is concerned, the advantage in the case of the Nehalem was again higher: 26% for full load (16 threads), as opposed to 15% on the Westmere (24 threads).
15
Multi-threaded ROOT minimization In general all the methods used in data analysis are based on mathematical optimizations. Depending on the particular method, the evaluation of a function is required, like the likelihood function or the expected prediction error function, which has to be optimized as function of several free parameters to be determined [Num07]. The High Energy Physics (HEP) community makes large use of many complex data analysis techniques, like maximum likelihood fits, neural networks, and boosted decision trees [Stat01]. Upon the startup of the data analysis activity at Large Hadron Collider (LHC) experiments, such techniques will be used for a better discrimination between signal and background events in order to discover possible new physics phenomena [Phys08]. The increase of the sample sizes and use of complex algorithms for data analyses require high CPU performance. Traditionally all software for data analysis developed in HEP does not use parallelism. However, with the introduction of multi-core CPUs and the usage of more and more complex algorithms, an effort for parallelization of the software has been started in recent years. The MINUIT package is the most common package used for optimization of a function in the HEP community [Min72]. The main algorithm in this package, MIGRAD, searches for the minimum of a function using the gradient information. For each minimization iteration, MIGRAD requires the calculation of the derivative for each free parameter of the function to be minimized. A. Lazzaro and L. Moneta have developed a parallel version of MIGRAD, where the calculation of the derivatives has been spread out on different processes using a Message Passing Interface (MPI) parallelization [Laz09]. Particularly interesting is the minimization procedure applied to the maximum likelihood technique [Cow98]. In this case we minimize –ln L, where L is the likelihood function. This function L is the sum of different terms calculated for each event, identified by several variables, for a given data sample. Since each event is independent from the others, it is possible to distribute the calculation of each event over different processes and then collect all results for the final calculation of L for each process (using an MPI::Allreduce routine). Then the final result includes an additional term, calculated by a single node only, which takes in account the Poissonian fluctuation (extended term). We use the RooFit package (package inside the ROOT software framework developed at CERN) for the L calculation, where we have implemented a parallelization using MPI. A corresponding parallel version based on OpenMP is under development and is expected for the next releases of the software. We base our tests on an analysis performed at the BaBar experiment (an experiment which was located at the SLAC National Accelerator Laboratory, California), namely the measurement of Time Dependent CP violation for the decays of neutral B mesons to η’K final state. This analysis was published in the journal Physics Review D 79, 052003 (2009). Thus, this is an example of a real-world application in use in the HEP community. We look at the execution time spent by the application running in parallel with a certain number of processes. The parallelization implemented guarantees that the results are the same in all configurations. The workload is not entirely balanced
16
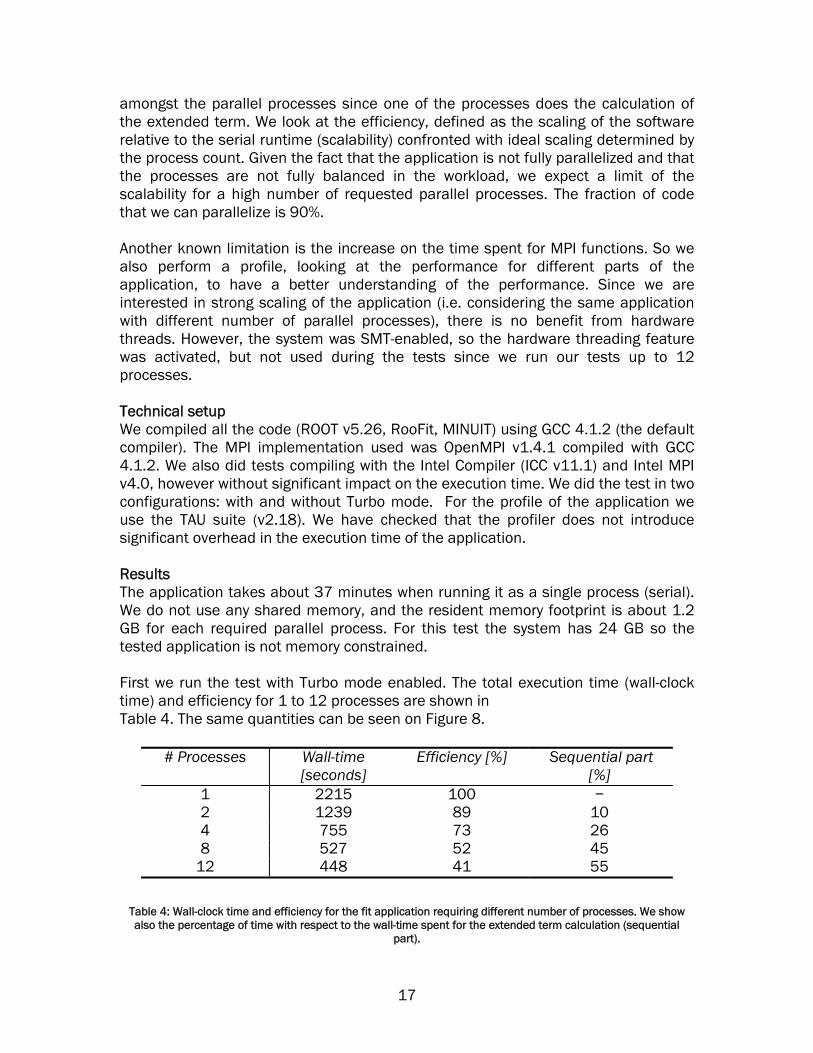
amongst the parallel processes since one of the processes does the calculation of the extended term. We look at the efficiency, defined as the scaling of the software relative to the serial runtime (scalability) confronted with ideal scaling determined by the process count. Given the fact that the application is not fully parallelized and that the processes are not fully balanced in the workload, we expect a limit of the scalability for a high number of requested parallel processes. The fraction of code that we can parallelize is 90%. Another known limitation is the increase on the time spent for MPI functions. So we also perform a profile, looking at the performance for different parts of the application, to have a better understanding of the performance. Since we are interested in strong scaling of the application (i.e. considering the same application with different number of parallel processes), there is no benefit from hardware threads. However, the system was SMT-enabled, so the hardware threading feature was activated, but not used during the tests since we run our tests up to 12 processes. Technical setup We compiled all the code (ROOT v5.26, RooFit, MINUIT) using GCC 4.1.2 (the default compiler). The MPI implementation used was OpenMPI v1.4.1 compiled with GCC 4.1.2. We also did tests compiling with the Intel Compiler (ICC v11.1) and Intel MPI v4.0, however without significant impact on the execution time. We did the test in two configurations: with and without Turbo mode. For the profile of the application we use the TAU suite (v2.18). We have checked that the profiler does not introduce significant overhead in the execution time of the application. Results The application takes about 37 minutes when running it as a single process (serial). We do not use any shared memory, and the resident memory footprint is about 1.2 GB for each required parallel process. For this test the system has 24 GB so the tested application is not memory constrained. First we run the test with Turbo mode enabled. The total execution time (wall-clock time) and efficiency for 1 to 12 processes are shown in Table 4. The same quantities can be seen on Figure 8.
# Processes Wall-time [seconds]
Efficiency [%] Sequential part [%]
1 2215 100 − 2 1239 89 10 4 755 73 26 8 527 52 45
12 448 41 55
Table 4: Wall-clock time and efficiency for the fit application requiring different number of processes. We show also the percentage of time with respect to the wall-time spent for the extended term calculation (sequential
part).
17
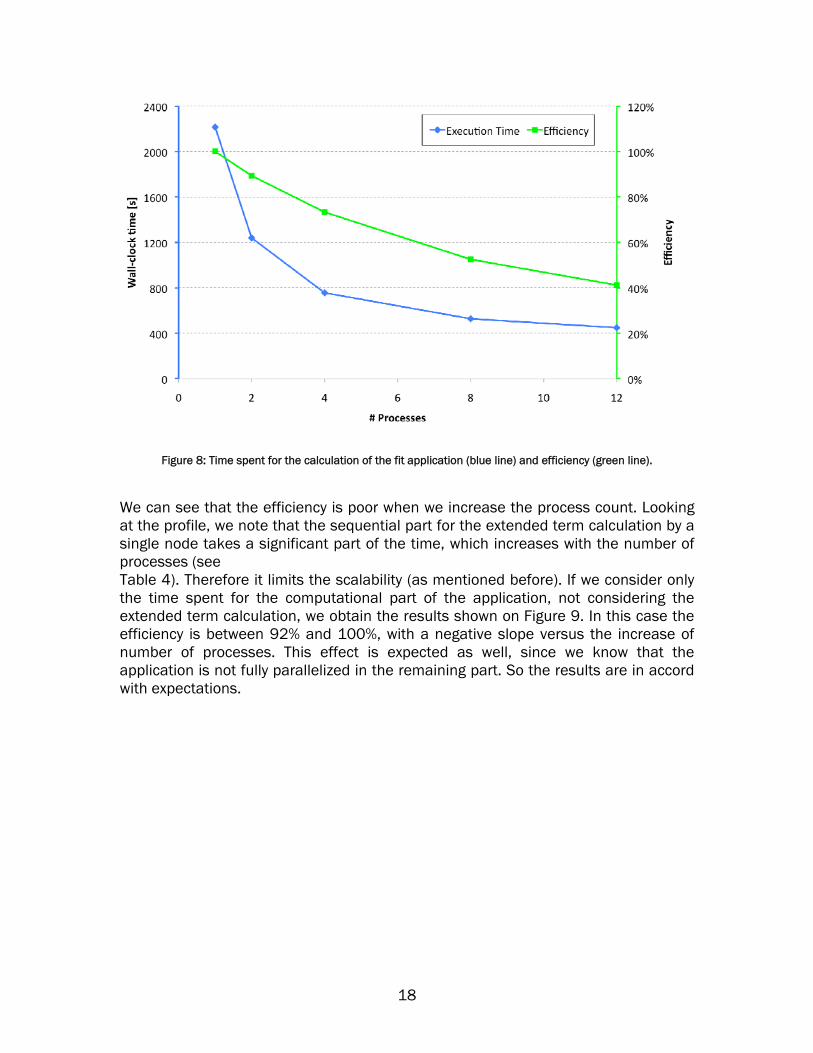
Figure 8: Time spent for the calculation of the fit application (blue line) and efficiency (green line).
We can see that the efficiency is poor when we increase the process count. Looking at the profile, we note that the sequential part for the extended term calculation by a single node takes a significant part of the time, which increases with the number of processes (see Table 4). Therefore it limits the scalability (as mentioned before). If we consider only the time spent for the computational part of the application, not considering the extended term calculation, we obtain the results shown on Figure 9. In this case the efficiency is between 92% and 100%, with a negative slope versus the increase of number of processes. This effect is expected as well, since we know that the application is not fully parallelized in the remaining part. So the results are in accord with expectations.
18
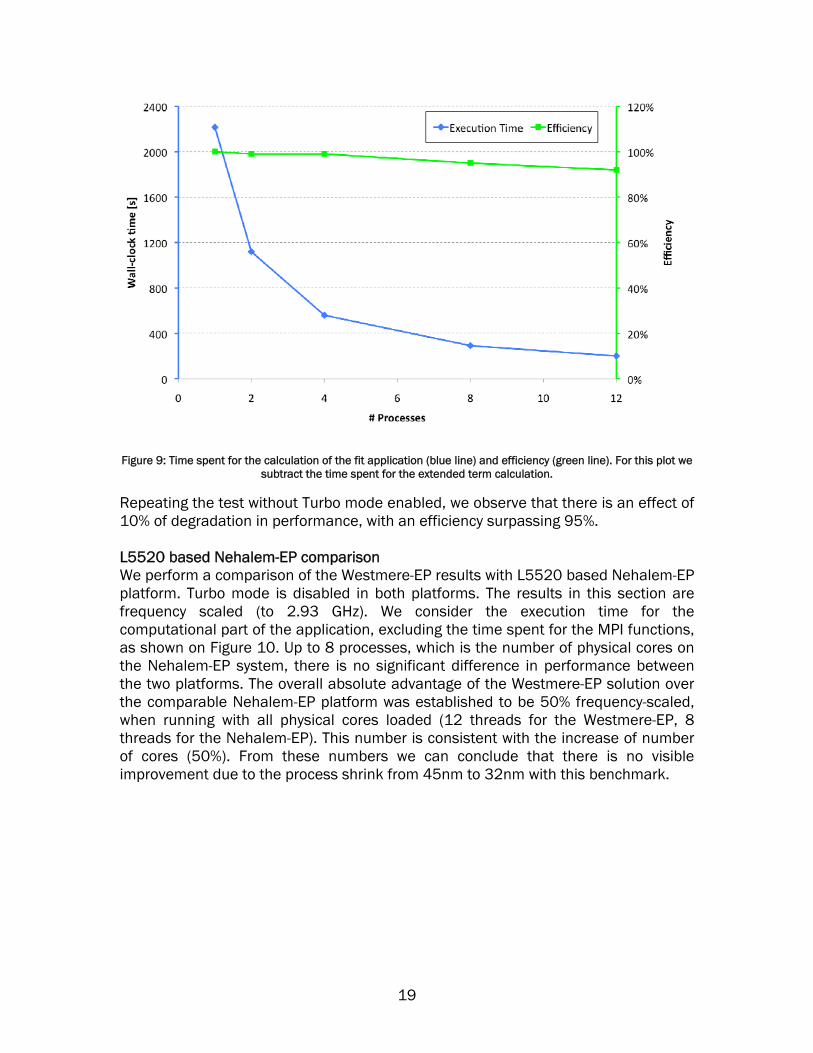
Figure 9: Time spent for the calculation of the fit application (blue line) and efficiency (green line). For this plot we subtract the time spent for the extended term calculation.
Repeating the test without Turbo mode enabled, we observe that there is an effect of 10% of degradation in performance, with an efficiency surpassing 95%. L5520 based Nehalem-EP comparison We perform a comparison of the Westmere-EP results with L5520 based Nehalem-EP platform. Turbo mode is disabled in both platforms. The results in this section are frequency scaled (to 2.93 GHz). We consider the execution time for the computational part of the application, excluding the time spent for the MPI functions, as shown on Figure 10. Up to 8 processes, which is the number of physical cores on the Nehalem-EP system, there is no significant difference in performance between the two platforms. The overall absolute advantage of the Westmere-EP solution over the comparable Nehalem-EP platform was established to be 50% frequency-scaled, when running with all physical cores loaded (12 threads for the Westmere-EP, 8 threads for the Nehalem-EP). This number is consistent with the increase of number of cores (50%). From these numbers we can conclude that there is no visible improvement due to the process shrink from 45nm to 32nm with this benchmark.
19
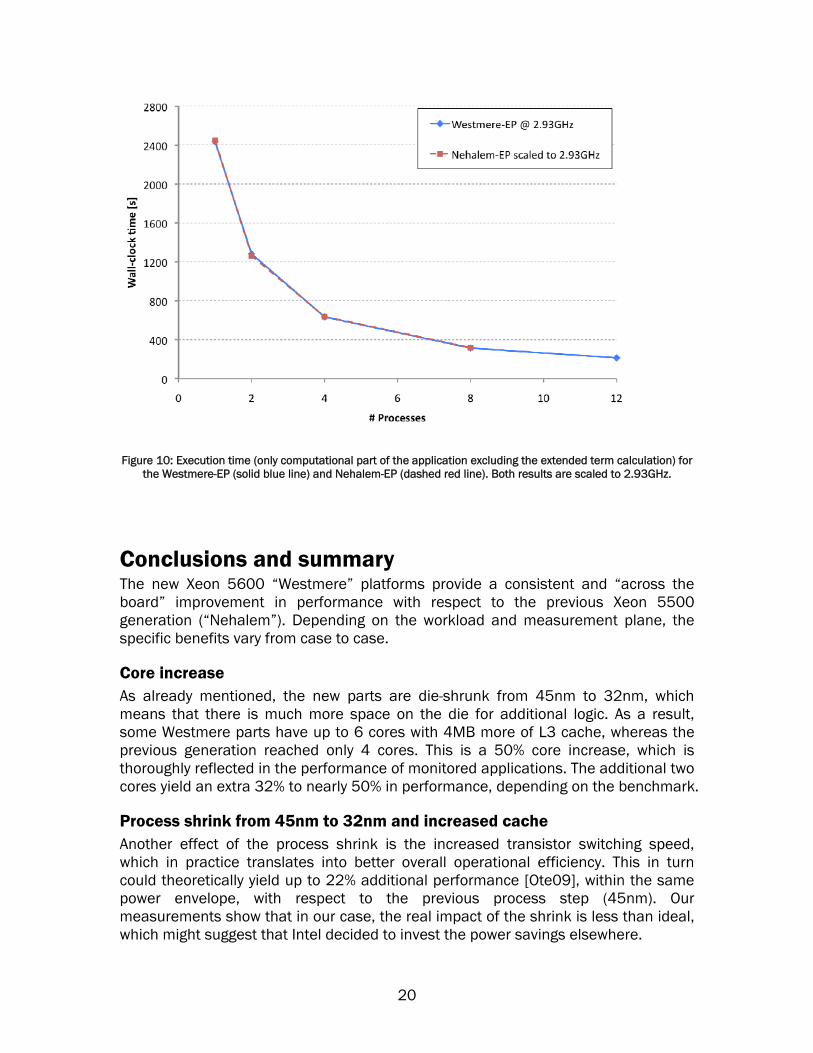
Figure 10: Execution time (only computational part of the application excluding the extended term calculation) for the Westmere-EP (solid blue line) and Nehalem-EP (dashed red line). Both results are scaled to 2.93GHz.
Conclusions and summary The new Xeon 5600 “Westmere” platforms provide a consistent and “across the board” improvement in performance with respect to the previous Xeon 5500 generation (“Nehalem”). Depending on the workload and measurement plane, the specific benefits vary from case to case.
Core increase As already mentioned, the new parts are die-shrunk from 45nm to 32nm, which means that there is much more space on the die for additional logic. As a result, some Westmere parts have up to 6 cores with 4MB more of L3 cache, whereas the previous generation reached only 4 cores. This is a 50% core increase, which is thoroughly reflected in the performance of monitored applications. The additional two cores yield an extra 32% to nearly 50% in performance, depending on the benchmark.
Process shrink from 45nm to 32nm and increased cache Another effect of the process shrink is the increased transistor switching speed, which in practice translates into better overall operational efficiency. This in turn could theoretically yield up to 22% additional performance [Ote09], within the same power envelope, with respect to the previous process step (45nm). Our measurements show that in our case, the real impact of the shrink is less than ideal, which might suggest that Intel decided to invest the power savings elsewhere.
20
The HEPSPEC06 benchmark performance is within 5% of a Nehalem-EP system up to 8 cores and show good scaling from 8 to 12 (32% more throughput performance). In the parallelized Geant4 tests, the advantage ranged from 6% to 9.5%, and in multi-threaded ROOT minimization the impact of the Westmere shrink was unnoticed.
Hyper Threading As far as Hyper Threading (SMT) is concerned, on average the performance advantage seems to be equivalent to the one obtained on Nehalem. Improvements ranging between 15% and 24% have been observed in weak scaling HEPSPEC06 and parallelized Geant 4, however applications relying on strong scaling are likely to run slower.
Overall platform performance To sum up, if we consider the overall frequency-scaled throughput of the whole dual-processor system, a significant increase can be seen in comparison to Nehalem based servers, and it is established to be at 39% for the HEPSPEC06 benchmark, and between 46% and 61% for in-house applications. Also, a 10-23% performance per Watt improvement was observed. Although the gain is smaller than the 35% improvement measured during the transition from Harpertown to Nehalem, this development is quite important for our computer center. We hope this is not a downward trend since we still count heavily on continued improvements of throughput per watt to satisfy the ever-growing demands of the physicists associated with the Large Hadron Collider and its four experiments. CERN uses the platform power consumption as an important factor in the tendering process for its power constrained computing center building. This makes the Westmere Xeon family an interesting candidate for the next round of acquisitions. In addition, it appears that it is possible to save 10-12% of power consumed by switching off one of the PSUs shipped with the system. Naturally, this is a clear tradeoff between savings and reliability considerations.
References WLCG09 Multiple authors: Transition to a new CPU benchmarking unit for the
WLCG, (2009)
OPL09 A. Busch, J. Leduc: “Evaluation of energy consumption and performance of Intel’s Nehalem architecture”, CERN openlab (2009)
Paul Otellini: “Building a Continuum of Computing”, Intel Developer Forum San Francisco 2009; speech transcript p. 7.
Ote09
Num07 W. H. Press and S. A. Teukolsky and W. T. Vetterling and B. P. Flannery, Numerical Recipes: The Art of Scientific Computing, Cambridge University Press (2007)
21
J. Friedman and T. Hastie and R. Tibshirani, The Elements of Statistical Learning, Springer (2001)
Stat01
G. Kane, A. Pierce, Perspectives on LHC Physics, World Scientific (2008)
Phys08
Min72 F. James, MINUIT - Function Minimization and Error Analysis, CERN Program Library Long Writeup D506 (1972)
A. Lazzaro and L. Moneta, MINUIT Package Parallelization and applications using the RooFit Package, Proceedings of Science, PoS(ACAT08)083 (2009)
Laz09
Cow98 G. Cowan, Statistical Data Analysis, Clarendon Press, Oxford (1998)
Appendix A - standard energy measurement procedure Measurement equipment For the measurements a high precision power analyzer with several channels is required, since it must be able to measure the power consumption of any system from a simple UP system, with a single power supply unit (PSU) to a large server equipped with 4 PSUs. To this extend a ZES-Zimmer LMG450 power analyzer is used. It allows the measurement of common power electronics. It has an accuracy of 0.1% and allows the measurement of four channels at the same time, and thanks to its convenient RS232 port, it can be linked to a PC to sample the values on the 4 channels, as shown on Figure 11.
22
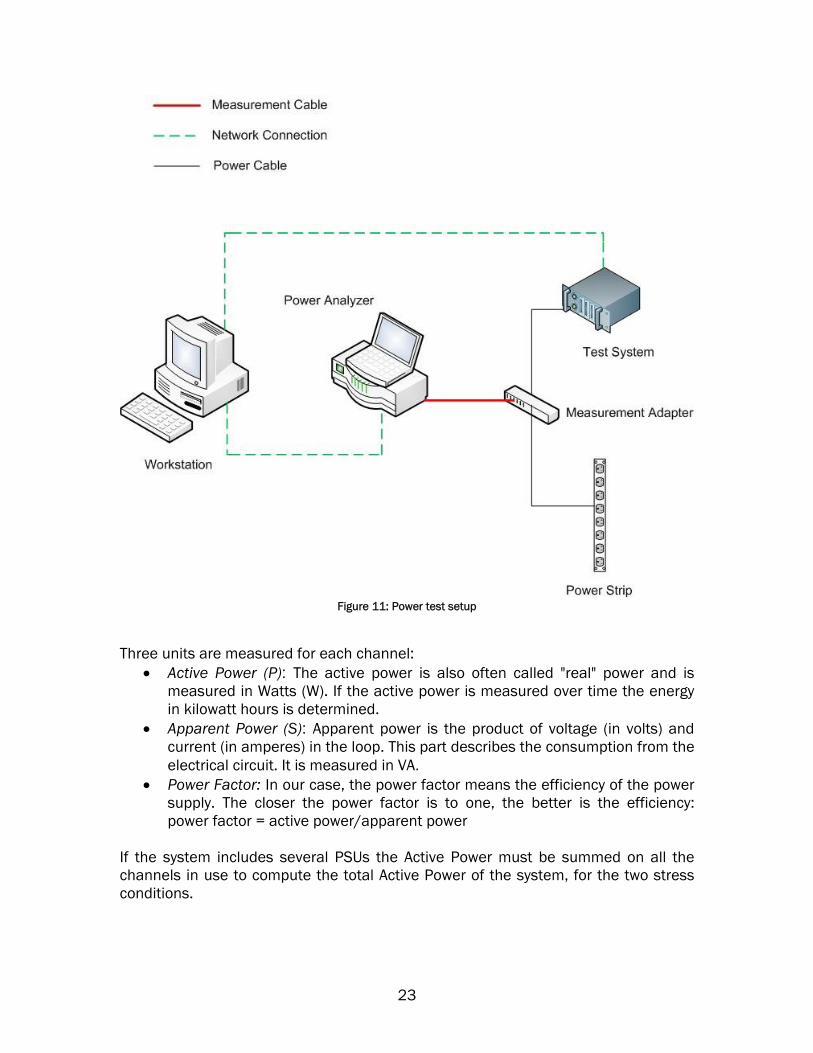
Figure 11: Power test setup
Three units are measured for each channel:
Active Power (P): The active power is also often called "real" power and is measured in Watts (W). If the active power is measured over time the energy in kilowatt hours is determined.
Apparent Power (S): Apparent power is the product of voltage (in volts) and current (in amperes) in the loop. This part describes the consumption from the electrical circuit. It is measured in VA.
Power Factor: In our case, the power factor means the efficiency of the power supply. The closer the power factor is to one, the better is the efficiency: power factor = active power/apparent power
If the system includes several PSUs the Active Power must be summed on all the channels in use to compute the total Active Power of the system, for the two stress conditions.
23

24
LAPACK/CPUBurn Those two tools are used to stress the evaluated systems, providing a reproducible load for any type of server:
1. LAPACK (Linear Algebra PACKage) was written in Fortran90 and is used to load both the memory system and the CPU. It provides routines for solving systems of simultaneous linear equations, least-squares solutions of linear systems of equations, eigenvalue problems, and singular value problems. The memory consumption depends on the size of the generated matrices and is easy to adapt to fit the needs.
2. CPUBurn was originally written as a tool for overclockers, so that they can stress the overclocked CPUs, and check if they are stable. It can report if an error occurs while the benchmark is running. It runs Floating Point Unit (FPU) intensive operations to get the CPUs under full load, allowing the highest power consumption to be measured from the CPU.
Standard energy measurement The standard energy measurement is a combination of the Active power measured under two different stress conditions:
1. Idle: the system is booted with the Operating System and it does nothing. 2. Load: the system is running CPUBURN on half of the cores, and LAPACK on all
the other cores, using all the installed memory. An example to stress a system counting 8 cores and 12 GB of memory for the Load condition, would imply to run 4 instances of CPUBurn along with 4 instances of LAPACK each consuming 3 GB of memory. According to that, the standard energy measurement is a mix of the active power under the Idle condition, accounting for 20%, and the active power under Load condition, accounting for 80%.