Embed Size (px)
Citation preview

June 2006
Evaluation of TCP Congestion Control Algorithms on theWindows Vista Platform∗
Yee-Ting LiStanford Linear Accelerator Center, Stanford University, Stanford, CA 94309
Abstract
CTCP, an innovative TCP congestion control algorithm developed by Microsoft,is evaluated and compared to HSTCP and StandardTCP†. Tests were performedon the production Internet from Stanford Linear Accelerator Center (SLAC) tovarious geographically located hosts to give a broad overview of the performances.
We find that certain issues were apparent during testing (not directly related tothe congestion control algorithms) which may skew results. With this in mind, wefind that CTCP performed similiarly to HSTCP across a multitude of differentnetwork environments.
However, to improve the fairness and to reduce the impact of CTCP upon ex-isting StandardTCP traffic, two areas of further research were investigated. Al-gorithmic additions to CTCP for burst control to reduce the aggressiveness ofits cwnd increments demonstrated beneficial improvements in both fairness andthroughput over the original CTCP algorithm.
Similarly, γ auto-tuning algorithms were investigated to dynamically adapt CTCPflows to their network conditions for optimal performance. Whilst the effects ofthese auto-tuning algorithms when used in addition to burst control showed littleto no benefit to fairness nor throughput for the limited number of network pathstested, one of the auto-tuning algorithms performed such that there was negli-able impact upon StandardTCP. With these improvements, CTCP was foundto perform better than HSTCP in terms of fairness and similarly in terms ofthroughput under the production environments tested.
∗Work supported by Department of Energy contract DE-AC02-76SF00515.†The use of StandardTCP and NewReno are used interchangeably throughout this report, but generally,
we define StandardTCP as the stack implementation of the NewReno congestion control algorithm.
SLAC-TN-06-005
1 Introduction
Windows Vista provides facilities to switch TCP congestion control algorithms. This reportinvestigates the implementation and performance of these algorithms on real WAN networksfrom SLAC to various locations worldwide. In particular, the report focuses on CTCP [2, 1],a Microsoft developed congestion control algorithm that marries both the Loss Based natureof standard TCP and the Delay Based features of TCP Vegas.
Due to time constraints of this report, a full investigation on the various CTCP per-formance details was not possible. As such, this report serves as an initial field study ofthe applicability of deploying CTCP as the default TCP congestion control algorithm inWindows Vista.
This applicability is considered in the following forms; raw throughput achieved by CTCPflows, the fairness between both CTCP flows competing with one another (intra-protocolfairness) and that when competing against the default TCP congestion algorithms (friend-liness). These metrics are compared to that with using the default NewReno stack and alsothat of an implementation of HSTCP [6] so that a comparative judgement upon relativeperformance can be made.
2 Test Outline
As per [4], we focus upon the following metrics for the direct comparison between differentTCP algorithms.
• Intra-Protocol Fairness
In this scenario, we vary the number of TCP flows from 2 to n. The fair share of networkbandwidth between the flows is vital to ensure fair sharing of network resources andgood scaling properties of the TCP algorithm.
• Convergence Time
The convergence of fairness towards some arbitrary constant ratio is important tounderstand the dynamic transient fairness between TCP flows. This is especially usefulin understanding the interplay between a newly started flow and that of flows that arealready running.
• Inter-Protocol Fairness & Friendliness
The fairness between the various TCP algorithms. In particular, the scaling propertiesof fairness between the New-TCP algorithms and that of Standard TCP is importantto ensure smooth deployment of new congestion control algorithms.
• Reverse Traffic Load
A well recognised problem with Loss Based algorithms is caused by the RTT delayvariation as a result of loading on the reverse data path. The queuing associated withthe reverse path traffic may cause the TCP algorithm to act inappropriately and thusreduce performance.
2

Specification
Vendor & Part Dell 2650CPU 3Ghz
Memory 2GBNIC Neterion XFrame I
NIC Driver 2.6.12.0
Table 1: PC configuration at SLAC.
Destination Location RTT No. Hosts
Caltech US West Coast 8.5msec 1Florida US East Coast 71.0msec 2Dublin Ireland, International 151msec 2
Table 2: Destination Sites and Configuration of PC’s at those sites.
2.1 Parameters Not Investigated
The fairness between flows of different end-to-end latencies (RTT Fairness) was identified in[4] as being an important factor in the scaleability of TCP algorithms as low latency flowsmay starve long latency (and hence less aggressive) flows. Important deductions from theliterature demonstrates that severe RTT unfairness between the various TCP algorithms isapparent. However, due to the requirement of a common bottleneck and the difficulty inengineering such a topology on the Internet, these sets of experiments were not conducted.
3 Test Setup
3.1 Hosts and Equipment
Microsoft Windows Vista build 5270 (December 2005) was installed on two machines (SeeTable 1) at SLAC and were connected onto the commodity production network: ESnet at1Gbit/sec and Internet2 (via Stanford University) also at 1Gbit/sec via a Cisco 6506.
Initial tests using the internal Broadcom network interface cards on these machinesshowed serious reordering (most likely a driver issue) and therefore the default NIC’s werechanged to Neterion XFrame I cards capable of 10Gb/sec. The newest drivers for this cardwere back ported (courtesy of Neterion) onto build 5270.
The PC’s were connected to a dedicated Cisco 6909 using Cisco SR Xenpaks, and a1Gbit/sec connection was made between the 6909 and the 6906 to provide production net-work access.
Three remote hosts were identified to be capable of high performance from which testswere conducted to and are shown in Table 2 and Table 3. Note that only one machine wasavailable at Caltech and the hosts at Florida are only Pentium III class servers.
3

SLAC-AS (SLAC)
CalREN-HPR (CalREN High Performance & Research Network)
ABILENE (Abilene Network)
FLRnet (FLR Transport Network)
UFlorida (University of Florida AS6356)
ESNET (Energy Sciences Network)
GEANT (The GEANT IP Service)
HEANET (HEAnet national network)
rtr-test-test
rtr-core1-p2p-test
rtr-dmz1-ger
slac-rt4.es.net i2-gateway.stanford.edu
slacmr1-slacrt4.es.net hpr-svl-hpr--stan-ge.cenic.net
lax-hpr--svl-hpr-10ge.cenic.net
lax-hpr.losnettos-hpr.cenic.net abilene-LA--hpr-lax-gsr1-10ge.cenic.net
Booth-RSM.ilan.caltech.edu hstnng-losang.abilene.ucaid.edu
CACR-ITS-BMR.caltech.edu
socrates.cacr.caltech.edu
atlang-hstnng.abilene.ucaid.edu
jax-flrcore-7609-1-te23-1800.net.flrnet.org
ssrb230a-ewan-msfc-1-v1805-1.ns.ufl.edu
ssrb6c-nexus-msfc-1-v30-1.ns.ufl.edu
ssrb230a-core-msfc-1-v20-1.ns.ufl.edu
ssrb201-nslabs-rsm-1-v222-1.ns.ufl.edu
iperf1-gig.nslabs.ufl.edu
snv2mr1-slacmr1.es.net
snv2sdn1-snv2mr1.es.net
chicr1-oc192-snvcr1.es.net
aoacr1-oc192-chicr1.es.net
esnet.ny1.ny.geant.net
ny.uk1.uk.geant.net
uk.ie1.ie.geant.net
heanet-gw.ie1.ie.geant.net
mantova-gige6-2.bh.access.hea.net
portia-po1.bh.access.hea.net
ham01dub.may.ie
Figure 1: Traceroute graph from SLAC to the Various Destination Hosts.
4

Destination CPU Memory Network Interface Card
Caltech 4×2.8Ghz Xeon 1GB SysKonnect SK-98xxGigabit Ethernet Server Adapter
Florida 1Ghz Pentium III 0.5GB Syskonnect (Schneider & Koch)Gigabit Ethernet
Dublin 2.4Ghz Xeon 4GB Intel Corp. 82545EMGigabit Ethernet Controller
Table 3: Network Interface Cards at Destination Sites
The above hosts remain on relatively stable network connections with virtually zeroroute flapping. The route through the Internet to each host is shown shown in Figure 1.The background traffic experienced for all hosts were primarily academic (Internet2) and ornational lab (ESnet) network traffic.
3.2 Testing Methodology
In order to maximise the raw number of results and determine with confidence the relativeperformances of each TCP congestion control algorithm to each destination, tests were rancontinuously, in a random fashion, 24 hours a day, 7 days a week. However, the resultsshown in Tables 4 to 7 were collated over the final week of February 2006.
The tests were automated using custom scripts (tools-server) from SLAC which enabled‘remote control’ of network nodes to start and gather test results. The automation requiredsome adaptation onto Windows hosts, and thus required ActivePerl and IIS to be installed tofacilitate the running of tests and the retrieval of test results respectively. This automationof tests enabled off-line (i.e. not live) analysis of test results.
All tests were ran with iperf [3], with custom modifications by Microsoft Research Chinato allow the dynamic switching of the TCP congestion control algorithm using the ‘-q’argument.
The duration of each test depends upon the type of test in question, but typically,sufficient time was given to provide the interaction between TCP flows to stabilise. Testswere chosen to run between 15 minutes and 45 minutes depending upon the complexity of thetest. Individual flows in each test were ran in a staggered fashion such that the convergencetimes between flows can be calculated and the dynamic interaction between TCP flows canbe seen. For tests which were staggered, the summary results only shows the performancewhen all flows were being ran; i.e. for 8 flow tests, the calculated statistics only representthe period whereby all 8 flows were competing.
3.3 Test Cases
A series of simple test cases were investigated in order to determine the properties of thevarious TCP algorithms under investigation.
• Single Flow
5
Flow 1
Flow 2
Flow 3
Flow 4
Time
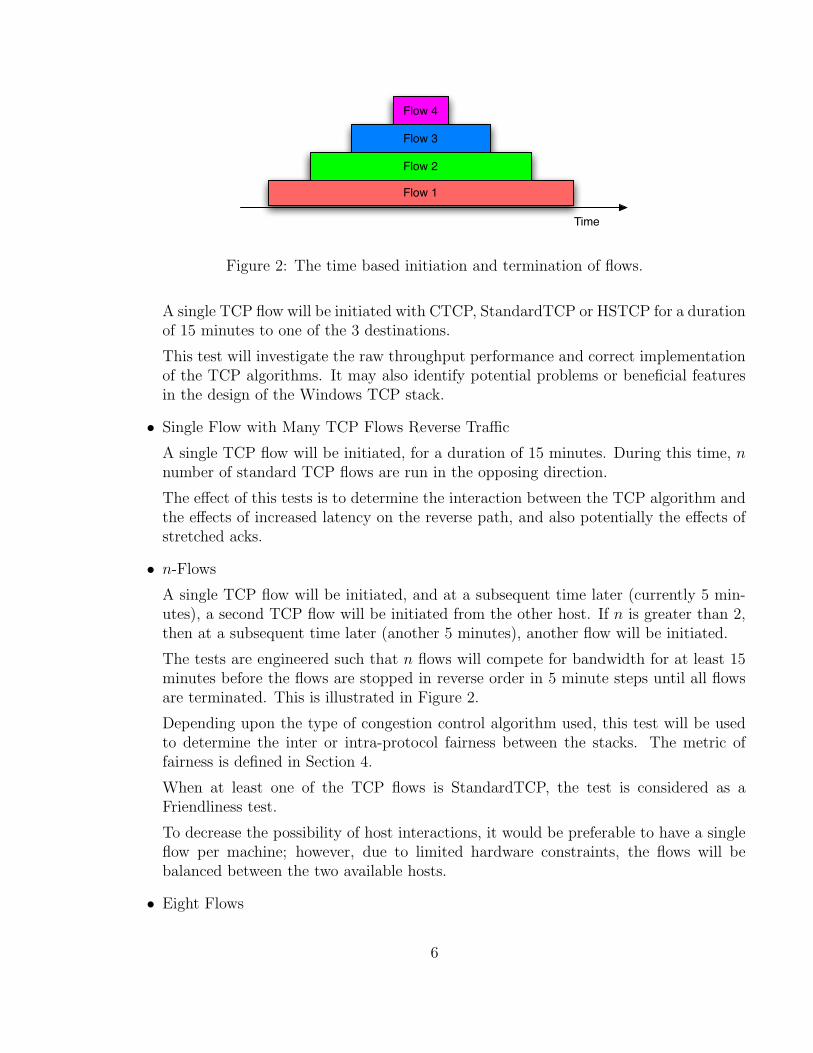
Figure 2: The time based initiation and termination of flows.
A single TCP flow will be initiated with CTCP, StandardTCP or HSTCP for a durationof 15 minutes to one of the 3 destinations.
This test will investigate the raw throughput performance and correct implementationof the TCP algorithms. It may also identify potential problems or beneficial featuresin the design of the Windows TCP stack.
• Single Flow with Many TCP Flows Reverse Traffic
A single TCP flow will be initiated, for a duration of 15 minutes. During this time, nnumber of standard TCP flows are run in the opposing direction.
The effect of this tests is to determine the interaction between the TCP algorithm andthe effects of increased latency on the reverse path, and also potentially the effects ofstretched acks.
• n-Flows
A single TCP flow will be initiated, and at a subsequent time later (currently 5 min-utes), a second TCP flow will be initiated from the other host. If n is greater than 2,then at a subsequent time later (another 5 minutes), another flow will be initiated.
The tests are engineered such that n flows will compete for bandwidth for at least 15minutes before the flows are stopped in reverse order in 5 minute steps until all flowsare terminated. This is illustrated in Figure 2.
Depending upon the type of congestion control algorithm used, this test will be usedto determine the inter or intra-protocol fairness between the stacks. The metric offairness is defined in Section 4.
When at least one of the TCP flows is StandardTCP, the test is considered as aFriendliness test.
To decrease the possibility of host interactions, it would be preferable to have a singleflow per machine; however, due to limited hardware constraints, the flows will bebalanced between the two available hosts.
• Eight Flows
6
Pairs of TCP connections will be initiated in 5 minute intervals in the same fashionas with the n-Flows case (instead of a single flow). That is at time 0, two flows willbe initiated on host 1, and then five minutes later two more flows will be initiated onhost 2. 10 minutes after the start of the test, another 2 flows are initiated from host 1and finally 5 minutes after this, the final pair of flows are initiated on host 2.
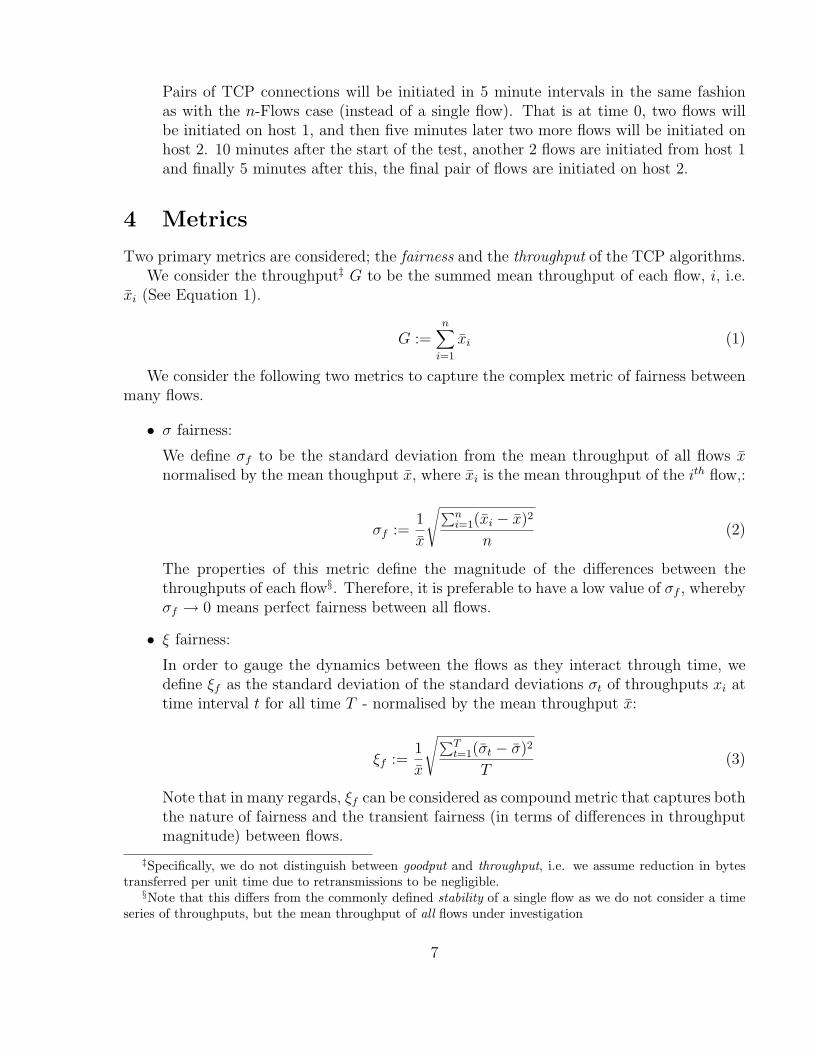
4 Metrics
Two primary metrics are considered; the fairness and the throughput of the TCP algorithms.We consider the throughput‡ G to be the summed mean throughput of each flow, i, i.e.
x̄i (See Equation 1).
G :=n∑
i=1
x̄i (1)
We consider the following two metrics to capture the complex metric of fairness betweenmany flows.
• σ fairness:
We define σf to be the standard deviation from the mean throughput of all flows x̄normalised by the mean thoughput x̄, where x̄i is the mean throughput of the ith flow,:
σf :=1
x̄
√∑ni=1(x̄i − x̄)2
n(2)
The properties of this metric define the magnitude of the differences between thethroughputs of each flow§. Therefore, it is preferable to have a low value of σf , wherebyσf → 0 means perfect fairness between all flows.
• ξ fairness:
In order to gauge the dynamics between the flows as they interact through time, wedefine ξf as the standard deviation of the standard deviations σt of throughputs xi attime interval t for all time T - normalised by the mean throughput x̄:
ξf :=1
x̄
√∑Tt=1(σ̄t − σ̄)2
T(3)
Note that in many regards, ξf can be considered as compound metric that captures boththe nature of fairness and the transient fairness (in terms of differences in throughputmagnitude) between flows.
‡Specifically, we do not distinguish between goodput and throughput, i.e. we assume reduction in bytestransferred per unit time due to retransmissions to be negligible.
§Note that this differs from the commonly defined stability of a single flow as we do not consider a timeseries of throughputs, but the mean throughput of all flows under investigation
7
Test TCP Algorithm Caltech Florida Ireland
1 Flow StandardTCP 3 3 41 Flow CTCP 6 4 31 Flow HSTCP 4 4 32 Flows StandardTCP 4 6 82 Flows CTCP 5 17 112 Flows HSTCP 3 8 94 Flows StandardTCP 3 2 34 Flows CTCP 2 5 54 Flows HSTCP 2 4 28 Flows StandardTCP 3 2 28 Flows CTCP 2 6 118 Flows HSTCP 2 3 6
16 Reverse TCP StandardTCP 3 11 216 Reverse TCP CTCP 2 10 1316 Reverse TCP HSTCP 3 7 15
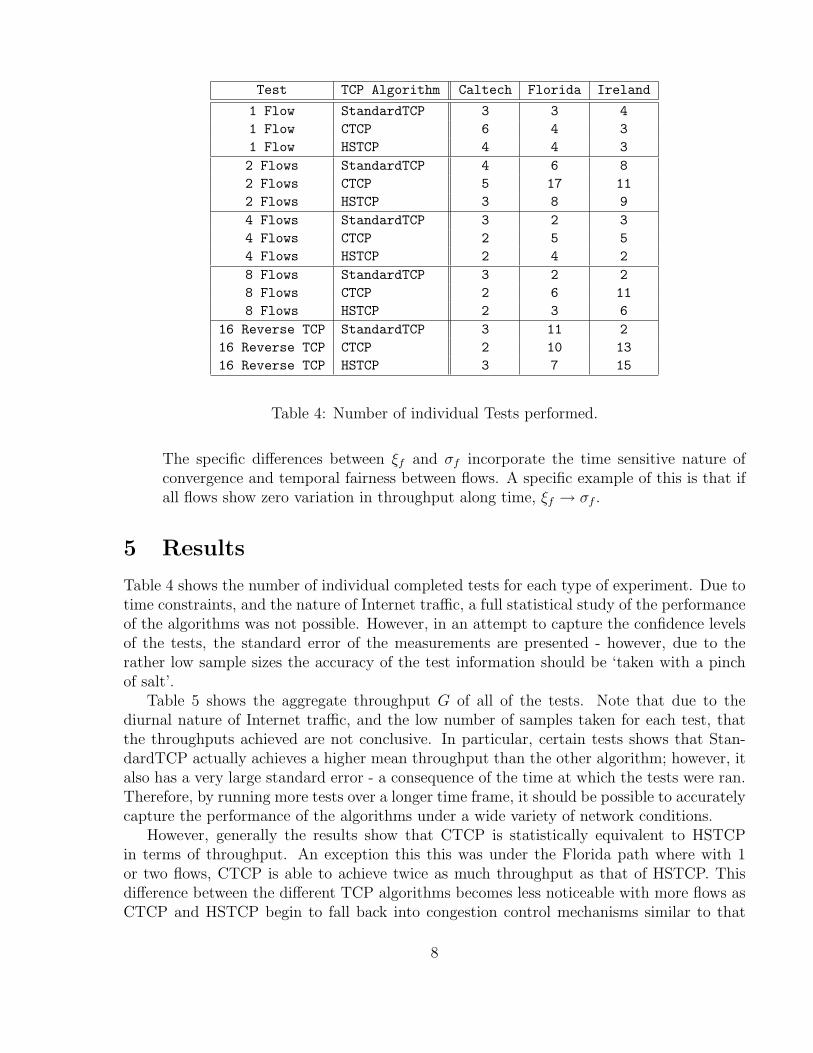
Table 4: Number of individual Tests performed.
The specific differences between ξf and σf incorporate the time sensitive nature ofconvergence and temporal fairness between flows. A specific example of this is that ifall flows show zero variation in throughput along time, ξf → σf .
5 Results
Table 4 shows the number of individual completed tests for each type of experiment. Due totime constraints, and the nature of Internet traffic, a full statistical study of the performanceof the algorithms was not possible. However, in an attempt to capture the confidence levelsof the tests, the standard error of the measurements are presented - however, due to therather low sample sizes the accuracy of the test information should be ‘taken with a pinchof salt’.
Table 5 shows the aggregate throughput G of all of the tests. Note that due to thediurnal nature of Internet traffic, and the low number of samples taken for each test, thatthe throughputs achieved are not conclusive. In particular, certain tests shows that Stan-dardTCP actually achieves a higher mean throughput than the other algorithm; however, italso has a very large standard error - a consequence of the time at which the tests were ran.Therefore, by running more tests over a longer time frame, it should be possible to accuratelycapture the performance of the algorithms under a wide variety of network conditions.
However, generally the results show that CTCP is statistically equivalent to HSTCPin terms of throughput. An exception this this was under the Florida path where with 1or two flows, CTCP is able to achieve twice as much throughput as that of HSTCP. Thisdifference between the different TCP algorithms becomes less noticeable with more flows asCTCP and HSTCP begin to fall back into congestion control mechanisms similar to that
8

Test TCP Algorithm Caltech Florida Ireland
1 Flow StandardTCP 521±15 114±5 62±191 Flow CTCP 619±21 252±13 146±371 Flow HSTCP 605±21 125±7 135±202 Flows StandardTCP 574±14 203±19 167±352 Flows CTCP 640±11 347±3 190±222 Flows HSTCP 504±136 161±7 216±424 Flows StandardTCP 645±26 280±3 223±424 Flows CTCP 653±33 379±1 258±424 Flows HSTCP 668±32 263±51 253±1608 Flows StandardTCP 732±74 331±1 431±758 Flows CTCP 672±23 389±2 435±538 Flows HSTCP 636±37 392±3 497±29
16 Reverse TCP StandardTCP 96±9 33±1 128±1416 Reverse TCP CTCP 108±7 45±2 121±1116 Reverse TCP HSTCP 87±12 114±4 133±10
Table 5: Aggregate throughput (mbit/sec) G of Tests.
Test TCP Algorithm Caltech Florida Ireland
1 Flow StandardTCP - - -1 Flow CTCP - - -1 Flow HSTCP - - -2 Flows StandardTCP 0.023±0.012 0.292±0.148 0.118±0.0302 Flows CTCP 0.006±0.004 0.062±0.020 0.305±0.0632 Flows HSTCP 0.076±0.035 0.496±0.149 0.292±0.0754 Flows StandardTCP 0.109±0.082 0.024±0.001 0.107±0.0314 Flows CTCP 0.017±0.008 0.032±0.010 0.362±0.0614 Flows HSTCP 0.091±0.022 0.622±0.311 0.410±0.0158 Flows StandardTCP 0.114±0.048 0.048±0.000 0.169±0.0488 Flows CTCP 0.013±0.006 0.028±0.005 0.345±0.0168 Flows HSTCP 0.090±0.013 0.245±0.180 0.386±0.029
16 Reverse TCP StandardTCP - - -16 Reverse TCP CTCP - - -16 Reverse TCP HSTCP - - -
Table 6: σf of Tests.
9
Test TCP Algorithm Caltech Florida Ireland
1 Flow StandardTCP - - -1 Flow CTCP - - -1 Flow HSTCP - - -2 Flows StandardTCP 0.214±0.007 0.554±0.202 0.289±0.0402 Flows CTCP 0.145±0.005 0.210±0.020 0.441±0.0352 Flows HSTCP 0.540±0.222 1.000±0.065 0.458±0.0454 Flows StandardTCP 0.294±0.067 0.236±0.003 0.256±0.0314 Flows CTCP 0.174±0.010 0.208±0.009 0.549±0.0354 Flows HSTCP 0.432±0.005 0.961±0.350 0.519±0.0358 Flows StandardTCP 0.326±0.037 0.285±0.022 0.317±0.0328 Flows CTCP 0.236±0.018 0.223±0.002 0.570±0.0298 Flows HSTCP 0.677±0.005 0.434±0.148 0.597±0.058
16 Reverse TCP StandardTCP - - -16 Reverse TCP CTCP - - -16 Reverse TCP HSTCP - - -
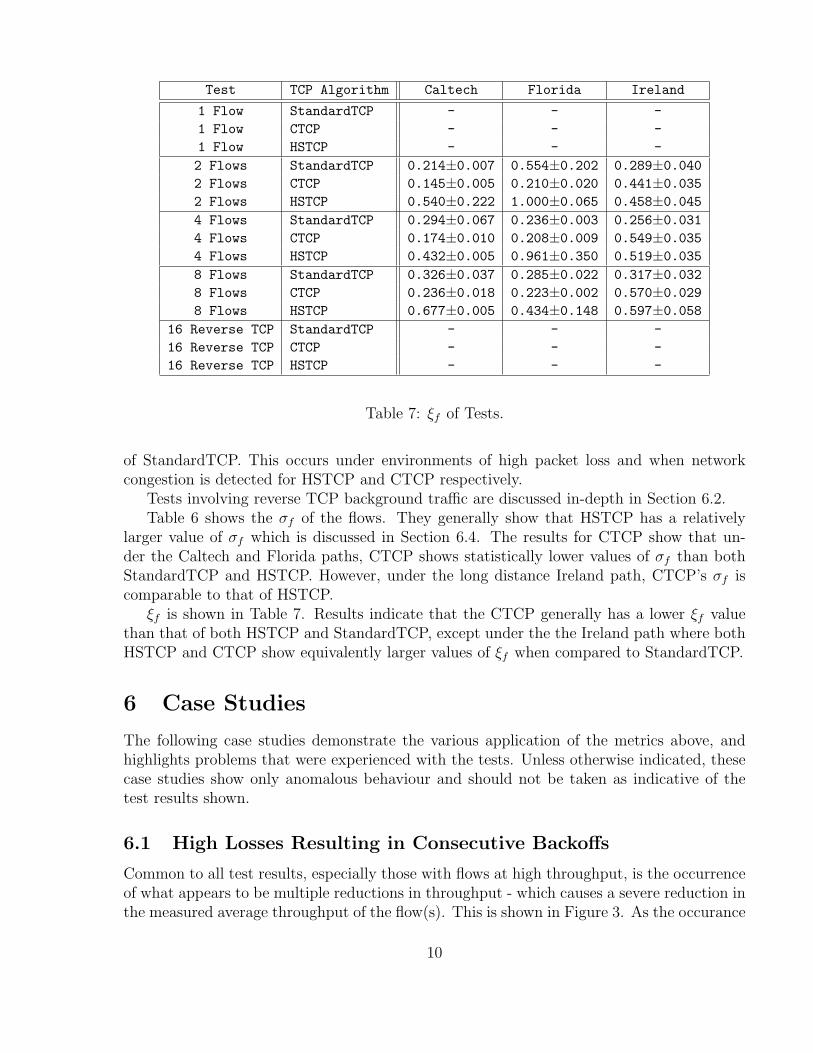
Table 7: ξf of Tests.
of StandardTCP. This occurs under environments of high packet loss and when networkcongestion is detected for HSTCP and CTCP respectively.
Tests involving reverse TCP background traffic are discussed in-depth in Section 6.2.Table 6 shows the σf of the flows. They generally show that HSTCP has a relatively
larger value of σf which is discussed in Section 6.4. The results for CTCP show that un-der the Caltech and Florida paths, CTCP shows statistically lower values of σf than bothStandardTCP and HSTCP. However, under the long distance Ireland path, CTCP’s σf iscomparable to that of HSTCP.
ξf is shown in Table 7. Results indicate that the CTCP generally has a lower ξf valuethan that of both HSTCP and StandardTCP, except under the the Ireland path where bothHSTCP and CTCP show equivalently larger values of ξf when compared to StandardTCP.
6 Case Studies
The following case studies demonstrate the various application of the metrics above, andhighlights problems that were experienced with the tests. Unless otherwise indicated, thesecase studies show only anomalous behaviour and should not be taken as indicative of thetest results shown.
6.1 High Losses Resulting in Consecutive Backoffs
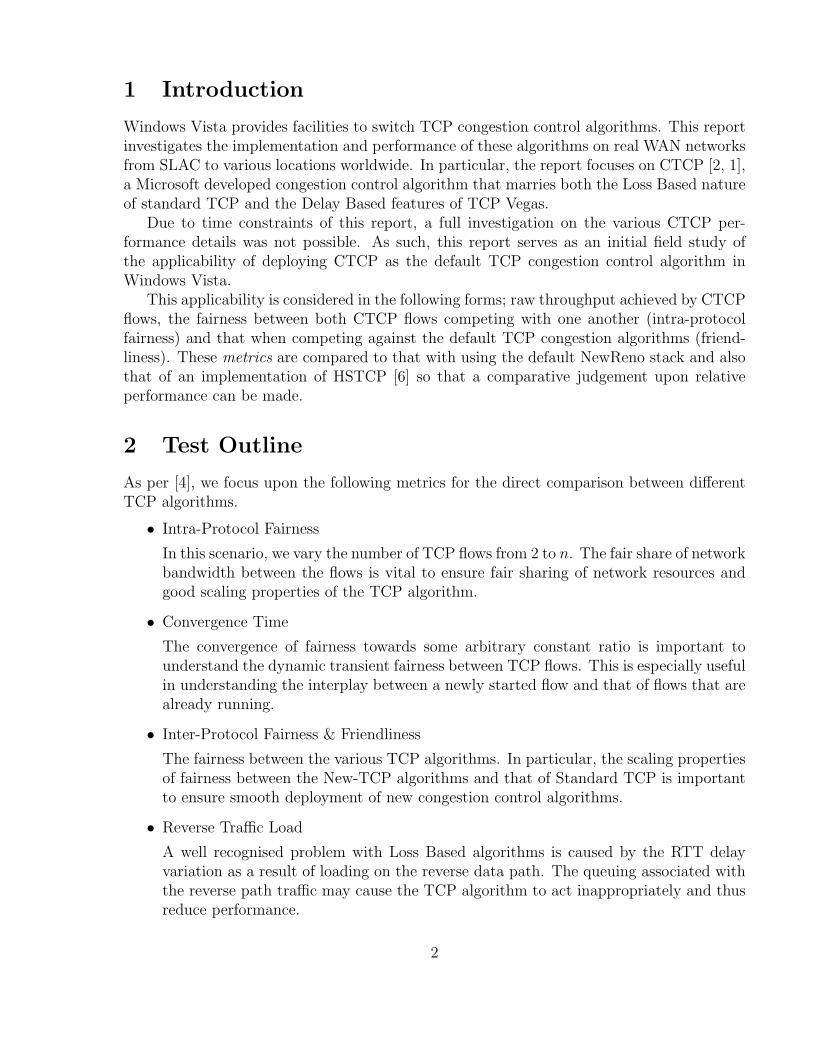
Common to all test results, especially those with flows at high throughput, is the occurrenceof what appears to be multiple reductions in throughput - which causes a severe reduction inthe measured average throughput of the flow(s). This is shown in Figure 3. As the occurance
10

0
100
200
300
400
500
0 100 200 300 400 500 600 700 800 900T
hrou
ghpu
t (m
bit/s
ec)
Duration (seconds)
StandardTCP from SLAC to Florida
StandardTCP
0
100
200
300
400
500
0 100 200 300 400 500 600 700 800 900
Thr
ough
put (
mbi
t/sec
)
Duration (seconds)
HSTCP from SLAC to Florida
HSTCP
0
100
200
300
400
500
0 100 200 300 400 500 600 700 800 900
Thr
ough
put (
mbi
t/sec
)
Duration (seconds)
CTCP from SLAC to Florida
CTCP
Figure 3: Dramatic Drops experienced by all TCP algorithms.
of these large drops in throughput is apparent on all TCP algorithms, it is assumed thatthe problems are associated with the network stack rather than with the congestion controlalgorithms.
Figure 4 shows the cwnd, ssthresh and dwnd of the CTCP graph in Figure 3. Note thatafter a loss, the value of ssthresh should be set to b × cwnd¶ (where b = 0.5 under Stan-dardTCP and CTCP), and then subsequently cwnd should be set to this value of ssthresh.The purpose of this is so that TCP slow start can quickly regain the lost throughput shoulda timeout occur. However, Figure 4 shows that in fact the ssthresh value is sometimes setto very small values (sometimes from thousands of packets down to only tens of packets).
Figure 5 shows the cwnd and ssthresh dynamic of the altAIMD Linux kernel [4] andwith Windows Vista with their implementations of HSTCP. Due to the temporal differencesbetween the tests, a direct comparision between the two implementations can not be madedirectly from these graphs (e.g. the relatively smaller values of the Linux implementationcould be due to excess cross traffic). However, it can be seen that under the Windows imple-mentation at approximately 350 and 650 seconds that the ssthresh value after a congestion
¶In fact, it ssthresh should be set to b× f where f is equal to the number of packets ‘in-flight’, which tofirst approximation is typically approximately the same as cwnd.
11

0
500
1000
1500
2000
2500
3000
0 100 200 300 400 500 600 700 800 900
Win
dow
(pa
cket
s)
Duration (seconds)
CTCP from SLAC to Florida
cwnddwnd
ssthresh
Figure 4: Drops experienced by CTCP algorithm.
0
1000
2000
3000
4000
5000
6000
0 100 200 300 400 500 600 700 800 900
Win
dow
(pa
cket
s)
Duration (seconds)
Windows HSTCP from SLAC to Ireland
cwndssthresh
0
1000
2000
3000
4000
5000
6000
0 100 200 300 400 500 600 700 800 900
Win
dow
(pa
cket
s)
Duration (seconds)
Linux HSTCP from SLAC to Ireland
cwndssthresh
Figure 5: Drops experienced by Linux and Windows HSTCP algorithm.
12

12:40:15.610 [tcp]dup halve. DWnd = 1149703 CWnd = 1311918 sndUna = 3870992794
12:40:16.058 [tcp]CTcpTimeoutCallback: CWnd = 7097898 SsThresh = 1307538
12:40:16.058 [tcp]dup halve. DWnd = 0 CWnd = 7300 sndUna = 3871619134
12:40:16.132 [tcp]CTcpTryToOpenDWnd: CWnd = 1084783 SsThresh = 2920, BaseRTT 0
12:40:16.210 [tcp]CWnd Compensated! CWnd = 6603580 DWnd = 1460 SndUna = 3872141814
12:40:16.210 [tcp]dup halve. DWnd = 730 CWnd = 3306170 sndUna = 3872141814
12:40:16.714 [tcp]CTcpTimeoutCallback: CWnd = 4447890 SsThresh = 3301790
12:40:16.857 [tcp]dup halve. DWnd = 0 CWnd = 10950 sndUna = 3872375414
12:40:17.433 [tcp]dup halve. DWnd = 0 CWnd = 7665 sndUna = 3878745394
12:40:17.505 [tcp]Tcp Rtt Samples: CWnd = 3285, SsThresh = 3285, Rtt = 6
12:40:17.643 [tcp]Tcp Rtt Samples: CWnd = 8818, SsThresh = 3285, Rtt = 8
12:40:17.714 [tcp]Tcp Rtt Samples: CWnd = 10189, SsThresh = 3285, Rtt = 8
Figure 6: TCP Trace of grepped events leading to Consecutive Backoffs
event falls to very small values which in turn prevents the use of slow-start after time-outsand forces the congestion control algorithm to start from very low cwnd values. Whilstmultiple drops are also apparent in the Linux implementation, it rarely forces ssthresh tosuch small values as suddenly as it does for the Windows implementation.
Given that the TCP logging in Windows is event based, these large drops in ssthresh insequential events is unexpected: an inspection of the TCP event trace shows that there is ancomplex interaction of dub halves and CTcpTimeoutCallback’s which causes the windowvalues to fall. Further investigation of this is required to fully understand the interactionbetween what is actually happening with regards to packet events to what actually occursin the TCP stack. A snapshot of the trace is shown in Figure 6.1.
6.2 The Effect of Reverse Traffic
There is a requirement for sufficient delay information for CTCP to operate efficiently. Trafficon the reverse path of the TCP flow will increase the measured latency resulting in reducedperformance for the CTCP flow.
Table 5 indicates that there is little effect upon the throughput of reverse traffic on theIreland link. However, there is a very pronounced effect on the Caltech and Florida paths- for all TCP algorithms, not just CTCP. Whilst the typical single flow tests demonstratethroughputs in excess of 500Mbit/sec for all TCP algorithms; in the presence of 16 TCP flowsin the reverse direction, attainable throughput diminishes to approximately 100Mbit/sec.Similarly, the Florida link sees a reduction from 100-200Mbit/sec down to about 40Mbit/sec.
There is an exception with HSTCP on the Florida link whereby similar throughputs areachieved with and without reverse traffic. Further research is needed to be conducted todeduce this discrepancy.
Whilst some of the problems of reduced throughput (compared to having no reversetraffic) may be explained by the fact that Caltech only has a single host, the other tests wereperformed with the reverse traffic on a separate pair of hosts from that of the test TCP flowsuch that host issues (e.g. high flux of interrupts, memory and CPU saturation, etc.) shouldnot affect the results.
An important point to note here is that in the presence of reverse traffic, the throughputof CTCP is no worse than that of StandardTCP. However, some further investigation isrequired to determine the cause of the reduced forward path throughput for the Florida andCaltech path.
13
0 50
100 150 200 250 300 350 400
100 150 200 250 300 350 400 450 500T
hrou
ghpu
t (m
bit/s
ec)
Duration (seconds)
CTCP from SLAC to Florida
CTCP
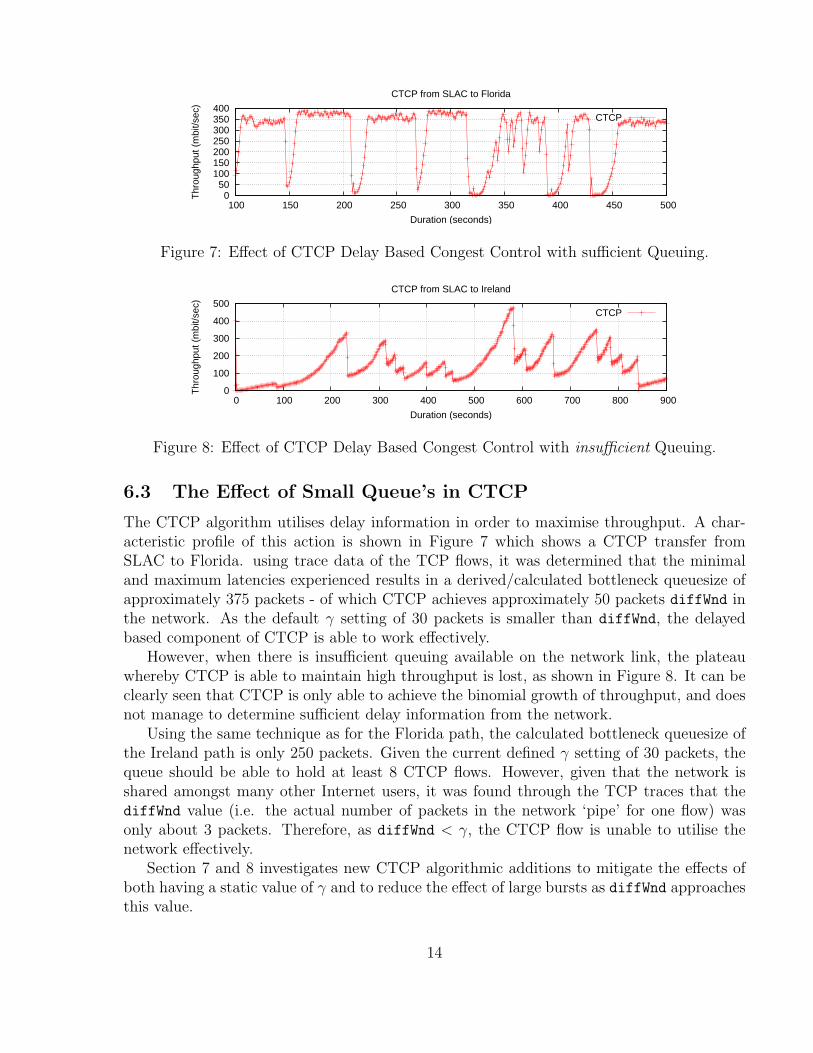
Figure 7: Effect of CTCP Delay Based Congest Control with sufficient Queuing.
0
100
200
300
400
500
0 100 200 300 400 500 600 700 800 900
Thr
ough
put (
mbi
t/sec
)
Duration (seconds)
CTCP from SLAC to Ireland
CTCP
Figure 8: Effect of CTCP Delay Based Congest Control with insufficient Queuing.
6.3 The Effect of Small Queue’s in CTCP
The CTCP algorithm utilises delay information in order to maximise throughput. A char-acteristic profile of this action is shown in Figure 7 which shows a CTCP transfer fromSLAC to Florida. using trace data of the TCP flows, it was determined that the minimaland maximum latencies experienced results in a derived/calculated bottleneck queuesize ofapproximately 375 packets - of which CTCP achieves approximately 50 packets diffWnd inthe network. As the default γ setting of 30 packets is smaller than diffWnd, the delayedbased component of CTCP is able to work effectively.
However, when there is insufficient queuing available on the network link, the plateauwhereby CTCP is able to maintain high throughput is lost, as shown in Figure 8. It can beclearly seen that CTCP is only able to achieve the binomial growth of throughput, and doesnot manage to determine sufficient delay information from the network.
Using the same technique as for the Florida path, the calculated bottleneck queuesize ofthe Ireland path is only 250 packets. Given the current defined γ setting of 30 packets, thequeue should be able to hold at least 8 CTCP flows. However, given that the network isshared amongst many other Internet users, it was found through the TCP traces that thediffWnd value (i.e. the actual number of packets in the network ‘pipe’ for one flow) wasonly about 3 packets. Therefore, as diffWnd < γ, the CTCP flow is unable to utilise thenetwork effectively.
Section 7 and 8 investigates new CTCP algorithmic additions to mitigate the effects ofboth having a static value of γ and to reduce the effect of large bursts as diffWnd approachesthis value.
14
0
50
100
150
200
250
300
900 1000 1100 1200 1300 1400 1500 1600 1700 1800T
hrou
ghpu
t (m
bit/s
ec)
Duration (seconds)
StandardTCP from SLAC to Caltech
StandardTCP 1StandardTCP 2StandardTCP 3StandardTCP 4StandardTCP 5StandardTCP 6StandardTCP 7StandardTCP 8
0
50
100
150
200
250
300
900 1000 1100 1200 1300 1400 1500 1600 1700 1800
Thr
ough
put (
mbi
t/sec
)
Duration (seconds)
HSTCP from SLAC to Caltech
HSTCP 1HSTCP 2HSTCP 3HSTCP 4HSTCP 5HSTCP 6HSTCP 7HSTCP 8
0
50
100
150
200
250
300
900 1000 1100 1200 1300 1400 1500 1600 1700 1800
Thr
ough
put (
mbi
t/sec
)
Duration (seconds)
CTCP from SLAC to Caltech
CTCP 1CTCP 2CTCP 3CTCP 4CTCP 5CTCP 6CTCP 7CTCP 8
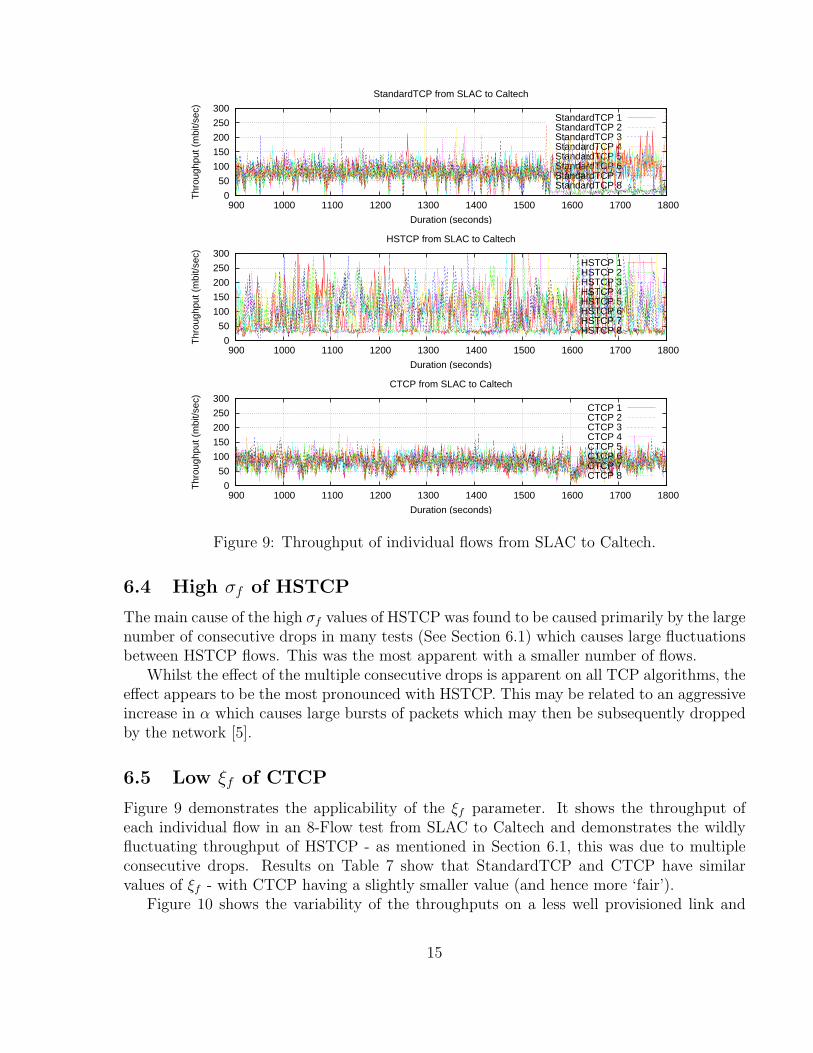
Figure 9: Throughput of individual flows from SLAC to Caltech.
6.4 High σf of HSTCP
The main cause of the high σf values of HSTCP was found to be caused primarily by the largenumber of consecutive drops in many tests (See Section 6.1) which causes large fluctuationsbetween HSTCP flows. This was the most apparent with a smaller number of flows.
Whilst the effect of the multiple consecutive drops is apparent on all TCP algorithms, theeffect appears to be the most pronounced with HSTCP. This may be related to an aggressiveincrease in α which causes large bursts of packets which may then be subsequently droppedby the network [5].
6.5 Low ξf of CTCP
Figure 9 demonstrates the applicability of the ξf parameter. It shows the throughput ofeach individual flow in an 8-Flow test from SLAC to Caltech and demonstrates the wildlyfluctuating throughput of HSTCP - as mentioned in Section 6.1, this was due to multipleconsecutive drops. Results on Table 7 show that StandardTCP and CTCP have similarvalues of ξf - with CTCP having a slightly smaller value (and hence more ‘fair’).
Figure 10 shows the variability of the throughputs on a less well provisioned link and
15

0
50
100
150
200
250
300
900 1000 1100 1200 1300 1400 1500 1600 1700 1800
Thr
ough
put (
mbi
t/sec
)
Duration (seconds)
StandardTCP from SLAC to Ireland
StandardTCP 1StandardTCP 2StandardTCP 3StandardTCP 4StandardTCP 5StandardTCP 6StandardTCP 7StandardTCP 8
0
50
100
150
200
250
300
900 1000 1100 1200 1300 1400 1500 1600 1700 1800
Thr
ough
put (
mbi
t/sec
)
Duration (seconds)
HSTCP from SLAC to Ireland
HSTCP 1HSTCP 2HSTCP 3HSTCP 4HSTCP 5HSTCP 6HSTCP 7HSTCP 8
0
50
100
150
200
250
300
900 1000 1100 1200 1300 1400 1500 1600 1700 1800
Thr
ough
put (
mbi
t/sec
)
Duration (seconds)
CTCP from SLAC to Ireland
CTCP 1CTCP 2CTCP 3CTCP 4CTCP 5CTCP 6CTCP 7CTCP 8
Figure 10: Throughput of individual flows from SLAC to Ireland.
16
Flows CTCP Algorithm Samples Throughput σf ξf
1 Original 29 116±7 - -1 with muted dwnd increments 35 222±8 - -1 with partial dwnd increments 36 177±11 - -2 Original 19 143±11 0.22±0.08 0.52±0.062 with muted dwnd increments 15 197±24 0.13±0.02 0.34±0.022 with partial dwnd increments 18 217±26 0.10±0.02 0.35±0.018 Original 10 384±15 0.35±0.05 0.87±0.048 with muted dwnd increments 9 474±35 0.19±0.02 0.52±0.038 with partial dwnd increments 8 470±23 0.27±0.03 0.61±0.02
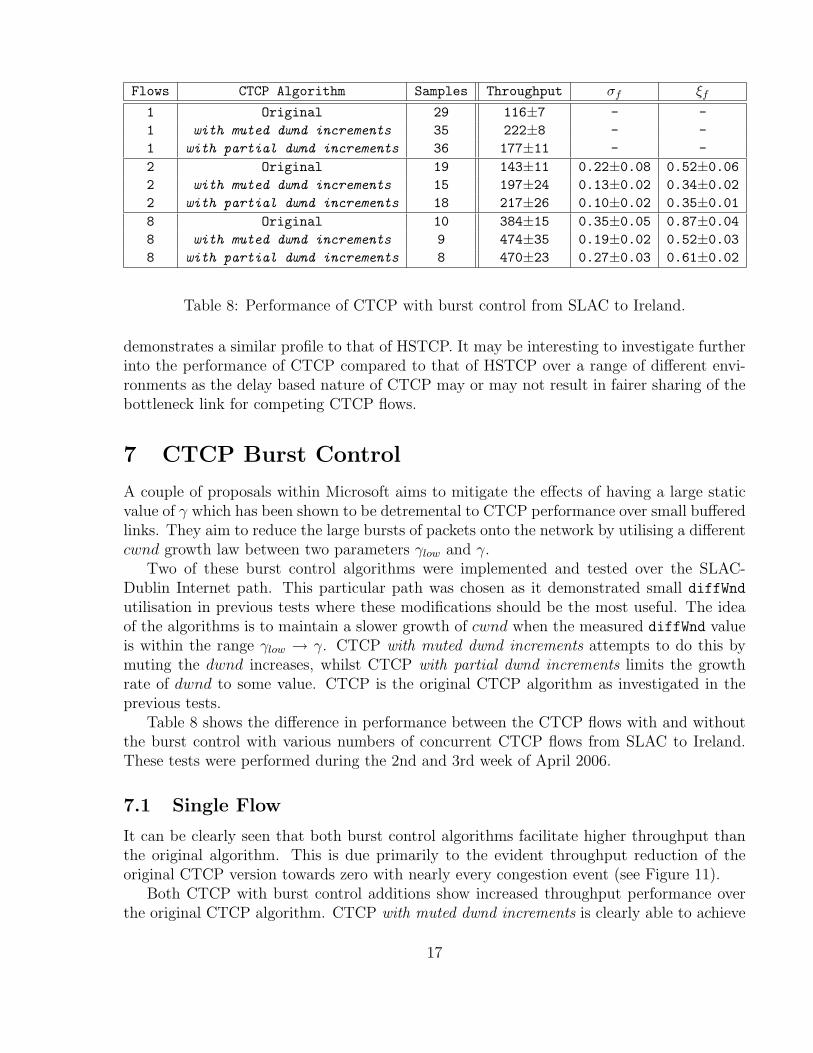
Table 8: Performance of CTCP with burst control from SLAC to Ireland.
demonstrates a similar profile to that of HSTCP. It may be interesting to investigate furtherinto the performance of CTCP compared to that of HSTCP over a range of different envi-ronments as the delay based nature of CTCP may or may not result in fairer sharing of thebottleneck link for competing CTCP flows.
7 CTCP Burst Control
A couple of proposals within Microsoft aims to mitigate the effects of having a large staticvalue of γ which has been shown to be detremental to CTCP performance over small bufferedlinks. They aim to reduce the large bursts of packets onto the network by utilising a differentcwnd growth law between two parameters γlow and γ.
Two of these burst control algorithms were implemented and tested over the SLAC-Dublin Internet path. This particular path was chosen as it demonstrated small diffWndutilisation in previous tests where these modifications should be the most useful. The ideaof the algorithms is to maintain a slower growth of cwnd when the measured diffWnd valueis within the range γlow → γ. CTCP with muted dwnd increments attempts to do this bymuting the dwnd increases, whilst CTCP with partial dwnd increments limits the growthrate of dwnd to some value. CTCP is the original CTCP algorithm as investigated in theprevious tests.
Table 8 shows the difference in performance between the CTCP flows with and withoutthe burst control with various numbers of concurrent CTCP flows from SLAC to Ireland.These tests were performed during the 2nd and 3rd week of April 2006.
7.1 Single Flow
It can be clearly seen that both burst control algorithms facilitate higher throughput thanthe original algorithm. This is due primarily to the evident throughput reduction of theoriginal CTCP version towards zero with nearly every congestion event (see Figure 11).
Both CTCP with burst control additions show increased throughput performance overthe original CTCP algorithm. CTCP with muted dwnd increments is clearly able to achieve
17
0 1000 2000 3000 4000 5000 6000 7000
0 100 200 300 400 500 600 700 800 900W
indo
w (
pack
ets)
Duration (seconds)
Original CTCP from SLAC to Ireland
wnddwnd
0 1000 2000 3000 4000 5000 6000 7000
0 100 200 300 400 500 600 700 800 900
Win
dow
(pa
cket
s)
Duration (seconds)
CTCP with muted dwnd increments from SLAC to Ireland
wnddwnd
0 1000 2000 3000 4000 5000 6000 7000
0 100 200 300 400 500 600 700 800 900
Win
dow
(pa
cket
s)
Duration (seconds)
CTCP with partial dwnd increments from SLAC to Ireland
wnddwnd
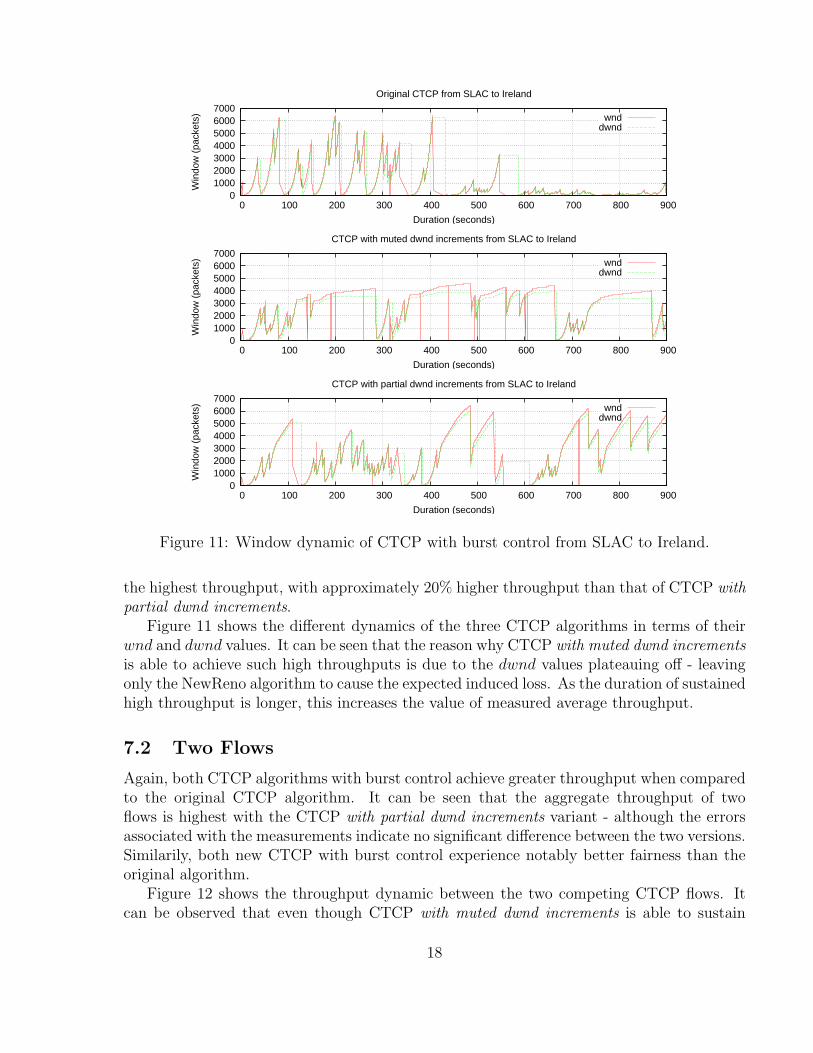
Figure 11: Window dynamic of CTCP with burst control from SLAC to Ireland.
the highest throughput, with approximately 20% higher throughput than that of CTCP withpartial dwnd increments.
Figure 11 shows the different dynamics of the three CTCP algorithms in terms of theirwnd and dwnd values. It can be seen that the reason why CTCP with muted dwnd incrementsis able to achieve such high throughputs is due to the dwnd values plateauing off - leavingonly the NewReno algorithm to cause the expected induced loss. As the duration of sustainedhigh throughput is longer, this increases the value of measured average throughput.
7.2 Two Flows
Again, both CTCP algorithms with burst control achieve greater throughput when comparedto the original CTCP algorithm. It can be seen that the aggregate throughput of twoflows is highest with the CTCP with partial dwnd increments variant - although the errorsassociated with the measurements indicate no significant difference between the two versions.Similarily, both new CTCP with burst control experience notably better fairness than theoriginal algorithm.
Figure 12 shows the throughput dynamic between the two competing CTCP flows. Itcan be observed that even though CTCP with muted dwnd increments is able to sustain
18

0 50
100 150 200 250 300 350 400
400 600 800 1000 1200 1400T
hrou
ghpu
t (m
bit/s
ec)
Duration (seconds)
Original CTCP from SLAC to Ireland
CTCP flow #1CTCP flow #2
0 50
100 150 200 250 300 350 400
400 600 800 1000 1200 1400
Thr
ough
put (
mbi
t/sec
)
Duration (seconds)
CTCP with muted dwnd increments from SLAC to Ireland
CTCP flow #1CTCP flow #2
0 50
100 150 200 250 300 350 400
400 600 800 1000 1200 1400
Thr
ough
put (
mbi
t/sec
)
Duration (seconds)
CTCP with partial dwnd increments from SLAC to Ireland
CTCP flow #1CTCP flow #2
Figure 12: Interaction between CTCP with burst control from SLAC to Ireland.
longer periods of high throughput, the peak throughput is generally less than that of CTCPwith partial dwnd increments due to the switch back to NewReno.
Also, the it can be seen with the CTCP with muted dwnd increments trace there areperiods of noise between the two CTCP with muted dwnd increments flows as they attemptto achieve fair sharing. This contributes to slightly higher measured values of σf and ξf .The noise in question could be due to the sampling differences of RTT of each flow that maycause the dwnd dynamics to be less stable.
7.3 Eight Flows
Similar to the results with a single and two flows, the new algorithmic versions of CTCPshows improved performance for both increased throughput and better fairness between theflows. Again, the differences between the two are negligible.
19

Flows CTCP Algorithm Samples Throughput σf ξf
1 with muted dwnd increments 5 119±19 - -1 with DiffwndBasedFairness 8 131±9 - -1 with LossWindowBasedFairness 2 103±33 - -2 with muted dwnd increments 19 157±12 0.08±0.02 0.33±0.012 with DiffwndBasedFairness 15 200±21 0.12±0.03 0.28±0.032 with LossWindowBasedFairness 18 182±17 0.15±0.02 0.30±0.028 with muted dwnd increments 10 377±17 0.17±0.02 0.51±0.018 with DiffwndBasedFairness 9 406±10 0.17±0.02 0.49±0.018 with LossWindowBasedFairness 8 318±87 0.13±0.03 0.47±0.04
Table 9: Performance of CTCP with γ auto-tuning from SLAC to Ireland.
8 γ Auto-Tuning
CTCP requires a suitable value of γ to such that it can gather sufficient delay informationfrom the network in order to operate effectively. This is true of all delayed based congestioncontrol algorithms, and each individual flow (such as a single CTCP flow) needs to main-tain approximately γ number of packets on the network to order for the flow to remain inequilibrium. All previous tests were conducted with a design parameter of γ = 30 packets.
However, certain network links may not be able to maintain such large numbers of packets- especially as the number of flows scale. Furthermore, the optimal value of γ will differdepending upon the end-to-end network path and the volume of cross traffic that will affectthe amount of buffering available.
The outcome of having too large a γ for a particular network path was seen in Figures 7and 8.
In order to improve the interaction of CTCP under different network environments and toreduce the large bursts of packets due to a large static value of γ, an auto-tuning feature wasimplemented. γ auto-tuning facilitates the adaption of the γ value such that the delay partof the CTCP congestion control can function more appropriately under different networkconditions.
Two algorithms were devised by Microsoft to enable this functionality. Both also imple-ment the CTCP with muted dwnd increments variant described as above and were tested onthe SLAC-Ireland path as shown in Table 9.
These tests were performed in the middle two weeks of May 2006.
8.1 Single Flow
It can be clearly seen that CTCP with DiffwndBasedFairness has the highest mean through-put, however, when the error is considered, all versions appear to perform similarly.
20
0
100
200
300
400
500
0 200 400 600 800 1000 1200 1400 1600 1800T
hrou
ghpu
t (m
bit/s
ec)
Duration (seconds)
HSTCP vs StandardTCP from SLAC to Ireland
HSTCPStandardTCP
0
100
200
300
400
500
0 200 400 600 800 1000 1200 1400 1600 1800
Thr
ough
put (
mbi
t/sec
)
Duration (seconds)
CTCP vs StandardTCP from SLAC to Ireland
CTCPStandardTCP
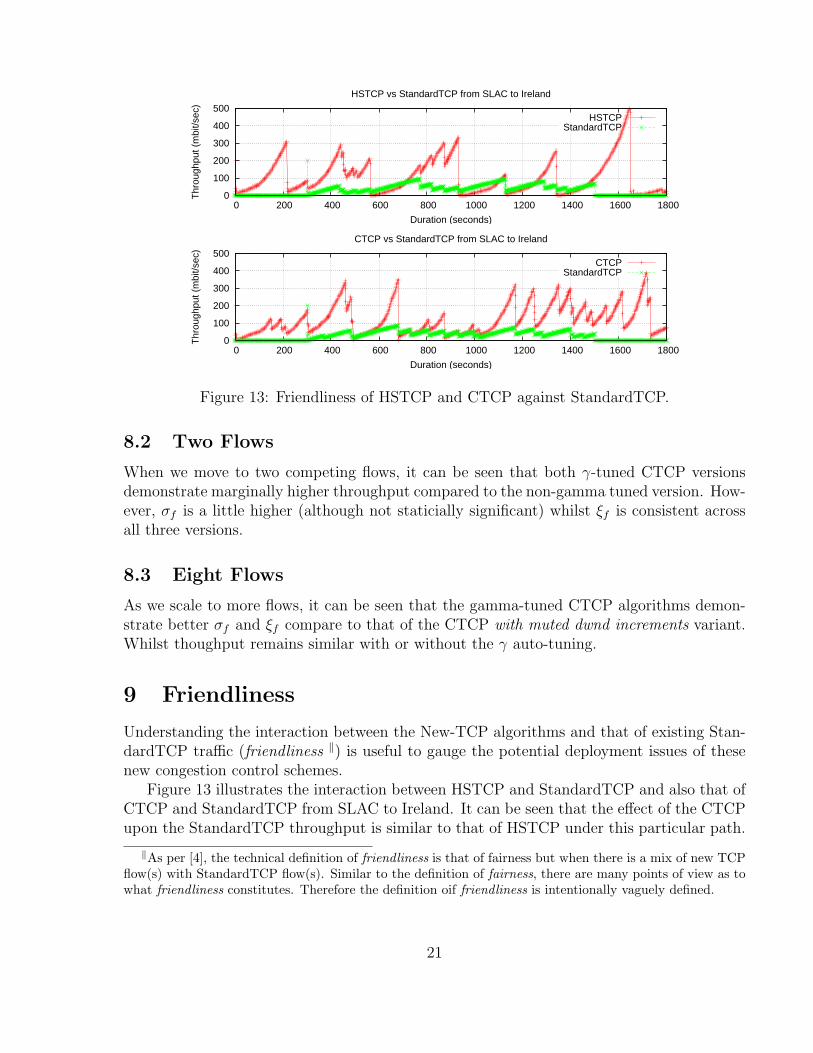
Figure 13: Friendliness of HSTCP and CTCP against StandardTCP.
8.2 Two Flows
When we move to two competing flows, it can be seen that both γ-tuned CTCP versionsdemonstrate marginally higher throughput compared to the non-gamma tuned version. How-ever, σf is a little higher (although not staticially significant) whilst ξf is consistent acrossall three versions.
8.3 Eight Flows
As we scale to more flows, it can be seen that the gamma-tuned CTCP algorithms demon-strate better σf and ξf compare to that of the CTCP with muted dwnd increments variant.Whilst thoughput remains similar with or without the γ auto-tuning.
9 Friendliness
Understanding the interaction between the New-TCP algorithms and that of existing Stan-dardTCP traffic (friendliness ‖) is useful to gauge the potential deployment issues of thesenew congestion control schemes.
Figure 13 illustrates the interaction between HSTCP and StandardTCP and also that ofCTCP and StandardTCP from SLAC to Ireland. It can be seen that the effect of the CTCPupon the StandardTCP throughput is similar to that of HSTCP under this particular path.
‖As per [4], the technical definition of friendliness is that of fairness but when there is a mix of new TCPflow(s) with StandardTCP flow(s). Similar to the definition of fairness, there are many points of view as towhat friendliness constitutes. Therefore the definition oif friendliness is intentionally vaguely defined.
21
Ireland (Samples) Florida
8 StandardTCP 310.68±21.44 340.80±4.23Total 310.68±21.44 (6) 340.80±4.23 (9)
7 StandardTCP 182.91±16.41 290.65±2.481 CTCP 125.47±17.72 79.32±1.81Total 312.31±33.36 (7) 371.83±0.65 (4)
7 StandardTCP 206.10±7.67 222.24±2.071 HSTCP 122.89±8.16 88.21±1.29Total 332.29±17.33 (7) 310.97±0.88 (4)
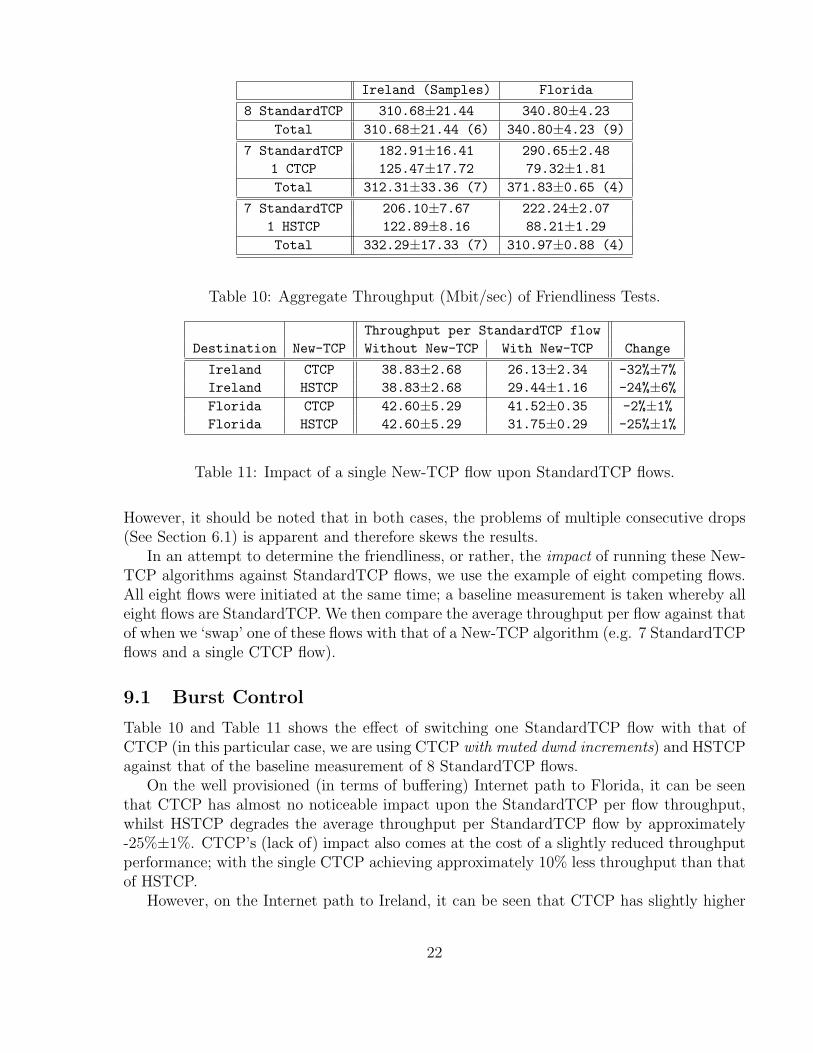
Table 10: Aggregate Throughput (Mbit/sec) of Friendliness Tests.
Throughput per StandardTCP flowDestination New-TCP Without New-TCP With New-TCP Change
Ireland CTCP 38.83±2.68 26.13±2.34 -32%±7%Ireland HSTCP 38.83±2.68 29.44±1.16 -24%±6%Florida CTCP 42.60±5.29 41.52±0.35 -2%±1%Florida HSTCP 42.60±5.29 31.75±0.29 -25%±1%
Table 11: Impact of a single New-TCP flow upon StandardTCP flows.
However, it should be noted that in both cases, the problems of multiple consecutive drops(See Section 6.1) is apparent and therefore skews the results.
In an attempt to determine the friendliness, or rather, the impact of running these New-TCP algorithms against StandardTCP flows, we use the example of eight competing flows.All eight flows were initiated at the same time; a baseline measurement is taken whereby alleight flows are StandardTCP. We then compare the average throughput per flow against thatof when we ‘swap’ one of these flows with that of a New-TCP algorithm (e.g. 7 StandardTCPflows and a single CTCP flow).
9.1 Burst Control
Table 10 and Table 11 shows the effect of switching one StandardTCP flow with that ofCTCP (in this particular case, we are using CTCP with muted dwnd increments) and HSTCPagainst that of the baseline measurement of 8 StandardTCP flows.
On the well provisioned (in terms of buffering) Internet path to Florida, it can be seenthat CTCP has almost no noticeable impact upon the StandardTCP per flow throughput,whilst HSTCP degrades the average throughput per StandardTCP flow by approximately-25%±1%. CTCP’s (lack of) impact also comes at the cost of a slightly reduced throughputperformance; with the single CTCP achieving approximately 10% less throughput than thatof HSTCP.
However, on the Internet path to Ireland, it can be seen that CTCP has slightly higher
22
0
50
100
150
200
250
300
0 500 1000 1500 2000 2500T
hrou
ghpu
t (m
bit/s
ec)
Duration (seconds)
CTCP Friendliness from SLAC to Ireland
CTCPStandardTCPStandardTCPStandardTCPStandardTCPStandardTCPStandardTCPStandardTCP
0 50
100 150 200 250 300 350 400
0 500 1000 1500 2000 2500
Thr
ough
put (
mbi
t/sec
)
Duration (seconds)
HSTCP Friendliness from SLAC to Ireland
HSTCPStandardTCPStandardTCPStandardTCPStandardTCPStandardTCPStandardTCPStandardTCP
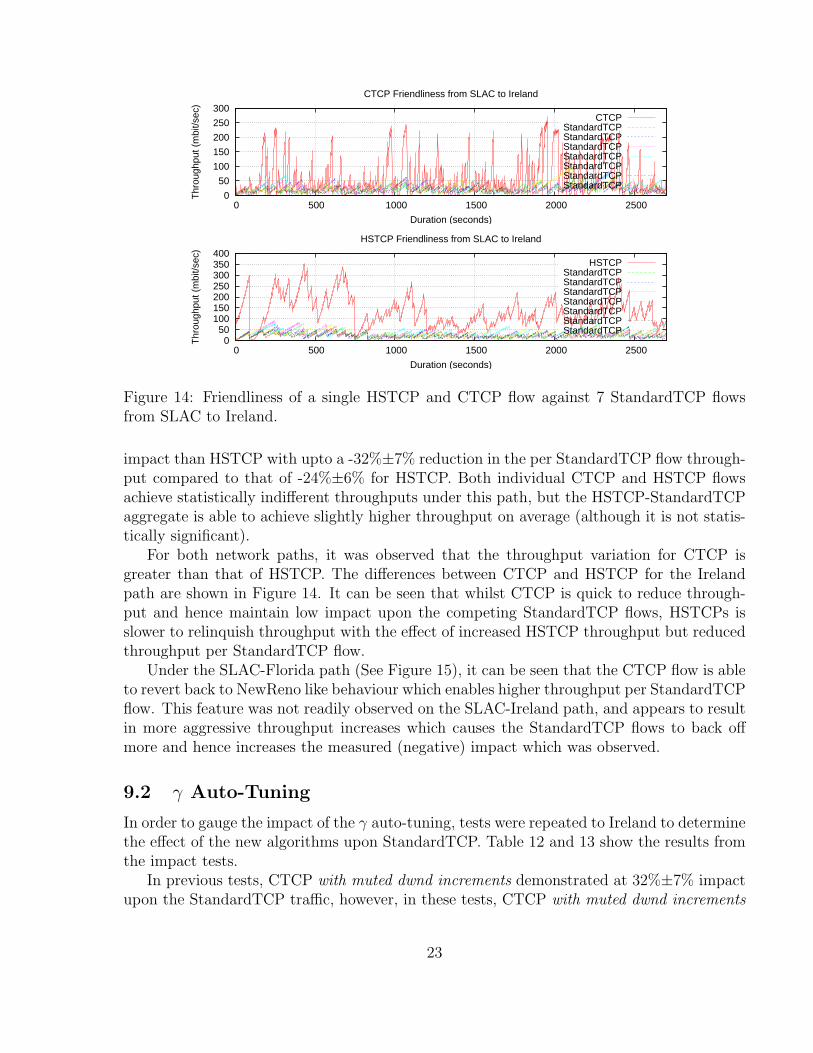
Figure 14: Friendliness of a single HSTCP and CTCP flow against 7 StandardTCP flowsfrom SLAC to Ireland.
impact than HSTCP with upto a -32%±7% reduction in the per StandardTCP flow through-put compared to that of -24%±6% for HSTCP. Both individual CTCP and HSTCP flowsachieve statistically indifferent throughputs under this path, but the HSTCP-StandardTCPaggregate is able to achieve slightly higher throughput on average (although it is not statis-tically significant).
For both network paths, it was observed that the throughput variation for CTCP isgreater than that of HSTCP. The differences between CTCP and HSTCP for the Irelandpath are shown in Figure 14. It can be seen that whilst CTCP is quick to reduce through-put and hence maintain low impact upon the competing StandardTCP flows, HSTCPs isslower to relinquish throughput with the effect of increased HSTCP throughput but reducedthroughput per StandardTCP flow.
Under the SLAC-Florida path (See Figure 15), it can be seen that the CTCP flow is ableto revert back to NewReno like behaviour which enables higher throughput per StandardTCPflow. This feature was not readily observed on the SLAC-Ireland path, and appears to resultin more aggressive throughput increases which causes the StandardTCP flows to back offmore and hence increases the measured (negative) impact which was observed.
9.2 γ Auto-Tuning
In order to gauge the impact of the γ auto-tuning, tests were repeated to Ireland to determinethe effect of the new algorithms upon StandardTCP. Table 12 and 13 show the results fromthe impact tests.
In previous tests, CTCP with muted dwnd increments demonstrated at 32%±7% impactupon the StandardTCP traffic, however, in these tests, CTCP with muted dwnd increments
23
0
50
100
150
200
250
300
0 500 1000 1500 2000 2500
Thr
ough
put (
mbi
t/sec
)
Duration (seconds)
CTCP Friendliness from SLAC to Florida
CTCPStandardTCPStandardTCPStandardTCPStandardTCPStandardTCPStandardTCPStandardTCP
0 50
100 150 200 250 300 350 400
0 500 1000 1500 2000 2500
Thr
ough
put (
mbi
t/sec
)
Duration (seconds)
HSTCP Friendliness from SLAC to Ireland
HSTCPStandardTCPStandardTCPStandardTCPStandardTCPStandardTCPStandardTCPStandardTCP
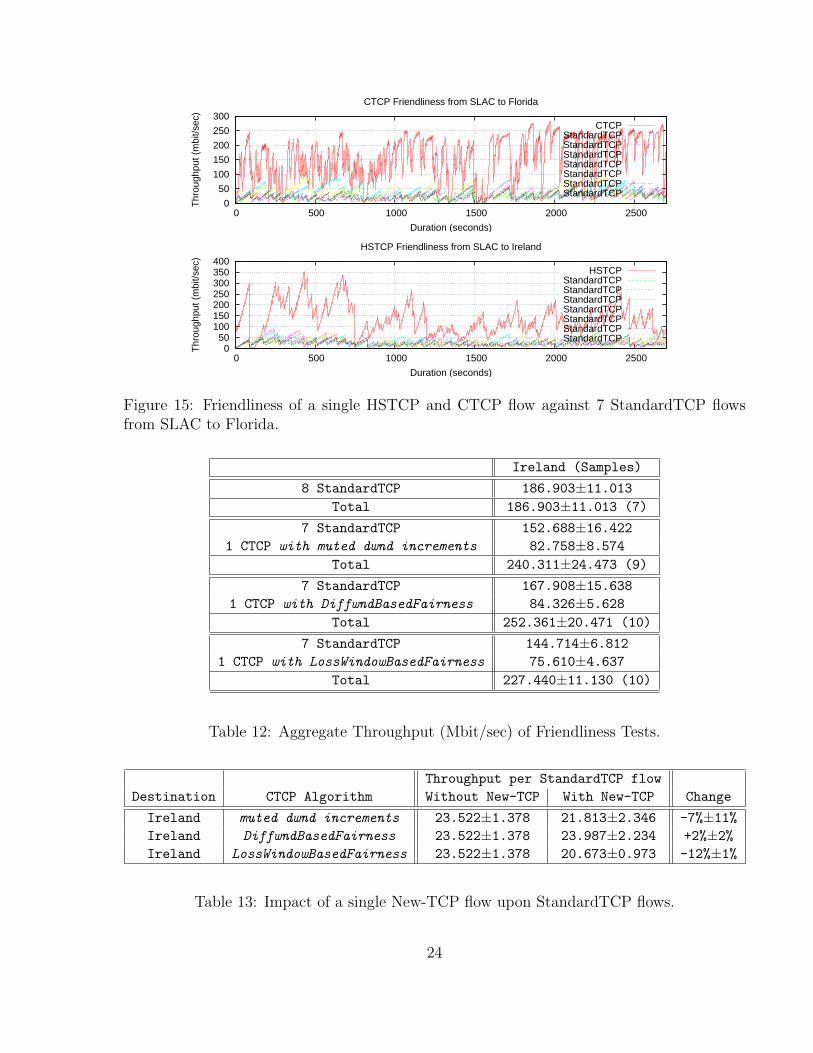
Figure 15: Friendliness of a single HSTCP and CTCP flow against 7 StandardTCP flowsfrom SLAC to Florida.
Ireland (Samples)
8 StandardTCP 186.903±11.013Total 186.903±11.013 (7)
7 StandardTCP 152.688±16.4221 CTCP with muted dwnd increments 82.758±8.574
Total 240.311±24.473 (9)
7 StandardTCP 167.908±15.6381 CTCP with DiffwndBasedFairness 84.326±5.628
Total 252.361±20.471 (10)
7 StandardTCP 144.714±6.8121 CTCP with LossWindowBasedFairness 75.610±4.637
Total 227.440±11.130 (10)
Table 12: Aggregate Throughput (Mbit/sec) of Friendliness Tests.
Throughput per StandardTCP flowDestination CTCP Algorithm Without New-TCP With New-TCP Change
Ireland muted dwnd increments 23.522±1.378 21.813±2.346 -7%±11%Ireland DiffwndBasedFairness 23.522±1.378 23.987±2.234 +2%±2%Ireland LossWindowBasedFairness 23.522±1.378 20.673±0.973 -12%±1%
Table 13: Impact of a single New-TCP flow upon StandardTCP flows.
24
only shows approximately 7%±11%. The impact of CTCP with muted dwnd increments inthese tests demonstrate the varying nature of the network and the importance of having alarge number of samples.
There appears to be no statistically significant difference between the throughputs achievedbetween the different versions, however CTCP with LossWindowBasedFairness does show aslightly lower throughput of 76±5 Mbit/sec compared to CTCP with DiffwndBasedFair-ness’s 85±6 Mbit/sec. What is perhaps more noticeable is the impact upon the per-flowStandardTCP throughput - with CTCP with LossWindowBasedFairness actually having alarger impact upon the StandardTCP traffic even thought it does not appear to offer asignificant increase in the throughput of the CTCP flow.
Generaly, CTCP with DiffwndBasedFairness appears to be the best performing CTCPvariant in these tests with negliable impact upon the StandardTCP traffic.
10 Discussion
The main concern is that all TCP tests exhibit performance problems related to the multipleconsecutive drops. As such, the results are not in fact indicative of the performance of theTCP congestion control algorithm, but the TCP stack as a whole. Further investigation intothe root cause of these drops is required to fully understand the consequence of deployingthese new TCP algorithms; for example, is the cause of these drops due to aggressive re-transmission strategies that are magnified by the more aggressive growth rates of cwnd? orare they TCP stack implementation issues such as SACK processing?
The result of such problems is that whilst it appears as though CTCP performs wellcompared to the other TCP algorithms, in fact, it is not CTCP that is under investigation,but the ability for CTCP to quickly regain bandwidth after these episodes of cwnd/ssthreshreduction.
However, when analysed as a stack, rather than pure congestion control changes, CTCPappears to perform similarly to HSTCP in terms of throughput. The only exceptions arethat when there is reverse traffic; however, a severe reduction of throughput is also apparenton the other stacks and further investigation is required.
In terms of fairness, as defined by σf and ξf , CTCP seems to perform somewhere be-tween HSTCP and StandardTCP. On the Ireland link, where there appears to be insufficientbuffering to enable CTCP to work efficiently, the fairness is actually worse than that ofStandardTCP, and only comparable to that of HSTCP. On better provisioned (in terms ofbuffering) links such as the Caltech and Florida, the fairness is comparable, and sometimeseven better than that of StandardTCP. Under network environments where there are smallnumber of network buffers, it was found that the CTCP algorithm is unable to stabilise aseffectively due to the relatively large value of γ used in the tests.
Therefore, two CTCP with burst control were tested that implement mechanisms toreduce the rate of cwnd increase when diffWnd is measured to be between γlow and γ.Both versions gave better performance than that of the the original algirothm and weredemonstrated to work effectively on the buffer restricted SLAC-Ireland Internet path withboth new versions demonstrating similar throughput and fairness characteristics. However,
25
upon inspection of the throughput traces, CTCP with muted dwnd increments appears tobehave more closely to the expected CTCP dynamic, and suffers from fewer induced lossesdue to the successful reversion to the NewReno cwnd dynamic before congestion loss.
A concern with using delay sensitive congestion control protocols is their scaling prop-erty; how will it perform when there are hundreds or even thousands of flows? As demon-strated with CTCP with muted dwnd increments and the original CTCP algorithm underwell buffered paths, the design of CTCP is such that it should fall back into StandardTCP’sNewReno congestion control algorithm. However, CTCP often starts in a binominal increaseof throughput such that it is able to utilise the seemingly available bandwidth. This rel-atively aggressive increase may have repercussions upon global synchronisation of Internettraffic and hence a general reduction in performance for all network users. Preliminary stud-ies with the impact/friendliness show that under Internet paths with small buffers, CTCPdoes indeed demonstrate reduced fairness towards Internet traffic.
In an attempt to reduce this effect and to enable CTCP to function better on such paths,two versions of CTCP with γ auto-tuning were investigated to determine the effects of bothintra and inter protocol fairness. Whilst there appeared to be no significant difference inperformance when only CTCP flows were competing, CTCP with DiffwndBasedFairnessdemonstrated very little impact upon the throughput of competing StandardTCP traffic.
However, further investigation is warranted to fully understand this effect, with the possi-ble tuning of the γlow and γ parameters to better suit CTCP for more network environments.
11 Future Work
• Stability analysis: Given the delayed based adaptation of CTCP’s congestion con-trol to affect its’ throughput, under different scenario’s, CTCP may lead to better orworse variation of throughput through time. Whilst the presence of multiple consec-utive drops in throughput is prevalent, a study of this property, commonly known assmoothness, of the CTCP algorithm may prove interesting.
• Effect of different network conditions: Related to γ settings, it may be useful to identifymore sites around the world that will provide a broader depiction of the performanceof CTCP. This should include tests at higher speeds (e.g. 10Gbit/sec - interesting dueto the potential limitation of queue sizes across such scenario’s), and also the effectsof different latencies of competing flows.
• Multiple Consecutive Drops: Further investigation into this problem should be con-ducted to ensure that there are no issues with the TCP stack implementation and theeffect is actually real and expected.
• Convergence Times: due primarily to the (lack of) resolution in the iperf logs, it wasnot possible to determine accurately the convergence times of the flows.
In previous studies [4], we defined the convergence time at the time required for thethroughputs between two flows to converge to some arbitrary ratio. This was particu-larly useful to determine the transient properties of interacting traffic.
26

• Effect of Reverse Traffic: Tests from SLAC to Florida and Caltech show reducedperformance of a single TCP flow in the presence of reverse traffic compared to thatwithout. Some further investigation into the cause of this is required.
• Impact on existing traffic: whilst the study of induced traffic to determine the effectof CTCP is warranted, it may be possible to gather queue dropping statistics fromcertain backbone providers such as ESnet and Internet2. The advantage of this is thatit will be possible to analyse the real effect upon existing Internet users of deployingnew TCP algorithms.
• Mice versus Elephant Traffic: whilst this investigation is limited to long lived flows, itwould be expected that much of the traffic will be relatively short lived. Some inves-tigation into this dynamic should be performed to determine whether the aggressiveincrease of CTCP will affect network stability.
12 Summary
This work serves as an initial field study of the performance of CTCP on the Internet. Dueto the adaptation of only the congestion control algorithms for CTCP’s implementation,there is expected to be no compatibility problems associated with its deployment.
The concerns of CTCP deployment are such that it does not affect the scalability andstability of the Internet.
This initial field study demonstrated that there are TCP stack issues (rather than con-gestion control issues) that affect the performance of the TCP tests - these were visible withthe occurance of multiple consecutive drops and the unexplained reduction of ssthresh tovery small values with the Windows Vista TCP stack.
In general, CTCP appears to perform somewhere between HSTCP and StandardTCP;its performance appears to be related to the queue provisioning on the network path. Onwell provisioned networks such as to Caltech and Florida, CTCP demonstrates good fairnessin terms of σf and ξf . However, on the Ireland link - which is known to have relatively smallnetwork buffering, tests show that the performance is comparable to HSTCP.
In order to improve the performance of CTCP on buffer restricted Internet paths, two ver-sions of CTCP with burst control were also tested which has a less aggressive response undermore restrictive network environments. Initial trails of these algorithms proved successful inimproving both the throughput and fairness metrics compared to that of the original CTCPalgorithm, and are recommended to be included as part of the standard CTCP deployment.
An preliminary study of the impact of running a single CTCP flow in the presence ofmany StandardTCP flows was also conducted. Under the medium distance Florida path,CTCP performs better than HSTCP in terms of impact at the cost of having slightly reducedthroughput (by about 10%). Under the Internet path to Ireland, there was a small butnoticeable increase in the impact when using CTCP compared to HSTCP (approximately10% greater reduction in per flow StandardTCP throughput).
In order to reduce the impact of the CTCP flows against StandardTCP, two CTCPversions incorporating γ auto-tuning were also investigated that demonstrated insignificant
27
performance differences over CTCP with muted dwnd increments in intra-protocol tests.However, CTCP with DiffwndBasedFairness demonstrated very good results in almost havingzero impact upon competing StandardTCP flows on the limited test environment of theSLAC to Ireland path.
In order to better understand the effects of CTCP deployment, we suggest further teststo be developed to investigate the scaling properties of CTCP, especially under relativelysmall queue sizes, and more thorough tests to understand and judge the impact of CTCPtraffic against other Internet users. In particular, more generic parameters of γlow and γshould be investigated under various network environments to better tune CTCP.
Acknowledgments
We wish to thank Microsoft for their software and engineering support during the investiga-tion.
Neterion were also a great help during our time of need to get our NICs running on ourWindows Longhorn testbed.
We would also thank the people at Caltech, University of Florida and the HamiltonInstitute for their contribution of hardware to make these tests possible.
References
[1] K. Tan, J. Song, Q. Zhang, and M. Sridharan, ”Compound TCP: A Scalable and TCP-Friendly Congestion Control for High-speed Networks,” in PFLDNet, Japan, February2006.
[2] K. Tan, J. Song, Q. Zhang, and M. Sridharan, ”A Compound TCP Approach for High-Speed and Long Distance Networks,” in INFOCOMM, Barcelona, Spain, April 2006.
[3] A. Tirumala, F. Qin, J. Dugan, J. Ferguson, and K. Gibbs. Iperf version 1.7.0.http://dast.nlanr.net/Pro jects/Iperf/, March 2003.
[4] Y.Li, D. Leith, and R. Shorten. Experimental Evaluation of TCP Protocols for High-Speed Networks. Submitted to IEEE/ACM Transactions on Networking, June 2005.
[5] R. King, R. Riedi, and R. G. Baraniuk. Tcp-africa: An adaptive and fair rapid increaserule for scalable tcp. In IEEE Infocom, march 2005.
[6] S. Floyd, HighSpeed TCP for Large Congestion Windows. RFC 3649, Experimental,December 2003.
28