Embed Size (px)
Citation preview

EVALUATION OF RHODE ISLAND’S STARTING RIGHT PROGRAM:
MAY 1996 – APRIL 2001
Ann Dryden Witte, Ph.D. Magaly Queralt, Ph.D.
Wellesley College
August 2002
Wellesley College, Department of Economics And
National Bureau of Economic Research ©Wellesley Child Care Research Partnership

2
Acknowledgments
The work reported in this paper was supported by a grant from the Rhode Island Department of Human Services (DHS) to the Wellesley Child Care Research Partnership and by grant #90YE0032 from the Child Care Bureau, Administration for Children and Families (ACF), U.S. Department of Health and Human Services (DHHS) to the National Bureau of Economic Research through the Wellesley Child Care Research Partnership. The support of DHS and DHHS for this work does not indicate their concurrence with our results, nor are DHS or DHHS in any way responsible for errors that we may have made. This project would not have been possible without the support of many people in Rhode Island. Sherry Campanelli, Randy Rosati, Donalda Carlson, Catherine Walsh and Reeva Murphy provided invaluable guidance. They helped us to document and understand the many policy changes associated with the implementation of FIP and Starting RIght. Sherry Campanelli also provided us with contacts at various Rhode Island agencies in addition to DHS, such as the Department of Transportation, the Department of Education and the Department of Labor and Training (DLT), and with valuable comments and suggestions on earlier drafts of this report. She worked with us to develop a time line of changes taking place during the study period. Randy Rosati worked with us to develop data requests, and he worked with us and with employees of Network Six to extract data from DHS’s administrative databases. He provided numerous interpretations and guides as our work progressed. He also worked with us and with personnel at DLT to obtain quarterly earnings reports from the Unemployment Insurance database. On the policy front, we would like to thank Nancy Tikkanen for helping us to understand the Family Independence Program (FIP) and Dorothy Karolyshyn for helping us understand the nuances of child care policies and other social welfare regulations in Rhode Island. Kim Keating and Louisa Tarullo helped us to obtain Head Start data and to understand the many changes in Head Start that have occurred during welfare reform. Laura Beavers provided us with valuable data from Rhode Island’s Kids Count historical databases. Marie Gariepy provided us with data on public school kindergarten programs.

3
Evaluation of Rhode Island’s Starting RIght Program: May 1996-April 2001
ABSTRACT
We find that the entitlement to child care subsidies and policies associated with the
Starting RIght initiative in Rhode Island significantly increased the likelihood that current and
former welfare recipients would use child care subsidies and significantly increased the
availability of formal child care. In addition, these policy changes increased work among cash-
assistance and non-cash-assistance recipients and encouraged cash recipients to leave welfare
for work. The most powerful impact of the changes in child care policies was on families that
left welfare (former cash recipients) and worked at least 20 hours per week. These policy
changes had less effect on families on cash assistance participating in some activity other than
work. We were not able to assess the impact of RI policy changes on families who were never
on cash assistance. However, the large increase in the number of such families receiving child
care subsidies suggests that the impact may have been substantial.
To discern the impacts of Starting RIght, we constructed a longitudinal database for the
period May 1996 (a year before RI’s welfare reform) to April 2000. This database encompassed
information from many sources, including DHS administrative data for families enrolled in the
child care subsidy program and those currently and formerly enrolled in the cash-assistance
program, information on employment records from the administrative files of the
Unemployment Insurance (UI) program, and, for all townships in RI, information on the
availability of formal child care and education and on the labor market.
Using economic modeling and the multinomial logit estimation technique, we find that
Rhode Island’s changes in child care policies significantly increased the likelihood that working
current and former cash-assistance recipients living in one of the core cities would use child
care subsidies. Policy changes had both a direct effect on the take-up rate for child care
subsidies and an indirect effect through their impact on the availability of care. Considering

4
both direct and indirect effects, we estimate that the child care policy changes associated with
welfare reform and with Starting RIght increased by between 12% and 23% the probability that
a working former recipient family would use child care subsidies and increased by between 11%
and 13% the probability that a working recipient family would use child care subsidies. Our best
estimate is that between 65% and 76% of eligible former recipients and between 67% and
69% of working recipients living in one of the core cities were using child care subsidies by the
second quarter of 2000.
By increasing reimbursement rates and by subsidizing health insurance for family child
care providers and for center employees serving subsidized children, Rhode Island was able to
substantially increase the availability of formal child care, particularly in the core cities where
most low-income families live. The availability of preschool care at centers expanded
throughout the state, increasing particularly rapidly in Central Falls and Pawtucket. The
availability of school-age care expanded rapidly throughout the state, with the highest rate of
expansion occurring in the core cities after Starting RIght. The availability of family child care
expanded moderately in 1997 and in 1998 after subsidized health insurance coverage was
made available to family care providers serving subsidized children, and it expanded at a much
faster pace in 1999 and in 2000 after Starting RIght.
We found substantial evidence that Rhode Island’s child care policy changes served as
an important support that allowed low-income families to find employment and to leave the
cash-assistance program. Specifically, our best estimate is that RI’s child care policy changes
increased by 5% the likelihood that a single-parent family would leave welfare and work 20 or
more hours per week and increased by 2% the likelihood that a family participating in the cash
assistance program would work 20 or more hours per week.
Key Words: Welfare Reform, Child Care, Take-Up Rate, Cash Assistance, Employment,
and Single Parents; JEL Classification: I38, H40, J22, I20

5
Evaluation of Rhode Island’s Starting RIght Program:
May 1996-April 2001
As part of its welfare reform, Rhode Island made a number of changes in child care
policies designed to support working families and families leaving the cash assistance program.
These policy changes began in January 1997 when Rhode Island made health care coverage
available to family child care providers who were serving children receiving state child care
subsidies. The policy changes culminated in Rhode Island’s Starting RIght Early Care and
Education Initiative, which was enacted on June 28, 1998. Major policy changes associated with
Starting RIght included increasing the maximum income and age eligibility for subsidized child
care, increasing the rates paid to providers caring for subsidized children, providing health care
subsidies to the employees of licensed child care centers, and eliminating child care subsidy co-
payments for all families with incomes below poverty.1 These policy changes were designed to
support low-income families and to ensure that all children were given an opportunity to benefit
from quality early care and education and before-school and after-school services.
Today Rhode Island’s child care subsidy program is considered to be one of the highest
quality and most innovative programs in the country. The August 1999 issue of Working Mother
magazine named Rhode Island one of the “10 Best States” for child care. Under Rhode Island’s
child care subsidy program, all eligible families are guaranteed a voucher to be used to
purchase care that meets minimum standards set by the State.
To ensure that families with vouchers can find quality child care, Rhode Island has
increased the rates it pays for subsidized care. As an additional incentive, the state provides
health insurance subsidies to providers caring for subsidized children. To be more specific,
between January 1998 and January 2000, Rhode Island almost doubled the rates it pays to
1 In October 2000, Rhode Island reinstated a nominal ($1 per week) co-payment for families with incomes above the poverty level. This change was necessary to comply with federal regulations.

6
formal child care providers for subsidized care. The state has provided health insurance
subsidies for family child care providers caring for subsidized children since January 1997 and to
center employees caring for subsidized children since January 1999.
Evaluating the impact of Rhode Island’s child care policy changes requires considerable
care because of the multiplicity of other changes that occurred during the period over which the
child care policy changes were implemented. During the implementation period, Rhode Island,
like many other parts of the country, experienced rapid growth in overall employment.
Beginning in May 1997, the state also reformed its cash assistance program. In order to
estimate the effects of the child care policy changes on cash assistance receipt, on employment,
on the availability of formal child care and on the use of child care subsidies, it is necessary to
separate the impacts of employment growth and of the reform of the cash assistance program
from the effects of the child care policy changes.
Building upon ongoing work in Rhode Island, Massachusetts and Florida (Witte, Queralt
& Tauchen, 2001; Queralt, Witte, and Griesinger, 2000; Lemke, Witt & Witte, 2001) and
controlling for employment growth, family characteristics and community characteristics, we use
econometric modeling to evaluate the impact of the child care policy changes instituted in
Rhode Island on (1) the probability that an eligible family will use child care subsidies; (2) the
availability of formal child care and the impact of changes in availability on the likelihood that an
eligible family will use child care subsidies; (3) the likelihood that a single-parent family will
leave the cash assistance program; and (4) the probability that a low-income single-parent
family will work more than 20 hours per week.
In the various sections of this paper we describe: (1) the Rhode Island child care
subsidy program during the period spanning May 1996 to April 2001 and the major policy
changes associated with the Starting RIght Early Care and Education program; (2) the data that
we use to evaluate the impact of these policy changes; (3) the model that structures our work

7
on the take-up rate for child care subsidies; (4) our empirical model; (5) the techniques we use
to estimate our model, (6) our results; and (7) our conclusions.
The Policy Context
In this section we discuss the changes in policies, programs, and practices implemented
to improve the accessibility, availability and quality of child care for low-income families. Most
changes occurred as a result of Starting RIght, but some took place before the passage of this
major initiative.
The Child Care Subsidy Program Prior to Welfare Reform
Prior to welfare reform, which in Rhode Island (RI) began in May 1997, the child care
program was highly fragmented. Cash assistance recipients were entitled to child care subsidies
if they were working or participating in the JOBS program, and they were not required to make
co-payments to help pay for the cost of providing care for their children. Under the Transitional
Child Care program (TCC), working former cash recipients were also entitled to child care
subsidies for one year after leaving cash assistance, but they were required to make payments
to cover part of the cost of their children’s child care subsidies. After the transitional year, former
cash assistance families could receive child care subsidies if funds were available under the
Child Care & Development Block Grant (CCDBG). CCDBG subsidies also required parental co-
payments.2 Other families with incomes below 185% of the Federal Poverty Level (FPL) were
also eligible for child care subsidies under CCDBG, but they only received subsidies if funds
were available.
Policy Changes Implemented Before 1999 and in January 1999
Even before Starting RIght, RI implemented policies to improve the availability,
accessibility and quality of child care for all low-income families. In January 1997, RI became
the first state to offer health insurance subsidies to family child care providers and their

8
children. Under this program, providers became eligible for six months of health insurance
under RI’s RIte Care program if they had received payments of $1800 or more from the child
care subsidy program during the previous six months.
In May 1997, as part of its reform of the cash assistance program, RI made child care
subsidies an entitlement for all families with incomes below 185% of the Federal Poverty Level
(FPL). This major reform guaranteed that all eligible low-income families would have child care
subsidies available, regardless of whether or not they were receiving cash assistance. The
change was innovative for two reasons. First, it guaranteed child care subsidies in spite of the
fact that the federal government and the vast majority of states provided no such guarantee.
(Under federal regulations and under most states’ rules, child care subsidies are available only
to the extent that funds are available.) Second, it placed low-income families that do not
receive cash assistance on an equal footing with those who receive cash grants from the state.
In contrast, most states (including New England states such as Massachusetts) give priority for
receiving child care subsidies to current and former cash recipients. In such states, low-income
families that have not received cash assistance often are placed on waiting lists for child care
subsidies.
In January 1998, the State increased the rates it paid to formal child care providers
(called reimbursement rates) under the child care subsidy program for the first time since
August 1994. The increase in reimbursement rates for full-time child care ranged from 12% (for
infant and toddler care in family care homes) to 22% (for pre-school care in family care
homes).
With the passage of Starting RIght, the pace of reform accelerated. In January 1999,
the state increased the maximum income that families could receive to still qualify for child care
2 Although there was no entitlement to CCDBG child care, RI was able to serve all families that
applied. The State did not have a waiting list during our study period.

9
subsidies from 185% to 200% of the FPL and increased from 12 to 14 years the maximum age
that a child could be to qualify for child care subsidies. The state also continued its efforts to
place all low-income families on an equal footing by eliminating co-payments for all families
with incomes below the FPL.3
In January 1999, the state also expanded the availability of health care insurance for
child care providers and once again increased reimbursement rates. To be more specific,
providers working at child care centers serving more than 50% subsidized children (i.e., centers
where subsidized children made up at least 50% of the center’s licensed capacity) became
eligible for a 50% subsidy for health insurance coverage. At the same time, reimbursement
rates for formal child care providers were increased between 4% (for before-school care) and
14% (for care of a preschooler in family care homes).
Policy Changes Implemented After January 1999
A second wave of child care policy changes occurred in July 1999. At that time, the
maximum allowable family income to qualify for the child care subsidy entitlement was raised
from 200% to 225% of FPL and the maximum age for a child to receive a child care subsidy
was increased to 15. Eligibility for the 50% health insurance subsidy was expanded by re-
defining eligibility based on the proportion of the provider’s enrollment (rather than of the
licensed capacity) comprised of subsidized children. Reimbursement rates for formal care were
also increased in July 1999, with increases ranging from 7% (for infant and toddler care in
family care homes) to 13% (for preschool care in family care homes).
Reimbursement rates were increased by a large amount once again in January 2000.
These large increases came about as a result of a 1998 survey of the prices of child care
3 Prior to this reform, low-income families receiving cash assistance (by definition those with
incomes below the maximum cash assistance grant) made no co-payments when receiving child care subsidies, while families with incomes below the maximum cash assistance grant but not receiving cash assistance were required to make co-payments. As noted earlier, in October 2000 Rhode Island

10
(known as a market rate survey) that showed that reimbursement rates were substantially
below market prices. As a result, January 2000 rates were set at the 75th percentile of market
prices found in the 1998 market rate survey. This resulted in increases ranging from 19% (for
the care of infant and toddlers in family care homes) to 78% (for the before-school care of
school-age children in child care centers). To give an example of the rates paid after the
January 2000 increases, licensed centers were paid $160 per week for infant/toddler care and
$140 per week for preschool care; certified family child care homes were paid $125 per week
for full-time care of infants, toddlers, and preschoolers; licensed before-school facilities were
paid $50 per week and licensed after-school facilities were paid $67 per week. After the end of
the study period, in January 2002, rates were raised to reflect the results of the 2000 market
rate survey.4
The Setting – State Of Rhode Island
Rhode Island is the smallest of the New England states and has a population of
1,048,319, according to the year 2000 Census (U.S. Bureau of the Census, 2002). The state
occupies a small land area--1,045 square miles--and has a density of 1,003 persons per square
mile. Compared to the U.S. as a whole, which has a population density of 80 persons per
square mile, RI is very densely populated. Cities with the largest concentration of population in
RI include Providence (16.6%), Warwick (8.2%), Cranston (7.6%), Pawtucket (7%), East
Providence (4.6%), and Woonsocket (4.1%). Cities with the largest proportion of FIP recipients
include Providence, Pawtucket, Woonsocket, Central Falls, and Newport. These last cities have
been designated as core cities. We consider possible differential impacts of Starting RIght
across them.
established a nominal co-payment ($1 per week) for all families with incomes above the poverty level, regardless of their cash assistance status. This change was necessary to comply with federal regulations.
4 It is RI state law that reimbursement rates have to be raised to reflect the results of the biennial market rate surveys.

11
According to the year 2000 Census, the RI population is 82% non-Hispanic/non-Latino
white, 8.7% of Hispanic/Latino origin (of any race), 4.5% black or African American, and 2.3%
Asian. American Indians, Alaska natives, native Hawaiians, and Pacific Islanders comprise less
than 1% of the population (U.S. Bureau of the Census, 2002). In contrast, in April 2001,
among those receiving child care subsidies for whom there is racial or ethnic background
information in the DHS administrative files (that is, for approximately 84% of child care subsidy
recipients), 52% were white, 32% were Hispanic, 17% were black, and 1% were Asian or
Pacific Islanders. Clearly, compared to the state population, there are disproportionate
numbers of Hispanics and blacks receiving child care subsidies in RI.
According to the year 2000 Census, the 1999 poverty rate in RI for individuals of all
ages was 11.9%, somewhat under the 12.7% poverty rate for the US population. For children,
the poverty rate in RI in 1997 was 16.5%, compared to 16.9% poverty rate for children in the
U.S. population. However, poverty is highly concentrated in the core cities in RI, particularly in
Providence, Central Falls, Woonsocket, and Newport. Census 2000 data on poverty at the city
level have not yet been released. The 1990 census revealed a poverty rate (among children
under age 18) of 35% in Providence, 33% in Central Falls, 22% in Woonsocket, 21% in
Newport, and 15.5% in Pawtucket (U.S. Bureau of the Census, 1995).
Median household income in 1999 in RI was $42,090, compared to $40,816 for the U.S.
as a whole. In 2000, 78% of the population 25 years of age and over in RI were high school
graduates and 25.6% were college graduates (U.S. Bureau of the Census, 2002). In contrast,
in April 2001, only 52% of the heads of household in families receiving child care subsidies had
a high school education and only 23% had some education beyond high school.

12
The Data
To assess the impacts of Starting RIght on the accessibility and availability of child care
and on the employment of current and former cash recipients in RI, we combine a number of
databases.
To describe the child care subsidy program, we use DHS administrative data for all child
care subsidy recipients for the period May 1996 through April 2001.
To analyze the impacts of Starting RIght, we construct a longitudinal database for the
period May 1996 (a year before RI’s welfare reform) to April 2000. The longitudinal database
contains: (1) DHS administrative data for the child care subsidy program, (2) DHS
administrative data for the cash assistance program, (3) employment information from the
administrative records of the Unemployment Insurance (UI) program,5 (4) Program Information
Reports for all Head Start programs in RI, (5) information on Kindergarten programs for all
townships in RI, (6) information on the availability of formal child care in all RI townships and
(7) monthly information on employment growth for all townships.
The analysis database is for all female-headed single-parent households (i.e.,
households with no other responsible adult) receiving cash assistance in RI during our study
period. To match the UI data, which is only available on a quarterly basis, our analysis
database is also quarterly. Single-parent households made up, on average, about 90% of the
total number of households on cash and receiving child care subsidies between May 1996 and
April 2001.6 Approximately 99% of single-parent households active on cash and receiving child
5 We received no personal identifiers, such as names, street addresses or social security
numbers of program participants. The RI DHS did all data matching, sending the data to us only with person numbers and case numbers as unique identifiers.
6 There is no direct indicator of family type in the child care subsidy files. To estimate the proportion of active AFDC/FIP families that had more than one adult, we relied on the reports about the amount of time spent in AFDC/FIP activities. If there was more than one activity reported, we assumed that there were two adults in the household. Two activities were reported for only 10% of active AFDC/FIP families receiving child care subsidies between May 1996 and April 2001. Note that this probably overestimates the number of two-adult households since some AFDC/FIP recipients participate in more

13
care subsidies had a female head of household. Approximately 97% of single-parent working
families receiving child care subsidies had a female head of household.
Description of the RI Child Care Subsidy Program May 1996-April 20017
Figure 1 depicts the way in which low-income families who are current or former cash-
assistance recipients become eligible for child care subsidies. Since RI’s welfare reform in May
1997, families receiving cash assistance and working less than 20 hours per week are eligible
for child care subsidies if they are participating in Department of Human Services (DHS)
approved activities (the left-hand branch of Figure 1). All income-eligible current and former
cash recipients working 20 or more hours per week (the right-hand branch of Figure 1) are
eligible for child care subsidies.8
In addition to providing child care subsidies to current and former cash recipients, RI
(like most other states) also has a low-income child care program that provides child care
subsidies to families with incomes below a state-set maximum (185% of FPL to 225% of the
FPL during our study period). Unlike most states, RI has provided an entitlement to child care
subsidies for income-eligible families working at least 20 hours per week (right branch of Figure
1) since May 1997.
Figure 2 shows substantial growth in the number of families receiving child care
subsidies. Between May 1996 and April 2001, the total number of families receiving child care
subsidies more than doubled, going from just under 4,000 families in May 1996 to almost 8,400
families in April 2001. As can be seen in Figure 2, child care subsidies for low-income families
than one activity. For working households, we do have a direct measure of the presence of another working adult. Between May 1996 and April 2001, 12% of working households receiving child care subsidies had two earners.
7 As indicated above, we use data through April 2001 to describe the child care subsidy program, but we use data that runs only through April 2000 for our analytic work. The reason for the use of the shorter study period in the analytic work was that UI earnings records were only available through April 2000 when we carried out the analytic work.
8 Prior to May 1997, RI, like other states, had a federally mandated Transitional Child Care (TCC) program that provided an entitlement to child care for working families transitioning off cash assistance.

14
not currently receiving cash assistance grew most rapidly during this period, going from slightly
less than 1,500 families in May 1996 to almost 5,800 families in April 2001, a four-fold increase.
For this group, the growth in the number of families never on cash who were receiving child
care subsidies was far more rapid than the growth in the number of families formerly on cash
(over a 5-½-fold increase versus a 4-fold increase).9 The proportion of low-income child care
subsidy recipients that never received cash assistance went from 16% of low-income child care
subsidy recipients in May 1996 to 22% of low-income child care subsidy recipients in April 2001.
Between May 1996 and April 2001, the number of families receiving both cash assistance and
child care subsidies grew more slowly, by a little more that 25%.
Figure 2 also shows the phase-out of the Transitional Child Care (TCC) program. Under
its May 1997 welfare reform program and as part of RI’s effort to treat equally all low-income
families, RI abolished and gradually phased out the TCC subsidy program. Subsequently, all
income-eligible families (not just those transitioning off cash assistance) were given an
entitlement to child care subsidies.
Figures 3 and 4 depict the rate of growth in child care subsidies for the five core cities of
RI and for the area outside RI’s core cities (Balance of the State). In the period between May
1996 and April 2001, in all areas, the number of former cash recipients and low-income families
receiving child care subsidies but not receiving cash assistance grew more rapidly than the
number of cash recipients with child care subsidies. Only in Newport the pattern was less clear-
cut between 1996 and mid-1999, but it became distinctly the same as for all the other areas
after the middle of 1999 and until the end of our study in April 2001. It is interesting to note
9 To determine if a family had been on cash between May 1996 and April 2001, we searched all
AFDC/FIP administrative files for the period. Families were declared never on cash if they at no time, between May 1996 and April 2001, appeared in the AFDC/FIP records. A family was declared a “former” recipient if they ever appeared in the May 1996 to April 2001 AFDC/FIP administrative records. Note that a “former” recipient family might have received cash assistance after rather than before they received child care subsidies. Thus, a more accurate label for the “former” recipient group receiving child care subsidies this month might be “low-income families that were formerly or later on cash assistance.”

15
that in Woonsocket there was a rapid increase in the number of low-income child care subsidies
beginning in October 2000, the date that the Rhode Island Public Transit Authority (RIPTA)
began a major Jobs Access program in Woonsocket.
Figure 5 shows the take-up rate for child care subsidies for single-parent current and
former cash assistance recipients for the state as a whole from the second quarter (Q2) of 1996
through Q2 of 2000. Note that these data are for a shorter period than the data described in
previous figures and that the data are quarterly rather than monthly. This change in the study
period and from monthly to quarterly data was necessary because we needed to use UI data to
determine the number of eligible families. We only had UI data through April 2000 and UI data
are only available on a quarterly basis. Note also that the universe of families studied also
narrows for the take-up rate analyses. We are unable to analyze the take-up rate for families
never on cash because we are unable to estimate the number of families income-eligible for
child care subsidies.
Figure 6 and Figure 7 show the take-up rate for child care subsidies for single-parent
current and former cash recipients for the five core cities and for the balance of the state from
Q2 of 1996 through Q2 of 2000. As can be seen in Figure 6, the take-up rate for cash
assistance recipients in Pawtucket increased slightly from 45% in Q2 of 1996 to 48% in Q2 of
2000, while the take-up rate for former cash recipients receiving low-income child care
subsidies increased more rapidly (from 43% in Q2 1996 to 56% in Q2 of 2000). The change in
take-up rates was similar in Providence and in the Balance of the State, although the
differences in rates of increase between cash recipients and former recipients were not as
dramatic.
Figure 7 shows take-up rates for Woonsocket, Central Falls and Newport. The pattern of
change in the take-up rate for Central Falls is not unlike the changes found in Figure 6. The
take-up rate for cash recipients went from 41% in Q2 of 1996 to 44% in Q2 of 2000, while the

16
take-up rate for former cash assistance recipients grew far more rapidly (from 33% in Q2 of
1996 to 44% in Q2 of 2000). The pattern of changes in the take-up rates for Woonsocket and
Newport are quite different than the pattern for other areas of the state. In Woonsocket, the
take-up rate for child care subsidies among cash recipients declined (from 42% in Q2 of 1996
to 38% in Q2 of 2000), while the take-up rate for former cash recipients grew very rapidly
(from 23% in Q2 of 1996 to 51% in Q2 of 2000). In Newport, the take-up rate for child care
subsidies for cash recipients grew very rapidly (from 31% in Q2 of 1996 to 57% in Q2 of 2000),
while the take-up rate for former cash recipients grew more slowly (from 41% in Q2 of 1996 to
47% in Q2 of 2000).
A Model of Take-Up for Child Care Subsidies
To model take-up rates, one must have an understanding of the eligibility rules for child
care subsidies and of the decision processes of those who determine whether or not a family is
eligible to receive a subsidy. Figure 8 delineates various “statuses” or states in which one may
find current and former cash recipients.10 We are particularly interested in statuses 1 through
6. However, we model other statuses jointly with these because families can alter their work or
type of activity and cash assistance choices in order to make themselves eligible for child care
subsidies. That is, family choices concerning work or type of activity and whether or not to
apply for cash assistance are made jointly with the choice as to whether or not to apply for
child care subsidies.
Building on Anderson and Meyers (1997) and Heckman, Lalonde and Smith (1999), we
see potential child care subsidy recipients (those is statuses 1 through 6 in Figure 8) as using
child care subsidies if they perceive that the use of subsidies improves or will improve their
10 To simplify Figure 8, we do not show two possible transition states. Specifically, due to
transition rules, we find some families with child care subsidies that are working less than 20 hours and that are (1) on cash assistance but in no approved activity or (2) that are not on cash assistance. There

17
well-being (including the well-being of their children) by more than their costs of obtaining and
using subsidies (including transaction costs and stigma), subject to the information available to
and to the initiative of potential applicants. In other words, we see potential subsidy applicants
as choosing to use subsidies if they think that by using subsidies they can maximize the
expected present value of their utility over the expected duration of subsidy receipt. 11
Formally speaking, we see potential child care subsidy applicants as comparing, over the
expected duration of subsidy receipt (denoted d), the utility (denoted U) they expect to receive
without subsidies versus the utility they expect to receive with subsidies. We assume that a
potential child care subsidy recipient’s utility depends upon earned income (E) net of child care
and other costs of working (wc), how many leisure hours the person has (l) and the well-being
of the potential recipient’s children (C). The individual evaluates her or his utility using the
information available, denoted Ik. The expected utility if she does not receive child care
subsidies (denoted by the superscript ns) over the expected duration of the subsidy is
1
( , , ) |d
ns nsi i i i k
iU E wc l C I
=
−∑
Let the expected benefits of receiving a subsidy to cover child care expenses potentially
be of both monetary and non-monetary form. Net monetary benefits,12 denoted b, may
decrease the costs of working. A non-monetary benefit may increase the well-being of the
children; for example, the parent may consider child well-being (C) to be higher under
subsidized child care (sC ) than under unsubsidized child care. The transaction costs/stigma of
subsidy receipt, denoted c, may also be either monetary, denoted cm, or non-monetary,
are a large enough number of families in these two transition states that we include them in our model for family decision-making.
11 The model developed above is a demand-side model. It only provides a meaningful conceptualization for take-up rates in states that provide child care subsidies to all eligible applicant families, such as Rhode Island. See Witte and Queralt (2002) for a discussion of this issue.
12 Net benefit is the decrease in child care costs net of any required payment by the parent.

18
denoted cnm. The expected utility if the parent receives a child care subsidy over the duration of
the subsidy is
,1
( ( ( )), ( ), ) |d
s si i i im i i nm i k
iU E wc b c l c C I
=
− − − −∑
The potential subsidy applicant will take subsidies if
,1 1
( ( ( )), , , ( ), ) | ( , , , , ) |d d
s s ns nsi i i im i i nm i k i i i i k
i iU E wc b c UE A l c C I U E wc UE A l C I
= =
− − − − > −∑ ∑
Note that under this simple model, there are a number of potential reasons why parents
eligible for subsidies do not take them. They may not know about the subsidy program. Or the
family may fail to use subsidies because their expected period of receipt is too short to allow
discounted benefits to overcome the transaction costs or stigma of obtaining the subsidy.13 This
reason for failure to take a child care subsidy may be common. For instance, many activities of
cash recipients eligible for child care subsidies (e.g., Job Club) are of short duration.
Another reason for failure to take child care subsidies may be irregular employment,14 a
common problem experienced by low-income families in RI and elsewhere, which may, in some
cases, make the expected transaction costs of applying for subsidies exceed their benefits.
Additionally, a family may fail to use subsidies because the family has formal care (e.g., Head
Start, kindergarten, public school) or informal care (e.g., care through relatives or neighbors)
available at little or no cost. Or the family may fail to use subsidies because it is unable to find
a care provider that is both acceptable to the family and willing to accept child care subsidies.
In addition to all the reasons discussed above why families may not use the child care
subsidies for which they are eligible, the rates that subsidy programs pay for care, called
reimbursement rates, can substantially affect the child care choices available to subsidy
13 Note that the transaction costs or stigma of receipt act as fixed costs. 14 Witte, Queralt, & Tauchen (2001) find that single parents who are current or former cash
assistance recipients in Rhode Island only worked on average one quarter of every four.

19
recipients and make their options more or less attractive. Reimbursements to child care
providers vary greatly across states and local areas. Federal regulations require that
reimbursement rates be set to provide “equal access” to care for poor children. However, in
some areas of RI during the early part of our study period, rates may have been set too low to
attract a broad spectrum of providers to the child care subsidy program. In other areas of RI
later in our study period rates may have been set high enough to make it possible for most
providers across the quality/price spectrum to be able to offer subsidized care.
While reimbursement rates are a major factor considered by providers in determining
whether or not they will accept the vouchers/certificates of the child care subsidy program,
providers may refuse to accept child care subsidy vouchers for other reasons, such as the
administrative hassle of participating in the program or because they fear that having too many
low-income children may lessen their ability to retain and attract more economically advantaged
children. Administrative delays and other administrative difficulties were more of a problem
early on in our study period than later.
Besides provider reimbursement rates, the age and health status of the children in the
family and the hours and days of work of the parents’ jobs will impact the availability to the
parents of child care facilities willing to accept subsidies.
The level of payment that a parent must make for care when receiving a child care
subsidy (generally referred to as the parental co-payment) is dependent on both family income
and size in RI.15 Under RI’s co-payment system, which, as in many other states, depends
15 Throughout our study period, cash recipients were not required to make a co-payment.
However, prior to January 1999, all low-income families not associated with the cash assistance program and receiving child care subsidies were required to make co-payments. In January 1999, the co-payment for low-income families with incomes below the maximum cash assistance grant (approximately 110% of FPL) was eliminated. However, in October 2000 a nominal co-payment of $1 per week was established for the families with incomes above the FPL and up to 110% of the FPL. This was done to comply with federal regulations.

20
exclusively on family income and size, parents face the same price for all types of care.16 That
is, the highest priced center willing to accept vouchers will cost an eligible parent the same
amount of money as the lowest priced care available in the market. Such a system increases
the relative benefits of choosing the highest-priced subsidized care available, as opposed to a
co-payment system that varies parental payments according to the actual market price of the
particular type of care they choose. This may explain, at least partially, the often-noted
tendency of subsidized parents in the U.S. to disproportionately use center-based care.
Rhode Island’s co-payment system also requires lower co-payments for the second and
subsequent children in subsidized care. This policy makes it more attractive to seek subsidized
child care if the family requires care for more than one child.
Empirical Specification
We model the probability that a current or former cash recipient in our sample will be in
one of the eight statuses represented in Figure 8 (or in one of the two transition statuses
described in footnote 10). This probability depends on the factors identified in the above take-
up model and in our previously developed models for the probability of employment for current
and former welfare recipients (Witte, Queralt & Tauchen 2001). Let the probability that a
current or former cash recipient will be in a given status (denoted j) depend upon all exogenous
factors in the above take-up model and on exogenous factors affecting the probability of
working or using cash assistance. These exogenous factors are denoted x. The probability that
a current or former cash assistance recipient will be in status j is
9
1
exp( )(1) ( / )
1 exp( )
j
hh
xP y j x
x
β
β=
= =+∑
16 In some states, providers are allowed to charge families prices that exceed the state
reimbursement rate for certain types of care. This is not legal in Rhode Island.
21
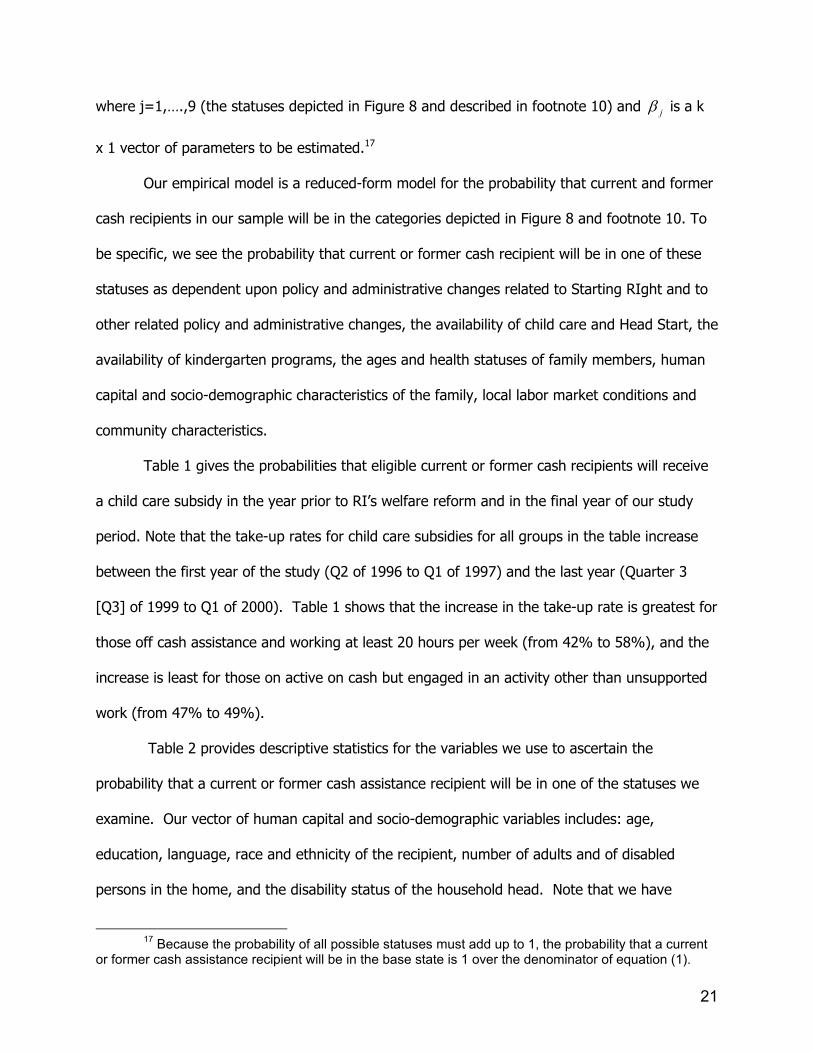
where j=1,….,9 (the statuses depicted in Figure 8 and described in footnote 10) and jβ is a k
x 1 vector of parameters to be estimated.17
Our empirical model is a reduced-form model for the probability that current and former
cash recipients in our sample will be in the categories depicted in Figure 8 and footnote 10. To
be specific, we see the probability that current or former cash recipient will be in one of these
statuses as dependent upon policy and administrative changes related to Starting RIght and to
other related policy and administrative changes, the availability of child care and Head Start, the
availability of kindergarten programs, the ages and health statuses of family members, human
capital and socio-demographic characteristics of the family, local labor market conditions and
community characteristics.
Table 1 gives the probabilities that eligible current or former cash recipients will receive
a child care subsidy in the year prior to RI’s welfare reform and in the final year of our study
period. Note that the take-up rates for child care subsidies for all groups in the table increase
between the first year of the study (Q2 of 1996 to Q1 of 1997) and the last year (Quarter 3
[Q3] of 1999 to Q1 of 2000). Table 1 shows that the increase in the take-up rate is greatest for
those off cash assistance and working at least 20 hours per week (from 42% to 58%), and the
increase is least for those on active on cash but engaged in an activity other than unsupported
work (from 47% to 49%).
Table 2 provides descriptive statistics for the variables we use to ascertain the
probability that a current or former cash assistance recipient will be in one of the statuses we
examine. Our vector of human capital and socio-demographic variables includes: age,
education, language, race and ethnicity of the recipient, number of adults and of disabled
persons in the home, and the disability status of the household head. Note that we have
17 Because the probability of all possible statuses must add up to 1, the probability that a current
or former cash assistance recipient will be in the base state is 1 over the denominator of equation (1).

22
included separate variables for the children in the household, such as the number of children
eligible for child care subsidies, the age of the youngest child and the number of children of
middle-school and secondary-school age. We also include the fraction of subsidy-eligible
children that are: (1) infants, (2) toddlers, (3) preschoolers and (4) kindergarten eligible.
Our vector of variables related to the availability/accessibility of child care and early
education includes the number of full-time preschool center slots per 100 children under age 5,
the number of family child care slots per 100 children ages 0-13 and the number of school-age
center slots per 100 school-age children in the township in 1996. Also included in this vector
are the proportion of eligible children enrolled in part-day and full-day kindergarten as well as
the proportion of eligible three- and four-year-olds enrolled in Head Start in the township of
residence in each of the years of our study (for the sake of brevity Table 2 includes the
variables only for 1997).
To control for local labor market conditions, we include the average monthly change in
employment rate, by township, for each quarter of our study. Finally, we control for community
characteristics by including a series of community-specific binaries.
In the analysis we interact the availability of various kinds of early care and education
with the fraction of children in the family that might use the particular type of care or
education. For example, we multiply the proportion of children in kindergarten in the township
times the proportion of children in the family that are eligible for kindergarten.18 We do this
because kindergarten is only of potential use to families with a child who is eligible for
kindergarten. We hold the availability of center and family child care at the 1996 level because
the supply of child care may be jointly determined with the decisions of families to use child
care subsidies. We also hold the families’ residential location, primary language, education and
18 Children are eligible for kindergarten in Rhode Island if they are 5 years old by December 31 of
the academic year in which their parents wish to enroll them in kindergarten.

23
citizenship status at the level when we first observe them. Other socio-demographic variables
are allowed to vary. Similarly, we allow the availability of Head Start and kindergarten to vary
because the availability of these types of care is determined outside the cash assistance and
child care subsidy systems.
Because of the many changes that occurred during our study period, we impose no
structure on the pattern of change over time. Instead we allow each quarter to have its own
coefficient. We interpret the coefficients on the quarterly binaries in light of our knowledge of
the pattern of policy and administrative changes that occurred during the study period.
As is well known, estimation of models using longitudinal data requires use of
appropriate statistical methods.19 In our application, where we observe families over time, we
are concerned with unobservable family-specific attributes that may help to determine family
status and, if omitted, may lead to inconsistent estimates. To account for these family specific
effects, we allow for separate variances for each family.
What Impact Does Starting Right Have On Welfare & Work?
The main impact of welfare reform should be to move families from cash assistance and
inactivity to being active or working and possibly no longer receiving cash. Rhode Island’s
welfare reform, in particular, has significantly increased the probability that members of our
sample would work (Witte, Queralt & Tauchen, 2001).
Given a particular type of activity and cash-assistance status, changes in child care
policies should have some impact on the relative probability that a member of our sample would
be receiving a child care subsidy. To estimate the impacts of the changes in child care policies,
we calculate the change in the probability that a member of the sample would be in a particular
activity/cash-assistance status: (1) when using child care subsidies and (2) when not using a
19 See Chamberlain (1984) or Greene (1997) for more detailed discussions of techniques for
estimating models using longitudinal data.

24
child care subsidy. Our estimate of the impact of changes in child care policy is the difference
between these changes in probability when using and not using a subsidy. This economic
technique is referred to as a “difference in differences” approach.
Figure 9 gives the estimated probabilities that members of our sample will be in statuses
1 through 6 (see Figure 8 for these statuses). As can be seen in Figure 9, we estimate that the
probability that a family will be active (i.e., engaged in an approved activity other than
unsupported work) and receiving cash assistance (with or without a child care subsidy) declined
during the study period, holding constant the effect of all variables listed in Table 2.
Specifically, the probability of being active on cash and not using child care subsidies declined
by 4%, while the probability of being active on cash and using child care subsidies declined by
2%. The difference between these two conditions is 2%, which is our estimate of the impact of
the child care policy changes. In other words, for active cash recipients, changes in child care
policies resulted in a 2% increase in their use of child care subsidies.
Figure 9 also shows that during our study period the probability of being employed
increased substantially for current and former cash recipients in RI. For employed cash
recipients using child care subsidies, the probability of working 20 or more hours per week
increased by 3%, while for employed recipients not using subsidies the probability of working
20 or more hours increased by only 1%. The difference of 2% between these two estimates is
our estimate of the impact of the changes in child care policies on the probability that a cash
recipient would work 20 or more hours per week.
The most dramatic change shown in Figure 9 is the very rapid increase in the probability
that a family would leave cash assistance, work 20 or more hours a week and use a child care
subsidy. The probability of being in this particular status (status 5 in Figure 8) increased by 8%
during our study period. By way of contrast, the probability of leaving cash, working 20 or more
hours per week and not using a subsidy (status 6 in Figure 8) increased by only 3%. The

25
difference between these two changes, 5%, is our estimate of the impact of the changes in
child care policies. That is, we estimate that the changes in child care policy in RI increased by
5% the probability that a member of the sample would leave welfare and work 20 or more
hours a week. In April 2000, this implies that approximately 1500 more families had left welfare
and were working more than 20 hours per week because of the changes in RI’s child care
policy.20 Note that we were not able to assess the impacts of RI’s child care policy changes of
families that have never been on cash. However, the rapid growth in the number of such
families receiving child care subsidies beginning in 1999 (see Figure 2) suggests that a major
impact of RI policy changes may have occurred for this group of families.
What Impact Does Starting Right Have On
The Take-Up Rate for Child Care Subsidies?
In this section we consider the impact that the entitlement to child care, established in
May 1997 as part of RI’s welfare reform, and the provisions of Starting RIght had on the take-
up rate for child care. We do not address in this section those provisions with primary impact
on the availability of child care. In a subsequent section we provide estimates of the impact of
increases in the availability of formal child care associated with Starting RIght on take-up rates
for child care subsidies.
We begin by discussing results for the state as a whole and then we examine results for
the five core cities that contain the bulk of RI’s low-income population.
(1) Statewide Results
Figure 10 illustrates the estimated take-up rate for child care subsidies in RI, controlling
for employment growth, the characteristics of current and former welfare families, community
of residence and the availability of early care and education. The estimated take-up rates in
20 In April 2000 there were 29468 current and former welfare recipients in our database. Five
percent of this is 1473. This is our estimate of the increase in the number of families that left welfare and

26
Figure 10 are for a low-income family in our sample with median characteristics. This family,
residing outside the core cities, has a 30-year-old, white, English-speaking head, two subsidy-
eligible children and no other person in the household between the ages of 18 and 60. The
youngest child in the household is 4 years old and the household has no teenager. The family
lives in a community with an employment growth rate of 2.9% per year. The community has
22 full-time child care center slots per 100 children under age 5, 7 school-age child care slots
per 100 school-age children and 3 family child care slots per 100 children ages 0-13.21
As can be seen in Figure 10, we find large increases in the take-up rate for working
families with median characteristics, both families on cash assistance and former cash
recipients. The increases we observe occur during the time that RI’s welfare reform, the Family
Independence Program (FIP), and Starting RIght were implemented. For example, from Q2 of
1996 to Q2 of 1997 (the quarter when FIP became effective), the take-up rate for child care
subsidies for active cash recipients increased from 42% to 49%, and for recipients working 20
or more hours per week it increased from 38% to 46%. During this same period, the take-up
rate for former cash recipients working 20 or more hours per week declined from 53% to
51%.22
Over the next year, as FIP was implemented, including implementation of the
entitlement for child care subsidies, the take-up rate for working cash recipients continues to
increase (from 46% in Q2 of 1997 to 56% in Q2 of 1998) and the take-up rate for former cash
recipients also increases (from 51% in Q2 of 1997 to 62% in Q2 of 1998). The take-up rate for
active cash recipients declined slightly during the period.
worked more than 20 hours per week as a result of RI’s child care policy changes.
21 As noted earlier, child care availability is for 1996. 22 We compare the same quarters across years because of the strong seasonality in the Rhode
Island economy.

27
During the following year, which includes the effective date (January 1999) of a number
of Starting RIght provisions, the take up rate for child care subsidies increases slightly for
working cash recipients (from 56% in Q2 of 1998 to 60% in Q2 of 1999) and for former cash
recipients (from 62% in Q2 of 1998 to 64% in Q2 of 1999). There was no change in the take-
up rate for active recipients during this year.
Finally, during the last year of the study period, the take-up rate for all groups increased
moderately. This period includes the second phase of the Starting RIght implementation
(effective July 1999), a very large increase in reimbursement rates (effective January 2000) and
the effective date of Rhode Island’s One=One program (January 2000). To be more specific,
from Q2 of 1999 to Q2 of 2000, the take-up rate for active cash recipients increased from 48%
to 51%, for working cash recipients from 60% to 62% and for former cash recipients from 64%
to 69%.
Tables 3 to 5 give the percentage change in the estimated odds that an eligible family
will receive a child care subsidy. The tables report the percentage change in the estimated
odds and the level of significance (p-value) attached to such changes for three types of eligible
families - working former cash recipient, working cash recipient, and active on cash – quarter
by quarter for the period of our study for the state as a whole as well as for each of the core
cities. These estimates control for all other variables listed in Table 2. A positive number in the
columns reporting the percent change in odds indicates an increase in the likelihood that a
family will receive a child care subsidy and a negative number indicates a decrease.
As can be seen in Table 3, during the quarters of our study under the old
AFDC/TCC/CCDBG program, the estimated probability that eligible working former cash
recipients in RI would take child care subsidies was insignificantly different from the probability
that they would not. That is, the probability of being in status 5 (per Figure 8: former cash
recipient working more than 20 hours per week and receiving child care subsidies) was

28
insignificantly different from the probability of being in status 6 (per Figure 8: former cash
recipient working more than 20 hours and not receiving child care subsidies).
Table 3 shows that during the second year of welfare reform in RI, which includes the
first quarter of Starting RIght, the probability that eligible former recipients would be in status 5
(i.e., receiving subsidies), relative to the probability of being in status 6 (i.e., not receiving
subsidies), rose rapidly. On average, during the period extending from Q2 of 1998 to Q2 of
1999, the probability that an eligible former recipient would take subsidies was 50% higher
than the probability that they would not. This difference in probabilities is significant at the
.001 level.
As can be seen in Table 3, for eligible former cash recipients in RI the probability of
taking child care subsidies continued to rise during the first full year of the implementation of
Starting RIght to an average of 62% higher than the probability of not taking subsidies. Finally,
during the last quarter of our study, the probability of taking subsidies for this group was almost
double (93%) the probability of not taking subsidies.
As can be seen in Table 4, under AFDC, working cash recipients in RI were significantly
more likely to be in status 3 (per Figure 8: cash recipients working more than 20 hours per
week and receiving child care subsidies than in status 4 (per Figure 8: cash recipients working
more than 20 hours per week and not receiving child care subsidies) during the spring and
summer. But they were equally likely to take or not to take subsidies in the fall and winter.
Table 4 shows that, for the state as a whole, during the first year of welfare reform
across all quarters, the probability of taking child care subsidies was significantly higher, almost
70% higher, for working cash recipients than the probability of not taking subsidies. For this
group, the probability of taking subsidies, relative to the probability of not doing so, almost
doubled during the second year of welfare reform, to an average of 116%. The relative
probability of taking subsidies jumped again during the first year of implementation of Starting

29
RIght, to an average of 140% higher than the probability of not taking subsidies. This
difference in probabilities was significant at the .001 level.
As can be seen in Table 5, throughout the study period, cash recipients in approved
activities in RI were significantly more likely to take child care subsidies than not to take them,
holding constant all other factors listed in Table 2. That is, they were significantly more likely to
be in status 1 (per Figure 8: cash recipients enrolled in approved activities and receiving child
care subsidies) than in status 2 (per Figure 8: cash recipients enrolled in approved activities and
not receiving child care subsidies).
Table 5 shows that during the quarters under the AFDC program (first year of our study
period), the probability that cash recipients enrolled in approved activities in RI would have a
child care subsidy was approximately 20% higher than the probability of being without a
subsidy. For this group, the probability of having a subsidy (rather than not having one) almost
doubled, to an average of approximately 40%, during the first two years of RI’s welfare reform.
The probability of having a subsidy, rather than not having one, increased only slightly for this
group, to an average of 43%, during the first year that Starting RIght was implemented.
(2) Results for the Core Cities
To examine the impact of Starting RIght and other policy changes on the five core cities,
we estimated the child care subsidy take-up rate for a household with the median
characteristics of current and former cash assistance recipients residing in each of the state’s
core cities. The results are depicted in Figures 11 and 12.
As can be seen in Figures 11 and 12, from Q2 of 1996 to Q2 of 2000, different status
groups in different areas of the state had quite different levels and changes in take-up rates.
On average, Providence had the highest take-up rates for child care subsidies for the three
groups examined (i.e., active on cash, on cash and working 20 or more hours per week, and off
cash and working 20 or more hours per week). Central Falls and Pawtucket had the lowest

30
take-up rates for those who were active on cash. Newport had the lowest take-up rates for
cash recipients working 20 hours or more. On average, Woonsocket had the lowest take-up
rates for those off cash and working 20 hours or more.
As can be seen in Figures 11 and 12, for those who were active and receiving cash
assistance, Newport, Central Falls and Pawtucket show similar patterns of change in the child
care subsidy take-up rate. In these cities, take-up rates increased quite rapidly during the first
year of welfare reform and moderately during the second year of welfare reform and the
beginning of Starting RIght. Then the rate of take-up declined somewhat during the final year
of the study period, when additional aspects of Starting Right were implemented and Rhode
Island’s One=One program was initiated.
Figures 11 and 12 show that the take-up rate for child care subsidies for current and
former cash recipient families working 20 hours or more per week increased across all areas.
The increase was largest for Newport and Providence.
Turning next to the percentage change in the odds of receiving a subsidy (Tables 3 to
5), we find that, controlling for all other factors listed in Table 2, the odds of taking up child
care subsidies increased after welfare reform (RI’s welfare reform made child care subsidies an
entitlement for eligible families) and after Starting RIght. The pattern of change was different
for different groups in different core cities, but the changes occur in ways that appear
reasonable.
First, let us consider working former cash recipients. As can be seen in Table 3, in
Providence and Newport, the odds of taking a child care subsidy only increased significantly
after most aspects of Starting RIght were implemented (beginning in Q3 of 1999). By the end
of the study period, the likelihood that an eligible working former cash recipient would take a
child care subsidy was 65% higher than the likelihood of not taking it in Providence and 80%
higher in Newport. Pawtucket saw an increase in the odds that a working former cash recipient

31
would take a subsidy beginning in the first quarter of 1999, when many Starting RIght
provisions were implemented. However, the increase in the odds of using a child care subsidy
was only significant in Q1 and Q2 of 1999 and in Q2 of 2000. Woonsocket has had significantly
higher odds that a former cash recipient would take a child care subsidy since Q2 of 1997 when
child care subsidies became an entitlement. Central Falls had increases in the odds that working
former cash recipients would take subsidies beginning in Q3 of 1997, but the increases were
not statistically significant.
Next, consider cash recipients who are eligible for child care subsidies because they
are working 20 or more hours per week. As can be seen in Table 4, the clearest evidence that
Starting RIght increases the odds that a family would use child care subsidies is for Newport.
Beginning in Q1 of 1999, the odds that an eligible working family participating in the cash
program and living in Newport would take a child care subsidy increased dramatically and
significantly. By the end of our study period (Q2 of 2000), the odds that such a Newport family
would take a child care subsidy were 4 to 1, up from 1.6 to 1 in Q3 of 1999.
As can be seen in Table 4, there are discernible, although not as dramatic, increases in
the odds of taking child care subsidies for working cash families living in Providence, Pawtucket
and Central Falls during the last year of the study. Q1 of 1999 is an anomaly for these families
and the group of active cash families. We suspect that this anomaly is related to a sustained
effort, beginning in the fourth quarter (Q4) of 1998, that RI DHS staff made to provide self-
sufficiency plans (called FIP plans) to long-term cash assistance recipients.
Finally, consider the change in the odds of taking a child care subsidy for cash
assistance recipients who were eligible for subsidies because they were in a DHS approved
activity. As can be seen in Table 5, the odds that an active cash family living in Providence
would receive a child care subsidy increased significantly beginning in Q2 of 1998. This increase
seems most likely to be the result of welfare reform. For Newport, we observe a seasonal

32
pattern, but no consistent secular trend. In Newport, the odds that active cash recipients will
take a child care subsidy increase dramatically and significantly in Q2 of every year. For active
cash recipients, the odds of taking a child care subsidy have no consistently significant pattern
for the other core cities.
Overall, the data indicate that the entitlement to child care subsidies and Starting RIght
had their most dramatic impact on the use of child care subsidies for working former cash
recipients in RI (see Figure 10). Our best estimate is that the entitlement to child care resulted
in an increase in the take-up rate for child care subsidies from 51% in Q2 of 1997 to 62% in Q4
of 1998. As Starting RIght was implemented, the take-up rate continued to increase, and we
estimate that the Starting RIght policies that began to be implemented in January 1999 resulted
in an increase in take up for former cash recipients from 62% in Q4 of 1998 to 69% in Q2 of
2000. Overall, the increase in the take-up rate for working former cash recipients was both
impressive and significant.
Starting RIght also appears to have significantly increased the odds that eligible working
cash recipients would use a child care subsidy. Beginning in the second quarter of 1999, the
odds that an eligible, working cash recipient would use a child care subsidy began to increase
steadily and significantly. In Q1 of 1999, the probability that eligible working cash recipients
would use child care subsidies was about double the probability that they would not (controlling
for all variables listed in Table 2). By the last quarter of the study period (Q2 of 2000), the
probability of taking a subsidy in RI was 2 ½ times the probability of not doing so.
Results For The Availability Of Child Care
We begin by describing changes in the availability of child care in RI. Then we estimate
the impact of the increased availability of care on the take-up rate for child care subsidies.

33
Changes in the Availability of Child Care
Figure 13 summarizes changes in the availability of preschool center care in RI, the five
core cites and the remainder of the state from December 1996 through December 2000. As can
be seen in this figure, the availability of preschool center care in RI began to expand in 1997 as
RI’s welfare reform got underway, and it increased even more rapidly with the implementation
of Starting RIght. In December 1996, there were 16 center slots per 100 children ages 5 and
under in RI. By December 2000, there were 19 center slots per 100 children ages 5 and under,
an increase of 25%. The expansion in the availability of center slots for preschoolers was
slightly more rapid in areas outside the core cities (27% increase) than in the core cities (22%
increase).
As can be seen in Figure 14, the availability of center care for preschoolers increased
quite rapidly in core cities that had lower availability in 1996. Availability expanded more slowly
in core cities with higher availability in 1996. For example, the number of center slots per 100
preschool children increased by 68% in Pawtucket (from 8 slots per 100 children in December
1996 to 14 slots per 100 children in December 2000) and by 62% in Central Falls (from 5 slots
per 100 children in December 1996 to 9 slots per 100 children in December 2000). By way of
contrast, the rate of growth of preschool center care was less than 10% in Newport (from 15
slots per 100 children in December 1996 to 16 slots per 100 children in December 2000) and in
Providence (from 19 slots per 100 children in December 1996 to 20 slots per 100 children in
December 2000).23
Figure 15 shows the rate of growth in the availability of care for school-age children in
RI, the core cities and the remainder of the state. As can be seen in this figure, the availability
23 One reason for the slow growth of center slots in Newport and Providence was the rapid
expansion of Head Start in both of these cities. For example, in Newport, the number of full-day, full-year Early Head Start slots for children less than three years of age increased from 12 to 155 during the study period.

34
of school-age care in RI expanded far more rapidly than the availability of center care for
preschoolers. For the state as a whole, the availability of school-age care increased from 7 slots
per 100 school-age children in December 1996 to 12 slots per 100 school-age children in
December 2000, an increase of 83%. The rate of increase in the availability of care for school-
age children was more rapid in the core cities (an increase of 116%, from 7 slots per 100
children in December 1996 to 16 slots per 100 children in December 2000) than in the rest of
the state (an increase of 64%, from 6 slots per 100 children in December 1996 to 10 slots per
100 children in December 2000). The near doubling of the availability of school-age care in RI
occurred between December 1998 and December 1999 when the age-eligibility for child care
was expanded from 12 to 15. This expansion seems clearly linked to Starting RIght.
Figure 16 focuses on the changes in the availability of school-age care for each of the
five core cities. As can be seen in this figure, the increase in the availability of school-age care
was particularly rapid in Newport (an increase of over 600%, from 2 slots per 100 children in
December 1996 to 16 slots per 100 children in December 2000) and in Providence (an increase
of 132%, from 9 slots per 100 children in December 1996 to 21 slots per 100 children in
December 2000). The increase was slow in Woonsocket (an increase of 13%, from 6 slots per
100 children in December 1996 to 7 slots per 100 children in December 2000).
Figure 17 shows changes in the availability of family child care for RI, the core cities and
the remainder of the state. As can be seen in this figure, there was a moderate increase in the
availability of family child care after RI’s 1997 welfare reform, with its entitlement to child care
and the provision of health insurance for family care providers accepting children with subsidies.
Family child care increased at a much more rapid pace after Starting RIght. Figure 17 shows
that the availability of family child care expanded more rapidly than the availability of center
care for preschoolers, but it expanded less rapidly than the availability of care for school-age
children. For the state as a whole, the availability of family child care expanded by 41% from

35
December 1996 to December 2000 (from 2.3 slots per 100 children ages 13 and under to 3.3
slots per 100 children ages 13 and under). Almost all the expansion in family child care during
this period occurred in the core cities (an increase of 125%, from 2.2 slots per 100 children
ages 13 and under to 5.0 slots per 100 children ages 0-13).
As can be seen in Figure 18, the growth in the availability of family child care was most
rapid in Central Falls (an increase of 190%, from 1.2 slots per 100 children ages 0-13 in
December 1996 to 3.5 slots per 100 children ages 0-13 in December 2000) and in Providence
(an increase of 171%, from 2.6 slots per 100 children ages 0-13 in December 1996 to 7.2 slots
per 100 children ages 0-13 in December 2000). By way of contrast there was virtually no
change in the availability of family child care in Newport.
Estimated Impacts of Changes in Availability on Subsidy Take Up
Our estimates of the impacts of Starting RIght on the take-up rate for child care
subsidies (presented earlier in this paper) were estimates of the effects of those Starting RIght
provisions (e.g., the expansion of income and age eligibilities) that impacted families directly.
Because of the potential endogeneity of the availability of child care,24 we held the availability of
care at the December 1996 level in the models that were estimated. However, many provisions
of Starting RIght had more direct impacts on providers than on families (e.g., substantial
increases in reimbursement rates, provision of health insurance to providers of subsidized care).
The descriptive evidence presented above indicates that these provisions resulted in a
substantial expansion of the availability of child care, particularly in the core cities.
Our models indicate that increased availability of care significantly increases the
likelihood that eligible families will use child care subsidies.25 Using estimates of the impact of
24 The availability of child care is potentially endogenous because it is determined simultaneously
with the employment of low-income single parents and the use of child care subsidies. 25 Our estimates of the impact of availability on take-up are from a multinomial logit model for the
state as a whole. These estimates exploit the cross-sectional variation in the availability of care in 1996.

36
increased availability on take-up derived from our models and from the observed increase in
availability described above, we estimate that for the state of RI as a whole, the increased
availability of preschool care at centers increased the odds that an active cash family would use
child care subsidies by 2.5%, that a working cash family would use child care subsides by 5.7%
and that a working former cash family would use subsidies by 5.4%.26 Because of the much
larger increase in the availability of preschool care at centers in Pawtucket and Central Falls, the
increase in the odds of taking a subsidy was even larger in these areas. Specifically, for active
cash families in Pawtucket, the increase in the likelihood of taking subsidies was 5%, and for
active cash families in Central Falls the increase was 3.3%. For working cash recipients, the
increase in the odds of taking a subsidy was 11.5% in Pawtucket and 7.6% in Central Falls. For
working former recipients, the increase in the odds of taking a subsidy was 10.9% in Pawtucket
and 7.3% in Central Falls.
The much larger increases in the availability of family child care and school-age care
had much greater impacts on the odds that working families would use subsidies, but they had
no significant impact on the odds that an active cash family would use subsidies. To be more
explicit, for the state as a whole, we estimate that the increased availability of school-age care
during 1996-2000 increased by 27% the odds that an eligible working cash recipient with only
school-age children would use a child care subsidy and increased by 34% the odds that a
working former cash recipient with only school-age children would use a child care subsidy.
The impact of the increase in the availability of school-age care on the likelihood of
using a child care subsidy was greater in the core cities (49% increase in the odds that working
The coefficients on all availability variables (see Table 2) were significant at the .05 level or better, except the availability of school-age care and family child care for active, cash assistance recipients.
26 The estimates reported here are for a family that has 100% of its children in the relevant age group (i.e., preschool-age or school-age). Results for families with some preschool and some school-age children would be a weighted average (weights being the proportion of all the children in the family that are of preschool age and the proportion that are of school age) of the results for preschool center care and of the results for school-age care.

37
cash recipients would use subsidies and 62% increase in the odds for working former cash
recipients) than in the balance of the state. Among the core cities, the impact of the increase in
the availability of school-age care was greatest in Newport (76% increase in the odds of using a
subsidy for working cash recipients and 96% increase for working former cash recipients) and
Providence (65% increase in the odds of using a subsidy for working cash recipients and 82%
increase for working former cash recipients).
For the state as a whole, we estimate that the increased availability of family child care
increased by 26% the odds that a working cash recipient would use a child care subsidy and
increased by 21% the odds that working former recipients would use child care subsidies. The
impact of the increased availability of family child care was greater in the core cities than in the
balance of the state. For the core cities, the increase in the availability of family child care
between 1996 and 2000 increased the odds that a working cash recipient would use a child
care subsidy by 67% and increased the odds that a working former cash recipient would use a
child care subsidy by 55%. Among the core cities, the impact of the increase in family child care
was highest in Providence (increase of 109% in the odds that a working cash recipient would
use a child care subsidy and increase of 89% in the odds that a working former cash recipient
would use a child care subsidy).
Effect Of Other Variables
Overall, our results indicate that single parents who are older, who are black, who are
English-speaking, who have high-school degrees, who have small families (controlling for
household structure), and who have no disabled members in the household have a higher
likelihood of using a child care subsidy, holding constant all other variables listed in Table 2.
The odds of using a child care subsidy decrease as the age of the youngest child in the family
increases.
38
Consistent with the model developed earlier, other aspects of family structure also
significantly impact the likelihood that an eligible family will use a child care subsidy. Families
that have more children eligible for subsidies are more likely to use subsidies than families with
fewer eligible children. For example, the odds that a working former cash family with two
children eligible for child care subsidies will use the subsidies is 34% higher than the odds of
subsidy use for a similar family with only one child eligible for subsidized child care. Families
with infants are significantly less likely to use child care subsidies, while families with preschool
children are significantly more likely to use subsidies. Among families with toddlers, active
cash-assistance families are more likely to use subsidies, while working families are less likely to
use them. 27 Families with teenage children in the household are, other things constant, less
likely to use subsidized child care.
The availability of part-day, part-year Head Start or kindergarten increases the likelihood
that active cash recipients will use subsidies. The availability of such care has no significant
impact on the likelihood that working families will use subsidies, regardless of their cash-
assistance status. The availability of full-day, full-year kindergarten decreases the probability
that working former cash recipients will use subsidies.
Finally, working families in Pawtucket are significantly less likely to use child care
subsidies than working families in other areas of the state, and families receiving cash
assistance (active or working) in Woonsocket are less likely to use child care subsidies than
cash-assistance families in other areas of the state.
Summary and Conclusions
Our work indicates that the child care policy changes associated with the Starting RIght
program in Rhode Island, coupled with the entitlement to child care subsidies and the provision
27 Parents are required to be active in RI when their youngest child is one year old. It is possible
that required activities are more conducive to the use of subsidies than work.

39
of health insurance to child care providers, significantly increased the likelihood that current and
former welfare recipients would use child care subsidies and significantly increased the
availability of formal child care. In addition, we found substantial evidence that these policy
changes promoted work among current and former cash recipients and encouraged cash
recipients to leave welfare for work.
Our results indicate that the impacts of Starting RIght and the other child care initiatives
are different for different client eligibility groups: (1) active cash recipients (i.e., active in
approved activities other than unsupported work), (2) working cash recipients and (3) working
former recipients. Overall, the impacts of Starting RIght and the other child care initiatives were
strongest for those who left the cash program for work and least dramatic for active cash
recipients.
Some child care policy changes (e.g., the entitlement to child care subsidies, the
expansion of income eligibility and age eligibility for subsidies) directly impacted the likelihood
that families would use a child care subsidy. Other policy changes (e.g., the provision of health
insurance to providers, the increase in reimbursement rates) affected families indirectly by
increasing the availability of formal child care.
To obtain estimates of the direct and indirect effects of the Rhode Island changes in
child care policy on the likelihood that an eligible family would use child care subsidies, we
constructed a longitudinal database for the period May 1996 (a year before RI’s welfare reform)
to April 2000. This database encompassed information obtained from many sources, including
DHS administrative data for families enrolled in the child care subsidy program and currently
and formerly enrolled in the cash-assistance program, information on their employment record
from the administrative records of the Unemployment Insurance (UI) program, and, for all
townships in RI, information on the availability of formal child care and education and on the

40
labor market. We analyze these data using economic modeling and the multinomial logit
estimation technique.
Our results indicate that the changes in child care policy had a direct and powerful
impact on the likelihood that a current or former cash recipient would work and on the take-up
rate for child care. The effect of these policy changes was less marked for active cash
recipients. For a working former recipient with median characteristics, changes in child care
policy and welfare reform substantially increased both the probability of working more than 20
hours per week and the take-up rate for child care subsidies. The probability that such
individual would be working more than 20 hours per week, regardless of whether or not the
family received child care subsidies, increased from 4% in Q2 of 1996 to 15% in Q2 of 2000.
Specifically, this probability increased from 4% to 9% during the first year of our study period
when child care became an entitlement. It did not change during the first year of welfare
reform, but it increased by 3% during the second year (from 9% in Q2 of 1998 to 12% in Q2 of
1999), as Starting RIght began, and by an additional 3% during the last year of our study
period, thus reaching 15%.
The results described above suggest that Starting RIght served as an important support
that allowed low-income families to find employment and to leave the cash-assistance program.
Our best estimate is that the changes in child care policies increased by 5% the probability that
a family participating in the cash assistance program would find employment and leave cash
assistance.
The importance of child care policy changes for former cash recipients is also reflected
in their use of child care subsidies. We estimate that, controlling for employment growth and
community characteristics, the take-up rate for child care subsidies for the median former cash
family increased by slightly more than 15% (from 53% in Q2 of 1996 to 69% in Q2 of 2000).
This increase in use occurred mainly during the second and last years of the study. During the

41
second year of the study, the take-up rate for this group went from 51% to 62%. We suspect
that this increase in take up resulted both from the entitlement to child care subsidies and,
possibly, from other aspects of welfare reform. During the last year of the study, the take-up
rate for this group went from 64% to 69%, which we believe was mainly the result of Starting
RIght.
We estimate that for a working cash-assistance family with median characteristics
(controlling for employment growth and community characteristics), the take-up rate for child
care subsidies increased by 24 percentage points (from 38% in Q2 of 1996 to 62% in Q2 of
2000). The increase in take-up for this group occurred throughout the study period. We
estimate that only 6% of this increase was due to changes in child care policies and that the
rest was due to other policy changes related to welfare reform.28
Changes in child care policy appear to have had limited if any direct effect on the take-
up rate for child care subsidies for active cash recipients. There were fewer policy changes
impacting this group. For example, they had an entitlement to child care throughout the study
period. However, it is somewhat surprising that other changes (e.g., the increase in
reimbursement rates) had no effect on the take-up rate for this group.
While we observed an increase in both the likelihood that cash recipients with median
characteristics would work 20 or more hours per week and would use child care subsidies,
much of the increase appears to be related to welfare reform. We estimate that for a cash-
assistance family with median characteristics (and controlling for employment growth and
community characteristics), the probability of working more than 20 hours per week increased
gradually from 3% in Q2 of 1996 to 7% in Q2 of 2000. Our best estimate is that half of this
28 Note that cash assistance recipients had an entitlement to child care subsidies throughout the
study period. Working former recipients had an entitlement only for a year after leaving cash assistance prior to RI’s welfare reform, but had a time-unlimited entitlement to child care subsidies after RI’s welfare reform in May 1997.

42
increase resulted from welfare reform policies unrelated to child care and half from changes in
child care policy.
The increases in provider reimbursement rates and the provision of health insurance for
providers of subsidized child care associated with Starting RIght significantly increased the
availability of formal child care, particularly school-age care and family child care. As would be
expected, the increase was most rapid in lower-income communities. There was a very rapid
expansion in the availability of school-age care throughout the state after children aged 13 to
15 were made eligible for child care subsidies. However, the increase in the availability of
school-age care was much larger in the core cities than in the remainder of the state and much
larger after Starting RIght than before. The availability of family child care also expanded quite
rapidly. In the core cities, the expansion in family child care in 1997 and 1998 appears to be
related to the provision of health insurance coverage, while the more dramatic expansion in
1999 and 2000 appears related to increases in reimbursement rates. Preschool care at centers
expanded somewhat more slowly, except for Central Falls and Pawtucket where the expansion
was more marked.
The increased availability of formal child care as a result of the increases in
reimbursement rates and the provision of health insurance served to further increase the take-
up rate for child care subsidies. The impact was largest for working families in the core cities.
For example, we estimate that the increase in the availability of school-age care improved by
49% the odds that a working cash family with school-age children living in one of the core cities
would use a subsidy. Similarly, the increase in the availability of school-age care improved by
62% the odds that a working former cash family would use subsidies. In the final period of our
study, the increased availability of school-age care increased the take-up rate from 62% to 66%
for working cash recipients with school-age children living in a core city and from 69% to 76%
for similarly situated working former recipients with school-age children.

43
We estimate that the increased availability of family child care increased by 67% the
odds that a working family on cash and living in one of the core cities would use a subsidy and
it increased by 55% the odds that a similarly situated working former recipient family would use
subsidies. In the final period of our study, we estimate that the increased availability of family
child care increased by 62% to 69% the take-up rate for working cash recipients living in the
core cities and increased the take-up rate for working former cash recipients living in the core
cities from 69% to 75%.
Overall, considering both direct and indirect effects, we estimate that the changes in
child care policies increased the take-up rate for child care subsidies among working former
cash recipients living in one of the core cities by between 12% and 23%. Our best estimate is
that between 65% and 76% of eligible former cash recipients living in one of the core cities
used child care subsidies in Q2 of 2000. For working cash recipients living in the core cities we
estimate that the combined direct and indirect effects of changes in child care policies were to
increase the take-up rate for child care subsidies for this group between 11% and 13%. Our
best estimate is that between 67% and 69% of eligible working cash-assistance families living
in one of the core cities used child care subsidies in Q2 of 2000.

44
REFERENCES
Anderson, P. M. and Meyer, B. D. (1997). Unemployment Insurance Take-up Rates and the
After-Tax Value of Benefits. Quarterly Journal of Economics, 112, 913-937.
Chamberlain, Gary (1984). Panel data. In Zvi Griliches and Michael Intrilligator (eds),
Handbook of Econometrics, Vol. II (pp. 1247-1317). Amsterdam: North-Holland.
GeoLytics, Inc. (1998). CensusCD+Maps. East Brunswick, NJ: GeoLytics, Inc.
Greene, William (1997). Econometric analysis (3rd ed.). Upper Saddle River, NJ: Prentice Hall.
Heckman, J. J., LaLonde, R. J. and Smith, J. A. (1999), The Economics and Econometrics of
Active Labor Market Programs. In Orley C. Ashenfelter and David Card (eds). Handbook
of Labor Economics, Vol. 3A. Amsterdam: Elsevier.
Lemke, R., R. Witt and A. Witte (2001). Child Care and the Welfare to Work Transition, Working
Paper 2001-02, Department of Economics, Wellesley College, Wellesley, MA. Available:
http://www.wellesley.edu/Economics/wkpapers/index.html.
Liang, Kung-Yee and Scott L. Zeger (1986). Longitudinal Data Analysis Using Generalized
Linear Models, Biometrika, 73, 13-22.
Liang, Kung-Yee, Scott L. Zeger and Bahjat Qaqish (1992). Multivariate Regression Analyses
for Categorical Data, Journal of the Royal Statistical Society, Series B, 54, 3-24.
Queralt, M., A. Witte and H. Griesinger. (2000). Changing Policies, Changing Impacts:
Employment and Earnings of Child Care Subsidy Recipients in the Era of Welfare
Reform. Social Service Review, 74, 588-619.
Rhode Island KIDS COUNT (1996-2000). Rhode Island Kids Count Factbook. Providence, RI:
Rhode Island KIDS COUNT).
U.S. Bureau of the Census (1995). 1990 Census of Population and Housing. CD90-3A-26,
Summary Tape File 3A. Washington, D.C.: U.S. Bureau of the Census.
U.S. Bureau of the Census (1997). Small Area Income And Poverty Estimates Program (Table
093-12). Washington, D.C.: U.S. Bureau of the Census.

45
U.S. Bureau of the Census (2002). Census 2000 Data for the State of Rhode Island. Available
from http://www.census.gov/census2000/states/ri.html
U.S. General Accounting Office. (1994). Childcare subsidies increase likelihood that low-income
mothers will work. Series HEHS-095-20. Washington, D.C.: Superintendent of
Documents.
Witte, Ann; Queralt, Magaly; Chipty, Tasneem; & Griesinger, Harriet (1998). Unintended
consequences: Welfare reform and the working poor. Working paper #6798.
Cambridge, MA: National Bureau of Economic Research.
Witte, Ann; Queralt, Magaly & Tauchen, Helen (2001). Evaluation of Rhode Island’s Family
Independence Program. Working Paper 2001-08. Wellesley, MA: Wellesley College
Department of Economics.
Witte, Ann & Queralt, Magaly (2002). Some thoughts and empirical evidence on take-up rates
for child care subsidies. Working Paper, Wellesley, MA: Wellesley College Department of
Economics.
Zeger, Scott And Kung-Yee Liang. (1986). Longitudinal Data Analysis For Discrete And
Continuous Outcomes, Biometrics, 42: 121-130.

46
Figure 1Possible Statuses of Current & Former Cash-Assistance Recipients
(1) CA Child Care Subsidy (2) No Child Care Subsidy
Cash Assistance (CA)& Approved Activity
Work < 20 Hours Per Week
(3) CA Child Care Subsidy (4) No Child Care Subsidy
Cash Assistance (CA)
(5) Low-Income Child Care Subsidy (6) No Child Care Subsidy
Not On Cash Assistance
Work >= 20 Hours Per Week
Female-Headed, Low-IncomeFamilies

47
Figure 2Number of Families with Child Care Subsidies
Rhode Island-May 1996-April 2001
0
1000
2000
3000
4000
5000
6000
7000
8000
9000M
ay-9
6
Jul-9
6
Sep
-96
Nov
-96
Jan-
97
Mar
-97
May
-97
Jul-9
7
Sep
-97
Nov
-97
Jan-
98
Mar
-98
May
-98
Jul-9
8
Sep
-98
Nov
-98
Jan-
99
Mar
-99
May
-99
Jul-9
9
Sep
-99
Nov
-99
Jan-
00
Mar
-00
May
-00
Jul-0
0
Sep
-00
Nov
-00
Jan-
01
Mar
-01
Num
ber o
f Fam
ilies
Never on Cash Former Cash Now On Cash Transitional Other Total

48
Figure 3Number of Families with Child Care SubsidiesProvidence, Pawtucket & Outside Core Cities
May 1996-April 2001
100
300
500
700
900
1100
1300
1500
1700
1900
2100
2300
2500
May-96
Aug-96
Nov-96
Feb-97
May-97
Aug-97
Nov-97
Feb-98
May-98
Aug-98
Nov-98
Feb-99
May-99
Aug-99
Nov-99
Feb-00
May-00
Aug-00
Nov-00
Feb-01
Num
ber o
f Fam
ilies
Balance of State Former Cash & Low-Inc CC Balance of State On Cash CC
Providence Former Cash & Low-Inc CC Providence On Cash CC
Pawtucket Former Cash & Low-Inc CC Pawtucket On Cash CC

49
Figure 4Number of Families with Child Care Subsidies
Newport, Central Falls & WoonsocketMay 1996-April 2001
0
50
100
150
200
250
300
May-96
Aug-96
Nov-96
Feb-97
May-97
Aug-97
Nov-97
Feb-98
May-98
Aug-98
Nov-98
Feb-99
May-99
Aug-99
Nov-99
Feb-00
May-00
Aug-00
Nov-00
Feb-01
Num
ber o
f Fam
ilies
Newport Former Cash & Low-Inc CC Newport On Cash CCCentral Falls Former Cash & Low-Inc CC Central Falls On Cash CCWoonsocket Former Cash & Low-Inc CC Woonsocket On Cash CC

50
Figure 5Rhode Island Take-Up Rates for Child Care Subsidies
All Current and Former Cash Recipients--Q2 of 1996 to Q2 of 2000 n=29,253
40%
45%
50%
55%
60%
1996Q2
1996Q3
1996Q4
1997Q1
1997Q2
1997Q3
1997Q4
1998Q1
1998Q2
1998Q3
1998Q4
1999Q1
1999Q2
1999Q3
1999Q4
2000Q1
Former Cash Recipients
Current Cash Recipients
Combined--Current & Former Cash Recipients

51
Figure 6Take-Up Rate for Child Care Subsidies
Current & Former Cash Assitance RecipientsProvidence, Pawtucket & Outside Core Cities-May 1996-April 2000
40%
45%
50%
55%
60%
65%
1996Q2
1996Q3
1996Q4
1997Q1
1997Q2
1997Q3
1997Q4
1998Q1
1998Q2
1998Q3
1998Q4
1999Q1
1999Q2
1999Q3
1999Q4
2000Q1
2000Q2
Take
-Up
Rat
ePawtucket On Cash CC Pawtucket Former Cash CCProvidence On Cash CC Providence Former Cash CCBalance of State On Cash CC Balance of State Former Cash CC

52
Figure 7Take-Up Rate for Child Care Subsidies
Current & Former Cash Assistance RecipientsNewport, Central Falls & Woonsocket-Q2 1996- Q2 2000
20%
25%
30%
35%
40%
45%
50%
55%
60%
1996Q2
1996Q3
1996Q4
1997Q1
1997Q2
1997Q3
1997Q4
1998Q1
1998Q2
1998Q3
1998Q4
1999Q1
1999Q2
1999Q3
1999Q4
2000Q1
2000Q2
Take
-Up
Rat
eWoonsocket On Cash CC Woonsocket Former Cash CCCentral Falls On Cash CC Central Falls Former Cash CCNewport On Cash CC Newport Former Cash CC

53
Figure 8Statuses for Current & Former Cash-Assistance Recipients
(1) Child Care Subsidy (2) No Child Care Subsidy
Cash Assistance& Approved Activity
(7) Cash AssistanceNo Approved Activity
(8) Not OnCash Assistance
Work < 20 Hours Per Week
(3) Child Care Subsidy (4) No Child Care Subsidy
Cash Assistance
(5) Child Care Subsidy (6) No Child Care Subsidy
Not On Cash Assistance
Work >= 20 Hours Per Week
Female-Headed, Low-IncomeFamily

54
Figure 9Probabilities of Being in Statuses 1-6 in Figure 8Current & Former Cash Assistance Recipients
Rhode Island-May 1996-April 2000
0%
1%
2%
3%
4%
5%
6%
7%
8%
9%
10%
11%
96Q2
96Q3
96Q4
97Q1
97Q2
97Q3
97Q4
98Q1
98Q2
98Q3
98Q4
99Q1
99Q2
99Q3
99Q4
00Q1
00Q2
Prob
abili
tyActive, On Cash With Subsidy Active, On Cash, No Subsidy Working, On Cash With SubsidyWorking, On Cash, No Subsidy Working, Off Cash With Subsidy Working, Off Cash No Subsidy

55
Figure 10Estimated Take-Up Rate for Child Care Subsidies
Rhode Island-Q2 1996-Q2 2000
35%
40%
45%
50%
55%
60%
65%
70%
96Q2
96Q3
96Q4
97Q1
97Q2
97Q3
97Q4
98Q1
98Q2
98Q3
98Q4
99Q1
99Q2
99Q3
99Q4
00Q1
00Q2
Take
-Up
Rat
e
Active-On Cash Working>=20 Hours-On Cash Working>=20 Hours-Off Cash

56
Figure 11Take-Up Rate for Child Care Subsidies
Pawtucket & Providence-Q2 1996-Q2 2000
30%
35%
40%
45%
50%
55%
60%
65%
70%
75%
80%
96Q2 97Q2 98Q2 99Q2 00Q2
Take
-Up
Rat
e Providence:Active-On Cash Providence:Working-On Cash Providence:Working-Off CashPawtucket:Active-On Cash Pawtucket:Working-On Cash Pawtucket: Working, Off Cash

57
Figure 12Take-Up Rate for Child Care Subsidies
Central Falls, Newport & Woonsocket-Q2 1996-Q2 2000
0%
10%
20%
30%
40%
50%
60%
96Q2 97Q2 98Q2 99Q2 00Q2
Take
-Up
Rat
e
Woonsocket:Active-On Cash Woonsocket:Working-On Cash Woonsocket:Working-Off CashCentral Falls:Active-On Cash Central Falls:Working-On Cash Central Falls:Working-Off CashNewport:Active-On Cash Newport:Working-On Cash Newport:Working-Off Cash

58
Figure 13Center Care for Children Under Age 6
Core Cities, Balance of State and State as a Whole
0.00
0.05
0.10
0.15
0.20
0.25
1996 1997 1998 1999 2000
Year
Slot
s pe
r Chi
ld 0
-5
Core CitiesRemainder of StateRhode Island
Source: Rhode Island Kids Count Factbook, 1996-2000

59
Figure 14Center Care for Children Under Age 6
Central Falls, Newport, Pawtucket, Providence & Woonsocket
0.00
0.05
0.10
0.15
0.20
0.25
1996 1997 1998 1999 2000
Year
Slot
s pe
r Chi
ld 0
-5
Central Falls Newport Pawtucket Providence Woonsocket
Source: Rhode Island Kids Count Factbook, 1996-2000

60
Figure 15The Availability of School Age Care
Core Cities, Balance of State and State as a Whole
0.00
0.02
0.04
0.06
0.08
0.10
0.12
0.14
0.16
0.18
0.20
1996 1997 1998 1999 2000
Year
Slot
s pe
r Chi
ld 5
-13
Core CitiesRemainder of StateRhode Island
Source: Rhode Island Kids Count Factbook, 1996-2000

61
Figure 16The Availability of School-Age Care
Central Falls, Newport, Pawtucket, Providence & Woonsocket
0.00
0.05
0.10
0.15
0.20
0.25
0.30
1996 1997 1998 1999 2000
Year
Slot
s pe
r Chi
ld 5
-13
Central Falls Newport Pawtucket Providence Woonsocket
Source: Rhode Island Kids Count Factbook, 1996-2000

62
Figure 17The Availability of Family Child Care
Core Cities, Balance of State and State as a Whole
0.00
0.01
0.02
0.03
0.04
0.05
0.06
1996 1997 1998 1999 2000
Year
Slot
s pe
r Chi
ld 0
-13
Core CitiesRemainder of StateRhode Island
Source:Rhode Island Kids Count Factbook, 1996-2000

63
Figure 18The Availability of Family Child Care
Central Falls, Newport, Pawtucket, Providence & Woonsocket
0.00
0.01
0.02
0.03
0.04
0.05
0.06
0.07
0.08
1996 1997 1998 1999 2000
Year
Slot
s pe
r Chi
ld 0
-13
Central Falls Newport Pawtucket Providence Woonsocket
Source: Rhode Island Kids Count Factbook, 1996-2000
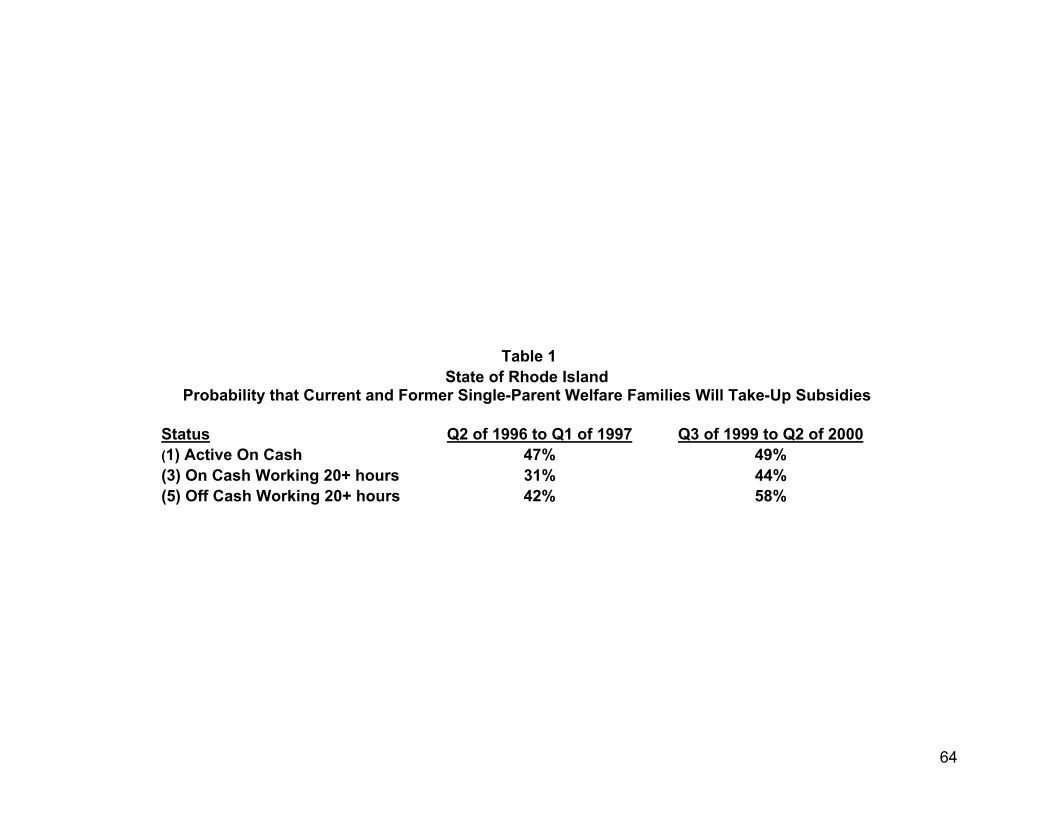
64
Table 1 State of Rhode Island
Probability that Current and Former Single-Parent Welfare Families Will Take-Up Subsidies
Status Q2 of 1996 to Q1 of 1997 Q3 of 1999 to Q2 of 2000 (1) Active On Cash 47% 49% (3) On Cash Working 20+ hours 31% 44% (5) Off Cash Working 20+ hours 42% 58%

65
Table 2 Descriptive Statistics for Explanatory Variables
Study Period: Q2 of 1996 to Q2 of 2000 Standard EXPLANATORY VARIABLES: Median Mean Deviation Human Capital and Socio-Demographic:
Binary=1 if Household Head Has 12 or More Years of Education 0.00 0.46 0.50Age of Household Head 30.12 30.97 8.61
Household language is English 1.00 0.84 0.37Household language is Spanish 0.00 0.13 0.34
Asian 0.00 0.03 0.17Black 0.00 0.13 0.33
Hispanic 0.00 0.24 0.43White 1.00 0.54 0.50
Number of Children Eligible for Child Care Subsidies 2.00 1.97 1.08Age of Youngest Child 4.34 5.02 0.76
Fraction of Eligible Children <12 Months 0.00 0.09 0.25Fraction of Eligible Children 1 to 3 Years Old 0.00 0.16 0.31
Fraction of Eligible Children 3 to 5—Not Kindergarten Eligible 0.00 0.19 0.32Fraction of Children Eligible for Both Child Care Subsidies & Kindergarten 0.00 0.08 0.22
Number of children 13-17 years old--Middle & Secondary School Age 0.00 0.25 0.60Number of Family Members ages 18-60 1.00 1.02 0.27
Number of Disabled Persons in Household 0.00 0.08 0.30Head of Household Is Disabled 0.00 0.01 0.07
Head of Household Is Not a US Citizen 0.00 0.13 0.33Household Size 2.00 2.77 1.07
Availability of Care and Education: Number of Full-Time Preschool Center Slots per 100 Children <5 in Township in 1996 22.00 19.04 6.97
Number of School-Age Center Slots per 100 School-Age Children in Township in 1996 7.00 5.96 1.68Number of Family Child Care Slot per 100 Children 0-13 in Township in 1996 2.48 3.00 0.70
Proportion of Eligible 3-4 Year Olds Enrolled in Head Start in Township: in 1997 it was 0.34 0.41 0.20Proportion of Eligible Children in Part-Day Kindergarten in Township: in 1997 it was 0.73 0.73 0.18
Proportion of Eligible Children in Full-Day Kindergarten in the Township: in 1997 it was 0.14 0.21 0.21Local Labor Market Conditions:
Average Monthly Change in Number Employed During the Quarter (%) 0.28 0.14 0.97Time:
A Set of Binary Variables One for Each Quarter Except Q2 1996 NA NA NANCore Communities:
Client resides in Central Falls 0.00 0.05 0.21Client resides in Newport 0.00 0.03 0.18
Client resides in Pawtucket 0.00 0.11 0.32Client resides in Providence 0.00 0.38 0.48
Client resides in Woonsocket 0.00 0.08 0.27

66
Table 3 Percent Change in Odds that an Eligible Working Former Cash Recipient Will Receive a Child Care Subsidy (((P(Status 5)/ P(Status 6)-1)*100)
Quarter Rhode Island P-Value Providence P-Value Pawtucket P-Value Woonsocket P-Value Central Falls P-Value Newport P-Value 1996 Q3 8% 0.34 -14% 0.32 16% 0.41 44% 0.21 36% 0.46 -11% 0.66 1996 Q4 -6% 0.51 -18% 0.18 -9% 0.61 43% 0.23 -19% 0.62 -9% 0.79 1997 Q1 -3% 0.75 -29% 0.00 -14% 0.38 -12% 0.63 -21% 0.54 -31% 0.20 1997 Q2 -8% 0.35 -19% 0.13 10% 0.61 104% 0.03 -16% 0.69 -25% 0.41 1997 Q3 14% 0.15 -2% 0.91 4% 0.85 78% 0.05 27% 0.53 -9% 0.70 1997 Q4 6% 0.49 -14% 0.23 1% 0.96 76% 0.03 8% 0.83 N.A1 1998 Q1 24% 0.03 -17% 0.11 -12% 0.40 N.A1 N.A1 8% 0.76 1998 Q2 42% 0.00 13% 0.36 13% 0.53 158% 0.00 71% 0.20 -22% 0.51 1998 Q3 59% 0.00 9% 0.49 25% 0.23 98% 0.02 82% 0.13 33% 0.31 1998 Q4 45% 0.00 19% 0.23 29% 0.21 232% 0.00 64% 0.32 -1% 0.97 1999 Q1 56% 0.00 2% 0.89 37% 0.03 108% 0.00 67% 0.12 -7% 0.78 1999 Q2 57% 0.00 14% 0.34 45% 0.06 177% 0.00 102% 0.15 3% 0.94 1999 Q3 68% 0.00 31% 0.03 28% 0.17 175% 0.00 61% 0.31 84% 0.02 1999 Q4 59% 0.00 46% 0.01 28% 0.22 195% 0.00 54% 0.41 63% 0.08 2000 Q1 67% 0.00 N.A1 N.A1 110% 0.00 53% 0.20 83% 0.03 2000 Q2 93% 0.00 65% 0.00 54% 0.01 261% 0.00 77% 0.22 80% 0.07 1 No estimate available because the binary for this period was perfectly collinear with other variables.

67
Table 4 Percent Change in Odds that an Eligible Working Cash Recipient Will Receive a Child Care Subsidy (((P(Status 3)/ P(Status 4)-
1)*100) Quarter Rhode Island P-Value Providence P-ValuePawtucket P-ValueWoonsocketP-Value Central FallsP-Value NewportP-Value 1996 Q3 39% 0.00 -5% 0.77 16% 0.45 -17% 0.54 4% 0.92 14% 0.73 1996 Q4 6% 0.50 3% 0.87 21% 0.37 -55% 0.02 21% 0.58 -45% 0.17 1997 Q1 -1% 0.93 -20% 0.12 -34% 0.06 -46% 0.09 -52% 0.10 -9% 0.86 1997 Q2 36% 0.00 11% 0.51 41% 0.15 16% 0.63 29% 0.52 29% 0.59 1997 Q3 78% 0.00 3% 0.86 46% 0.08 65% 0.09 -38% 0.21 -3% 0.92 1997 Q4 73% 0.00 14% 0.31 26% 0.26 -32% 0.21 9% 0.28 N.A1 1998 Q1 88% 0.00 -9% 0.43 -10% 0.58 N.A1 N.A1 4% 0.90 1998 Q2 105% 0.00 36% 0.02 77% 0.01 20% 0.53 0% 1.00 -2% 0.95 1998 Q3 150% 0.00 50% 0.00 32% 0.17 101% 0.02 11% 0.77 82% 0.06 1998 Q4 115% 0.00 60% 0.00 34% 0.19 59% 0.15 36% 0.42 96% 0.04 1999 Q1 96% 0.00 9% 0.44 -22% 0.16 21% 0.49 0% 1.00 273% 0.00 1999 Q2 137% 0.00 72% 0.00 44% 0.08 57% 0.12 16% 0.70 305% 0.00 1999 Q3 168% 0.00 77% 0.00 84% 0.00 56% 0.11 56% 0.11 163% 0.00 1999 Q4 134% 0.00 90% 0.00 69% 0.01 30% 0.39 124% 0.04 154% 0.01 2000 Q1 131% 0.00 N.A1 N.A1 -13% 0.66 95% 0.07 239% 0.00 2000 Q2 164% 0.00 93% 0.00 73% 0.00 21% 0.49 146% 0.01 408% 0.00 1 No estimate available because the binary for this period was perfectly collinear with other variables.

68
Table 5 Percent Change in Odds that an Eligible Active Cash Recipient Will Receive a Child Care Subsidy (((P(Status 1)/ P(Status 2)-1)*100)
Quarter Rhode Island P-Value Providence P-Value Pawtucket P-Value Woonsocket P-Value Central Falls P-Value Newport P-Value 1996 Q3 17% 0.00 2% 0.24 6% 0.60 36% 0.03 62% 0.03 -30% 0.15 1996 Q4 21% 0.00 13% 0.12 4% 0.73 35% 0.05 62% 0.08 -29% 0.24 1997 Q1 17% 0.00 -13% 0.10 -7% 0.63 66% 0.02 24% 0.42 -26% 0.23 1997 Q2 33% 0.00 18% 0.04 4% 0.78 68% 0.00 58% 0.07 145% 0.00 1997 Q3 41% 0.00 14% 0.12 8% 0.60 53% 0.02 138% 0.00 -7% 0.74 1997 Q4 45% 0.00 23% 0.02 -8% 0.56 28% 0.13 28% 0.13 N.A1 1998 Q1 37% 0.00 -5% 0.56 9% 0.59 N.A1 N.A1 26% 0.25 1998 Q2 49% 0.00 32% 0.00 21% 0.21 8% 0.68 54% 0.09 185% 0.00 1998 Q3 48% 0.00 56% 0.00 -2% 0.91 -16% 0.40 68% 0.04 4% 0.89 1998 Q4 43% 0.00 51% 0.00 4% 0.80 -39% 0.02 21% 0.49 35% 0.30 1999 Q1 27% 0.00 13% 0.16 -3% 0.84 -30% 0.08 3% 0.89 39% 0.22 1999 Q2 31% 0.00 20% 0.03 31% 0.08 -39% 0.01 38% 0.20 208% 0.00 1999 Q3 42% 0.00 53% 0.00 25% 0.14 -37% 0.03 -37% 0.03 5% 0.89 1999 Q4 33% 0.00 36% 0.00 14% 0.38 6% 0.78 40% 0.21 -3% 0.93 2000 Q1 67% 0.00 N.A1 N.A1 10% 0.67 -4% 0.90 4% 0.90 2000 Q2 48% 0.00 41% 0.00 23% 0.17 8% 0.77 18% 0.54 142% 0.01 1 No estimate available because the binary for this period was perfectly collinear with other variables.