Embed Size (px)
Citation preview

Durham – Where Great Things Happen
Water Quality Report # 11-001 August 2012
CITY OF DURHAM Department of Public Works
EVALUATION OF POLLUTANTS IN WASTEWATER GENERATED BY MOBILE
COMMERCIAL CAR WASHING OPERATIONS IN DURHAM, NC
EXECUTIVE SUMMARY
Revisions made in 2006 to the City of Durham’s Stormwater Management and Pollution Control ordinance in accordance with the City’s National Pollution Discharge Elimination System Permit (NC50000249 Part 1(9)) prohibit discharge from commercial vehicle washing to the drainage system. In order to comply, mobile care washing companies are required to contain, collect, and properly dispose of their wastewater to the sanitary sewer. In 2011, 37 businesses actively operating in the city had previously demonstrated compliance with this ordinance. The goal of this study was to quantify pollutant load reductions to the stormwater drainage system by mobile car washing companies operating in compliance with the ordinance. To quantify these load reductions, wastewater composite samples (3‐5 vehicles for each composite, 25 vehicles total) were collected for total organic carbon (TOC), 5‐day biochemical oxygen demand (BOD5), metals, nutrients, and polycyclic aromatic hydrocarbons (PAHs) analyses from two mobile car washing companies operating within the city under different antecedent conditions. Preliminary analyses indicate hundreds of pounds of pollution are removed from the City’s stormwater drainage system by this program on an annual basis.
Water Quality Report #11-001, page 2
TABLE OF CONTENTS
EXECUTIVE SUMMARY .................................................................................................. 1 TABLE OF CONTENTS..................................................................................................... 2 INTRODUCTION ............................................................................................................. 2 Regulatory Drivers .................................................................................................... 2 Purpose and Scope.................................................................................................... 3
METHODS ...................................................................................................................... 3 Field Data Collection ................................................................................................. 3 Quality Assurance/Quality Control ........................................................................... 5
STUDY RESULTS ............................................................................................................. 5 Quality Control Sample Results – Field/Equipment Blanks ...................................... 5 Quality Control Sample Results – Duplicates ............................................................ 6 Wastewater Composites ........................................................................................... 7 Survey ...................................................................................................................... 14 Annual Pollutant Loads from Mobile Commercial Car Washes in Durham ............ 15
SUMMARY ................................................................................................................... 19 REFERENCES ................................................................................................................ 19
INTRODUCTION
During the last decade, there has been an emergence of mobile commercial car washers. Anyone with an inexpensive pressure washer, a water tank, and a few cleaning supplies could start a mobile commercial car washing business. Traditionally, these mobile businesses set up in a parking lot along a well‐travelled roadway or in a busy commercial shopping complex to attract business. Wastewater generated from these operations would flow across these parking lots and into the City’s municipal separate storm sewer system (MS4) without capture or treatment. Conversely, fixed car washing operations are at a static location and have a permanent structure for vehicle washing. These fixed operations have specific requirements for operation including an oil‐water separator and connection for discharge to the sanitary sewer. It is common practice for these fixed commercial car washers to recycle their water for reuse. Regulatory Drivers The City of Durham has a number of regulatory requirements relating to identifying and addressing pollution sources to the MS4, which discharges directly to surface waters. The City’s National Pollutant Discharge Elimination System (NPDES) permit for the MS4 requires adoption of a stormwater pollution control ordinance. To meet this requirement, the city adopted the Stormwater Management and Pollution Control Ordinance that bans the discharge of pollutants into the City’s stormwater system. Revisions made in 2006 to this ordinance required mobile commercial car

Water Quality Report #11-001, page 3
washing companies to contain, collect, and properly dispose of their wastewater to the sanitary sewer (Appendix A). The City of Durham also has a number of impaired streams that are included on the state’s 303(d) list. These parameters of concern include the metals copper and zinc, dissolved oxygen, biological impairment, and fecal coliform. In addition, the City is required to address total maximum daily loads (TMDLs) and state‐mandated nutrient management strategies for Falls and Jordan Lakes, both water supply reservoirs. Purpose and Scope The City must dedicate significant resources towards ordinance enforcement and must address parameters of concern on the 303(d) list, TMDLs, and nutrient management strategies. One step in addressing these concerns is characterizing and quantifying the pollutant loads generated by various activities. Without the ordinance in place, an unquantified amount of pollution from mobile car wash wastewater would enter the MS4 in Durham. The purpose of this study was to evaluate wastewater generated during mobile commercial car washing operations to quantify the reduction of pollutant loading to surface waters that drain to the City’s MS4 due to ordinance enforcement.
METHODS
Field Data Collection This study was performed in general accordance to the Evaluation of Pollutants in Wastewater Generated by Mobile Car Washing Operations in Durham NC Quality Assurance Project Plan (QAPP; City of Durham, 2011). The QAPP originally considered sampling wastewater from four mobile commercial car washing companies actively operating within the City Limits of Durham. Sampling wastewater from multiple vendors was preferred to collect data representative of a range of potential operating variables among companies such as cleaning water volume, cleaning methodologies, differences in cleaning products, clientele, etc. It was initially thought that these companies would participate on a voluntary basis. Finding reliable participants, particularly volunteer participants, proved to be more difficult than anticipated. Due to the lack of volunteers and limited time and staff resources, alternative incentives were used to select participation. Additionally, the number of companies utilized in the study was reduced from four to two. One of the participating companies had a fine from a previous ordinance violation that was partially forgiven for participating. The other company was paid $20 per vehicle washed for participating in the study. Both companies were allowed to charge for washes to encourage using regular clientele.

Water Quality Report #11-001, page 4
To avoid contamination from any residual pollutants on the company’s containment system, Stormwater Services placed new tarps over the company’s existing containment system at the beginning of the sample day prior to any washing. Peristaltic pumps and virgin tubing were utilized for wastewater collection to further reduce potential contaminant exposure. Composite samples were collected to reduce study costs and increase efficiency. Vehicle washing wastewater was pumped into a pre‐cleaned and decontaminated 45‐gallon plastic churn splitter (Figure 1). The churn splitter was not available commercially and was custom made based on general specifications of the smaller commercially available churn splitters. Three
composites were collected per day per company; each composite contained wastewater from 3‐5 vehicles. After the vendor had washed the vehicles composing a composite, the vendor “cleaned” the tarp with the power washer. Water generated during this process was collected and incorporated into the composite prior to vehicle washing for the next composite. This process minimized cross‐sample contamination by collecting residual pollutants from the tarp surface. Each composite was sampled for nutrients (nitrate + nitrite, total Kjeldahl nitrogen, and total phosphorus), metals (cadmium, chromium, copper, manganese, nickel, lead, antimony, and zinc), polycyclic aromatic hydrocarbons (PAHs), 5‐day biochemical oxygen demand (BOD), total suspended solids (TSS), total organic carbon (TOC), and chloride. After each wastewater composite was collected, the churn splitter was churned a minimum of 30 seconds prior to filling sample bottles and throughout sampling to ensure the wastewater was well mixed. Bottles were pre‐preserved and were placed on ice immediately after sampling. Chemistry analyses were performed by the North Carolina certified laboratory ENCO Laboratories, Inc. located in Cary, North Carolina. Field parameters were measured following sample collection. Dissolved oxygen (DO), specific conductivity, pH, and temperature were measured with a YSI Pro Plus with a Quattro cable and bulkhead. Turbidity was measured with a Hach 2100 turbidimeter. Each meter was pre‐calibrated prior to use and post‐checked after use against known standards to ensure and verify accuracy. After field parameters were measured, the remaining wastewater was disposed into a sanitary sewer connection. Other various data was collected and recorded in the field. These data
Figure 1. Churn splitter used for composite sampling.
Water Quality Report #11-001, page 5
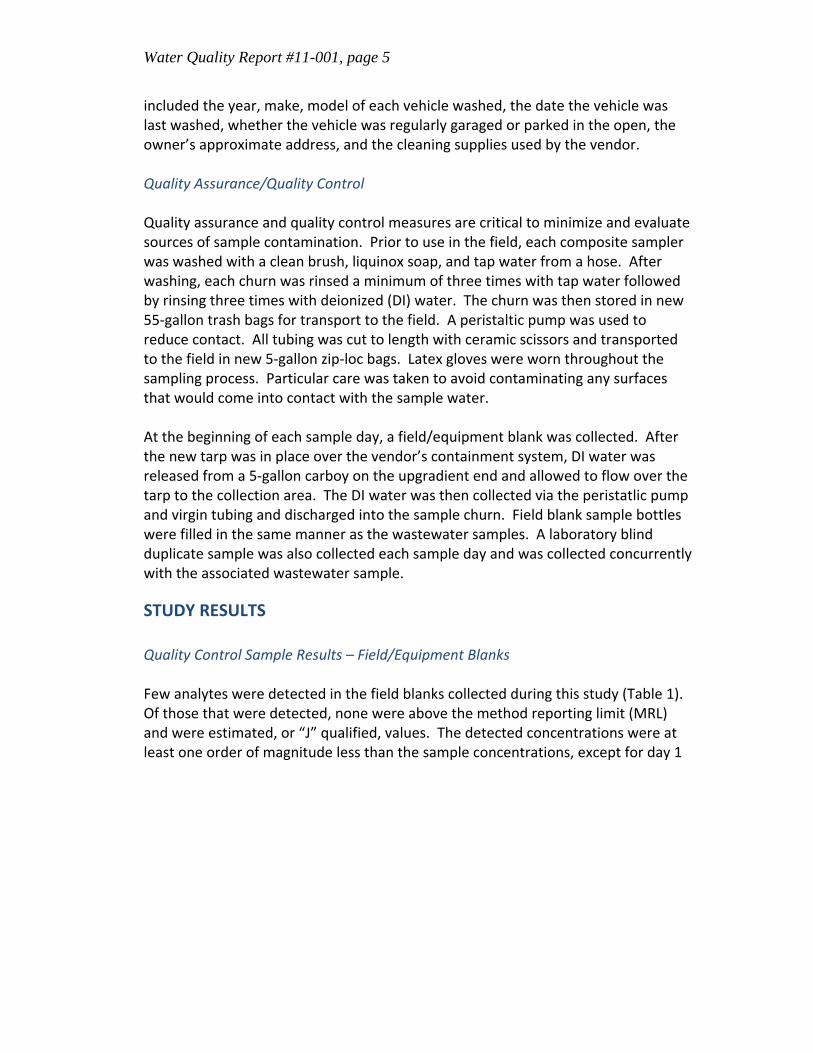
included the year, make, model of each vehicle washed, the date the vehicle was last washed, whether the vehicle was regularly garaged or parked in the open, the owner’s approximate address, and the cleaning supplies used by the vendor. Quality Assurance/Quality Control Quality assurance and quality control measures are critical to minimize and evaluate sources of sample contamination. Prior to use in the field, each composite sampler was washed with a clean brush, liquinox soap, and tap water from a hose. After washing, each churn was rinsed a minimum of three times with tap water followed by rinsing three times with deionized (DI) water. The churn was then stored in new 55‐gallon trash bags for transport to the field. A peristaltic pump was used to reduce contact. All tubing was cut to length with ceramic scissors and transported to the field in new 5‐gallon zip‐loc bags. Latex gloves were worn throughout the sampling process. Particular care was taken to avoid contaminating any surfaces that would come into contact with the sample water. At the beginning of each sample day, a field/equipment blank was collected. After the new tarp was in place over the vendor’s containment system, DI water was released from a 5‐gallon carboy on the upgradient end and allowed to flow over the tarp to the collection area. The DI water was then collected via the peristatlic pump and virgin tubing and discharged into the sample churn. Field blank sample bottles were filled in the same manner as the wastewater samples. A laboratory blind duplicate sample was also collected each sample day and was collected concurrently with the associated wastewater sample.
STUDY RESULTS
Quality Control Sample Results – Field/Equipment Blanks Few analytes were detected in the field blanks collected during this study (Table 1). Of those that were detected, none were above the method reporting limit (MRL) and were estimated, or “J” qualified, values. The detected concentrations were at least one order of magnitude less than the sample concentrations, except for day 1
Water Quality Report #11-001, page 6
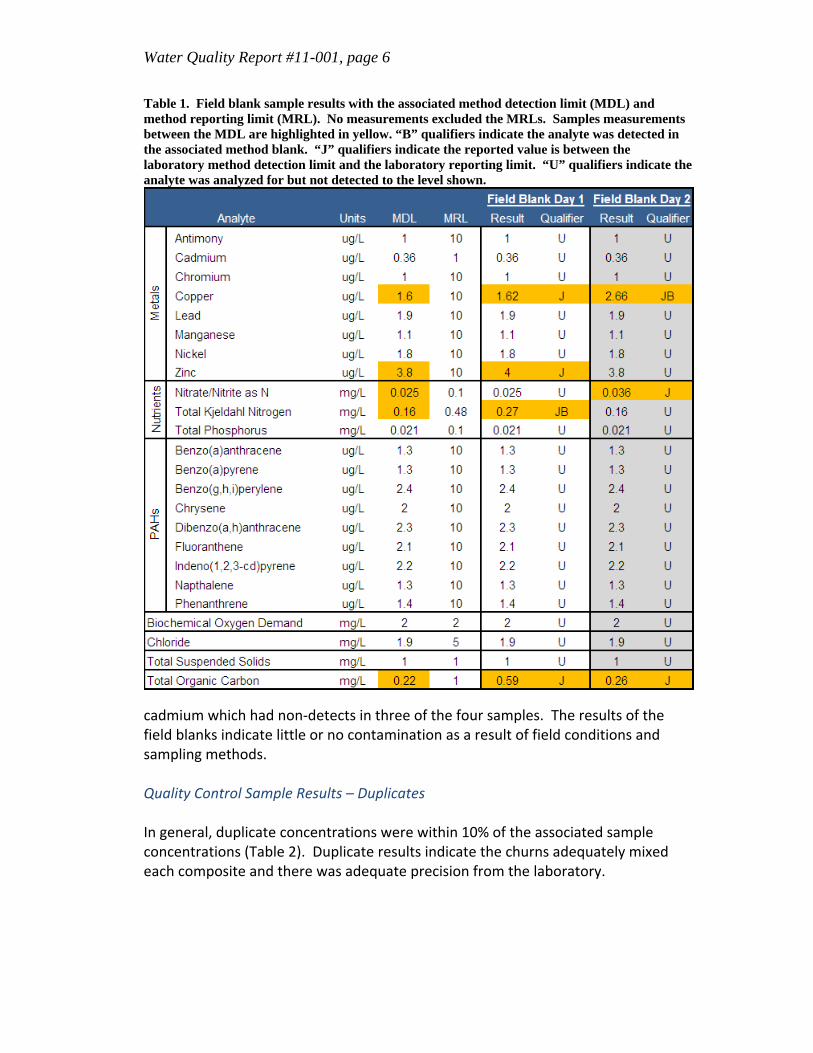
Table 1. Field blank sample results with the associated method detection limit (MDL) and method reporting limit (MRL). No measurements excluded the MRLs. Samples measurements between the MDL are highlighted in yellow. “B” qualifiers indicate the analyte was detected in the associated method blank. “J” qualifiers indicate the reported value is between the laboratory method detection limit and the laboratory reporting limit. “U” qualifiers indicate the analyte was analyzed for but not detected to the level shown.
cadmium which had non‐detects in three of the four samples. The results of the field blanks indicate little or no contamination as a result of field conditions and sampling methods. Quality Control Sample Results – Duplicates In general, duplicate concentrations were within 10% of the associated sample concentrations (Table 2). Duplicate results indicate the churns adequately mixed each composite and there was adequate precision from the laboratory.

Water Quality Report #11-001, page 7
Sampling Conditions Samples were collected from the first mobile commercial car washing company on September 09, 2011 (day 1) and from the second company on November 08, 2011 (day 2). Weather conditions were ideal for car washing on both sampling days with mostly sunny skies and moderate temperatures. Samples collection began in the morning and continued through the early afternoon on both days. Previous rainfall to day 1, a 2.86” event, occurred three days prior on September 6th, 2011. Previous rainfall to day 2, a 1.83” event, occurred four days prior on November 4th, 2011 . Of the 14 cars surveyed on day 1, only one car was regularly garaged. None of the cars surveyed on day 2 were regularly garaged. The median time the vehicle was washed prior to the day 1 sampling was 26 days. Cars on day 2 were washed a median of 14 days. Wastewater Composites Samples were collected from three composites each day (4‐5 vehicles per composite; 14 vehicles total on day 1; 3‐4 vehicles per composite; 11 vehicles total on day 2; Table 3). The company on day 1 generally used less water per wash (15.1‐20.8 L) than the company on day 2 (18.9‐26.5 L). Composite characteristics and analytical sample data, with the exception of PAHs, are summarized in Table 3. All PAHs evaluated during this study were not detected in the wastewater samples. PAHs are present in car exhaust and are a component of brake pads. As such, it was anticipated PAHs would be present in the study samples. PAHs, however, are hydrophobic and do not mix well with water. It is possible that any PAHs present were not in solution when the samples were analyzed at the laboratory. Of the eight metals evaluated during this study, zinc and copper had the highest concentrations in composite samples (Table 3). On day 1, zinc concentrations ranged from 1.42 mg/L to 1.83 mg/L. Zinc concentrations were more variable on day 2, ranging from 1.19 mg/L to 2.74 mg/L. For reference, the North Carolina Division of Water Quality (NC DWQ) surface water quality standard for zinc is 0.05 mg/L. Copper concentrations ranged from 0.68 mg/L to 1.79 mg/L on day 1 and 0.26 mg/L to 1.57 mg/L on day 2. The NC DWQ’s surface water quality standard for copper is 0.007 mg/L. The City of Durham currently has streams on the state’s 303(d) list for both zinc and copper. Although not as high as zinc and copper, most of the other metals had measureable concentrations in each composite (Table 3). Manganese concentrations ranged from 0.152 mg/L to 0.518 mg/L on day 1 and 0.183 mg/L to 0.581 on day 2. Antimony ranged from 0.00261 mg/L to 0.0186 mg/L on day 1 and 0.0038 mg/L to 0.0245 mg/L on day 2. Day 1 chromium concentrations ranged from 0.00238 mg/L to 0.00911 mg/L. Day 2 chromium concentrations ranged from 0.0105 mg/L to
Water Quality Report #11-001, page 8
0.0349 mg/L. Lead concentrations ranged from 0.0074 mg/L to 0.0103 mg/L on day 1 and 0.00667 mg/L to 0.0137 mg/L on day 2. Nickel concentrations on day 1 ranged from 0.00401 mg/L on day 1 to 0.00562 mg/L on day 2 and 0.00398 mg/L to 0.0196 mg/L on day 2. Cadmium was the only metal that was not detected in wastewater samples; two of three samples on day 1 were non‐detect. The third composite sample was just above the detection limit at 0.00037 mg/L. All cadmium concentrations were detected on day 2, ranging from 0.000757 mg/L to 0.0176 mg/L. Total nitrogen concentrations were calculated by adding TKN‐nitrogen concentrations to nitrate+nitrite‐nitrogen concentrations. Day 1 concentrations for total nitrogen ranged from 9.15 mg/L to 11.4 mg/L (Table 3). Day 2 concentrations ranged from 19.1 mg/L to 24.4 mg/L. Although concentration variability was low for composite samples analyzed for each sample day, there was a roughly 50% difference in concentrations between day 1 and day 2. Part of this difference is a result of the difference in water volume used for each wash each day. Phosphorus concentrations on day 1 ranged between 1.9 mg/L and 2.6 mg/L (Table 3). On day 2, phosphorus concentrations ranged between 2.8 mg/L and 3.4 mg/L. Like total nitrogen, total phosphorus concentrations were higher in the day 2 composites which can also be attributed to the difference in water volume used for each wash each day. High organic concentrations were measured in the composite samples. BOD samples from day 1 were reported as >77 mg/L and >78 mg/L (Table 3) because of insufficient dilution at the laboratory. BOD concentrations were variable on day 2, ranging from 130 mg/L to 310 mg/L. Like BOD, TOC was also high with concentrations ranging from 110 mg/L to 240 mg/L on day 1 and 200 mg/L to 330 mg/L on day 2. Elevated BOD and TOC can adversely affect DO concentrations. The City of Durham currently has streams on the state’s 303(d) list for DO. TSS concentrations ranged from 180 mg/L to 400 mg/L on day 1 and 310 mg/L to 530 mg/L on day 2. Elevated TSS concentrations can adversely affect turbidity. The City of Durham currently has streams on the state’s 303(d) list for turbidity. Chloride concentrations ranged from 23 mg/L to 27 mg/L on day 1 and 16 to 82 mg/L on day 2. The NC DWQ’s surface water quality standard for chloride is 230 mg/L.

Water Quality Report #11-001, page 9
Table 2. Duplicate composite sample results. Differences greater than 10% between the composite sample and duplicate sample are highlighted in yellow. “B” qualifiers indicate the analyte was detected in the associated method blank. “J” qualifiers indicate the reported value is between the laboratory method detection limit and the laboratory reporting limit. “U” qualifiers indicate the analyte was analyzed for but not detected to the level shown.

Water Quality Report #11-001, page 10
Table 3. Composite sample summary with duplicate data. MCW-04 is the duplicate of MCW-02. MCW-08 is the duplicate of MCW-07. “B” qualifiers indicate the analyte was detected in the associated method blank. “J” qualifiers indicate the reported value is between the laboratory method detection limit and the laboratory reporting limit. “U” qualifiers indicate the analyte was analyzed for but not detected to the level shown.
Analyte Sample Day
Composite Number
Number of Vehicles in Composite
Water Use per Wash
(L)
Composite Concentration
(mg/L) Load per
Vehicle (mg)
Zinc
Day 1
MCW‐01 4 20.8 1.49 31.02
MCW‐02 5 15.1 1.45 21.96
MCW‐03 5 15.1 1.83 27.71
MCW‐04 5 15.1 1.42 21.50
Day 2
MCW‐05 4 18.9 2.74 51.86
MCW‐06 4 23.7 1.19 28.15
MCW‐07 3 26.5 2.68 71.01
MCW‐08 3 26.5 2.68 71.01
Copper
Day 1
MCW‐01 4 20.8 0.722 15.03
MCW‐02 5 15.1 0.683 10.34
MCW‐03 5 15.1 1.79 27.10
MCW‐04 5 15.1 0.672 10.18
Day 2
MCW‐05 4 18.9 1.570 B 29.72
MCW‐06 4 23.7 0.257 B 6.08
MCW‐07 3 26.5 1.280 B 33.92
MCW‐08 3 26.5 1.280 B 33.92
Manganese
Day 1
MCW‐01 4 20.8 0.152 3.16
MCW‐02 5 15.1 0.285 4.32
MCW‐03 5 15.1 0.518 7.84
MCW‐04 5 15.1 0.274 4.15
Day 2
MCW‐05 4 18.9 0.581 11.00
MCW‐06 4 23.7 0.183 4.33
MCW‐07 3 26.5 0.354 9.38
MCW‐08 3 26.5 0.361 9.57
Antimony
Day 1
MCW‐01 4 20.8 0.00261 0.05
MCW‐02 5 15.1 0.00463 0.07
MCW‐03 5 15.1 0.0186 0.28
MCW‐04 5 15.1 0.00454 0.07
Day 2
MCW‐05 4 18.9 0.0245 0.46
MCW‐06 4 23.7 0.00382 0.09
MCW‐07 3 26.5 0.04 1.06
MCW‐08 3 26.5 0.0395 1.05

Water Quality Report #11-001, page 11
Table 3 (continued.)
Analyte Sample Day
Composite Number
Number of Vehicles in Composite
Water Use per Wash
(L)
Composite Concentration
(mg/L) Load per
Vehicle (mg)
Chromium
Day 1
MCW‐01 4 20.8 0.00238 0.05
MCW‐02 5 15.1 0.00539 0.08
MCW‐03 5 15.1 0.00911 0.14
MCW‐04 5 15.1 0.00502 0.08
Day 2
MCW‐05 4 18.9 0.0349 0.66
MCW‐06 4 23.7 0.0106 0.25
MCW‐07 3 26.5 0.0105 0.28
MCW‐08 3 26.5 0.0107 0.28
Lead
Day 1
MCW‐01 4 20.8 0.0074 0.15
MCW‐02 5 15.1 0.00838 0.13
MCW‐03 5 15.1 0.0103 0.16
MCW‐04 5 15.1 0.00861 0.13
Day 2
MCW‐05 4 18.9 0.0136 0.26
MCW‐06 4 23.7 0.00667 0.16
MCW‐07 3 26.5 0.0119 0.32
MCW‐08 3 26.5 0.0137 0.36
Nickel
Day 1
MCW‐01 4 20.8 0.00562 0.12
MCW‐02 5 15.1 0.00409 0.06
MCW‐03 5 15.1 0.00441 0.07
MCW‐04 5 15.1 0.00401 0.06
Day 2
MCW‐05 4 18.9 0.0196 0.37
MCW‐06 4 23.7 0.00398 0.09
MCW‐07 3 26.5 0.00938 0.25
MCW‐08 3 26.5 0.00937 0.25
Cadmium
Day 1
MCW‐01 4 20.8 0.00037 J 0.01
MCW‐02 5 15.1 0.00036 U 0.01
MCW‐03 5 15.1 0.00036 U 0.01
MCW‐04 5 15.1 0.00039 J 0.01
Day 2
MCW‐05 4 18.9 0.000757 J 0.01
MCW‐06 4 23.7 0.00389 0.09
MCW‐07 3 26.5 0.0164 0.43
MCW‐08 3 26.5 0.0176 0.47

Water Quality Report #11-001, page 12
Table 3 (continued.)
Analyte Sample Day
Composite Number
Number of Vehicles in Composite
Water Use per Wash
(L)
Composite Concentration
(mg/L) Load per
Vehicle (mg)
Total Nitrogen
Day 1
MCW‐01 4 20.8 11.4 B 237.3
MCW‐02 5 15.1 9.86 B 149.3
MCW‐03 5 15.1 9.15 B 138.5
MCW‐04 5 15.1 9.98 B 151.1
Day 2
MCW‐05 4 18.9 24.4 D 461.8
MCW‐06 4 23.7 21.6 D 511.0
MCW‐07 3 26.5 19.1 D 506.1
MCW‐08 3 26.5 19.1 D 506.1
Total Phosphorus
Day 1
MCW‐01 4 20.8 2.6 54.1
MCW‐02 5 15.1 2.5 37.9
MCW‐03 5 15.1 1.9 28.8
MCW‐04 5 15.1 2.5 37.9
Day 2
MCW‐05 4 18.9 2.8 D 53.0
MCW‐06 4 23.7 2.9 D 68.6
MCW‐07 3 26.5 3.4 D 90.1
MCW‐08 3 26.5 3.2 D 84.8
Biochemical Oxygen Demand
Day 1
MCW‐01 4 20.8 >77 >1603
MCW‐02 5 15.1 >78 >1178
MCW‐03 5 15.1 >78 >1178
MCW‐04 5 15.1 >78 >1178
Day 2
MCW‐05 4 18.9 130 2461
MCW‐06 4 23.7 200 4732
MCW‐07 3 26.5 310 8214
MCW‐08 3 26.5 200 5300
Total Organic Carbon
Day 1
MCW‐01 4 20.8 170 D 3539
MCW‐02 5 15.1 240 D 3634
MCW‐03 5 15.1 110 D 1666
MCW‐04 5 15.1 140 D 2120
Day 2
MCW‐05 4 18.9 330 D 6246
MCW‐06 4 23.7 220 5205
MCW‐07 3 26.5 210 D 5565
MCW‐08 3 26.5 200 D 5300

Water Quality Report #11-001, page 13
Table 3 (continued).
Analyte Sample Day
Composite Number
Number of Vehicles in Composite
Water Use per Wash
(L)
Composite Concentration
(mg/L) Load per
Vehicle (mg)
Total Suspended
Solids
Day 1
MCW‐01 4 20.8 220 4580
MCW‐02 5 15.1 180 2725
MCW‐03 5 15.1 400 6057
MCW‐04 5 15.1 200 3028
Day 2
MCW‐05 4 18.9 530 10031
MCW‐06 4 23.7 310 7334
MCW‐07 3 26.5 320 8479
MCW‐08 3 26.5 320 8479
Chloride
Day 1
MCW‐01 4 20.8 27 562
MCW‐02 5 15.1 24 363
MCW‐03 5 15.1 23 348
MCW‐04 5 15.1 24 363
Day 2
MCW‐05 4 18.9 18 341
MCW‐06 4 23.7 16 379
MCW‐07 3 26.5 82 2173
MCW‐08 3 26.5 18 477
Table 4 compares pollutant concentrations of untreated domestic wastewater reported by Metcalf and Eddy (2003), untreated domestic wastewater reported by Durham’s Water Reclamation Facilities (WRFs), and mobile commercial car wash wastewater generated from this study (Table 4). No metals concentrations were reported in the Metcalf and Eddy report. However, mean metals concentrations in mobile commercial car wash wastewater far exceeded mean metals concentrations in untreated wastewater from Durham’s WRFs (as much as several orders of magnitude). Nutrient concentrations under medium flow conditions were similar to the mean concentration of total nitrogen and total phosphorus in Durham’s untreated domestic wastewater. Nutrient concentrations were roughly one third the concentration of medium strength wastewater and just slightly less than low strength wastewater. Mobile car wash wastewater has higher BOD5 than untreated domestic wastewater under medium flow conditions, but less than that of high flow conditions. The mean concentration of chloride in mobile car wash wastewater is similar to the concentration of chloride in low flow conditions of untreated domestic wastewater. However, mobile car wash wastewater has higher concentrations of TSS and TOC than untreated domestic wastewater in medium flow conditions.

Water Quality Report #11-001, page 14
Table 4: Untreated domestic wastewater compared to mobile commercial car wash wastewater. Metcalf and Eddy (2003) reported three categories of wastewater strength based on flow rates: low, medium, and high. Low strength is an estimate for a wastewater flow rate of 750 l/cap-day. Medium strength is an estimate for 460 l/cap-day. High strength is an estimate for a wastewater flow rate of 240 l/cap-day.
*Total Kjeldahl Nitrogen was calculated by summing organic nitrogen (as N) and Ammonium (as N) Survey To calculate annual pollutant loads from mobile commercial car washing operations, the annual number of cars washed by these mobile commercial vendors was needed. The first step to determine this number was to survey individual mobile commercial car washing companies operating in Durham. During this survey, questions were asked to determine the number of car washes the company would wash on an annual basis, where the company conducted business, and the type of clientele the company catered to. Companies selected for the survey were derived from the City’s “compliance demonstration” list. Any company that performed mobile commercial car washing in Durham was required to demonstrate to Stormwater Services staff that they could operate in accordance to the ordinance prior to receiving a business license. This list contained each company legally operating in the City. At the time of this study, there were 50 businesses on the compliance demonstration list. Twenty‐one of these businesses responded to the survey providing annual car wash estimates. Companies that did not respond to the survey but had a current business license in combination with an active company voicemail, company website or Facebook account, or were observed in the field by Stormwater Services staff, were considered an actively operating company in the City. Of the 29 companies that did not respond to the survey 16 were considered active.

Water Quality Report #11-001, page 15
Each business was then classified as rental, contract, executive, full‐time, or part‐time. These classifications allowed for a more thorough evaluation of the types of companies performing mobile commercial car washing in the City and to assign annual car wash numbers to non‐respondents to the survey. Classifications were based on the customer market and business frequency of various car washers. Any company with a business address outside of Durham or performed car washing as a secondary component of their business was classified as “part‐time”. Based on survey results, an estimated 43,356 cars were washed in 2011 by mobile commercial car washers (Figure 2). When assessing the number of washes by company type, an interesting finding emerged. In Durham, over half of all washes (23,080) were performed by rental car companies. But of the 37 active businesses operating in Durham, only three are rental car companies.
Figure 2. Estimated number of mobile commercial car washes performed in the City of Durham by rental car companies and non-rental car companies in 2011. Annual Pollutant Loads from Mobile Commercial Car Washes in Durham For annual load analysis, loads were calculated for each composite resulting in a total of six annual loads for each analyte (three each day). The mean and 95% upper and lower confidence limits were then calculated based on the six annual load calculations. The range for each parameter described in this section is the upper and lower confidence limit. The differences between the upper and lower confidence limits were large. This difference can be attributed to the low number of data points used in the calculation and the wide range of calculated load values. Of the metals, zinc and copper had the highest annual loads with lesser amounts of manganese, antimony, chromium, lead, nickel, and cadmium (Figure 3). Annual zinc loads ranged from 1.8 lbs to 5.6 lbs with an average of 3.7 lbs. Annual copper loads

Water Quality Report #11-001, page 16
ranged from 0.8 lbs to 3.0 lbs with an average of 1.9 lbs. Each of the other metals had loads of less than one pound. Annual total nitrogen loads ranged from 14.0 lbs to 49.8 lbs with a mean load of 31.9 lbs (Figure 3). Annual total phosphorus loads ranged from 3.1 lbs to 7.5 lbs with a mean load of 5.3 lbs. Annual loads calculated from the day 2 composites were roughly twice as high as those calculated from the day 1 composites. TSS, BOD, TOC, and Chloride had the highest annual loads of all analytes. TSS ranged from 358 lbs to 890 lbs with an average of 625 lbs. BOD ranged from 442 lbs to 1179 lbs with an average of 491 lbs. TOC ranged from 243 lbs to 581 lbs with an average of 412 lbs. The chloride load calculated from one composite, MCW‐08, was over four times higher than those of the other composites. This resulted in a lower confidence limit that was below zero. Because there cannot be a negative load, this study reports the upper confidence limit for chloride load as 139 lbs. The lower limit was 0 lbs. The average annual chloride load was 66 lbs. Calculated loads were generally higher and more variable on day 2 for most of the analytes evaluated during this study. The company that participated on day 1 washed the vehicles of normal clientele from the public. The second company, which was paid for each wash by the City, had less volume of normal clientele and resorted to performing washes on vehicles that may not have ordinarily been washed. There was a five year difference in the average model year of vehicles

Water Quality Report #11-001, page 17
Figure 3. Annual nutrient loads from mobile commercial car wash wastewater. Each red plus represents the load calculated from a composite. The solid line is the mean of all six composites. The upper dashed line is the 95% upper confidence limit. The lower dashed line is the 95% lower confidence limit.

Water Quality Report #11-001, page 18
Figure 4. Annual nutrient loads from mobile commerical car wash wastewater. Each red plus represents the load calculated from a composite. The solid line is the mean of all six composites. The upper dashed line is the 95% upper confidence limit. The lower dashed line is the 95% lower confidence limit.
Figure 5. Annual loads of conventional pollutants from mobile commercial car wash wastewater. Each red plus represents the load calculated from a composite. The solid line is the mean of all six composites. The upper dashed line is the 95% upper confidence limit. The lower dashed line is the 95% lower confidence limit.

Water Quality Report #11-001, page 19
washed between the two sample days (1997 on day 1 and 2002 on day 2). The oldest model vehicle washed on day 1 was 1993. On day 2 there were two vehicles from 1986 and one from 1987.
SUMMARY
The City of Durham performed this study to quantify pollutant loads associated with mobile commercial car washes in the City of Durham. Composite samples were collected from two companies on two separate days for metals, nutrients, TSS, BOD, TOC, and chloride. The major findings of this study are:
Several pollutant concentrations in mobile commercial car wash wastewater are similar to or higher than untreated domestic wastewater
Annual loads were highest for TSS (625 lbs/year), BOD (491 lbs/year), TOC (412 lbs/year), and chloride (66 lbs/year)
Annual total nitrogen loads were 31.9 lbs/year and total phosphorus loads were 5.3 lbs/year
Zinc and copper had the highest annual metals loads (3.7 lbs/year and 1.9 lbs/year, respectively)
No PAHs were detected in any water samples, which may have been a result of any PAH present not being in solution at the time of sample collection or analysis
Future sampling efforts should include sampling wastewater from applicable rental car companies. These companies account for over half of all mobile commercial car washes in the City of Durham. Having data from these companies would allow for a more accurate estimate of annual load estimates by mobile commercial car washers.
REFERENCES
City of Durham, 2011. Evaluation of Pollutants in Wastewater Generated by Mobile
Car Washing Operations in Durham, NC Quality Assurance Project Plan. Metcalf and Eddy, Inc., G. Tchobanoglous, F. L. Burton and H. D. Stensel, 2003.
Wastewater Engineering: Treatment & Reuse. McGraw Hill, New York, NY, ISBN‐13: 978‐0070418783