Embed Size (px)
Citation preview
Evaluation of Nitrification Kinetics for a 2.0 MGD IFAS Process Demonstration
Wesley Allan Thomas
Thesis submitted to the faculty of Virginia Polytechnic Institute and State University in partial
fulfillment of the requirements for the degree of
MASTER OF SCIENCE
in
ENVIRONMENTAL ENGINEERING
Charles B. Bott
Gregory Boardman
John Novak
March 30, 2009
Blacksburg, Virginia
Keywords: IFAS; Nitrification; Biofilm; NOB; AOB
Evaluation of Nitrification Kinetics for a 2.0 MGD IFAS Process Demonstration
Wesley Allan Thomas
Abstract
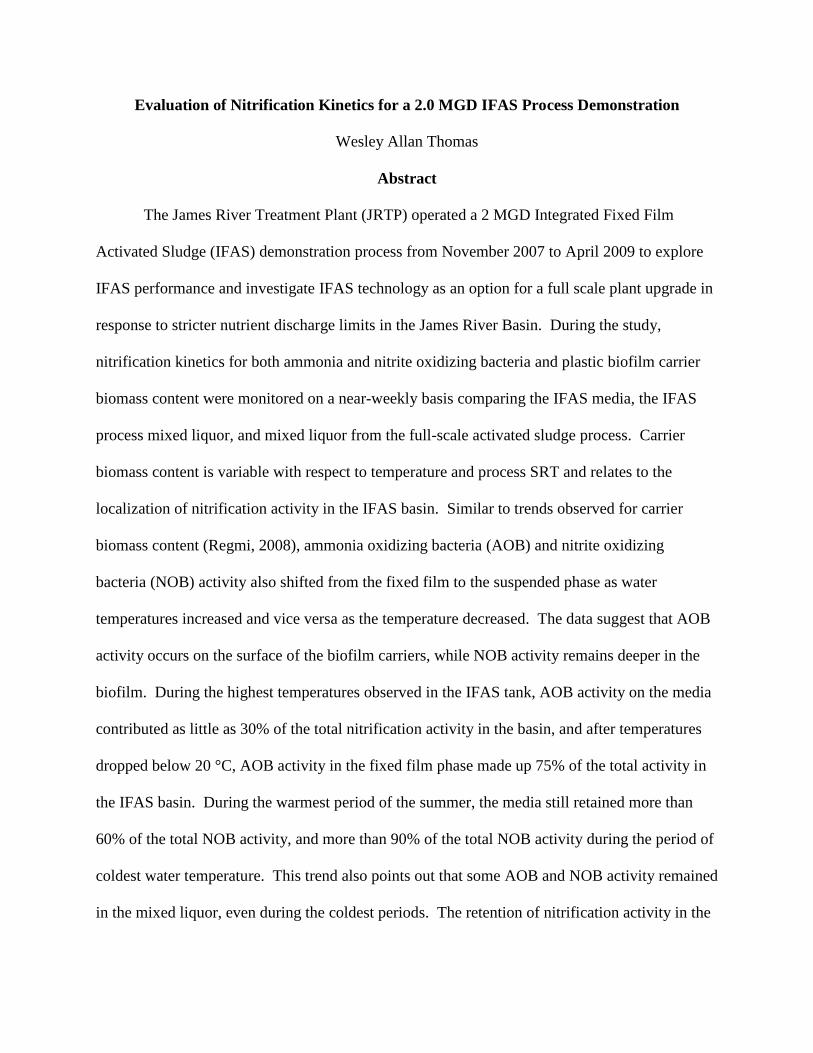
The James River Treatment Plant (JRTP) operated a 2 MGD Integrated Fixed Film
Activated Sludge (IFAS) demonstration process from November 2007 to April 2009 to explore
IFAS performance and investigate IFAS technology as an option for a full scale plant upgrade in
response to stricter nutrient discharge limits in the James River Basin. During the study,
nitrification kinetics for both ammonia and nitrite oxidizing bacteria and plastic biofilm carrier
biomass content were monitored on a near-weekly basis comparing the IFAS media, the IFAS
process mixed liquor, and mixed liquor from the full-scale activated sludge process. Carrier
biomass content is variable with respect to temperature and process SRT and relates to the
localization of nitrification activity in the IFAS basin. Similar to trends observed for carrier
biomass content (Regmi, 2008), ammonia oxidizing bacteria (AOB) and nitrite oxidizing
bacteria (NOB) activity also shifted from the fixed film to the suspended phase as water
temperatures increased and vice versa as the temperature decreased. The data suggest that AOB
activity occurs on the surface of the biofilm carriers, while NOB activity remains deeper in the
biofilm. During the highest temperatures observed in the IFAS tank, AOB activity on the media
contributed as little as 30% of the total nitrification activity in the basin, and after temperatures
dropped below 20 °C, AOB activity in the fixed film phase made up 75% of the total activity in
the IFAS basin. During the warmest period of the summer, the media still retained more than
60% of the total NOB activity, and more than 90% of the total NOB activity during the period of
coldest water temperature. This trend also points out that some AOB and NOB activity remained
in the mixed liquor, even during the coldest periods. The retention of nitrification activity in the
iii
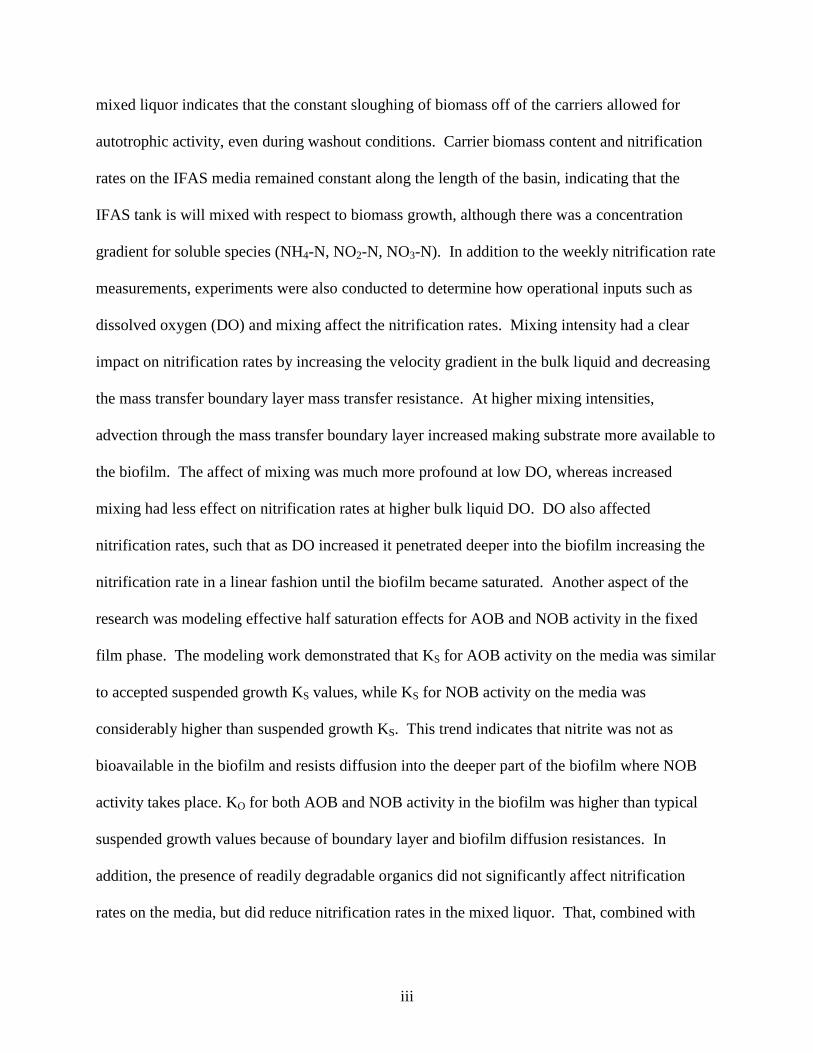
mixed liquor indicates that the constant sloughing of biomass off of the carriers allowed for
autotrophic activity, even during washout conditions. Carrier biomass content and nitrification
rates on the IFAS media remained constant along the length of the basin, indicating that the
IFAS tank is will mixed with respect to biomass growth, although there was a concentration
gradient for soluble species (NH4-N, NO2-N, NO3-N). In addition to the weekly nitrification rate
measurements, experiments were also conducted to determine how operational inputs such as
dissolved oxygen (DO) and mixing affect the nitrification rates. Mixing intensity had a clear
impact on nitrification rates by increasing the velocity gradient in the bulk liquid and decreasing
the mass transfer boundary layer mass transfer resistance. At higher mixing intensities,
advection through the mass transfer boundary layer increased making substrate more available to
the biofilm. The affect of mixing was much more profound at low DO, whereas increased
mixing had less effect on nitrification rates at higher bulk liquid DO. DO also affected
nitrification rates, such that as DO increased it penetrated deeper into the biofilm increasing the
nitrification rate in a linear fashion until the biofilm became saturated. Another aspect of the
research was modeling effective half saturation effects for AOB and NOB activity in the fixed
film phase. The modeling work demonstrated that KS for AOB activity on the media was similar
to accepted suspended growth KS values, while KS for NOB activity on the media was
considerably higher than suspended growth KS. This trend indicates that nitrite was not as
bioavailable in the biofilm and resists diffusion into the deeper part of the biofilm where NOB
activity takes place. KO for both AOB and NOB activity in the biofilm was higher than typical
suspended growth values because of boundary layer and biofilm diffusion resistances. In
addition, the presence of readily degradable organics did not significantly affect nitrification
rates on the media, but did reduce nitrification rates in the mixed liquor. That, combined with

iv
low chemical oxygen demand (COD) uptake rates indicates that little heterotrophic activity is
occurring on the media.

v
Acknowledgements
I would like to sincerely thank Dr. Charles Bott, my Thesis advisor, for his guidance and
support over the past years. Charles played a key role in influencing me to pursue graduate
studies and have provided valuable insight to every aspect of my graduate work.
Funding for this project was provided by the Hampton Roads Sanitation District. Their
support for this research is greatly appreciated. I would like to offer a special thanks to David
Waltrip, Bob Rutherford, Rick Baumler, Danny Barker, Jesse DeLuna, all of the HRSD
employees at the James River Treatment Plant, and all of the scientists that assisted with the
research.
I would like to acknowledge Dr. Gregory Boardman and Dr. John Novak for serving on
my committee and offering support and comments on my research.
I also express appreciation for Dr. Gary Schafran, Dr. Margaret Muholland, and Puskar
Regmi at ODU for their contribution to the research work and allowing the use of facilities
crucial to the success of the project.
In addition, I would like to offer my thanks to Ameet Pinto for helping with the
molecular work done in conjunction with the nitrification kinetics work.
I would also like to extend my appreciation to Jim McQuarrie at Ch2MHill for his
support and guidance with my research work.
Finally, I want to thank Rich Jones at ENVIROSIM for his help and participation with
the research and modeling work associated with the research effort.
vi
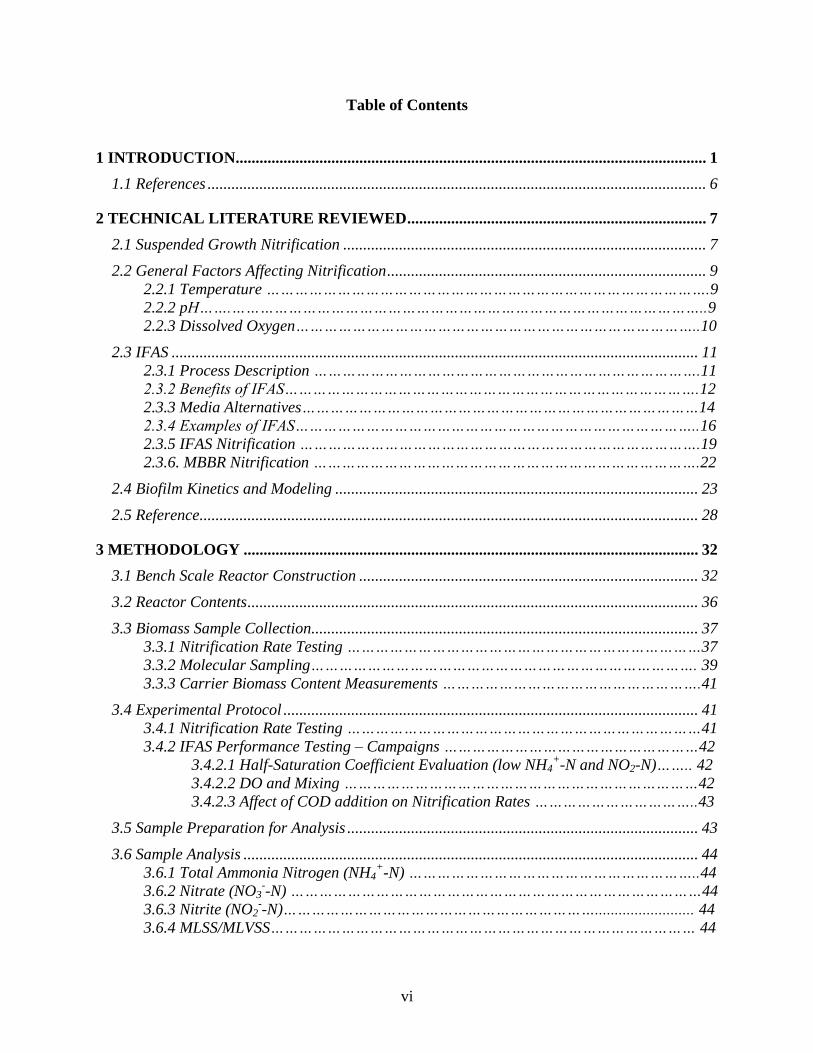
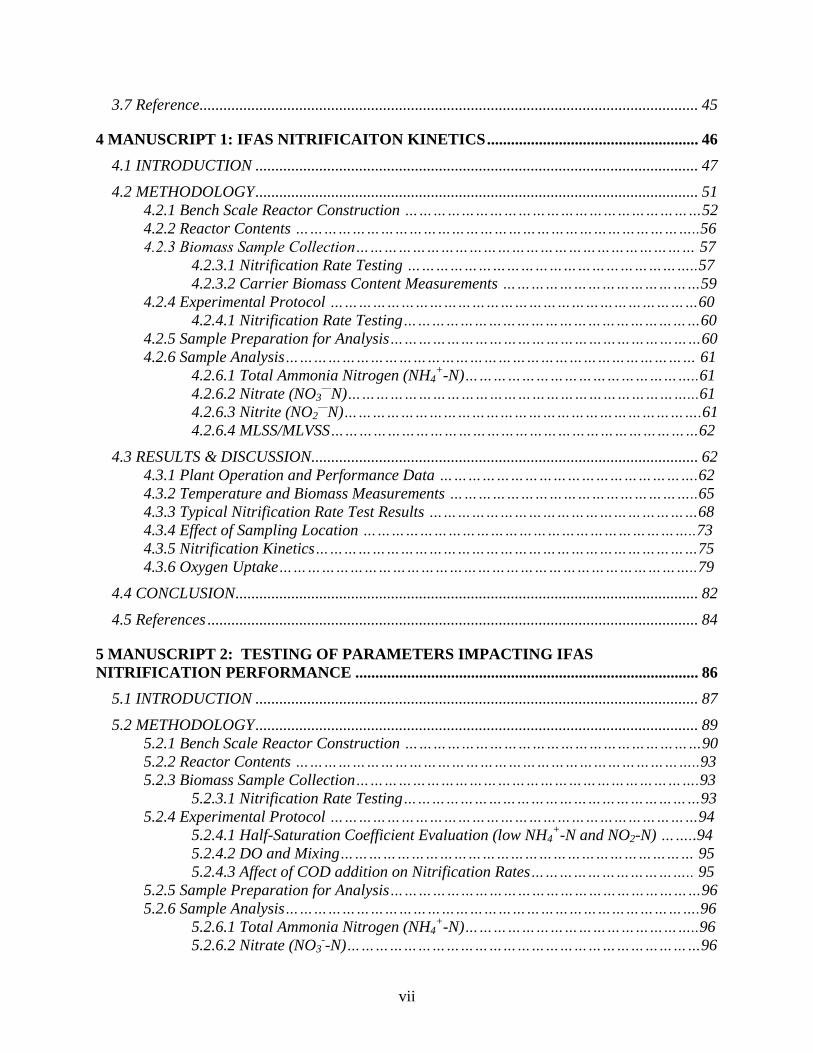
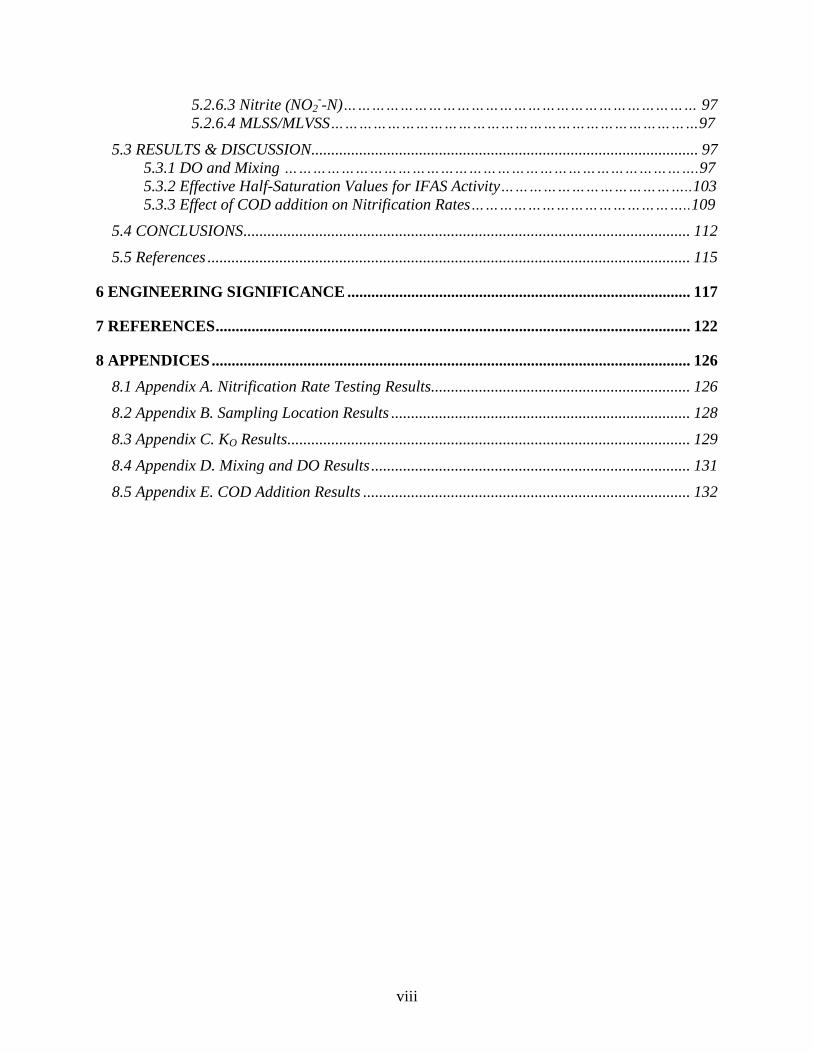
Table of Contents
1 INTRODUCTION...................................................................................................................... 1
1.1 References ............................................................................................................................. 6
2 TECHNICAL LITERATURE REVIEWED ........................................................................... 7
2.1 Suspended Growth Nitrification ........................................................................................... 7
2.2 General Factors Affecting Nitrification ................................................................................ 9
2.2.1 Temperature ………………………………………………………………………………….9
2.2.2 pH…….………………………………………………………………………………………..9
2.2.3 Dissolved Oxygen…………………………………………………………………………..10
2.3 IFAS .................................................................................................................................... 11
2.3.1 Process Description ……………………………………………………………………….11
2.3.2 Benefits of IFAS…………………………………………………………………………….12
2.3.3 Media Alternatives…………………………………………………………………………14
2.3.4 Examples of IFAS…………………………………………………………………………..16
2.3.5 IFAS Nitrification ………………………………………………………………………….19
2.3.6. MBBR Nitrification ……………………………………………………………………….22
2.4 Biofilm Kinetics and Modeling ........................................................................................... 23
2.5 Reference............................................................................................................................. 28
3 METHODOLOGY .................................................................................................................. 32
3.1 Bench Scale Reactor Construction ..................................................................................... 32
3.2 Reactor Contents ................................................................................................................. 36
3.3 Biomass Sample Collection................................................................................................. 37
3.3.1 Nitrification Rate Testing …………………………………………………………………37
3.3.2 Molecular Sampling………………………………………………………………………. 39
3.3.3 Carrier Biomass Content Measurements ……………………………………………….41
3.4 Experimental Protocol ........................................................................................................ 41
3.4.1 Nitrification Rate Testing …………………………………………………………………41
3.4.2 IFAS Performance Testing – Campaigns ………………………………………………42
3.4.2.1 Half-Saturation Coefficient Evaluation (low NH4+-N and NO2-N)…….. 42
3.4.2.2 DO and Mixing …………………………………………………………………42
3.4.2.3 Affect of COD addition on Nitrification Rates ……………………………..43
3.5 Sample Preparation for Analysis ........................................................................................ 43
3.6 Sample Analysis .................................................................................................................. 44
3.6.1 Total Ammonia Nitrogen (NH4+-N) ……………………………………………………..44
3.6.2 Nitrate (NO3--N) ……………………………………………………………………………44
3.6.3 Nitrite (NO2--N)…………………………………………………………......................... 44
3.6.4 MLSS/MLVSS……………………………………………………………………………… 44
vii
3.7 Reference............................................................................................................................. 45
4 MANUSCRIPT 1: IFAS NITRIFICAITON KINETICS ..................................................... 46
4.1 INTRODUCTION ............................................................................................................... 47
4.2 METHODOLOGY ............................................................................................................... 51
4.2.1 Bench Scale Reactor Construction ………………………………………………………52
4.2.2 Reactor Contents …………………………………………………………………………..56
4.2.3 Biomass Sample Collection……………………………………………………………… 57
4.2.3.1 Nitrification Rate Testing ……………………………………………………..57
4.2.3.2 Carrier Biomass Content Measurements ……………………………………59
4.2.4 Experimental Protocol ……………………………………………………………………60
4.2.4.1 Nitrification Rate Testing………………………………………………………60
4.2.5 Sample Preparation for Analysis…………………………………………………………60
4.2.6 Sample Analysis…………………………………………………………………………… 61
4.2.6.1 Total Ammonia Nitrogen (NH4+-N)…………………………………………..61
4.2.6.2 Nitrate (NO3—
N)………………………………………………………………...61
4.2.6.3 Nitrite (NO2—
N)………………………………………………………………….61
4.2.6.4 MLSS/MLVSS……………………………………………………………………62
4.3 RESULTS & DISCUSSION................................................................................................. 62
4.3.1 Plant Operation and Performance Data ……………………………………………….62
4.3.2 Temperature and Biomass Measurements ……………………………………………..65
4.3.3 Typical Nitrification Rate Test Results …………………………………………………68
4.3.4 Effect of Sampling Location ……………………………………………………………..73
4.3.5 Nitrification Kinetics………………………………………………………………………75
4.3.6 Oxygen Uptake……………………………………………………………………………..79
4.4 CONCLUSION .................................................................................................................... 82
4.5 References ........................................................................................................................... 84
5 MANUSCRIPT 2: TESTING OF PARAMETERS IMPACTING IFAS
NITRIFICATION PERFORMANCE ...................................................................................... 86
5.1 INTRODUCTION ............................................................................................................... 87
5.2 METHODOLOGY ............................................................................................................... 89
5.2.1 Bench Scale Reactor Construction ………………………………………………………90
5.2.2 Reactor Contents …………………………………………………………………………..93
5.2.3 Biomass Sample Collection……………………………………………………………….93
5.2.3.1 Nitrification Rate Testing………………………………………………………93
5.2.4 Experimental Protocol ……………………………………………………………………94
5.2.4.1 Half-Saturation Coefficient Evaluation (low NH4+-N and NO2-N) ……..94
5.2.4.2 DO and Mixing………………………………………………………………… 95
5.2.4.3 Affect of COD addition on Nitrification Rates…………………………….. 95
5.2.5 Sample Preparation for Analysis…………………………………………………………96
5.2.6 Sample Analysis…………………………………………………………………………….96
5.2.6.1 Total Ammonia Nitrogen (NH4+-N)…………………………………………..96
5.2.6.2 Nitrate (NO3--N)…………………………………………………………………96
viii
5.2.6.3 Nitrite (NO2--N)………………………………………………………………… 97
5.2.6.4 MLSS/MLVSS……………………………………………………………………97
5.3 RESULTS & DISCUSSION................................................................................................. 97
5.3.1 DO and Mixing …………………………………………………………………………….97
5.3.2 Effective Half-Saturation Values for IFAS Activity…………………………………..103
5.3.3 Effect of COD addition on Nitrification Rates………………………………………..109
5.4 CONCLUSIONS ................................................................................................................ 112
5.5 References ......................................................................................................................... 115
6 ENGINEERING SIGNIFICANCE ...................................................................................... 117
7 REFERENCES ....................................................................................................................... 122
8 APPENDICES ........................................................................................................................ 126
8.1 Appendix A. Nitrification Rate Testing Results................................................................. 126
8.2 Appendix B. Sampling Location Results ........................................................................... 128
8.3 Appendix C. KO Results ..................................................................................................... 129
8.4 Appendix D. Mixing and DO Results ................................................................................ 131
8.5 Appendix E. COD Addition Results .................................................................................. 132
ix
List of Tables
Table 3-1. G value range for various mixing speeds and temperatures…………………….…….35
Table 4-1. G value range for various mixing speeds and temperatures…………………………..55
Table 4-2. AOB and NOB nitrification rate test results for January 12, 2009……………...……..73
Table 5-1. KO, KS, and µmax Data for Mixed Liquor……...……………………………………...103
Table 5-2. Diffusion coefficients for Nitrite, Ammonium, and Oxygen at 25 °C……………….105
Table 5-3. Summary of all KS experiments……………………………...................................…107
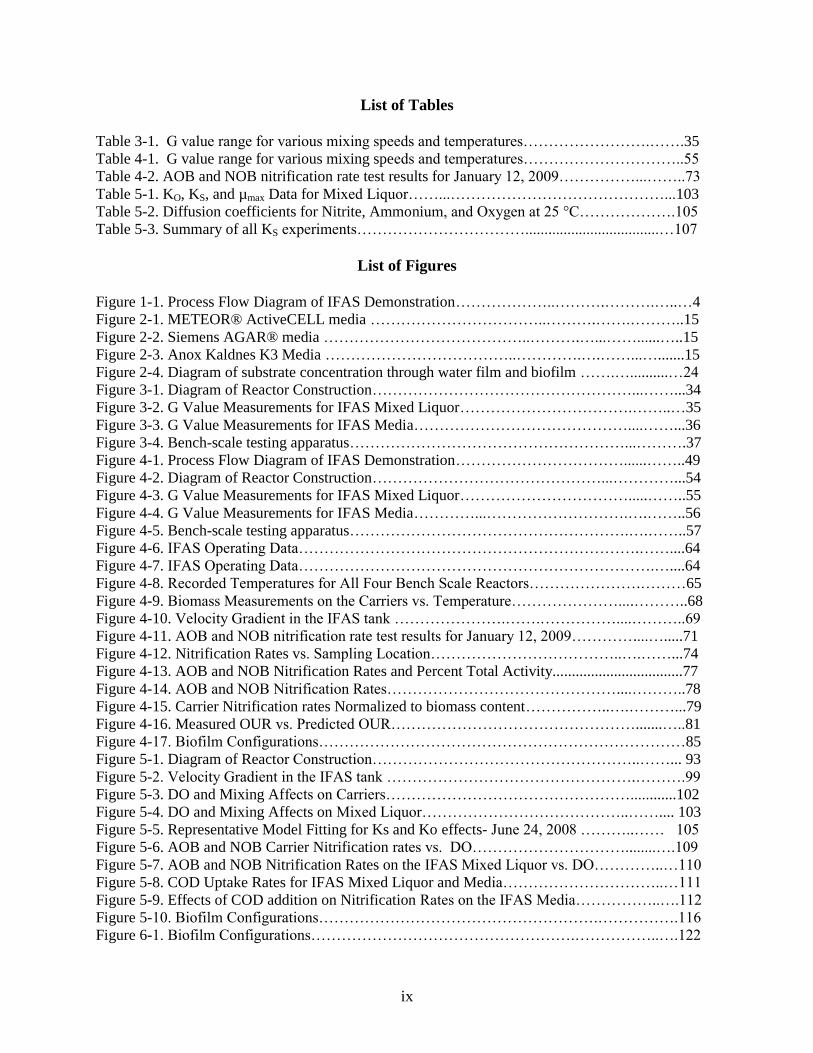
List of Figures
Figure 1-1. Process Flow Diagram of IFAS Demonstration………………..……….……….…..…4
Figure 2-1. METEOR® ActiveCELL media ……………………………..……….…….………..15
Figure 2-2. Siemens AGAR® media …………………………………..……….…...……......…..15
Figure 2-3. Anox Kaldnes K3 Media ………………………………..………….….……...….......15
Figure 2-4. Diagram of substrate concentration through water film and biofilm …….…..........…24
Figure 3-1. Diagram of Reactor Construction……………………………………………...……...34
Figure 3-2. G Value Measurements for IFAS Mixed Liquor…………………………….……..…35
Figure 3-3. G Value Measurements for IFAS Media……………………………………....……...36
Figure 3-4. Bench-scale testing apparatus………………………………………………...……….37
Figure 4-1. Process Flow Diagram of IFAS Demonstration……………………………......……..49
Figure 4-2. Diagram of Reactor Construction………………………………………...…………...54
Figure 4-3. G Value Measurements for IFAS Mixed Liquor…………………………….....……..55
Figure 4-4. G Value Measurements for IFAS Media…………...……………………….….……..56
Figure 4-5. Bench-scale testing apparatus……………………………………………….….……..57
Figure 4-6. IFAS Operating Data………………………………………………………….……....64
Figure 4-7. IFAS Operating Data…………………………………………………………….…....64
Figure 4-8. Recorded Temperatures for All Four Bench Scale Reactors………………….………65
Figure 4-9. Biomass Measurements on the Carriers vs. Temperature…………………....………..68
Figure 4-10. Velocity Gradient in the IFAS tank ………………….…….……………....………..69
Figure 4-11. AOB and NOB nitrification rate test results for January 12, 2009…………....….....71
Figure 4-12. Nitrification Rates vs. Sampling Location………………………………..….……...74
Figure 4-13. AOB and NOB Nitrification Rates and Percent Total Activity..................................77
Figure 4-14. AOB and NOB Nitrification Rates………………………………………....………..78
Figure 4-15. Carrier Nitrification rates Normalized to biomass content……………..….………...79
Figure 4-16. Measured OUR vs. Predicted OUR………………………………………….......…..81
Figure 4-17. Biofilm Configurations………………………………………………………………85
Figure 5-1. Diagram of Reactor Construction……………………………………………..……... 93
Figure 5-2. Velocity Gradient in the IFAS tank ………………………………………….……….99
Figure 5-3. DO and Mixing Affects on Carriers…………………………………………............102
Figure 5-4. DO and Mixing Affects on Mixed Liquor…………………………………..…….... 103
Figure 5-5. Representative Model Fitting for Ks and Ko effects- June 24, 2008 ………..…… 105
Figure 5-6. AOB and NOB Carrier Nitrification rates vs. DO…………………………........….109
Figure 5-7. AOB and NOB Nitrification Rates on the IFAS Mixed Liquor vs. DO…………..…110
Figure 5-8. COD Uptake Rates for IFAS Mixed Liquor and Media…………………………..…111
Figure 5-9. Effects of COD addition on Nitrification Rates on the IFAS Media……………..….112
Figure 5-10. Biofilm Configurations……………………………………………….…………….116
Figure 6-1. Biofilm Configurations…………………………………………….……………..….122
x
List of Abbreviations
AOB-Ammonia Oxidizing Bacteria
BNR-Biological Nutrient Removal
BOD5-5 day Biochemical Oxygen Demand
COD-Chemical Oxygen Demand
DO-Dissolved Oxygen
FISH-Fluorescent In-Situ Hybridization
G- Velocity Gradient
HRSD-Hampton Roads Sanitation District
IFAS-Integrated Fixed Film Activated Sludge
JRTP-James River Treatment Plant
KO-Dissolved Oxygen Half Saturation Coefficient
KS-Substrate Half Saturation Coefficient
MBBR-Moving Bed Biofilm Reactor
MGD-Million Gallons Per Day
MLSS-Mixed Liquor Suspended Solids
NOB-Nitrite Oxidizing bacteria
PFD-Process Flow Diagram
QPCR-Quantitative Polymerase Chain Reaction
SLR-Solids Loading Rate
SND- Simultaneous Nitrification/Denitrification
SOR-Surface Overflow Rate
SRT-Solids Residence Time
SVI-Sludge Volume Index
TN-Total Nitrogen
TSS-Total Suspended Solids
WPCP-Water Pollution Control Plant
WTF-Water Treatment Facility
WWTP-Wastewater Treatment Plant
µmax-Maximum Specific Growth Rate
1
1 INTRODUCTION
Stringent nitrogen limitations have been and will continue to be implemented for a
number of wastewater utilities discharging into salt water estuaries in the United States.
Nitrogen limits are becoming stricter to address a number of issues related to discharging
nutrients, namely surface water eutrophication, as well as ammonia toxicity. The need to control
algae blooms in the Chesapeake Bay is not a novel issue, but as Bay health continues to decline,
strict nitrogen limits from point sources are necessary to revitalize the Bay ecosystem. Many of
the treatment plants for which nitrogen removal is being considered are currently designed
primarily for biochemical oxygen demand (BOD5) and total suspended solids (TSS) removal,
although some plants achieve warm weather nitrification, and others must fully nitrify year-
round to meet ammonia limitations. Many of these plants do not have land available for an
expansion using conventional biological nutrient removal (BNR) activated sludge processes and
will need to explore alternative technologies in order to meet more stringent discharge limits.
One of these emerging technologies is Integrated Fixed Film Activated Sludge (IFAS)
with plastic, free-moving media. IFAS technology offers a number of benefits for plants having
to upgrade for stricter nutrient limits. IFAS allows plants to retro-fit and upgrade their existing
plant without significant new construction, which lowers capital costs and does not require
additional plant footprint area. IFAS also enables plants designed for partial nitrification, or
plants needing to expand to meet a growing demand, to achieve complete, year round
nitrification despite limiting cold temperature conditions with smaller aeration tanks and without
increasing the solids load to secondary clarifiers (Johnson et al. 2004; Yerrell et al. 2001).
2
In 2005, new regulations were implemented as part of the Chesapeake Bay 2000
Agreement which require Hampton Roads Sanitation District (HRSD) wastewater treatment
plants (WWTPs) discharging to the James River Basin to reduce the aggregate mass discharge of
total nitrogen (TN) to 6,000,000 lbs/year (Water Quality Management Planning Regulation).
HRSD staff concluded that biological nutrient removal with IFAS should be employed at the
16.7 MGD James River Treatment Plant (JRTP) as a cost effective strategy to help achieve this
aggregate goal, decreasing effluent TN at this facility to approximately 12 mg/L (annual
average).
However, IFAS remains a relatively new approach for boosting nitrogen removal
performance, and there are still a number of fundamental and applied aspects of this technology
that are not clearly understood. Process kinetics are not well defined with respect to variables
including dissolved oxygen (DO), mixing intensity/regime, temperature, and localization of
AOB and NOB activity. IFAS models that combine an IWA-style activated sludge model with a
fundamental non-empirical biofilm model (considering external mass transfer and multi-
component biofilm diffusion) have been developed, but calibrated with limited full-scale
experience. HRSD elected to conduct a demonstration-scale IFAS study at JRTP to evaluate the
performance of this process and to develop design criteria before implementation on a wider
scale. For this demonstration project, an existing single, fully-aerobic conventional aeration
basin with dedicated secondary clarification, which was previously operated to achieve
nitrification during warm weather months only, was converted to a 1.86 MGD (2.22 MGD max
month) IFAS train in an MLE configuration with a 50% fill of AnoxKaldnes plastic biofilm
carriers in the aerobic zone only (K3 with a specific surface area of 500 m2/m
3).

3
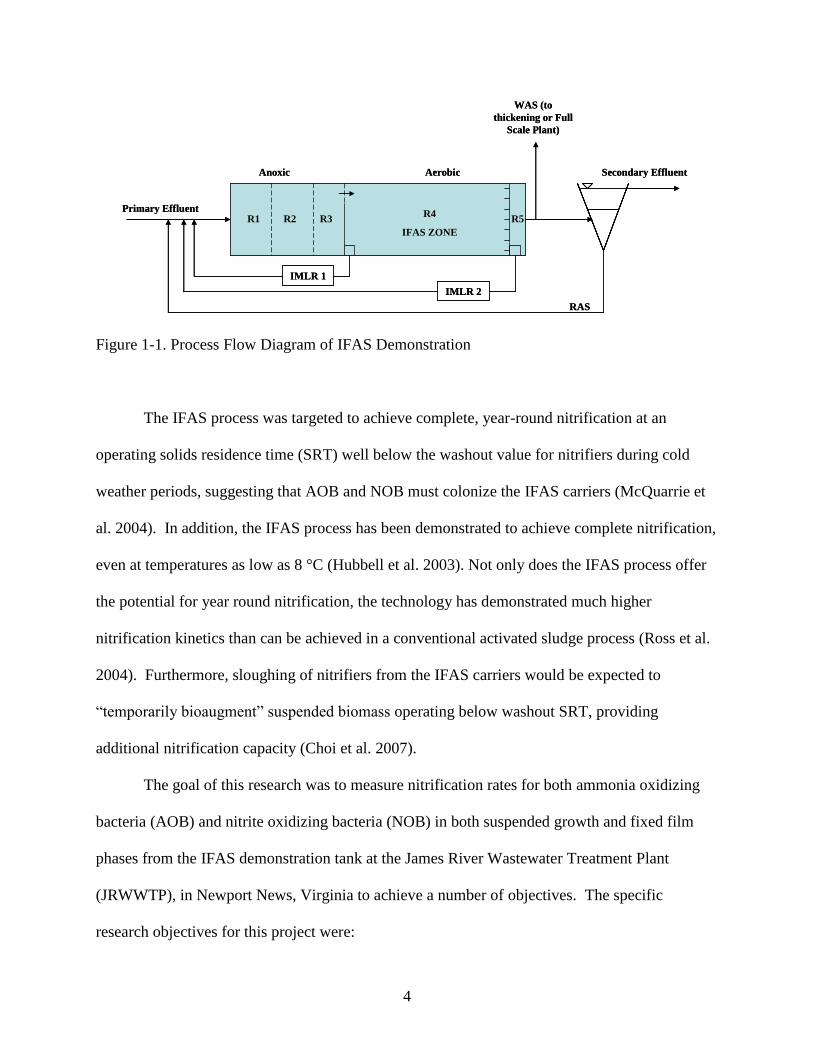
Figure 1-1 represents a process flow diagram (PFD) of the IFAS demonstration tank at
the JRTP. The demonstration is set up in the MLE fashion as shown below. The tank has two
internal mixed liquor recycle pumps that were operated to not only return mixed liquor to the
IFAS tank, but also to manage the distribution of media in the tank. For much of the duration of
the demonstration study, the majority of internal mixed liquor recycle was performed by IMLR
pump 1 to ensure that media concentrations in the IFAS tank were roughly homogeneous and to
prevent media accumulation near the screens. During plant operation, the flows through IMLR
pump 1 and IMLR pump 2 varied, but averaged as about 275% through IMLR pump 1 and 130%
through IMLR pump 2. Operating the two IMLR pumps in this fashion created some concern
with substrate short circuiting through IMLR pump 1, but after performing tracer testing, it was
determined that an insignificant amount of substrate recycle was occurring and that nitrate
recirculation to the anoxic zone was occurring. R1, R2, and R3 are all anoxic zones, and zone
R4 is the tank volume dedicated to IFAS. The smaller R5 zone is also aerobic, but does not
contain any IFAS media. For most of the duration of the demonstration the plant performed
Garrett wasting except for December 2008, when the plant also wasted some sludge from the
secondary clarifier. The WAS stream was also used to seed the full scale plant that was not
operated for complete nitrification. This seeding allowed nitrifiers to be present in the full scale
plant and enabled the full scale plant to achieve nitrification throughout the year.
4
R1 R2 R3R4
IFAS ZONE
R5
IMLR 2
IMLR 1
Anoxic Aerobic
RAS
Primary Effluent
Secondary Effluent
WAS (to
thickening or Full
Scale Plant)
R1 R2 R3R4
IFAS ZONE
R5
IMLR 2
IMLR 1
Anoxic Aerobic
RAS
Primary Effluent
Secondary Effluent
WAS (to
thickening or Full
Scale Plant)
Figure 1-1. Process Flow Diagram of IFAS Demonstration
The IFAS process was targeted to achieve complete, year-round nitrification at an
operating solids residence time (SRT) well below the washout value for nitrifiers during cold
weather periods, suggesting that AOB and NOB must colonize the IFAS carriers (McQuarrie et
al. 2004). In addition, the IFAS process has been demonstrated to achieve complete nitrification,
even at temperatures as low as 8 °C (Hubbell et al. 2003). Not only does the IFAS process offer
the potential for year round nitrification, the technology has demonstrated much higher
nitrification kinetics than can be achieved in a conventional activated sludge process (Ross et al.
2004). Furthermore, sloughing of nitrifiers from the IFAS carriers would be expected to
―temporarily bioaugment‖ suspended biomass operating below washout SRT, providing
additional nitrification capacity (Choi et al. 2007).
The goal of this research was to measure nitrification rates for both ammonia oxidizing
bacteria (AOB) and nitrite oxidizing bacteria (NOB) in both suspended growth and fixed film
phases from the IFAS demonstration tank at the James River Wastewater Treatment Plant
(JRWWTP), in Newport News, Virginia to achieve a number of objectives. The specific
research objectives for this project were:
5
Compare nitrification rates measured from January 2008 through January 2009 to find a clear
relationship between warm and cold weather conditions on nitrification rates on both the
IFAS carriers and IFAS mixed liquor, and compare these rates to mixed liquor from the full
scale unmodified aeration basins at the JRTP
Determine localization of AOB and NOB activity in both phases of the IFAS process
Achieve a better understanding of IFAS process kinetics
Evaluate the impact of mixing on nitrification rates
Measuring half saturation effects on the media to better understand mass transport issues for
ammonia, nitrite, and oxygen and calibrate existing models to optimize modeling of the IFAS
process and other biofilm processes
Measure the effect of COD addition on nitrification rates in the mixed liquor and on the
carriers
Other experimentation was conducted in conjunction with this testing to achieve
additional goals related to evaluating the IFAS process including:
Periodic nitrogen species profiling in the IFAS basin
Weekly biomass measurements on the IFAS media (carrier biomass content)
Florescent In Situ Hybridization (FISH) and quantitative polymeric chain reaction (QPCR) on
both the suspended portion and fixed portion of biomass in the IFAS tank sampled at regular
intervals throughout the nitrification rate testing (data not yet available; Pinto et al; 2009)
Tracer testing in the IFAS basin to determine mixing regime and whether short circuiting of
nutrients is occurring due to internal mixed liquor recycle placement (HRSD, 2008)
Normal process sampling was performed by HRSD to manage process performance and
optimize TN removal in the IFAS basin (HRSD, 2008)
6
1.1 References
Choi, N., Phillips, H., Johnson, T.L., Butler, R., Lauro, T. Pilot Testing Of MBBR And IFAS
Treatment Processes For Nitrification And Denitrification At The Mamaroneck WWTP.
Proceedings of the 80th
WEFTEC- National Conference of the Water Environment Federation,
San Diego, CA. 80: October 13-17, 2007.
Hubbell, S., McDowell, C. Cold Temperature BNR Using Integrated Fixed-Film Activated
Sludge (IFAS) Hybrid Technology. Proceedings of the 76th
WEFTEC- National Conference of
the Water Environment Federation. Los Angeles, CA, October 12-15, 2003.
Johnson, T., McQuarrie, J., Shaw, A. Integrated Fixed-Film Activated Sludge (IFAS): The New
Choice For Nitrogen Removal Upgrades In The United States. Proceedings of the 77th
WEFTEC- National Conference of the Water Environment Federation. New Orleans, LA,
October 2-6, 2004.
McQuarrie, J., Rutt, K., Seda, J., Haegh, M. Observations From The First Year of Full-Scale
Operation - The IFAS/BNR Process At The Broomfield Wastewater Reclamation Facility,
Broomfield, CO. Proceedings of the 77th
WEFTEC- National Conference of the Water
Environment Federation. New Orleans, LA, October 2-6, 2004.
Ross, D., Fernandes, W., Briggs, T., Kim, N., Booth, G., Neely, D., Welp, J. Integrated Fixed
Film Activated Sludge (IFAS) At The Lakeview WWTP: The Real Implementation Issues.
Proceedings of the 77th
WEFTEC- National Conference of the Water Environment Federation.
New Orleans, LA, October 2-6, 2004.
Water Quality Management Planning Regulation. Chapter 720. 9 VAC 25-820-70.
Yerrell, K., Gobbie, M., Dold, P., Jones, R., Sickerdick, L. Full-Scale Demonstration Of A Free-
Moving Media IFAS Process For Enhancing Nitrification Performance. Proceedings of the 74th
WEFTEC- National Conference of the Water Environment Federation. Atlanta, GA, October 13-
17, 2001.
7
2 TECHNICAL LITERATURE REVIEWED
2.1 Suspended Growth Nitrification
Nitrification is the process of oxidizing ammonia (NH4+-N) to nitrite (NO2
--N) and then
to nitrate (NO3--N). This biochemical process is important for a number of reasons, and as
nutrient limits continue to become more stringent, the demand for better technology will be
critical to the wastewater treatment field. Nitrification is a two step process that is performed by
two different genera of Gram-negative bacteria. Ammonia oxidizing bacteria (AOB) accomplish
the first part of the process by oxidizing ammonia to nitrite, and nitrite oxidizing bacteria (NOB)
work to complete the reaction and convert nitrite to nitrate. The bacteria Nitrosomonas is most
commonly associated with ammonia oxidation, although many other genera of autotrophic
bacteria have been identified as AOBs (Metcalf & Eddy, 2003; Onnis-Hayden et al. 2007). The
following reaction describes the ammonia oxidation reaction: NH4+ + 1.5 O2 NO2
- + H2O +
2H+. This reaction indicates that the production of hydrogen ions is a byproduct of the reaction
and, as a result, the consumption of alkalinity is associated with ammonia oxidation. The nitrite
oxidizing process is performed by a different set of autotrophic bacteria, most notably in
activated sludge cultures Nitrospira, though many other nitrite oxidizing genera are known
(Metcalf & Eddy, 2003; Onnis-Hayden et al. 2007). The chemical reaction describing the
oxidation of nitrite to nitrate is the following: NO2- + 0.5 O2 NO3
-. This reaction does not
indicate a consumption of alkalinity, as is the case for ammonia oxidation.
Nitrification occurs in two different forms in wastewater treatment plants. It can be
accomplished in suspended growth processes with long SRTs or in attached growth applications.
By using an attached growth process, the nitrification capability of the plant is no longer a
8
function of the SRT, like for suspended growth, and plants can operate at SRTs designed for
BOD removal and rely on the attached growth parts of the biological processes to achieve
nitrification. Suspended growth describes a free floating floc of bacteria suspended in the bulk
liquid it is in contact with, while attached growth refers to biomass that is attached to some
media support in the form of a biofilm. In the latter case, the biomass is immobile on the media.
Much work has been completed to quantify growth kinetics and Monod half saturation
effects of nitrifiers in suspended growth applications. Envirosim (2008) suggests that AOB
populations in activated sludge have a KS of 0.7 mg/L-N and a maximum specific growth rate
(μmax) of 0.9 day-1
. Environsim (2008) also suggests that NOB populations in activated sludge
have a KS of 0.05 mg/L-N and a μmax of 0.7 day-1
. Other kinetic parameters for AOB populations
that have been suggested are a μmax of 0.77 day-1
and KS of 1 mg/L-N with kinetic parameters for
NOB populations as μmax of 0.82 day-1
and KS of 1.3 mg/L-N (Grady et al. 1999). These two
sources do not agree about whether AOB or NOB populations are faster growing. This is most
likely because Grady et al. (1999) is using Nitrobacter as the primary NOB organism. While this
organism was widely accepted for a long time as the primary NOB, it is now apparent that
Nitrospira, a slower growing NOB, is the primary NOB (Onnis-Hayden et al. 2007). This
essentially means that AOB populations are faster growing organisms that are not quite as
sensitive to washout as NOB populations. Sen et al. (2007) reports that KS for nitrifiers growing
in a biofilm is as high as 2.1 mg/L-N. The KS values for AOB from all sources is about the same
meaning that AOB populations have a reasonable affinity for ammonia, but the KS values given
for NOB populations differs in the literature. A lower KS value indicates very high affinity for
nitrite, while a higher KS suggests only a moderate affinity.
9
2.2 General Factors Affecting Nitrification
The different mechanisms for nitrification in attached growth processes mean that
external factors such as pH, temperature, mixing and DO affect the nitrification capabilities of
the biomass in a way different from a more traditional suspended growth application.
2.2.1 Temperature
The role of temperature on the nitrification process when biofilms are involved is a bit
more complex than suspended growth processes, specifically because of the influence of
temperature on boundary layer and biofilm mass transfer. Temperature, in a suspended growth
application, affects the specific growth rate of the nitrifying bacteria, which limits the ability to
nitrify in a wastewater treatment plant and requires a lengthy SRT in order to ensure that these
nitrifiers are able to grow in the system and not washed out (Hubbell et al. 2003). For
submerged biofilm systems like IFAS, temperature affects diffusion rates through the boundary
layer and biofilm for both DO and substrate. Because of these factors, the Arrhenius equation
that is typically used to make temperature corrections to different growth parameters in the
Monod equation is not alone sufficient for adjusting growth kinetic coefficients.
2.2.2 pH
pH plays a role in the ability to nitrify for both AOB and NOB populations in both fixed
film and suspended growth environments. Overall, pH ranging between 7.2 and 9 has been
demonstrated to be the best for nitrification (Chen et al. 2002). Other evidence suggests that
relationship between pH and nitrification can be described as a bell-shaped curve for both AOB
and NOB populations (Park et al. 2007). This bell shaped curve indicates that the optimal pH for
10
AOB activity is 8.2 ± 0.3 and 7.9 ± 0.4 for NOB populations. The work by Park et al. (2007)
work also indicates that NOB populations are much more sensitive to pH changes than AOB
populations, resulting in a narrower bell-shaped curve.
2.2.3 Dissolved Oxygen
Dissolved oxygen is also a crucial parameter for consideration in nitrification for both
suspended and attached growth bacteria. Oxidation of ammonia and nitrite to nitrate requires a
significant amount of oxygen in both attached growth and suspended growth applications.
However, maintaining higher DO concentrations is required in an attached growth application,
mainly because of the requirement of transferring the oxygen through the boundary layer and the
biofilm. Oxygen diffusion through the biofilm occurs in the same fashion as substrate diffusion,
and despite higher DO concentrations in the bulk liquid, DO drops rapidly inside the biofilm and
may become a limiting factor in the nitrification process (Chen et al. 2005). KO values for both
AOB and NOB populations have been well documented in the past. Envirosim (2008) suggests
that AOB populations in activated sludge have a KO of 0.25 mg/L-O2 and that NOB populations
in activated sludge have a KO of 0.5 mg/L-O2. Peng et al. (2006) suggests a range of KO values
for both AOB and NOB populations of 0.2-0.4 mg/L-O2 and 1.2-1.5 mg/L O2, respectively.
Another KO value for AOB populations that has been suggested is 0.5 mg/L-O2 with a KO value
for NOB populations of 0.68 mg/L-O2 (Grady et al. 1999). It is well accepted that AOB
populations have a higher affinity for oxygen than NOB, and this is the basis for centrate
treatment processes such as SHARON and DEMON. This suggests that changes in operating
DO will affect NOB activity in mixed liquor more than AOB activity.
11
2.3 IFAS
2.3.1 Process Description
The IFAS process is comprised of a fixed film media, free moving or stationary,
combined with activated sludge. By allowing the fixed film phase to retain biomass in the basin,
the IFAS process can be operated at low SRTs and still achieve nitrification. By retaining
biomass in the fixed film, the IFAS process can still achieve full nitrification, even in cold
temperatures, because the nitrifiers in the basin can grow in the fixed film that has an effective
SRT controlled by the steady-state sloughing of biomass from the media. This is expected to be
much longer than that required for nitrifier growth even at very cold temperatures. The addition
of a fixed film media to an existing activated sludge process effectively increases the biomass in
the aeration basin without placing any additional load on the secondary clarifier (Johnson et al.
2004). By maintaining a low SRT in the IFAS basin, the process has also been credited with
better settling sludge with lower SVIs compared with conventional activated sludge processes
(McQuarrie et al. 2004).
The IFAS process has the potential to provide year round complete nitrification for plants
originally designed only for BOD5 removal or partial nitrification, assuming the oxygen demands
and tank design requirements (e.g. media retention screens) can be accommodated. This is made
possible by allowing autotrophs to grow in the fixed film phase while the activated sludge
process is still operated for BOD5 removal.
The volume, or percent fill, of plastic free-floating media varies for different plants,
depending on the plant’s treatment goals, and treatment capacity. Typically, IFAS tanks hold
anywhere between 30-60% fill by volume (Johnson et al. 2004). It is not uncommon for the
12
IFAS tank to be designed for a certain fill, but to operate at a lower media concentration until the
additional media is needed at a higher future flow rates (McQuarrie et al. 2004).
2.3.2 Benefits of IFAS
Upgrading wastewater treatment plants to achieve complete nitrification with
conventional activated sludge requires more tank volume and longer SRTs. A number of
benefits to the IFAS process exist. Nitrification can be limited at a wastewater treatment facility
by low temperatures, clarifier solids loading capacity, and insufficient tank volume to achieve
winter time nitrification (Randall et al. 2006). By adding a fixed film phase to activated sludge,
nitrification performance can be enhanced at low temperatures without expansions made to the
basin or secondary clarifier (Randall et al. 1996). By modifying existing tanks, it is possible to
implement IFAS into a wastewater treatment plant without new construction, greatly decreasing
the capital cost of the retrofit (Ross et al. 2004). Hubbell et al. (2003) investigated IFAS
performance in Soda Springs, CA where difficult terrain and land availability made any attempt
to expand the footprint of the existing package wastewater treatment plants impossible. In this
case, the IFAS process proved to be a cost effective and successful alternative to plant expansion
and enabled the local municipality to meet new and stricter nutrient discharge limits. In the
Annapolis WRF demonstration, the IFAS process using Ringlace media achieved much higher
nitrification rates than the control activated sludge per unit volume when the ammonia
concentrations were high enough to maintain a substantial nitrifier population (Randall et al.
1996). Randall et al. (1996) also notes that the greatest improvement of nitrification capacity
when compared to conventional activated sludge occurred at lower temperatures.
13
Johnson et al. (2004) notes that the IFAS process is also operated in the same way as
conventional activated sludge processes by controlling DO and process SRT and requires the
same amount of operator attention as a conventional activated sludge process. In many cases, an
IFAS upgrade requires less aerobic volume, resulting in the creation of an anoxic zone preceding
the aerobic zone with media to allow for more TN removal (Hubbell et al. 2004).
The main concern for plants expanding to accommodate larger flows, or better
nitrification, is the slow growth rate of the autotrophic nitrifiers. These organisms require a
much longer SRT then heterotrophic bacteria in activated sludge and are at risk of being washed
out of an aeration basin at low temperatures, or if the SRT is too short for the nitrifiers to
establish a presence in the mixed liquor (Grady et al. 1999, Jackson et al. 2007)). Related to this
issue is the MLSS concentration in an aeration tank and the load the biomass places on the
secondary clarifiers. Typically, mixed liquor concentrations range between 2500-3500 mg/L and
secondary clarifiers can then be designed around solids overflow rates (SOR) and solids loading
rates (SLR) within a set range (Grady et al. 1999). By maintaining low process SRT and lower
MLSS concentrations in the aeration basins, IFAS does not cause secondary clarifiers to become
overloaded because the additional biomass remains in the IFAS tank. (Johnson et al. 2004;
Yerrell et al. 2001) Secondary clarifier loading rates associated with the IFAS process are
remarkably lower than conventional activated sludge processes (Ross et al. 2004).
IFAS may also be credited with better sludge settling. Effluent TSS concentrations from
the Broomfield wastewater treatment plant demonstrated lower solids concentrations than
previously measured when only activated sludge was used to treat the wastewater McQuarrie et
al. 2004)). SVI measurements of the suspended growth sludge in the IFAS tank was also lower
than most of the previously measured and recorded SVIs at the same plant using only activated
14
sludge (McQuarrie et al. 2004). Ross et al. (2004) also reported improved sludge settleability
compared to conventional activated sludge during an IFAS demonstration study at the Lakeview
WWTP in Ontario.
2.3.3 Media Alternatives
IFAS technology appears in many forms, and a variety of media is available to choose
from. The different types of media include networks of string or rope that are suspended in the
water (sometimes known as rope or ring lace systems), free-floating sponges (e.g. Linpor), and
hard plastic media (Johnson et al. 2004). Each of these media technologies has advantages and
disadvantages. One difference is the biomass retention on a string system or free-floating sponge
and a hard plastic media. A thicker biofilm is able to grow on the string systems and free-
floating sponges, which may provide an anoxic zone within the biofilm and promote
denitrification, while biomass on the outside of the biofilm is responsible for most of the
nitrification. Hard plastic media, on the other hand, readily slough excess biomass while being
mixed in the IFAS tank, maintaining a more constant biomass concentration on the media, which
can be controlled by adjusting mixing intensity and DO concentrations in the tank (Johnson et al.
2004). The hard plastic media comes in a number of varieties manufactured by different
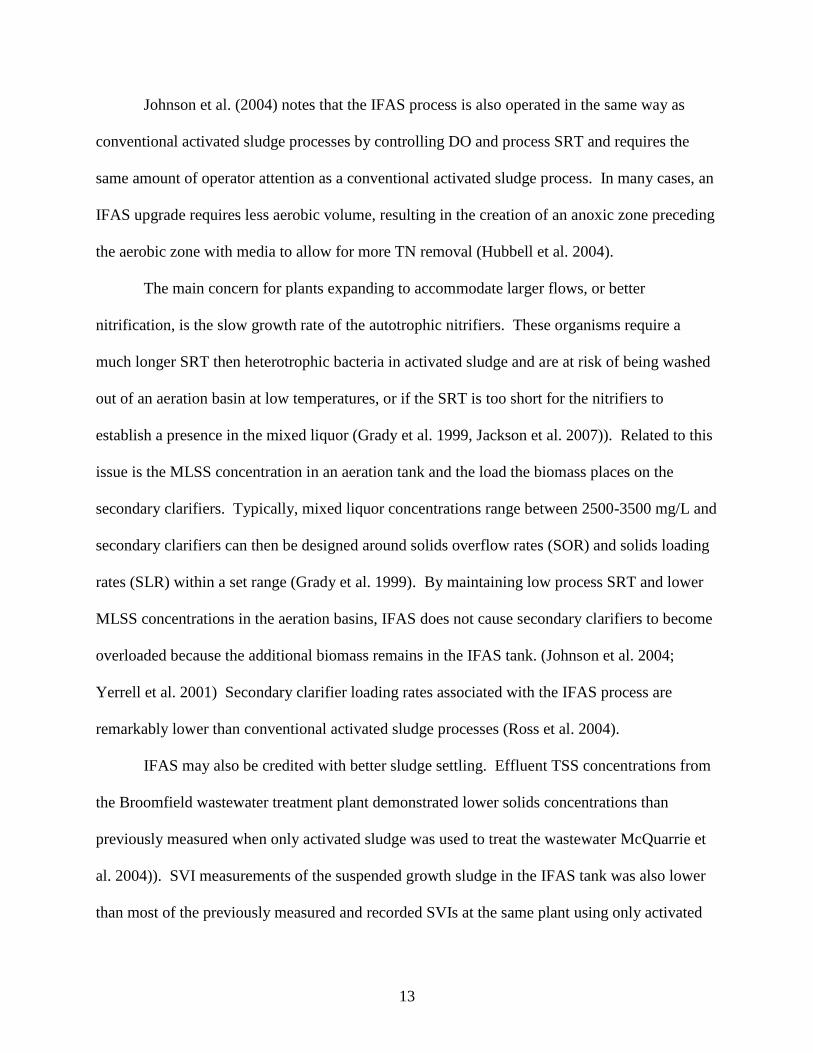
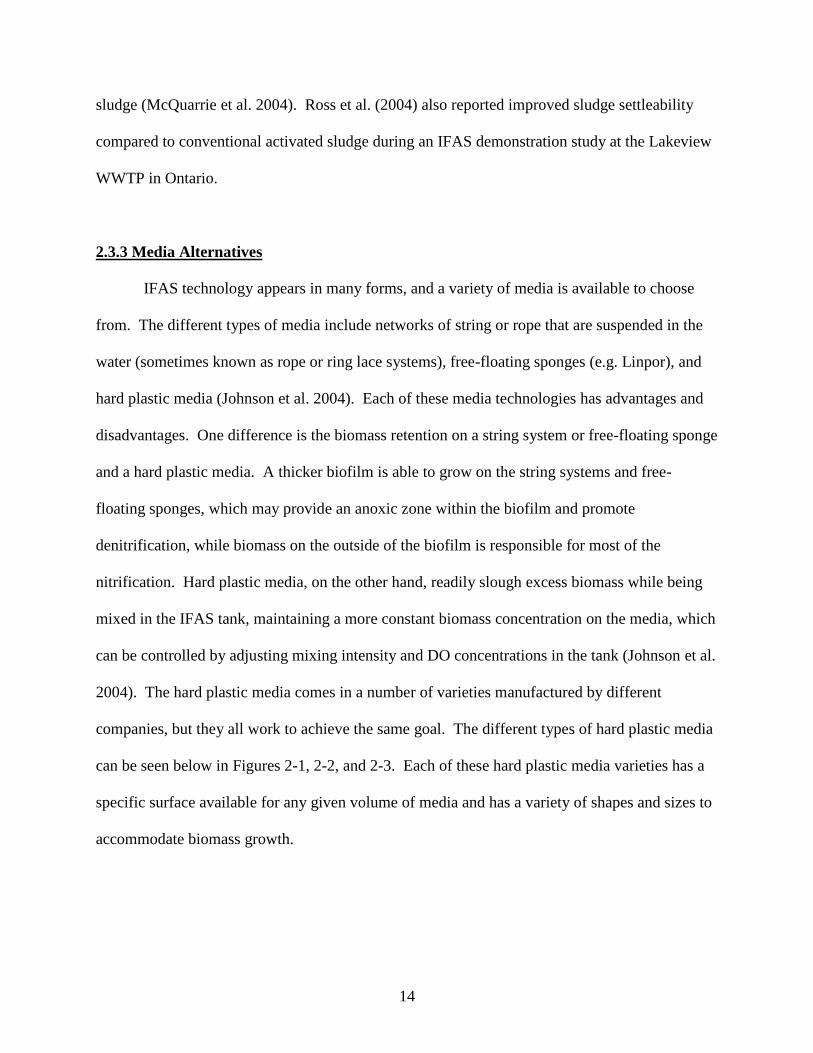
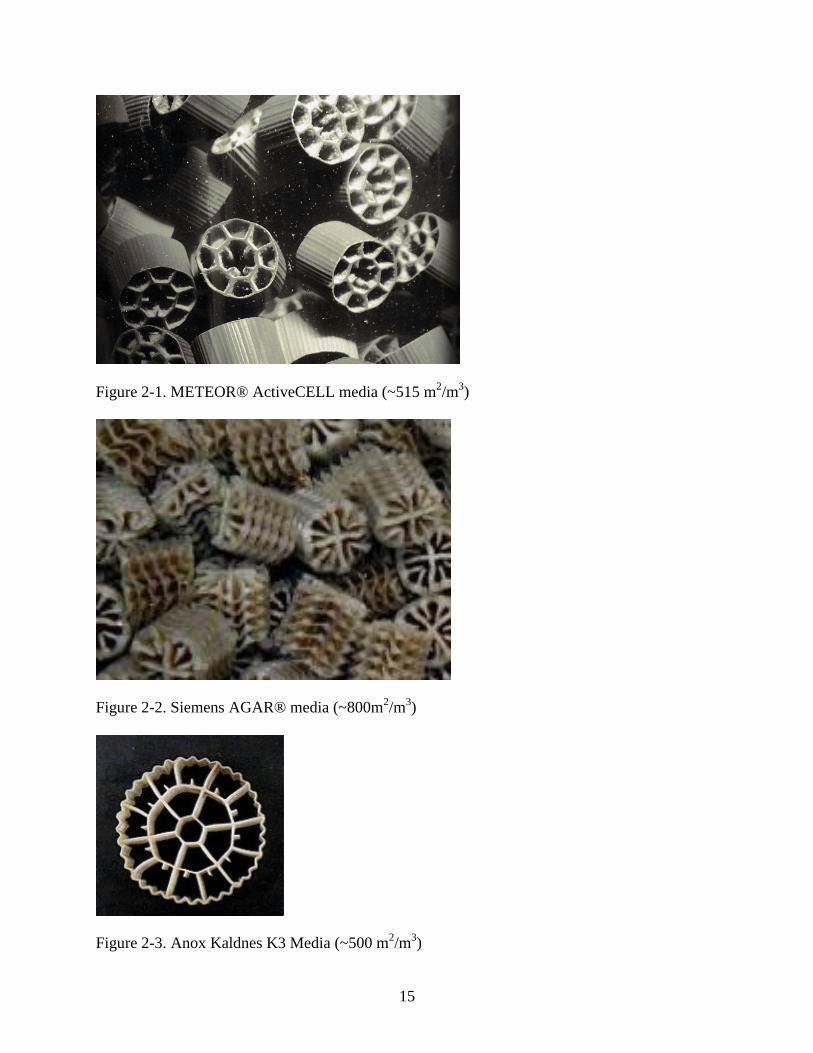
companies, but they all work to achieve the same goal. The different types of hard plastic media
can be seen below in Figures 2-1, 2-2, and 2-3. Each of these hard plastic media varieties has a
specific surface available for any given volume of media and has a variety of shapes and sizes to
accommodate biomass growth.
15
Figure 2-1. METEOR® ActiveCELL media (~515 m2/m
3)
Figure 2-2. Siemens AGAR® media (~800m2/m
3)
Figure 2-3. Anox Kaldnes K3 Media (~500 m2/m
3)
16
2.3.4 Examples of IFAS
A number of IFAS demonstrations and full scale upgrades have already taken place.
Some of the most notable demonstrations that have been conducted in the past are as follows:
Broomfield, CO WWTP: The Broomfield WWTP was forced to expand plant capacity from
5.4 MGD to 8 MGD in conjunction with new and more stringent effluent quality standards.
The plant underwent an extensive upgrade with IFAS using AnoxKaldnes plastic media. The
IFAS process demonstrated a significant improvement in ammonia removal and added
stability to the plants ability to meet low ammonia concentrations. In addition to enhanced
nitrification performance, the plant also reported improvements in the solids settleability
(McQuarrie et al. 2004)
Mamaroneck, NY WWTP: The Mamaroneck WWTP is a 20.6 MGD plant that also did an
extensive IFAS and MBBR demonstration with AccuWeb modules. The Mamaroneck plant
has been able to maintain TN concentrations under 10 mg/L-N. The IFAS tank at the
Mamaroneck Plant did suffer some red worm predation on the IFAS modules, limiting their
nitrification performance at times. The plant then pilot tested an IFAS configuration with
AnoxKaldnes K1 media at a 30% fill. This pilot study demonstrated that the addition of IFAS
media greatly enhanced nitrification kinetics (Onnis-Hayden et al. 2007))
The Colony, TX WWTP: The Colony WWTP is operating at a 2.4 MGD flowrate that
required an upgrade to meet new effluent ammonia standards of 3 mg/L-N. The plant used
BioWeb media to accommodate the existing fine bubble diffusers. The IFAS system allowed
The Colony WWTP to meet the new treatment limits and saved the plant a substantial amount
of money in construction costs (Jackson et al. 2007))
17
Windsor Locks, CT WPCA: The Windsor Locks WPCA installed the AccuWeb IFAS
configuration to achieve lower effluent TN stipulated in the plant’s new discharge permits.
The WPCA has an average flow of 1.43 MGD that used the IFAS configuration to fully
nitrify and to reduce basin volume requirements that might otherwise have required new
construction. The result was a much improved nitrification capacity and ultimately lower
effluent TN (Hubbell et al. 2004)
Donner Summit Public Utility District, CA The Donner Summit plant is a small plant
servicing a small ski community in Soda Springs, CA. The plant experiences extremely cold
wastewater temperatures (reaching as low as 4°C) and needed to upgrade to a BNR process to
meet new effluent nitrate standards. The plant used AccuWeb modules in their IFAS process
which allowed them to fully nitrify, even in temperatures as low as 5 °C and was able to
achieve as much as 3x the ammonia oxidation as a conventional activated sludge process
(Hubbell et al. 2003)
Christies Beach WWTP, Australia: The Christies Beach WWTP, a 2 MGD, operated a full
scale demonstration study of IFAS with free floating media for 8 months to see if the existing
plant could be retro-fit to fully nitrify and remove 80% of TN. During this study, a significant
amount of work was focused on DO requirements for IFAS systems. It was determined that
the IFAS process would be sufficient to meet the effluent quality standards for the plant
(Yerrell et al. 2001)
Norman Cole JR. WPCP, VA: The Norman Cole WPCP conducted a pilot scale study to see
if the IFAS process or MBBR process was able to meet their 3 mg/L-N TN effluent
requirements and to see the effect of using multiple stages on effluent NOX concentrations.
The plant implemented the technology as a last pass IFAS setup at the end of the aerobic

18
process to help set up for the denitrification process. The plant used AnoxKaldnes K1 plastic
media at a 30% fill fraction. The IFAS process was able to meet the 2 mg/L-N NOX effluent
quality standards and achieved NOX concentrations as low as 0.86 mg/L-N during a short
period of stable operating conditions (Motsch et al. 2007)
Water Treatment Facility (WTF), WI: Here a full scale cold weather performance test of the
IFAS rope media process was conducted at a 1.5 MGD. The purpose of the study was to test
to see if the IFAS process could allow them to meet effluent quality standards in cold weather
without having to construct additional aeration tanks. The study suffered from a number of
upsets, but ultimately IFAS did improve nitrification capacity. (Nelson et al. 2007)
Lakeview, Ontario WWTP: The Lakeview Plant (103,57 gal/d) conducted a full scale
demonstration study on the IFAS process using Hydroxyl media with a flow of 14,000 m3/d
to test the ability to achieve year round complete nitrification to meet new effluent quality
standards. The plant consistently achieved nitrification at low MLSS concentrations, the
process was more stable under varying mixed liquor concentrations, and the mixed liquor
exhibited better settling characteristics (Ross et al. 2004)
Westerly, RI WWTF: The Westerly WWTF is a 3.3 MGD plant that upgraded to an IFAS
process to meet effluent TN requirements. The plant used LINPORTM
media for the IFA
configuration. The plant met their limit shortly after a short startup period and has allowed
the plant to achieve effluent TN of 5 mg/L-N and has experienced a significant improvement
on the sludge SVI (Masterson et al. 2004)
Chesterfield County, VA BNR Program: The Chesterfield County BNR program was put in
place in response to new effluent quality standards and explored IFAS as an option to meet
these effluent standards. They underwent a pilot study using ActiveCellTM
plastic media at a
19
50% fill. The pilot was able to fully nitrify and reach effluent ammonia concentrations as low
a 0.29 mg/L-N (Kaldate et al. 2008)
The Annapolis, MD WRF: In response to pending TN effluent standards of 10 mg/L, the
Annapolis WRF, the plant modified one of its 10 MGD aeration tanks into a single stage
anoxic-aerobic operation with Ringlace media added to the aerobic portion. The study
showed that the IFAS section of the plant had a much higher nitrification rate than the control
train, except when the IFAS process was ammonia limited. The demonstration showed that
nitrification rates per unit volume were greatly enhanced by the addition of IFAS media and
that at lower temperatures, the greater the improvement in the TN removal capacity compared
to the control activated sludge process (Randall et al. 1996)
2.3.5 IFAS Nitrification
The distribution of these microorganisms on the media is difficult to accurately
determine, but is related to the specific growth rates for both the AOB and NOB populations in
the biofilm. In a biofilm, the organism with the higher maximum specific growth rate will be
more abundant on the surface of the biofilm and the other species will remain within the biofilm
and rely more on diffusion of substrate and oxygen into the biofilm (Grady et al. 1999). This is
because faster growing organisms and will slough faster than slower growing organisms.
Location in the biofilm also deals with half saturation coefficients and generally how high the
affinity for the substrate is to the biomass. Thus, substrate includes oxygen, and organisms that
are oxygen limited will tend to grow in the surface of the biofilm where substrate does not have
to diffuse as far before it becomes bioavailable. According to the default parameters used by
Envirosim (2008), AOB populations have a μmax of 0.9 d-1
, while NOB populations have a μmax
20
of 0.7 d-1
, indicating that AOB populations would flourish at the surface of the biofilm, while
NOB populations would exist deeper in the biofilm closer to the fixed surface.
Nitrification rate testing from the IFAS demonstration study at the Lakeview WWTP
showed that the nitrification capacity of the IFAS process was higher than with a conventional
activated sludge configuration by demonstrating that IFAS nitrification kinetics were higher than
kinetics achieved with a conventional activated sludge process operating for nitrification (Ross et
al. 2004). IFAS has demonstrated excellent ammonia oxidation year round, under a wide range
of temperature variations in a number of case studies where the process has already been
implemented. At the Broomfield wastewater treatment plant in Broomfield, CO, the IFAS
exhibited higher and more consistent removal efficiency than activated sludge (McQuarrie et al.
2004). McQuarrie et al. (2004) also reports that effluent ammonia concentrations for the
Broomfield WWTP were consistently under 1 mg/L-N when the IFAS process had been
implemented, where pre-IFAS effluent ammonia ranged much higher, up to 12 mg/L-N. Hubbell
et al. (2004) also reported a significant improvement of ammonia removal capacity of an IFAS
upgrade demonstration compared with conventional activated sludge. At the Donner Summit
Public Utility District IFAS upgrade, significant ammonia oxidation was reported, even with
influent wastewater temperatures as low as 8°C (Hubbell et al. 2004). Nitrification rates
measured for the two stage IFAS configuration at the Broomfield, CO. WWTP for mixed liquor,
media only, and media with mixed liquor to evaluate process kinetics, and the results
demonstrate that nitrification rates increased on the carriers in the first stage where ammonia
concentrations were higher (Onnis-Hayden et al. 2007). According to the work done by Onnis-
Hayden et al. (2007), AOB nitrification rates of 5.04 g/m2/day were observed at temperatures of
20 °C at the Mamaroneck WWTP demonstration. This same study also demonstrated that
21
nitrification rates in the second stage were evenly split between the mixed liquor and the media.
In both stages the study indicated that little to no nitrite accumulation occurred in the nitrification
rate testing on the carriers, while the mixed liquor in both stages tended to accumulate nitrite
during ammonia oxidation. This trend suggests that significant NOB activity was localized on
the carriers for both stages of IFAS at the Broomfield WWTP. A molecular analysis using
florescent in-situ hybridization (FISH) at the Broomfield WWTP indicated that AOB activity at
the IFAS plant was dominated by Nitrosomonas populations, while NOB activity was dominated
by Nitrospira (Onnis-Hayden et al. 2007). Another full scale demonstration conducted in the
Christies Beach WWTP in South Australia demonstrated that by adding IFAS media to a
conventional activated sludge plant essentially doubled the nitrification rates at the wastewater
treatment plant, where IFAS nitrate production was measured at 0.19 mg/L/min and activated
sludge nitrate production rate was 0.088 mg/L/min (Yerrell et al. 2001). Pilot testing of the
IFAS process was also conducted at the Mamaroneck WWTP, which experienced about 90%
ammonia removal by mass and also experienced about 90% removal of total nitrogen by mass
with a post anoxic zone (Johnson et al. 2007). In addition to the Mamaroneck demonstration, the
Norman Cole Demonstration in Fairfax County, VA was able to meet the 2.0 mg/L effluent
NOX-N standard in 18.5-20 °C wastewater with an average of 0.86 of a short stable period of
operation in a last pass IFAS configuration (Motsch et al. 2007). This indicates that the
demonstration was able to achieve complete ammonia oxidation with the IFAS process.
The effect of DO on the overall nitrification rate achieved with a biofilm is well-known.
Despite this little work has been done to quantify the KO effects on nitrification rate in the IFAS
setting. Yerrell et al. (2001) examines KO effects of both mixed liquor alone and for media
combined with mixed liquor. According to this study, KO for media and mixed liquor was

22
determined to be 0.5 mg/L, a value matching accepted KO values for nitrifying bacteria in mixed
liquor. Based on this research, it appears that higher DO concentrations are necessary to operate
the IFAS process than for conventional activated sludge processes. In another case, Sen et al.
(2007) reports that Ko for nitrifiers in a biofilm is 4 mg/L at 25 °C.
2.3.6. MBBR Nitrification
Moving Bed Biofilm Reactors (MBBR) are another biofilm process that uses fixed film
media for nitrogen removal, but in this case, no internal recycle is used, resulting in no mixed
liquor. Because no mixed liquor is present, only the excess biomass resulting from sloughing off
of the carriers needs to be removed from the effluent stream (Odegaard et al.) In this case, a
filter is a viable option for solids removal from MBBR effluent instead of using clarifiers, and
solids loading is much lower for MBBRs. The MBBR process works well for nitrification if the
readily degradable organic material in the wastewater has been removed (Odegaard et al.).
Unlike the IFAS process, that incorporates activated sludge, the presence of degradable COD in
the wastewater stream will select for heterotrophic growth instead of autotrophic growth
resulting in diminished nitrification performance, so some pretreatment is required for
nitrification. Similarly to the IFAS process, nitrification rates depend on bulk liquid DO, and
nitrification performance is linearly related to DO in the MBBR process because MBBRs are a
biofilm process (Rusten et al. 1996).
A demonstration performed at the Nordre Follo WWTP in Norway recorded between
85%-100% removal efficiency for influent ammonia using a MBBR (Rusten et al. 1995). Rusten
et al. (1995) also reports nitrification rates in excess of 1.4-1.6 gNH4-N/m2/day using the MBBR
process at temperatures ranging from 8 °C to 15.6 °C. At the lowest temperatures, removal
23
efficiency dropped below 85% at high ammonia loading conditions, but remained well above
50% (Rusten et al. 1995). Rusten et al. (1995) also notes that nitrification rates depend on the
autotrophic fraction on the biofilm, influent soluble organics, and DO diffusion into the biofilm.
Studies on MBBRs and nitrification demonstrate a linear relationship between
nitrification rate and bulk liquid DO up to 10mg/L, but the impact of mixing has not been
defined (AEsoy et al.). In addition, bulk liquid DO can be used in the MBBR process to counter
any influent COD that may be in the wastewater stream and by increasing DO with pure oxygen
to high concentrations, nitrification rates can be maximized, even in the presence of organics
(AEsoy et al.). AEsoy et al. also demonstrated that nitrification rates in MBBRs are also related
to the influent ammonia load placed on the process. The relationship is not linear, and levels off
at higher ammonia loading conditions.
2.4 Biofilm Kinetics and Modeling
Attached growth processes using biofilms offer advantages over suspended growth
applications for wastewater treatment. Biofilms are bacteria held to a solid surface with the same
extracellular material traditionally identified to hold flocs of bacteria together in suspended
growth wastewater treatment applications (Grady et al. 1999). These biofilms can be modeled in
a variety of ways, depending on the manner of growth on the media surface. Using these
biofilms in nitrification applications, only the autotrophic growth of ammonia oxidizing bacteria
(AOBs) and nitrite oxidizing bacteria (NOBs) are considered.
Nitrification on attached growth processes, such as integrated fixed film activated sludge
(IFAS) process is a very different process than with suspended growth. Instead of the biomass
being in direct contact with the bulk liquid, it is in contact with a thin film of water which is in
24
contact with the bulk liquid. This makes the mechanism behind getting substrate to the biomass
a process of diffusion through both the biofilm and the surrounding water film. There is a mass
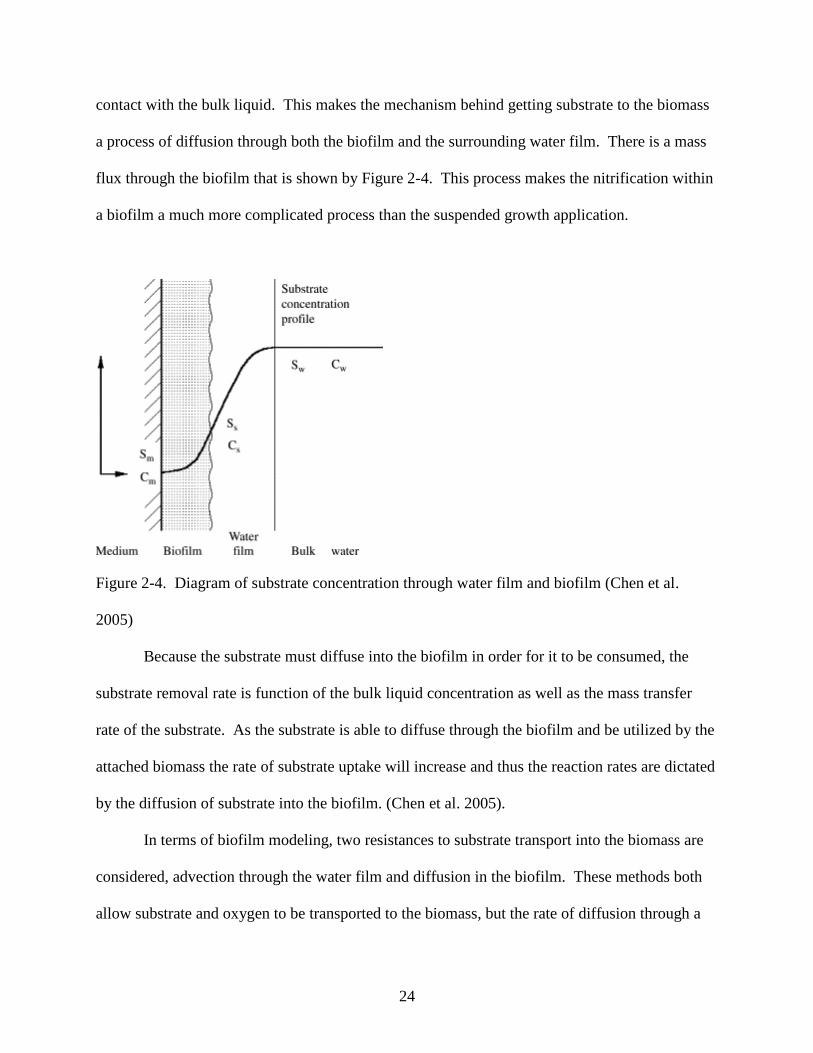
flux through the biofilm that is shown by Figure 2-4. This process makes the nitrification within
a biofilm a much more complicated process than the suspended growth application.
Figure 2-4. Diagram of substrate concentration through water film and biofilm (Chen et al.
2005)
Because the substrate must diffuse into the biofilm in order for it to be consumed, the
substrate removal rate is function of the bulk liquid concentration as well as the mass transfer
rate of the substrate. As the substrate is able to diffuse through the biofilm and be utilized by the
attached biomass the rate of substrate uptake will increase and thus the reaction rates are dictated
by the diffusion of substrate into the biofilm. (Chen et al. 2005).
In terms of biofilm modeling, two resistances to substrate transport into the biomass are
considered, advection through the water film and diffusion in the biofilm. These methods both
allow substrate and oxygen to be transported to the biomass, but the rate of diffusion through a
25
biofilm is not constant throughout its depth. Furthermore, biofilms that develop on the surface of
biofilm media in wastewater applications do not display homogeneous growth over the surface
of the media. The porous and heterogeneous nature of biofilms allows the surrounding water to
flow in and out of the biomass. This suggests that advection plays a large roll in allowing the
biomass access to substrate. Diffusion is the mechanism in which nutrients, substrate, and
oxygen are transferred in the biofilm and the biomass structures within the biofilm. Because
advection and diffusion work together in the mass transport through biofilms, both of these
parameters should be considered in modeling.
One important concept dealing with biofilms is that substrate not only has to be
transferred through the biomass to become bioavailable, but also a surrounding water film.
Modeling the general mass transport through a biofilm must take into account transfer through
the water film first. This assumes that diffusion is the sole method of transport. In this case Dw
is the diffusion coefficient for the substrate in water and Lw is the thickness of the surrounding
mass transport boundary layer in which diffusion of substrate, oxygen, and nutrients must occur
can be written as Lw. Some of the most common factors impacting diffusion through the water
film and the thickness of the surrounding mass transport boundary layer are mixing, temperature,
and substrate characteristics. Mixing intensity impacts water film thickness. By imparting more
mixing energy, the moving biofilms travels at a higher apparent speed compared to the water.
This increase in relative velocity between the biofilm and the bulk liquid will cause the
surrounding water film to become thinner. Temperature also plays an impact on the water film
by changing the absolute viscosity of the bulk liquid and this affects the diffusion coefficient.
Substrate also plays a role in biofilm diffusion. Furthermore, the diffusion coefficient for a given
substrate in water also affects transport through the mass transfer boundary layer. Sw and Ss are
26
also important to understand in biofilm modeling applications. Sw and Ss represent substrate
concentrations in the bulk liquid and at the surface of the biofilm, respectively. The difference in
these concentrations is related to advection through the water film. Higher substrate
concentrations in the bulk liquid ultimately result in faster mass transfer rates to and through the
biofilm by increasing the available driving force. Using these parameters, the mass flux through
the water film can be written as:
Js=(Dw/Lw)(Sw-Ss) (Eq. 2-1)
As previously discussed, this equation requires a value for the thickness of the water film
surrounding the biofilm. (Grady et al. 1999)
Mass transport through the biofilm can be described by slightly modifying Fick’s law.
Since biofilm diffusion is more complex than free diffusion that Fick’s law was designed for, the
diffusivity constant is replaced with effective diffusivity. In addition to diffusivity, the driving
force behind mass transfer and diffusion into the biofilm is the substrate concentration in the
bulk liquid. With higher substrate gradients, more diffusion can occur and essentially, higher
substrate oxidation rates. The effective diffusivity is usually smaller than the diffusivity constant
due to the presence of extracellular material surrounding the cells in the biofilm, although this
varies with the presence of advection through the biofilm. The equation for this mechanism is:
Js=De(dSs/dx) (Eq. 2-2)
27
The equation incorporates De, which is the effective diffusion coefficient of the substrate though
the biofilm, which is a smaller value than the diffusion coefficient of a given substrate in water
because of the less permeable extracellular material incorporated throughout the biofilm.
However, the effective diffusivity varies from biofilm to biofilm. It also uses the concentration
gradient from the outside of the biofilm to the solid support holding the biofilm. De is dependent
on substrate properties including molecular weight.
A fully penetrated biofilm ensures that substrate is bioavailable to the entire biomass in
the fixed film. Substrate availability in the biofilm ultimately determines the substrate uptake
rate. As substrate begins to become limited, the biofilm ceases to be fully penetrated and
kinetics slow down. In this case, performance of biofilm carriers and removal rates is dependent
on maintaining higher process DO. This also implies that half saturation constants are going to
be naturally higher for biofilm processes, and must be considered to appropriately design and
operate a biofilm process. Despite the enhancement of process performance, especially in the
case of nitrification, that allow autotrophs to remain present during washout conditions,
nitrification performance is impeded as ammonia concentrations drop to low levels.
The final consideration for biofilm modeling is operating the process to allow the biofilm
to achieve steady state. In this case, the biofilm is maintained at a thickness that allows for
substrate penetration, and also enables an appropriate amount of biomass to exist in the biofilm.
By imparting energy to the process biomass will slough at the same rate that new biomass is
grown on the fixed film. It is also known that the depth of the biofilm increases when mixing
intensity is decreased (Sen et al. 2007). The biofilm thickness is thus partly controlled by
sloughing of biomass off of the fixed film that results from mixing energy imparted to the water.
Thicker biofilms also decrease the specific surface area available on the media (Sen et al. 2007).
28
In addition to this, the added biofilm thickness increases the mixing required to keep the media
moving in the bulk liquid, so mixing controls biofilm thickness and mass transport, not only by
affecting the mass transport boundary layer thickness, but also biofilm thickness (Sen et al.
2007). Another factor impacting mixing and biomass sloughing is the recycle rate into the IFAS
basin. Higher internal mixed liquor recycle increases forward velocity though the tank which
increases the mixing requirement to maintain a constant biomass on the biofilm (Sen et al. 2007).
Because diffusion of nutrients, substrate, and oxygen into the biofilm controls the
nitrification rate in an attached growth process, it is important to improve the mass transfer
capability in the system. Mixing has a direct effect in the water film thickness which, in turn,
affects mass transport into the biofilm. Generally, the smaller the water film around the biofilm,
the faster substrate and oxygen can pass into the biofilm and become available for the biomass.
At this point, very little is understood about how process mechanical configuration (e.g. aeration
intensity) affects mass transport boundary layer thickness. It is known at a fundamental level
that biofilms are diffusion limited by their nature instead of being kinetically limited, like mixed
liquor (Boltz et al. 2009).
2.5 Reference
AEsoy, A., Odegaard, H., Haegh, M, Risla, F., Bentzen, G. Upgrading Wastewater Treatment
Plants By The Use Of Biofilm Carriers, Oxygen Addition And Pre-treatment In The
Sewer Network. Civil and Environmental Engineering. Aaiborg University.
Boltz, J., Daigger, G. 2009. Bulk-Liquid Hydrodynamics Provides Uncertainly In Biofilm
Reactor Design.
Chen, S., Ling, J., Blancheton, J. 2006. Nitrification Kinetics Of Biofilm As Affected By Water
Quality Factors. Aquacultural Engineering: 34(3): 179-197.
29
Choi, N., Phillips, H., Johnson, T.L., Butler, R., Lauro, T. Pilot Testing Of MBBR And IFAS
Treatment Processes For Nitrification And Denitrification At The Mamaroneck WWTP.
Proceedings of the 80th
WEFTEC- National Conference of the Water Environment Federation,
San Diego, CA. 80: October 13-17, 2007.
Envirosim, 2008. BioWin Version 3.0 Default parameters.
Germain, E., Bancroft, L., Dawson, A., Hinrichs, C., Fricker, L., Pearce, P. Evaluation Of
Hybrid Processes For Nitrification By Comparing MBBR/AS And IFAS Configurations. Water
Science and Technology: 55(8-9): 43-49.
Grady, C., Daigger, G., Lim, H. 1999. Biological Wastewater Treatment, Theory And
Application. New York: Marcel Deker, Inc.
Hubbell, S., Krichten, D. Demonstration And Full Scale Results Of A Plant Upgrade For BNR
Using Integrated Fixed-Film Activated Sludge (IFAS) Technology. Proceedings of the 77th
WEFTEC- National Conference of the Water Environment Federation. New Orleans, LA,
October 2-6, 2004.
Hubbell, S., McDowell, C. Cold Temperature BNR Using Integrated Fixed-Film Activated
Sludge (IFAS) Hybrid Technology. Proceedings of the 76th
WEFTEC- National Conference of
the Water Environment Federation. Los Angeles, CA, October 12-15, 2003.
Jackson, D., Ripley, L., Maurina, T., Hubbell, S. Conversion from Contact Stabilization To
Nitrification Using Integrated Fixed Film Activated Sludge (IFAS) In The Colony, Texas.
Proceedings of the 80th
WEFTEC- National Conference of the Water Environment Federation.
San Diego, CA, October 13-17, 2007.
Johnson, T., McQuarrie, J., Shaw, A. Integrated Fixed-Film Activated Sludge (IFAS): The New
Choice For Nitrogen Removal Upgrades In The United States. Proceedings of the 77th
WEFTEC- National Conference of the Water Environment Federation. New Orleans, LA,
October 2-6, 2004.
Johnson, T., Shaw, A. A Pilot-Scale Comparison of IFAS And MBBR To Achieve Very Low Total
Nitrogen Concentrations. Proceedings of the 80th
WEFTEC- National Conference of the Water
Environment Federation. San Diego, CA, October 13-17, 2007.
Jones, R., Sen, D., Lambert, R. Full Scale Evaluation Of Nitrification Performance In An
Integrated Fixed Film Activated Sludge Process. Water Science and Technology: 38(1): 71-78.
Kaldate, A., Smedley, S., Turner, T. Evaluation Of IFAS Technology For TN Removal At
Chesterfield County BNR Program. Proceedings of the 81st WEFTEC- National Conference of
the Water Environment Federation. Chicago, IL, October 18-22, 2008.
30
Maas, C., Parker, W., Legge, R. Detachment Of Solids And Nitrifiers In IFAS Systems.
Proceedings of the 80th
WEFTEC- National Conference of the Water Environment Federation.
San Diego, CA, October 13-17, 2007.
Masterson, T., Federico, J., Duerr, S. Upgrading For Total Nitrogen Removal With A Porous
Media IFAS System. Proceedings of the 77th
WEFTEC- National Conference of the Water
Environment Federation. New Orleans, LA, October 2-6, 2004.
Metcalf & Eddy. 2003. Wastewater Engineering: Treatment and Reuse. Boston: McGraw-Hill,
Inc.
McQuarrie, J., Rutt, K., Seda, J., Haegh, M. Observations From The First Year of Full-Scale
Operation - The IFAS/BNR Process At The Broomfield Wastewater Reclamation Facility,
Broomfield, CO. Proceedings of the 77th
WEFTEC- National Conference of the Water
Environment Federation. New Orleans, LA, October 2-6, 2004.
Motsch, S., Fetherolf, D., Guhse, G., McGettigan, J., Wilson, T. MBBR and IFAS Pilot Program
For Denitrification At Fairfax County’s Norman Cole Pollution Control Plant. Proceedings of
the WEF Nutrient Removal Conference (2007). Baltimore, MD, March 4-7, 2007.
Nelson, D., Renner, T. Improving Performance Of A Conventional Activated Sludge WTF To
Provide Nitrification Utilizing Integrated Fixed Film Activated Sludge (IFAS). Proceedings of
the 80th
WEFTEC- National Conference of the Water Environment Federation. San Diego, CA,
October 13-17, 2007.
Odegaard, H., Rusten, B., Siljudalen, J. The Development Of The Moving Bed Biofilm Process-
From Idea To Commercial Product.
Onnis-Hayden, A., Dair, D., Johnson, C., Schramm, A., Gu, A. Kinetics And Nitrifying
Populations In Nitrogen Removal Processes At A Full-Scale Integrated Fixed-Film Activated
Sludge (IFAS) Plant. Proceedings of the 80th
WEFTEC- National Conference of the Water
Environment Federation. San Diego, CA, October 13-17, 2007.
Park, S., Bae, W., Chung, J., Baek, S. 2007. Empirical Model Of The pH Dependence Of The
Maximum Specific Nitrification Rate. Process Biochemistry: 42(12): 1671-1676.
Psaltakis, E., Liubicich, J, Pitt, P., Antonio, P., Posada, S. Demonstration Of Integrated Fixed
Film Activated Sludge Process For BNR At The Mamaroneck WWTP. Proceedings of the 76th
WEFTEC- National Conference of the Water Environment Federation. Los Angeles, CA,
October 12-15, 2003.
Randall, C., Sen, D. Full-Scale Evaluation Of An Integrated Fixed-Film Activated Sludge (IFAS)
Process For Enhanced Nitrogen Removal. Water Science and Technology: 33(12): 155-162.
Randall, C., Sen, D. Improving The Aquifas (Unified) Computational Model For Activated
Sludge, IFAS and MBBR Systems By Embedding A Multi-Layer Biofilm Diffusion Model Within
31
A Multi-Cell Activated Sludge System. Proceedings of the WEF Nutrient Removal Conference
(2007). Baltimore, MD, March 4-7, 2007.
Ross, D., Fernandes, W., Briggs, T., Kim, N., Booth, G., Neely, D., Welp, J. Integrated Fixed
Film Activated Sludge (IFAS) At The Lakeview WWTP: The Real Implementation Issues.
Proceedings of the 77th
WEFTEC- National Conference of the Water Environment Federation.
New Orleans, LA, October 2-6, 2004.
Rusten, B., Hem, L., Odegaard, H. 1995. Nitrification Of Municipal Wastewater In Moving Bed
Biofilm Reactors. Water Environment Research: 67: 75-86
Sen, D., Murthy, S., Phillips, H., Pattarkine, V., Copithorn, R., Randall, C., Schwinn, D.,
Banerjee, S. Minimizing Aerobic And Post Anoxic Volume Requirements In Tertiary Integrated
Fixed-Film Activated Sludge (IFAS) And Moving Bed Biofilm Reactor (MBBR) Systems Using
The Aquifas Model. Proceedings of the 80th
WEFTEC- National Conference of the Water
Environment Federation. San Diego, CA, October 13-17, 2007.
Sen, D., Randall, C., Brink, W., Farren, G, Pehrson, D., Flournoy, W., Copithorn, R.
Understanding The Importance Of Aerobic Mixing, Biofilm Thickness Control And Modeling On
The Success Or Failure Of IFAS Systems For Biological Nutrient Removal. Proceedings of the
WEF Nutrient Removal Conference (2007). Baltimore, MD, March 4-7, 2007.
Yerrell, K., Gobbie, M., Dold, P., Jones, R., Sickerdick, L. Full-Scale Demonstration Of A Free-
Moving Media IFAS Process For Enhancing Nitrification Performance. Proceedings of the 74th
WEFTEC- National Conference of the Water Environment Federation. Atlanta, GA, October 13-
17, 2001.
32
3 METHODOLOGY
3.1 Bench Scale Reactor Construction
The batch reactors were constructed from 9 L, rectangular, clear polycarbonate containers
with screw-cap lids with an active reactor volume of 7 L. The mixer paddle extended through
the screw-cap opening, and holes were drilled in the top of the container to insert DO and pH
probes. The four reactors were aerated through an air stone and were fed pure oxygen at a low
rate, which maintained DO roughly between 3 and 5 mg/L, unless otherwise noted. The reactors
were also equipped with a sample port located in the middle of the active volume which allowed
for samples to be taken throughout the course of the various experiments performed.
The reactors were placed in a temperature-controlled water bath, and the temperature in
each individual reactor in order to maintain a temperature consistent with the temperature of the
IFAS tank, which was read and recorded every morning at the time at which the sample is taken.
The bath was turned on the day before sample collection to allow time for the bath to adjust to
the appropriate temperature.
The pH in the reactors was controlled to a setpoint between 7.2 and 7.3 for both the
ammonia spike and for the nitrite spike experiment. Automatic addition of alkalinity in the form
of a concentrated Na2CO3 solution was provided with Masterflex peristaltic pumps and on/off
control to each reactor as needed. If the pH increased to higher than the controlled values, acid
was added manually to return the reactor to the desired experimental pH. pH was also logged
continuously for each experiment using a USB data acquisition system with LABVIEW
(National Instruments) running on a laptop computer
33
To separate mixing and oxygenation functions, DO was controlled in the bench-scale
reactors using pure oxygen. This system included HACH ruggedized LDO probes and solenoid
valves connected to a relay controller and USB data acquisition and control system running
LABVIEW (National Instruments) on a laptop computer. This system was also used to record
temperature and DO every 10 sec for each experiment, from which oxygen uptake rates could be
calculated. Rotameters were used in series with the solenoid valves to regulate the oxygen
flowrate into the reactors when they were aerating. The DO setpoint for the nitrification kinetics
experiments was chosen to match the operational DO setpoints in the IFAS demonstration tank,
but these DO setpoints were changed when measuring biofilm kinetics properties to illustrate the
effect of DO on the performance of the carriers. Typically, the rate tests maintained a DO
between 3 and 5 mg/L and the more controlled biofilm kinetic properties experiments maintained
each reactor at a different and more consistent DO concentration. The diagram shown in Figure
3-1 displays a representation of the reactor construction.
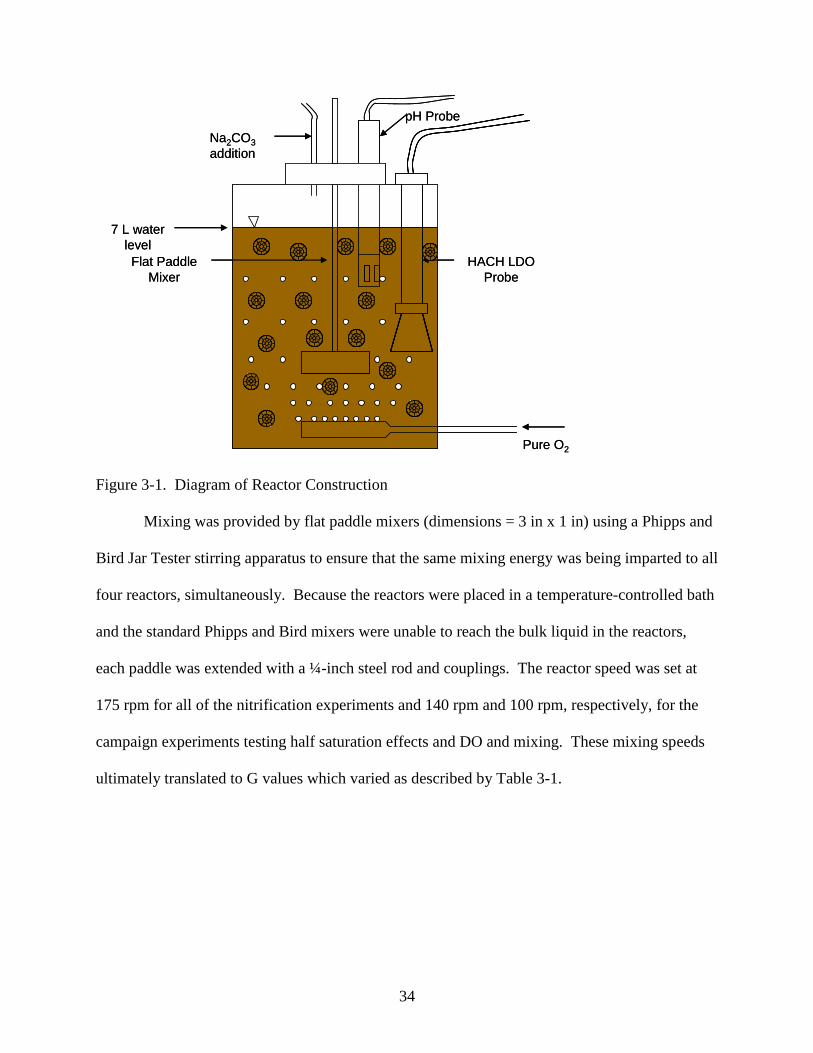
34
Pure O2
HACH LDO
Probe
pH Probe
Flat Paddle
Mixer
Na2CO3
addition
7 L water
level
Pure O2
HACH LDO
Probe
pH Probe
Flat Paddle
Mixer
Na2CO3
addition
7 L water
level
Figure 3-1. Diagram of Reactor Construction
Mixing was provided by flat paddle mixers (dimensions = 3 in x 1 in) using a Phipps and
Bird Jar Tester stirring apparatus to ensure that the same mixing energy was being imparted to all
four reactors, simultaneously. Because the reactors were placed in a temperature-controlled bath
and the standard Phipps and Bird mixers were unable to reach the bulk liquid in the reactors,
each paddle was extended with a ¼-inch steel rod and couplings. The reactor speed was set at
175 rpm for all of the nitrification experiments and 140 rpm and 100 rpm, respectively, for the
campaign experiments testing half saturation effects and DO and mixing. These mixing speeds
ultimately translated to G values which varied as described by Table 3-1.

35
Table 3-1. G value range for various mixing speeds and temperatures
Constituent
Mixing Speed
(RPM)
Maximum Temperature
(°C)
Minimum Temperature
(°C)
Maximum G
(s-1
)
Minimum G
(s-1
)
175 27.8 14.5 259.9 234.4
140 21.2 16.9 179.6 171.5
100 18.4 15.4 111.8 108.2
175 27.8 14.5 168.4 150.3
140 21.2 16.9 116.5 115.6
100 21.2 16.9 78.7 75.0
Media
Mixed Liquor
G values were calculated based on an experiment performed on the media and mixed
liquor with a torque meter attached to the mixing shaft with a coupling. Samples of secondary
effluent and media at a 50% fill and IFAS mixed liquor were collected from the IFAS basin and
placed in a reactor and mixed. Torque was measured for a range of mixing speeds from 65 to
200 rpms and G was calculated from torque. The results of this experiment are presented below
in Figures 3-2 and Figures 3-3. It is clear that the presence of media does result in more power
transfer to the water and more vigorous mixing.
G value calculations for IFAS Mixed Liquor
y = 0.52x1.10
y = 0.39x1.15
y = 0.13x1.37
0
50
100
150
200
250
50 75 100 125 150 175 200 225
Speed (RPM)
Vel
oci
ty G
rad
ien
t, G
(s-1
)
Temperature=13.2 C
Temperature=17.4 C
Temperature=22.6 C
Figure 3-2. G Value Measurements for IFAS Mixed Liquor
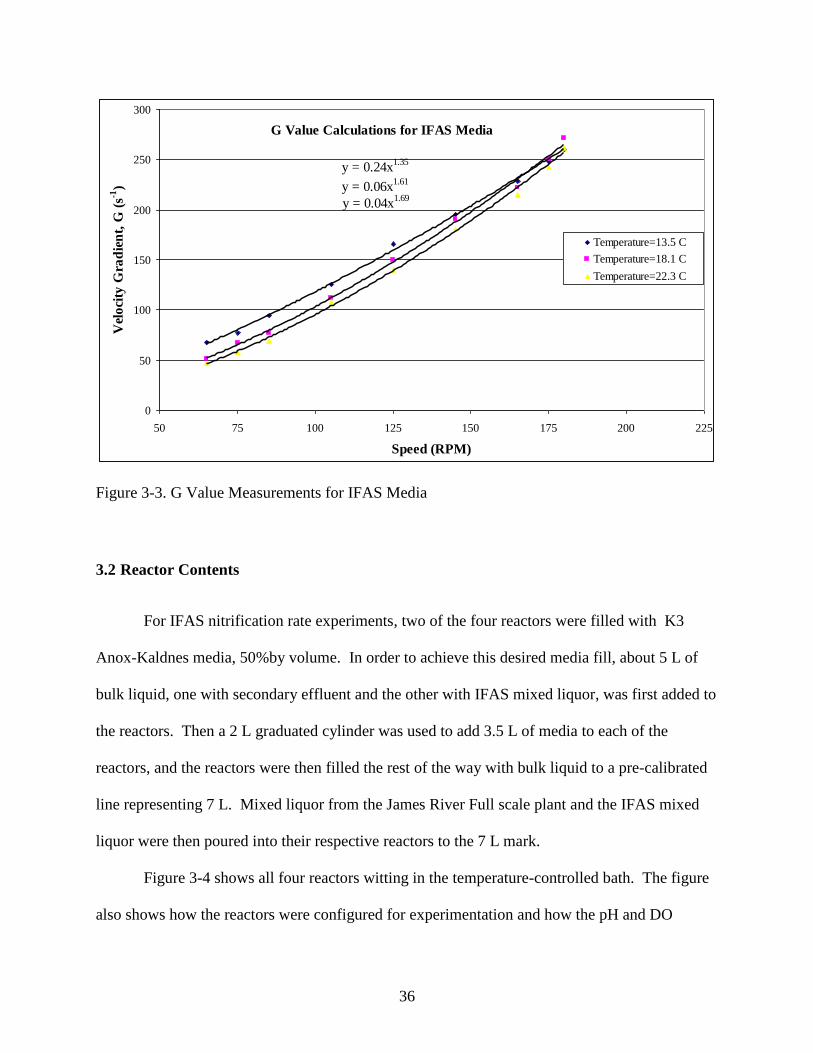
36
G Value Calculations for IFAS Media
y = 0.24x1.35
y = 0.06x1.61
y = 0.04x1.69
0
50
100
150
200
250
300
50 75 100 125 150 175 200 225
Speed (RPM)
Vel
oci
ty G
rad
ien
t, G
(s-1
)
Temperature=13.5 C
Temperature=18.1 C
Temperature=22.3 C
Figure 3-3. G Value Measurements for IFAS Media
3.2 Reactor Contents
For IFAS nitrification rate experiments, two of the four reactors were filled with K3
Anox-Kaldnes media, 50%by volume. In order to achieve this desired media fill, about 5 L of
bulk liquid, one with secondary effluent and the other with IFAS mixed liquor, was first added to
the reactors. Then a 2 L graduated cylinder was used to add 3.5 L of media to each of the
reactors, and the reactors were then filled the rest of the way with bulk liquid to a pre-calibrated
line representing 7 L. Mixed liquor from the James River Full scale plant and the IFAS mixed
liquor were then poured into their respective reactors to the 7 L mark.
Figure 3-4 shows all four reactors witting in the temperature-controlled bath. The figure
also shows how the reactors were configured for experimentation and how the pH and DO
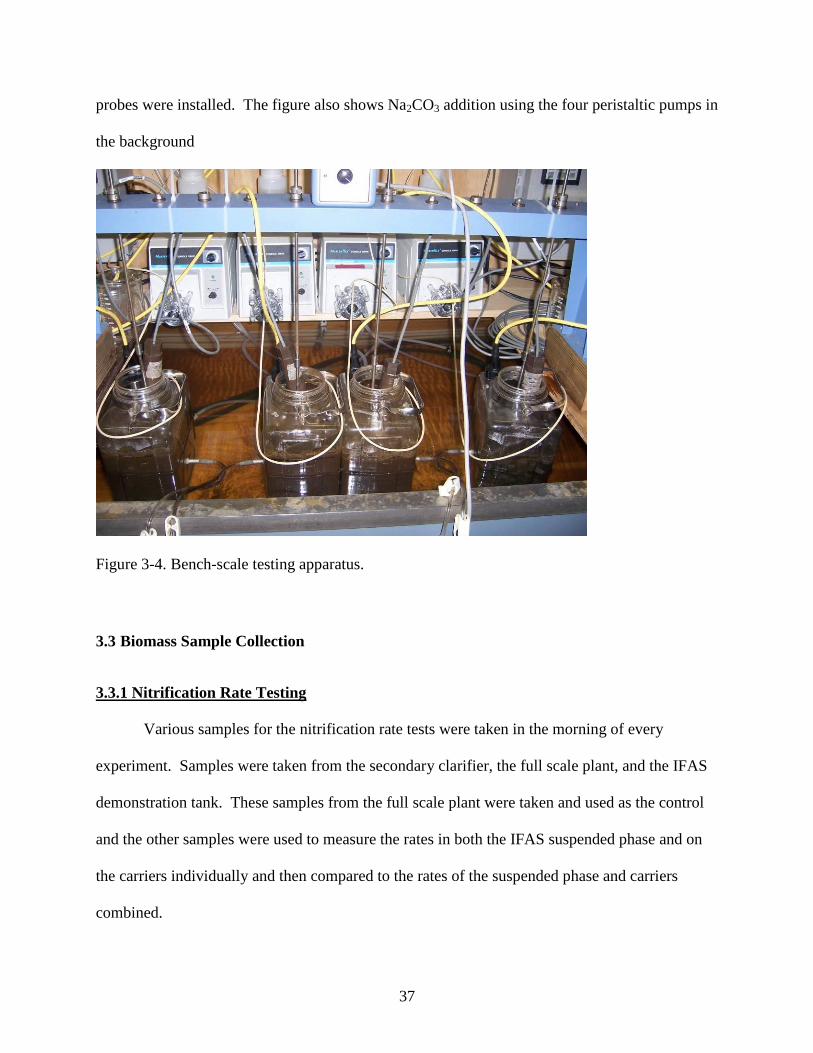
37
probes were installed. The figure also shows Na2CO3 addition using the four peristaltic pumps in
the background
Figure 3-4. Bench-scale testing apparatus.
3.3 Biomass Sample Collection
3.3.1 Nitrification Rate Testing
Various samples for the nitrification rate tests were taken in the morning of every
experiment. Samples were taken from the secondary clarifier, the full scale plant, and the IFAS
demonstration tank. These samples from the full scale plant were taken and used as the control
and the other samples were used to measure the rates in both the IFAS suspended phase and on
the carriers individually and then compared to the rates of the suspended phase and carriers
combined.
38
Samples from the full scale plant aeration basins were collected from the aeration basin
with a 5 gallon bucket. The bucket was tied off to the railings with a 25 ft ¼‖ nylon rope and
thrown into the basin. When the bucket had filled, it was pulled out of the reactor and any
visible foam was removed from the surface of these samples. One bucket, or approximately five
gallons of sample, provided enough biomass for both the AOB and NOB experiments. After
collection, the samples were taken back to the laboratory facilities at the plant and aerated with
air until the biomass was used for the experiments (within 1 hour for AOB and 3 hours for
NOB).
Samples from the IFAS demonstration tank were collected in a similar fashion. Two 5
gallon buckets were used to collect about 10 gallons of sample from the tank. The samples were
collected near the middle of the IFAS zone in the demonstration reactor where there the media
fill fraction was likely to be about 50% by volume. After these samples were taken, they were
carried back to the lab where the media and bulk liquid were separated and used in the three
remaining reactors. This separation was done by pouring the sample into two buckets, one inside
of the other. The inside bucket contained numerous ¼-inch holes drilled into the bottom. The
inner bucket was then lifted out of the outer bucket allowing the mixed liquor to gently drain into
the bucket without holes. The bucket with holes in the bottom now containing media was gently
dipped into a bucket containing secondary effluent to rinse off any remaining biomass not
attached to the media.
In addition to the biomass samples collected on the morning for the experiments, 10
gallons of secondary effluent were collected to be used in the last reactor and to rinse the media
after the separation step.

39
After the samples were collected from the plant, they were divided into four reactors.
The four reactors contained the following biomass:
Reactor 1- 7 L of mixed liquor from the James River Full Scale Plant
Reactor 2- 7 L of IFAS mixed liquor
Reactor 3- 7 L of IFAS mixed liquor with media at 50% fill
Reactor 4- 7 L of Secondary Effluent with media at 50% fill
A 2 L graduated cylinder was used to measure out 3.5 L of media, and the media was
added to each of these reactors. The two reactors were then filled to a previously calibrated line
that represents 7 L. By doing this a 50% fill by volume is achieved and standardized for every
experiment.
The leftover clean secondary effluent, mixed liquor from the full scale plant, and
combination of media and suspended growth from the IFAS were saved for the nitrite spike
experiment. The samples containing biomass were aerated until the nitrite experiment to ensure
that all of the residual ammonia in the samples was oxidized; this eliminated any potential
interference with the NOB in the nitrite experiment.
For campaign experiments used to evaluate specific characteristics of the IFAS process,
the procedures above were followed; though the contents of the individual reactors differed (i.e.
all four reactors filled with media + secondary effluent operated at differing DO setpoint).
3.3.2 Molecular Sampling
Molecular sampling was done in conjunction with the nitrification rate testing. At the
beginning of each test day, samples for both FISH analysis and QPCR analysis were collected
from the suspended growth phase from both the JRWWTP activated sludge and from the IFAS
40
suspended growth bacteria. The samples for QPCR were taken by filling four, 2 mL plastic
microcentrifuge tubes with 1.5 mL samples from the reactor containing mixed liquor from the
full scale plant, and four more 2 mL centrifuge tubes are filled with 2 mL samples from the
reactor containing IFAS mixed liquor. These eight samples were then spun down using a
centrifuge at 14000xg for two minutes. The supernatant was then removed and additional 1.5
mL samples are added to the centrifuge tubes from their respective reactors. These samples are
spun down again at the same speed and duration, and the supernatant is then removed. The
samples are then stored in a -80 °C freezer until they were ready for analysis. When enough
samples had been collected to merit analysis, the molecular samples were shipped on dry ice for
QPCR analysis.
Prior to the molecular sampling a solution of 4% para-formaldehyde was made at the
VMI laboratory facilities and then transported to the plant at 4° C for use in the preservation of
samples collected for FISH analysis. At the same time that samples were taken from Reactors 1
and 2 for QPCR analysis, an additional four 0.5 mL samples were collected from both Reactors
for FISH analysis. After 0.5 mLs of sample had been added to each of the eight centrifuge tubes,
1.5 mL of the pre-prepared 4% para-formaldehyde solution is added to each of the tubes. The
tubes were shaken well and then stored at 4° C until they could be transported back to the VMI
laboratories in Lexington and further processed. After the FISH samples were transported back
to VMI, they were fixed by centrifuging the biomass down at 5000xg and decanting the 4% para-
formaldehyde. Then, 2mL of 1X Phosphate Buffered Saline (PBS) was added to each centrifuge
tube and the biomass was vortexed to break up the pellet. The 1 X PBS solution was made by
addition 8 g NaCl, 0.2 g KCl, 1.44 g Na2HPO4, and 0.24 g KH2PO4, and then adjusting to a
neutral pH. The tubes were centrifuged again at 5000xg and the liquid was discarded and
41
replaced with 2 more mL pf 1 X PBS. This process was repeated once more with the addition of
0.5 mL of 1 X PBS and 0.5 mL of 95% ethanol. The tubes were vortexed and then stored at 4 °C
until ready for analysis. In conjunction with the nitrification rate testing, a QPCR study was
performed on the AOB and NOB in both the fixed film and suspended growth phases. By using
techniques to preserve samples in the ODU lab facilities, samples were collected and saved for
QPCR analysis, which offered insight to the quantity of AOBs and NOBs both in the suspended
growth phase as well as the fixed film phase. The biomass on the carriers was also carefully
removed from the media to yield a sample large enough to run multiple PCR tests.
3.3.3 Carrier Biomass Content Measurements
In addition to the nitrification rate experiments, weekly carrier biomass content samples
were taken for the duration of the project as described by Regmi et al. (2008).
3.4 Experimental Protocol
3.4.1 Nitrification Rate Testing
Immediately after sample addition, the reactors were placed in the temperature-controlled
bath and allowed to stabilize in terms of temperature, pH and DO. The reactors were then spiked
with 40-50 mg/L NH4+-N and continuously sampled every 25 minutes for approximately two
hours. Upon completion of the AOB rate experiment, the contents of the reactors was discarded
and replaced with fresh biomass samples. Aerating the new biomass samples for the duration of
the first experiment helped to minimize residual ammonia in the NOB experiments. The NOB
experiments were conducted identically to the AOB experiment except 40-50 mg/L of NO2--N
was added to the reactors instead of NH4+-N. In addition to spiking each reactor with either
42
ammonia or nitrite, all reactors were also spiked with 5 mg/L-P to ensure that none of the
experiments were nutrient limited by phosphorus.
The samples collected at 25 minute intervals for both the AOB and NOB experiments
were then analyzed for NH4+-N, NO2-N, and NO3-N concentration over time. At the end of
each experiment, samples were also collected for MLSS and MLVSS analysis.
3.4.2 IFAS Performance Testing - Campaigns
3.4.2.1 Half-Saturation Coefficient Evaluation (low NH4+-N and NO2-N): The reactors were
controlled to variable DO concentrations of 2, 4, 6, and 8 mg/L and allowed to mix and aerate
with pure O2 until each reactor reached the desired DO. The reactors were then spiked with
phosphate to ensure that the biomass was not nutrient limited and the reactors are spiked to 25
mg/L of either ammonia or nitrite. After the spike the reactors were sampled at appropriate
intervals to not only capture the linear rate of nitrification, but also the nitrification rate when
substrate concentrations dropped to low levels. The results from these tests were recorded and
analyzed to give the half saturation coefficient using four different DO concentrations. This test
was conducted three times for AOB and NOB activity on the media at 175 RPM and 100 RPM
corresponding to a range of G values summarized in Table 3.1.1 and as twice for AOB and NOB
activity on the media at 100 rpms. In addition to testing the IFAS media, the same experiment
was conducted one for AOB and NOB activity in the mixed liquor at 175 rpms.
3.4.2.2 DO and Mixing: The four reactors, containing secondary effluent and a 50% fill of
media by volume were placed into the temperature-controlled bath. The reactors will be set to
their respective DO concentrations at 2, 4, 6, and 8 mg/L and allowed to mix and aerate with
43
pure O2 until each reactor has reached the desired DO. Three separate experiments will be
conduced in this configuration, each at different mixing velocities of 100 rpm, 140 rpm, and 175
rpm. The reactors will then be spiked with either 25 mg/L-N ammonia or nitrite and sampled
five times over a two hour period. These samples will be analyzed for ammonia, nitrate, and
nitrite. After each two hour experiment, the media and secondary effluent was dumped out of
the reactors and replaced with fresh samples. The next experiment then continued at the next
mixing velocity. This experiment was conducted twice for AOB and NOB on the IFAS media as
well as twice for the AOB and NOB activity in the IFAS mixed liquor.
3.4.2.3 Affect of COD addition on Nitrification Rates: In order to understand how
heterotrophic and autotrophic bacteria are distributed in the IFAS tank, and how COD uptake
affects nitrification rates on the IFAS media and mixed liquor, an experiment was conducted in
which four reactors were run, two containing IFAS mixed liquor and two with IFAS media in
secondary effluent at a measured 50% fill. Of these reactors, one containing mixed liquor, and
the other containing media were spiked with 200 mg/L COD as acetic acid, and then all four
reactors were spiked to 25 mg/L ammonia or nitrite depending on the population of nitrifiers
being studied. The reactors were then sampled 5 times over a two hour period and analysis of
COD uptake, as well as nitrification kinetics.
3.5 Sample Preparation for Analysis
During the rate experiments, the samples collected every 25 minutes were taken from the
reactors using a 30 mL syringe, followed by immediate filtration using a 0.45 µm PES
membrane filter into a scew-cap vial. After filtration, the samples were analyzed for various
44
constituents including NH4+-N, NO2-N, and NO3-N. Samples were normally analyzed in the
field almost immediately after they were collected, and in the case that immediate analysis was
not possible for whatever reason the samples were refrigerated to ensure that accurate analysis
was conducted for each experiment. In all cases, field analyses were completed within 24 hours.
Samples for MLSS and MLVSS analysis were collected in 500 mL HDPE bottles and stored at
4° C until analysis by HRSD Central Environmental Laboratories (CEL). In some cases, filtered
samples were preserved for confirmation testing by HRSD CEL for NH4+-N and NOx-N. This
additional testing provided QA/QC for the analysis performed at the plant.
3.6 Sample Analysis
3.6.1 Total Ammonia Nitrogen (NH4+-N)
For field analysis, NH4+-N was analyzed using HACH colorimetric method TNT plus
832. Colorimetric methods were performed per HACH protocols with evaluation of matrix
interference and other issues as needed.
3.6.2 Nitrate (NO3--N)
For field analysis, NO3--N was analyzed using HACH colorimetric method TNT plus
836. Colorimetric methods were performed per HACH protocols with evaluation of matrix
interference and other issues as needed.
3.6.3 Nitrite (NO2--N)
Nitrite analysis was conducted in the field as soon as possible after sample filtration. The
standard colorimetric method will be performed using HACH Nitriver 3 reagent and 10 mL

45
samples. HACH method 8507 is a low range method, so all samples were diluted to
concentrations between 0.002 and 0.3 mg/L NO2-N and analyzed per standard protocols.
3.6.4 MLSS/MLVSS
Mixed Liquor Suspended Solids and Mixed Liquor Volatile Suspended Solids were
performed by both HRSD laboratories and in the VMI laboratories in accordance with Standard
Methods (2005). Samples were collected for analysis at the end of every experiment and
transported on ice to one of the analysis locations.
3.7 Reference
APHA, AWWA, and WEF.
1995. Standard methods for the examination of water and wastewater. Washington, D.C.:
APHA.
Regmi, P. 2008. Biological Nutrient Removal Upgrade At The James River Wastewater
Treatment Plant. Civil and Environmental Engineering. Old Dominion University, Norfolk, VA.
46
4 MANUSCRIPT 1: IFAS NITRIFICAITON KINETICS
Abstract
The James River Treatment Plant (JRTP) operated a 2 MGD Integrated Fixed Film
Activated Sludge (IFAS) demonstration process from November 2007 to April 2009 to explore
IFAS performance and investigate IFAS technology as an option for a full scale plant upgrade in
response to stricter nutrient discharge limits in the James River Basin. During the study,
nitrification kinetics for both ammonia and nitrite oxidizing bacteria and plastic biofilm carrier
biomass content were monitored on a near-weekly basis comparing the IFAS media, the IFAS
process mixed liquor, and mixed liquor from the full-scale activated sludge process. Carrier
biomass content is variable with respect to temperature and process SRT and relates to the
localization of nitrification activity in the IFAS basin. Similar to trends observed for carrier
biomass content (Regmi, 2008), ammonia oxidizing bacteria (AOB) and nitrite oxidizing
bacteria (NOB) activity also shifted from the fixed film to the suspended phase as water
temperatures increased and vice versa as the temperature decreased. The data suggest that AOB
activity occurs on the surface of the biofilm carriers, while NOB activity remains deeper in the
biofilm. During the highest temperatures observed in the IFAS tank, AOB activity on the media
contributed as little as 30% of the total nitrification activity in the basin, and after temperatures
dropped below 20 °C, AOB activity in the fixed film phase made up 75% of the total activity in
the IFAS basin. During the warmest period of the summer, the media still retained more than
60% of the total NOB activity, and more than 90% of the total NOB activity during the period of
coldest water temperature. This trend also points out that some AOB and NOB activity remained
in the mixed liquor, even during the coldest periods. The retention of nitrification activity in the
mixed liquor indicates that the constant sloughing of biomass off of the carriers allowed for

47
autotrophic activity, even during washout conditions. Carrier biomass content and nitrification
rates on the IFAS media remained constant along the length of the basin, indicating that the
IFAS tank is will mixed with respect to biomass growth, although there was a concentration
gradient for soluble species (NH4-N, NO2-N, NO3-N).
4.1 INTRODUCTION
In 2005, new regulations were implemented as part of the Chesapeake Bay 2000
Agreement which require Hampton Roads Sanitation District (HRSD) wastewater treatment
plants (WWTPs) discharging to the James River Basin to reduce the aggregate mass discharge of
total nitrogen (TN) to 6,000,000 lbs/year (Water Quality Management Planning Regulation ).
HRSD staff concluded that biological nutrient removal with IFAS should be employed at the
16.7 MGD James River Treatment Plant (JRTP) as a cost effective strategy to help achieve this
aggregate goal, decreasing effluent TN at this facility to approximately 12 mg/L (annual
average). However, IFAS remains a relatively new approach for boosting nitrogen removal
performance, and there are still a number of fundamental and applied aspects of this technology
that are not clearly understood. Process kinetics are not well defined with respect to variables
including dissolved oxygen (DO), mixing intensity/regime, temperature, and localization of
AOB and NOB activity. IFAS models that combine an IWA-style activated sludge model with a
fundamental non-empirical biofilm model (considering external mass transfer and multi-
component biofilm diffusion) have been developed, but calibrated with limited full-scale
experience.
HRSD elected to conduct a demonstration-scale IFAS study at JRTP to evaluate the
performance of this process and to develop design criteria before implementation on a wider
48
scale. For this demonstration project, a single existing fully-aerobic conventional aeration basin
with dedicated secondary clarification, which was previously operated to achieve nitrification
during warm weather months only, was converted to a 1.86 MGD (2.22 MGD max month) IFAS
train in an MLE configuration with a 50% fill of AnoxKaldnes plastic biofilm carriers in the
aerobic zone only (K3 with a specific surface area of 500 m2/m
3). The IFAS process was
targeted to achieve complete, year-round nitrification at an operating solids residence time (SRT)
well below the washout value for nitrifiers during cold weather periods, suggesting that AOB
and NOB must colonize the IFAS carriers (McQuarrie et al. 2004)
Figure 4-1 represents a process flow diagram (PFD) of the IFAS demonstration tank at
the JRTP. The demonstration is set up in the MLE fashion as shown below. The tank has two
internal mixed liquor recycle pumps that were operated to not only return mixed liquor to the
IFAS tank, but also to manage the distribution of media in the tank. For much of the duration of
the demonstration study, the majority of internal mixed liquor recycle was performed by IMLR
pump 1 to ensure that media concentrations in the IFAS tank were roughly homogeneous and to
prevent media accumulation near the screens. During plant operation, the flows through IMLR
pump 1 and IMLR pump 2 varied, but averaged as about 275% through IMLR pump 1 and 130%
through IMLR pump 2. Operating the two IMLR pumps in this fashion created some concern
with substrate short circuiting through IMLR pump 1, but after performing tracer testing, it was
determined that an insignificant amount of substrate recycle was occurring and that nitrate
recirculation to the anoxic zone was occurring. R1, R2, and R3 are all anoxic zones, and zone
R4 is the tank volume dedicated to IFAS. The smaller R5 zone is also aerobic, but does not
contain any IFAS media. For most of the duration of the demonstration the plant performed
Garrett wasting except for December 2008, when the plant also wasted some sludge from the

49
secondary clarifier. The WAS stream was also used to seed the full scale plant that was not
operated for complete nitrification. This seeding allowed nitrifiers to be present in the full scale
plant and enabled the full scale plant to achieve nitrification throughout the year.
R1 R2 R3R4
IFAS ZONE
R5
IMLR 2
IMLR 1
Anoxic Aerobic
RAS
Primary Effluent
Secondary Effluent
WAS (to
thickening or Full
Scale Plant)
R1 R2 R3R4
IFAS ZONE
R5
IMLR 2
IMLR 1
Anoxic Aerobic
RAS
Primary Effluent
Secondary Effluent
WAS (to
thickening or Full
Scale Plant)
Figure 4-1. Process Flow Diagram of IFAS Demonstration
The IFAS process has been demonstrated to achieve complete nitrification, even at
temperatures as low as 8 °C (Hubbell et al. 2003). Not only does the IFAS process offer the
potential for year round nitrification, the technology has demonstrated much higher nitrification
kinetics than can be achieved in a conventional activated sludge process (Ross et al. 2004).
Furthermore, sloughing of nitrifiers from the IFAS carriers would be expected to ―temporarily
bioaugment‖ suspended biomass, providing additional nitrification capacity (Choi et al. 2007).
Although nitrification rates have been measured in conjunction with IFAS demonstrations that
have been conducted previously, no study has been performed that monitors nitrification rates
and localization of AOB and NOB activity over the course of a year spanning a range of
temperatures (Onnis-Hayden et al. 2007, Yerrell et al. 2001).
At the Broomfield wastewater treatment plant in Broomfield, CO, the IFAS exhibited
higher and more consistent removal efficiency than activated sludge (McQuarrie et al. 2004).
50
McQuarrie et al. (2004) also reports that effluent ammonia concentrations for the Broomfield
WWTP were consistently under 1 mg/L-N when the IFAS process had been implemented, where
pre-IFAS effluent ammonia ranged much higher, up to 12 mg/L-N. Hubbell et al. (2004) also
reported a significant improvement of ammonia removal capacity of an IFAS upgrade
demonstration compared with conventional activated sludge. At the Donner Summit Public
Utility District IFAS upgrade, significant ammonia oxidation was reported, even with influent
wastewater temperatures as low as 8°C (Hubbell et al. 2004). According to the work done by
Onnis- Hayden et al. (2007), AOB nitrification rates of 5.04 g/m2/day were observed at
temperatures of 20 °C at the Mamaroneck WWTP demonstration. This same study also
demonstrated that nitrification rates in the second stage were evenly split between the mixed
liquor and the media(Onnis-Hayden et al. 2007).
Another full scale demonstration conducted in the Christies Beach WWTP in South
Australia demonstrated that by adding IFAS media to a conventional activated sludge plant
essentially doubled the nitrification rates at the wastewater treatment plant, where IFAS nitrate
production was measured at 0.19 mg/L/min and activated sludge nitrate production rate was
0.088 mg/L/min (Yerrell et al. 2001). Pilot testing of the IFAS process was also conducted at the
Mamaroneck WWTP, which experienced about 90% ammonia removal by mass and also
experienced about 90% removal of total nitrogen by mass with a post anoxic zone (Johnson et al.
2007). In addition to the Mamaroneck demonstration, the Norman Cole Demonstration in
Fairfax County, VA was able to meet the 2.0 mg/L effluent NOX-N standard in 18.5-20 °C
wastewater with an average of 0.86 of a short stable period of operation in a last pass IFAS
configuration (Motsch et al. 2007).

51
The goal of this research was to measure nitrification rates for both ammonia oxidizing
bacteria (AOB) and nitrite oxidizing bacteria (NOB) in both suspended growth and fixed film
phases from the IFAS demonstration tank at the James River Wastewater Treatment Plant
(JRWWTP), in Newport News, Virginia. The specific research goals for this project were:
Compare nitrification rates measured from January 2008 through January 2009 to find a clear
relationship between warm and cold weather conditions on nitrification rates on both the
carriers and IFAS mixed liquor and how they compare to mixed liquor from the full scale
unmodified aeration basins at the JRTP
Determine localization of AOB and NOB activity in both phases of the IFAS process
Achieve a better understanding of IFAS process kinetics
Other experimentation was conducted in conjunction with this testing to achieve a
number of goals related to evaluating the IFAS process including:
Weekly biomass measurements on the IFAS media
Normal process sampling was performed by HRSD to manage process performance and
optimize TN removal in the IFAS basin
4.2 METHODOLOGY
Nitrification rates were measured on a near-weekly basis from January 2008 through
January 2009. Each day nitrification rates were measured, two experiments were conducted to
quantify AOB (NOX production basis) and NOB (NO3 production basis) activity. These rates
were measured in the full scale plant mixed liquor for a control, as well as the IFAS mixed
liquor, the IFAS media, and the IFAS mixed liquor and media combined. These rates were then
normalized to mixed liquor concentrations, media surface, and biofilm content depending on the
52
contents of each reactor. These measurements were then used to compare performance for each
phase of biomass and determine the localization of AOB and NOB populations in the IFAS
process.
4.2.1 Bench Scale Reactor Construction
The batch reactors were constructed from 9 L, rectangular, clear polycarbonate containers with
screw-cap lids with an active reactor volume of 7 L. The mixer paddle extended through the
screw-cap opening, and holes were drilled in the top of the container to insert DO and pH probes.
The four reactors were aerated through an air stone and were fed pure oxygen at a low rate,
which maintained DO roughly between 3 and 5 mg/L, unless otherwise noted. The reactors were
also equipped with a sample port located in the middle of the active volume which allowed for
samples to be taken throughout the course of the various experiments performed.
The reactors were placed in a temperature-controlled water bath, and the temperature in
each individual reactor in order to maintain a temperature consistent with the temperature of the
IFAS tank, which was read and recorded every morning at the time at which the sample is taken.
The bath was turned on the day before sample collection to allow time for the bath to adjust to
the appropriate temperature.
The pH in the reactors was controlled to a setpoint between 7.2 and 7.3 for both the
ammonia spike and for the nitrite spike experiment. Automatic addition of alkalinity in the form
of a concentrated Na2CO3 solution was provided with Masterflex peristaltic pumps and on/off
control to each reactor as needed. If the pH increased to higher than the controlled values, acid
was added manually to return the reactor to the desired experimental pH. pH was also logged
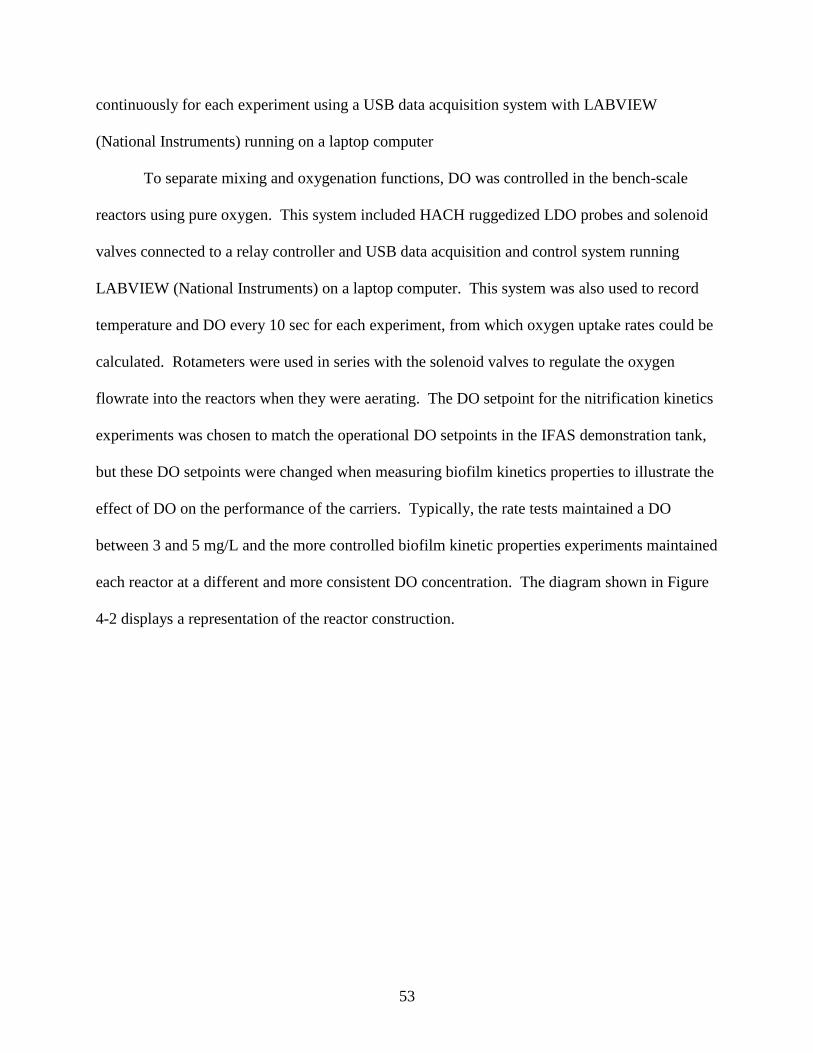
53
continuously for each experiment using a USB data acquisition system with LABVIEW
(National Instruments) running on a laptop computer
To separate mixing and oxygenation functions, DO was controlled in the bench-scale
reactors using pure oxygen. This system included HACH ruggedized LDO probes and solenoid
valves connected to a relay controller and USB data acquisition and control system running
LABVIEW (National Instruments) on a laptop computer. This system was also used to record
temperature and DO every 10 sec for each experiment, from which oxygen uptake rates could be
calculated. Rotameters were used in series with the solenoid valves to regulate the oxygen
flowrate into the reactors when they were aerating. The DO setpoint for the nitrification kinetics
experiments was chosen to match the operational DO setpoints in the IFAS demonstration tank,
but these DO setpoints were changed when measuring biofilm kinetics properties to illustrate the
effect of DO on the performance of the carriers. Typically, the rate tests maintained a DO
between 3 and 5 mg/L and the more controlled biofilm kinetic properties experiments maintained
each reactor at a different and more consistent DO concentration. The diagram shown in Figure
4-2 displays a representation of the reactor construction.

54
Pure O2
HACH LDO
Probe
pH Probe
Flat Paddle
Mixer
Na2CO3
addition
7 L water
level
Pure O2
HACH LDO
Probe
pH Probe
Flat Paddle
Mixer
Na2CO3
addition
7 L water
level
Figure 4-2. Diagram of Reactor Construction
Mixing was provided by flat paddle mixers (dimensions = 3 in x 1 in) using a Phipps and
Bird Jar Tester stirring apparatus to ensure that the same mixing energy was being imparted to all
four reactors, simultaneously. Because the reactors were placed in a temperature-controlled bath
and the standard Phipps and Bird mixers were unable to reach the bulk liquid in the reactors,
each paddle was extended with a ¼-inch steel rod and couplings. The reactor speed was set at
175 rpm for all of the nitrification experiments and 140 rpm and 100 rpm, respectively, for the
campaign experiments testing half saturation effects and DO and mixing. These mixing speeds
ultimately translated to G values which varied as described by Table 4-1.
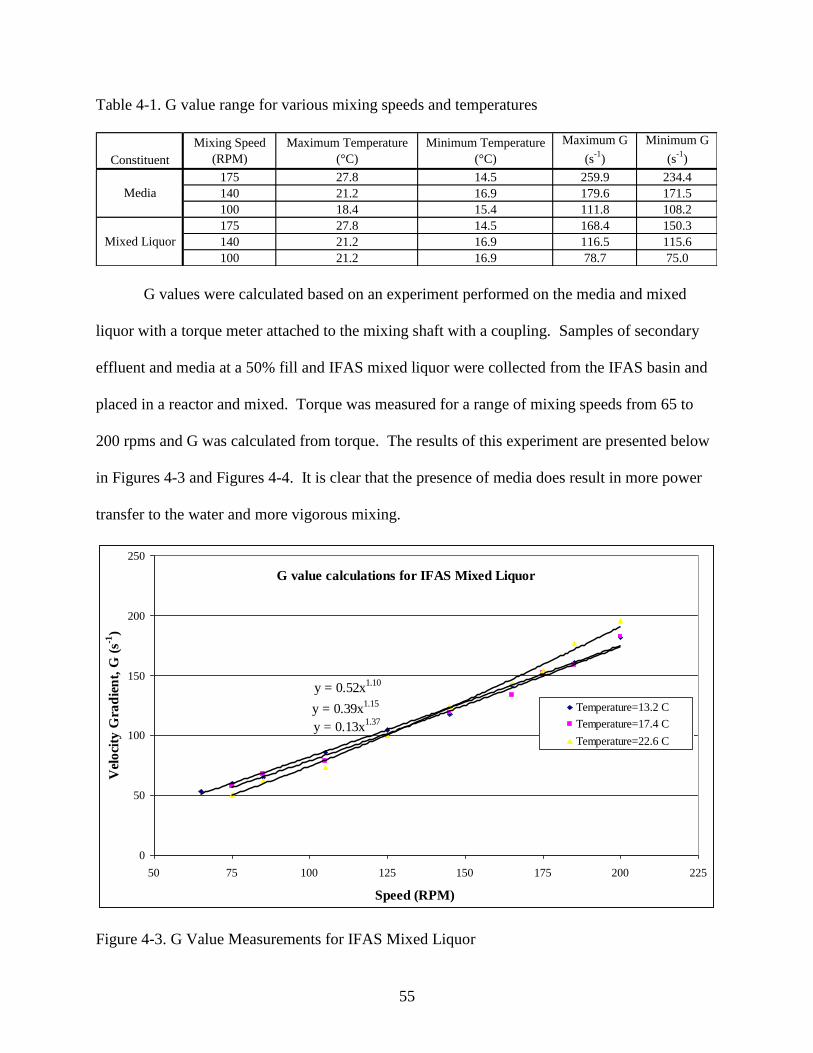
55
Table 4-1. G value range for various mixing speeds and temperatures
Constituent
Mixing Speed
(RPM)
Maximum Temperature
(°C)
Minimum Temperature
(°C)
Maximum G
(s-1
)
Minimum G
(s-1
)
175 27.8 14.5 259.9 234.4
140 21.2 16.9 179.6 171.5
100 18.4 15.4 111.8 108.2
175 27.8 14.5 168.4 150.3
140 21.2 16.9 116.5 115.6
100 21.2 16.9 78.7 75.0
Media
Mixed Liquor
G values were calculated based on an experiment performed on the media and mixed
liquor with a torque meter attached to the mixing shaft with a coupling. Samples of secondary
effluent and media at a 50% fill and IFAS mixed liquor were collected from the IFAS basin and
placed in a reactor and mixed. Torque was measured for a range of mixing speeds from 65 to
200 rpms and G was calculated from torque. The results of this experiment are presented below
in Figures 4-3 and Figures 4-4. It is clear that the presence of media does result in more power
transfer to the water and more vigorous mixing.
G value calculations for IFAS Mixed Liquor
y = 0.52x1.10
y = 0.39x1.15
y = 0.13x1.37
0
50
100
150
200
250
50 75 100 125 150 175 200 225
Speed (RPM)
Vel
oci
ty G
rad
ien
t, G
(s-1
)
Temperature=13.2 C
Temperature=17.4 C
Temperature=22.6 C
Figure 4-3. G Value Measurements for IFAS Mixed Liquor
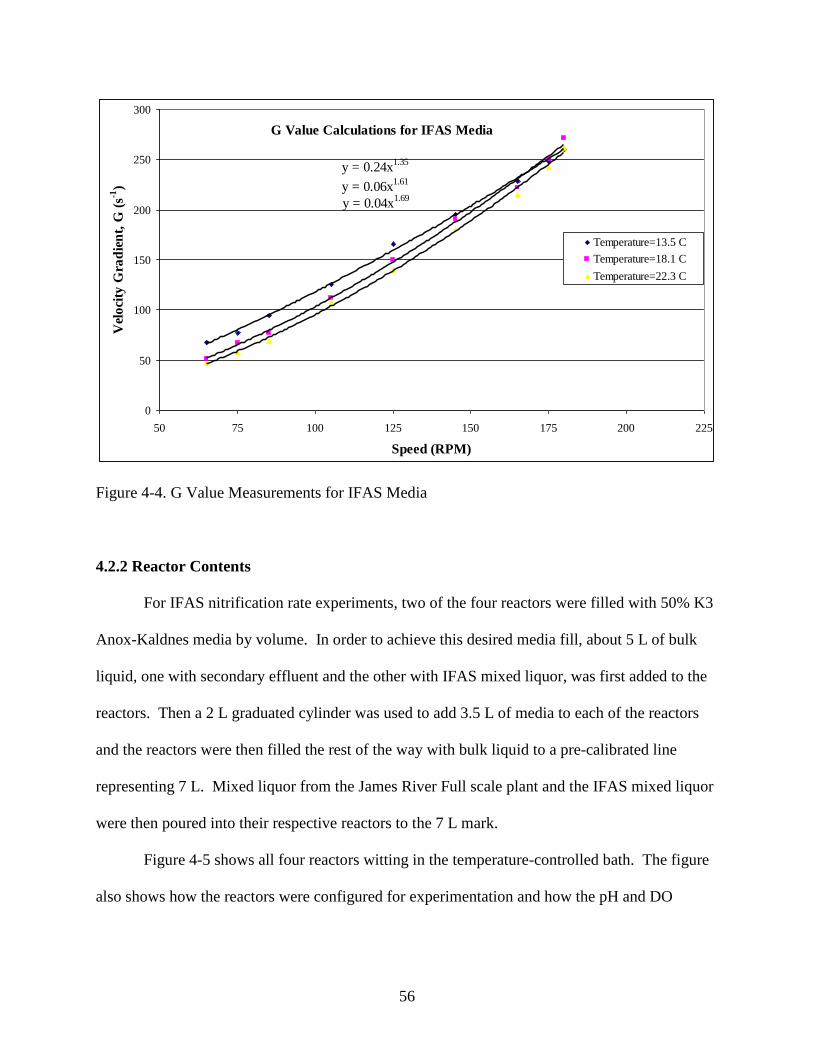
56
G Value Calculations for IFAS Media
y = 0.24x1.35
y = 0.06x1.61
y = 0.04x1.69
0
50
100
150
200
250
300
50 75 100 125 150 175 200 225
Speed (RPM)
Vel
oci
ty G
rad
ien
t, G
(s-1
)
Temperature=13.5 C
Temperature=18.1 C
Temperature=22.3 C
Figure 4-4. G Value Measurements for IFAS Media
4.2.2 Reactor Contents
For IFAS nitrification rate experiments, two of the four reactors were filled with 50% K3
Anox-Kaldnes media by volume. In order to achieve this desired media fill, about 5 L of bulk
liquid, one with secondary effluent and the other with IFAS mixed liquor, was first added to the
reactors. Then a 2 L graduated cylinder was used to add 3.5 L of media to each of the reactors
and the reactors were then filled the rest of the way with bulk liquid to a pre-calibrated line
representing 7 L. Mixed liquor from the James River Full scale plant and the IFAS mixed liquor
were then poured into their respective reactors to the 7 L mark.
Figure 4-5 shows all four reactors witting in the temperature-controlled bath. The figure
also shows how the reactors were configured for experimentation and how the pH and DO
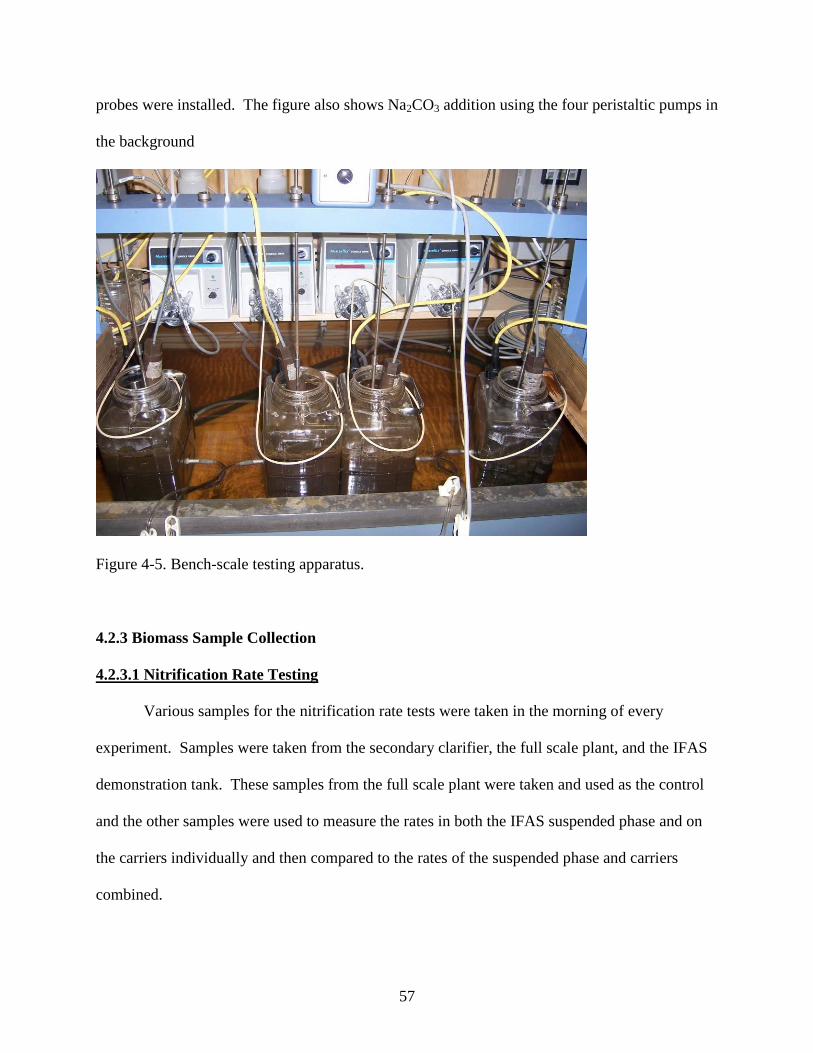
57
probes were installed. The figure also shows Na2CO3 addition using the four peristaltic pumps in
the background
Figure 4-5. Bench-scale testing apparatus.
4.2.3 Biomass Sample Collection
4.2.3.1 Nitrification Rate Testing
Various samples for the nitrification rate tests were taken in the morning of every
experiment. Samples were taken from the secondary clarifier, the full scale plant, and the IFAS
demonstration tank. These samples from the full scale plant were taken and used as the control
and the other samples were used to measure the rates in both the IFAS suspended phase and on
the carriers individually and then compared to the rates of the suspended phase and carriers
combined.

58
Samples from the full scale plant aeration basins were collected from the aeration basin
with a 5 gallon bucket. The bucket was tied off to the railings with a 25 ft ¼‖ nylon rope and
thrown into the basin. When the bucket had filled, it was pulled out of the reactor and any
visible foam was removed from the surface of these samples. One bucket, or approximately five
gallons of sample, provided enough biomass for both the AOB and NOB experiments. After
collection, the samples were taken back to the laboratory facilities at the plant and aerated with
air until the biomass was used for the experiments (within 1 hour for AOB and 3 hours for
NOB).
Samples from the IFAS demonstration tank were collected in a similar fashion. Two 5
gallon buckets were used to collect about 10 gallons of sample from the tank. The samples were
collected near the middle of the IFAS zone in the demonstration reactor where there the media
fill fraction was likely to be about 50% by volume. After these samples were taken, they were
carried back to the lab where the media and bulk liquid were separated and used in the three
remaining reactors. This separation was done by pouring the sample into two buckets, one inside
of the other. The inside bucket contained numerous ¼-inch holes drilled into the bottom. The
inner bucket was then lifted out of the outer bucket allowing the mixed liquor to gently drain into
the bucket without holes. The bucket with holes in the bottom now containing media was gently
dipped into a bucket containing secondary effluent to rinse off any remaining biomass not
attached to the media.
In addition to the biomass samples collected on the morning for the experiments, 10
gallons of secondary effluent were collected to be used in the last reactor and to rinse the media
after the separation step.
59
After the samples were collected from the plant, they were divided into four reactors.
The four reactors contained the following biomass:
Reactor 1- 7 L of mixed liquor from the James River Full Scale Plant
Reactor 2- 7 L of IFAS mixed liquor
Reactor 3- 7 L of IFAS mixed liquor with media at 50% fill
Reactor 4- 7 L of Secondary Effluent with media at 50% fill
A 2 L graduated cylinder was used to measure out 3.5 L of media, and the media was
added to each of these reactors. The two reactors were then filled to a previously calibrated line
that represents 7 L. By doing this a 50% fill by volume is achieved and standardized for every
experiment.
The leftover clean secondary effluent, mixed liquor from the full scale plant, and
combination of media and suspended growth from the IFAS were saved for the nitrite spike
experiment. The samples containing biomass were aerated until the nitrite experiment to ensure
that all of the residual ammonia in the samples was oxidized; this eliminated any potential
interference with the NOB in the nitrite experiment.
4.2.3.2 Carrier Biomass Content Measurements
In addition to the nitrification rate experiments, weekly carrier biomass content samples
were taken for the duration of the project as described by Regmi et al (2008).
60
4.2.4 Experimental Protocol
4.2.4.1 Nitrification Rate Testing
Immediately after sample addition, the reactors were placed in the temperature-controlled
bath and allowed to stabilize in terms of temperature, pH and DO. The reactors were then spiked
with 40-50 mg/L NH4+-N and continuously sampled every 25 minutes for approximately two
hours. Upon completion of the AOB rate experiment, the contents of the reactors was discarded
and replaced with fresh biomass samples. Aerating the new biomass samples for the duration of
the first experiment helped to minimize residual ammonia in the NOB experiments. The NOB
experiments were conducted identically to the AOB experiment except 40-50 mg/L of NO2—
N
was added to the reactors instead of NH4+-N. In addition to spiking each reactor with either
ammonia or nitrite, all reactors were also spiked with 5 mg/L-P to ensure that none of the
experiments were nutrient limited by phosphorus.
The samples collected at 25 minute intervals for both the AOB and NOB experiments
were then analyzed for NH4+-N, NO2-N, and NO3-N concentration over time. At the end of
each experiment, samples were also collected for MLSS and MLVSS analysis.
4.2.5 Sample Preparation for Analysis
During the rate experiments, the samples collected every 25 minutes were taken from the
reactors using a 30mL syringe, followed by immediate filtration using a 0.45 µm PES membrane
filter into a scew-cap vial. After filtration, the samples were analyzed for various constituents
including NH4+-N, NO2-N, and NO3-N. Samples were normally analyzed in the field almost
immediately after they were collected, and in the case that immediate analysis was not possible
for whatever reason the samples were refrigerated to ensure that accurate analysis was conducted
61
for each experiment. In all cases, field analyses were completed within 24 hours. Samples for
MLSS and MLVSS analysis were collected in 500 mL HDPE bottles and stored at 4° C until
analysis by HRSD Central Environmental Laboratories (CEL). In some cases, filtered samples
were preserved for confirmation testing by HRSD CEL for NH4+-N and Nox-N. This additional
testing provided QA/QC for the analysis performed at the plant.
4.2.6 Sample Analysis
4.2.6.1 Total Ammonia Nitrogen (NH4+-N)
For field analysis, NH4+-N was analyzed using HACH colorimetric method TNT plus
832. Colorimetric methods were performed per HACH protocols with evaluation of matrix
interference and other issues as needed.
4.2.6.2 Nitrate (NO3—
N)
For field analysis, NO3—
N was analyzed using HACH colorimetric method TNT plus
836. Colorimetric methods were performed per HACH protocols with evaluation of matrix
interference and other issues as needed.
4.2.6.3 Nitrite (NO2—
N)
Nitrite analysis was conducted in the field as soon as possible after sample filtration. The
standard colorimetric method will be performed using HACH Nitriver 3 reagent and 10 mL
samples. HACH method 8507 is a low range method, so all samples were diluted to
concentrations between 0.002 and 0.3 mg/L NO2-N and analyzed per standard protocols.
62
4.2.6.4 MLSS/MLVSS
Mixed Liquor Suspended Solids and Mixed Liquor Volatile Suspended Solids were
performed by both HRSD laboratories and in the VMI laboratories in accordance with Standard
Methods. Samples were collected for analysis at the end of every experiment and transported on
ice to one of the analysis locations.
4.3 RESULTS & DISCUSSION
4.3.1 Plant Operation and Performance Data
IFAS process temperature, SRT and effluent TN are plotted as a 7-day rolling average in
Figures 4-6 and 4-7 below. Because the IFAS process began operation in November 2007, and
flow into the IFAS tank was not stabilized until early 2008, a period of acclimation until March
2008 caused unstable performance in the IAS tank. After this acclimation period, the IFAS
performance stabilized and nitrification rate tests could begin to offer insight to how and where
nitrification activity in the IFAS tank was occurring. Figures 4-6 and 4-7 also highlight periods
where external carbon was added, first a sugar-based beverage waste, followed by a crude
glycerol product from a biodiesel plant using rendered poultry fat as its feedstock. The sugar
waste addition from May 28 through June 30 resulted in a possible yeast overgrowth in the IFAS
tank that affected both the IFAS mixed liquor as well as the carriers. In a response to the
reported overgrowth of yeast, the process SRT in the IFAS tank was lowered from about 8 days
to 4 days, to washout the yeast in the tank allowing the IFAS tank to resume normal
performance. This occurred because a period when maximum wasting rates were not able to
control mixed liquor concentrations properly in the tank, and high mixed liquor suspended solids
were present in the tank. With the exception of this period of upset, plant SRT was maintained
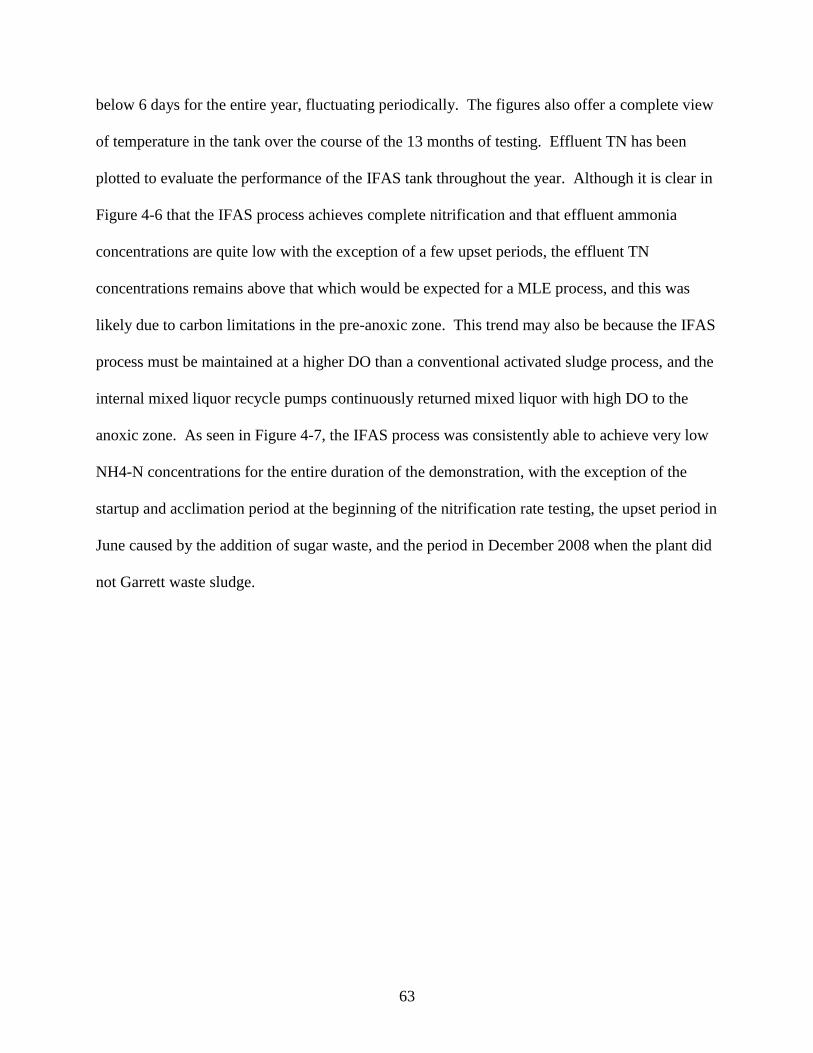
63
below 6 days for the entire year, fluctuating periodically. The figures also offer a complete view
of temperature in the tank over the course of the 13 months of testing. Effluent TN has been
plotted to evaluate the performance of the IFAS tank throughout the year. Although it is clear in
Figure 4-6 that the IFAS process achieves complete nitrification and that effluent ammonia
concentrations are quite low with the exception of a few upset periods, the effluent TN
concentrations remains above that which would be expected for a MLE process, and this was
likely due to carbon limitations in the pre-anoxic zone. This trend may also be because the IFAS
process must be maintained at a higher DO than a conventional activated sludge process, and the
internal mixed liquor recycle pumps continuously returned mixed liquor with high DO to the
anoxic zone. As seen in Figure 4-7, the IFAS process was consistently able to achieve very low
NH4-N concentrations for the entire duration of the demonstration, with the exception of the
startup and acclimation period at the beginning of the nitrification rate testing, the upset period in
June caused by the addition of sugar waste, and the period in December 2008 when the plant did
not Garrett waste sludge.
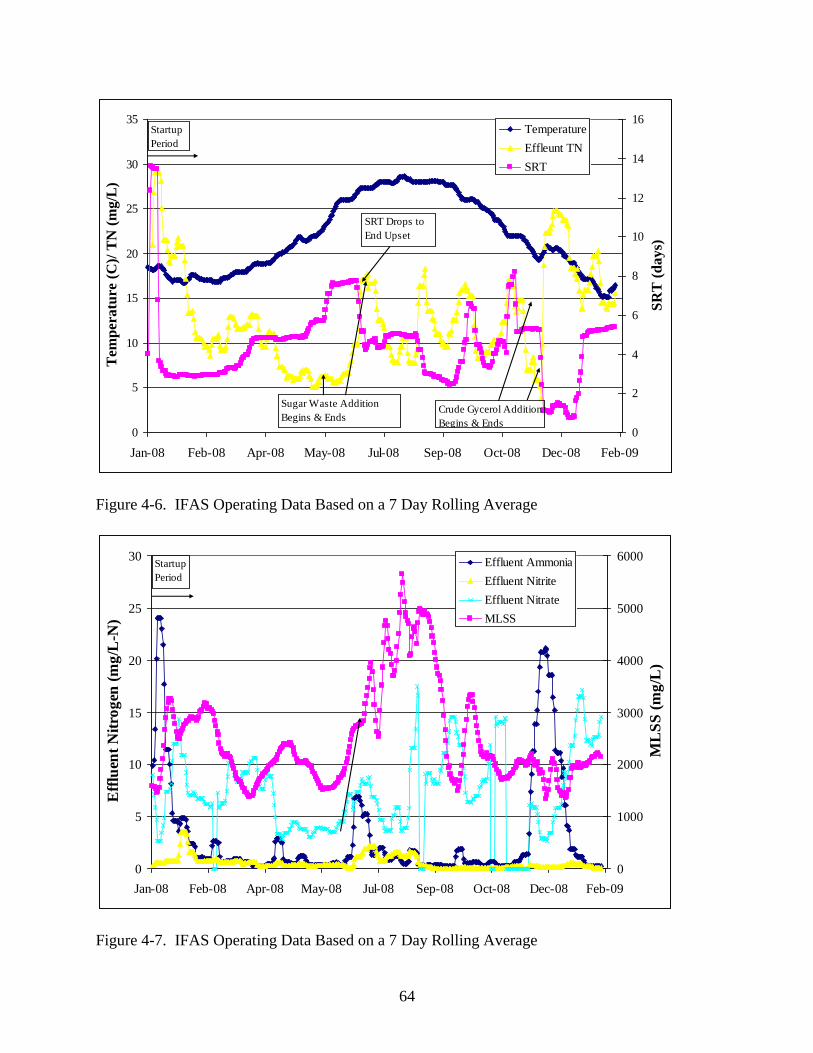
64
0
5
10
15
20
25
30
35
Jan-08 Feb-08 Apr-08 May-08 Jul-08 Sep-08 Oct-08 Dec-08 Feb-09
Tem
per
atu
re (
C)/
TN
(m
g/L
)
0
2
4
6
8
10
12
14
16
SR
T (
da
ys)
Temperature
Effleunt TN
SRT
Sugar Waste Addition
Begins & EndsCrude Gycerol Addition
Begins & Ends
SRT Drops to
End Upset
Startup
Period
Figure 4-6. IFAS Operating Data Based on a 7 Day Rolling Average
0
5
10
15
20
25
30
Jan-08 Feb-08 Apr-08 May-08 Jul-08 Sep-08 Oct-08 Dec-08 Feb-09
Eff
luen
t N
itro
gen
(m
g/L
-N)
0
1000
2000
3000
4000
5000
6000
ML
SS
(m
g/L
)
Effluent Ammonia
Effluent Nitrite
Effluent Nitrate
MLSS
Startup
Period
Figure 4-7. IFAS Operating Data Based on a 7 Day Rolling Average
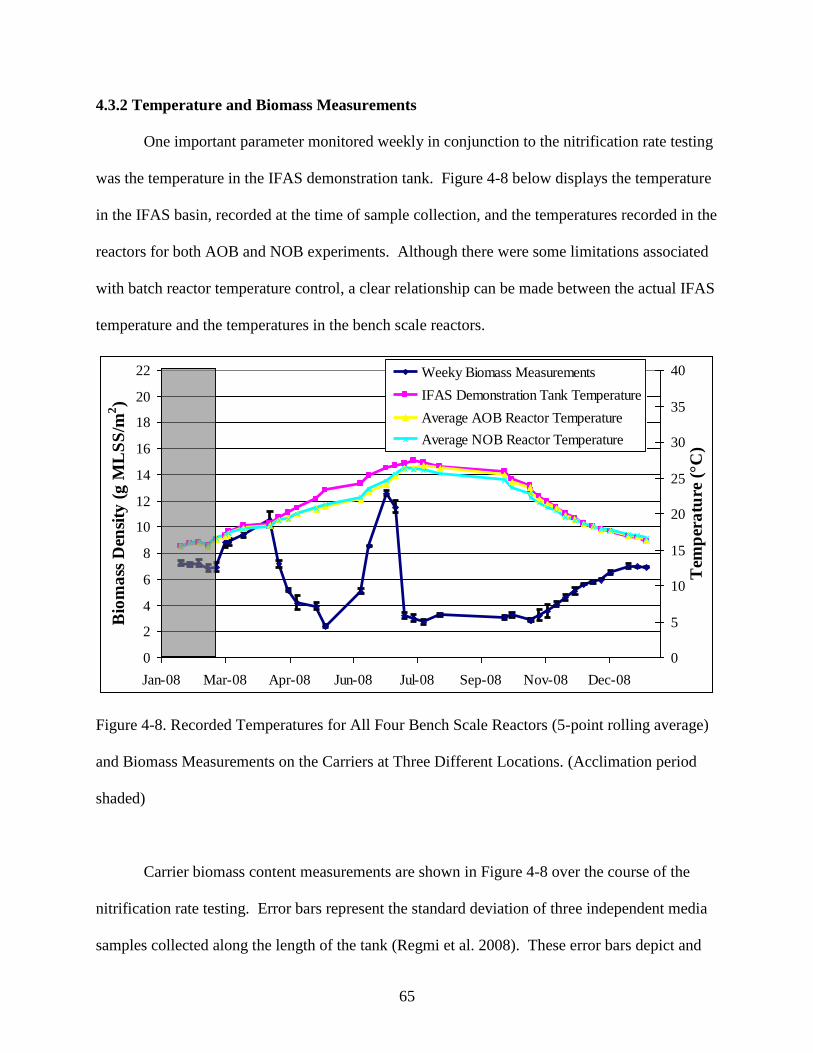
65
4.3.2 Temperature and Biomass Measurements
One important parameter monitored weekly in conjunction to the nitrification rate testing
was the temperature in the IFAS demonstration tank. Figure 4-8 below displays the temperature
in the IFAS basin, recorded at the time of sample collection, and the temperatures recorded in the
reactors for both AOB and NOB experiments. Although there were some limitations associated
with batch reactor temperature control, a clear relationship can be made between the actual IFAS
temperature and the temperatures in the bench scale reactors.
0
2
4
6
8
10
12
14
16
18
20
22
Jan-08 Mar-08 Apr-08 Jun-08 Jul-08 Sep-08 Nov-08 Dec-08
Bio
ma
ss D
ensi
ty (
g M
LS
S/m
2)
0
5
10
15
20
25
30
35
40
Tem
per
atu
re (
°C)
Weeky Biomass Measurements
IFAS Demonstration Tank Temperature
Average AOB Reactor Temperature
Average NOB Reactor Temperature
Figure 4-8. Recorded Temperatures for All Four Bench Scale Reactors (5-point rolling average)
and Biomass Measurements on the Carriers at Three Different Locations. (Acclimation period
shaded)
Carrier biomass content measurements are shown in Figure 4-8 over the course of the
nitrification rate testing. Error bars represent the standard deviation of three independent media
samples collected along the length of the tank (Regmi et al. 2008). These error bars depict and
66
important observation made for the duration of the nitrification rate testing, that biomass
measurements did not change along the length of the IFAS tank. This observation implies that
biofilm on the media reached a steady state, where the rate of sloughing equaled the rate of
biomass growth on the biofilm, and biomass concentrations on the media were maintained by
mixing in the tank. The increase of biomass until late March was likely due to continued
acclimation of the IFAS tank and a time where the biofilm had not yet reached steady state
conditions. The trend presented in Figure 4-8 shows that temperature plays a key role in
determining the biomass content in the biofilm. Colder temperatures that normally result in
washout conditions promote autotrophic growth on the media, where nitrifiers can experience an
extended SRT. Furthermore, temperature impacts the mixing energy imparted to the process,
which in turn controls sloughing. Since DO demand can be met with less aeration in colder
temperatures, and mixing energy in the tank is controlled through aeration, the increase in
biomass in colder temperatures could also result from reduced mixing viscosity or lower G
values. Biomass content on the carriers also shows a clear reduction in warmer conditions.
During this time, process SRT was increasing, and with longer SRT and warmer temperatures,
autotrophic growth is promoted in the mixed liquor.
During these times, Figure 4-8 clearly shows a migration of biomass off of the carriers
and into the suspended fraction. For the duration of June, an upset period associated with the
addition of sugar waste resulting in possible yeast proliferation can be found on the figure.
During this upset, process SRT increased, process DO decreased, and some heterotrophic growth
was likely transferred out of the pre-anoxic to the IFAS zone due to carbon addition, all of which
lead to a significant increase in carrier biomass. In order to end the upset and resume normal
operation, carbon addition was terminated and process DO and wasting were increased, resulting
67
in a lower SRT, which is associated with the loss of carrier biomass. As IFAS temperatures
cooled into the winter of 2008/2009, carrier biomass increased as expected. At this time, process
SRT ranged from 2 to 5 days resulting in a migration of autotrophic growth onto the media
where nitrifiers could be exposed to longer SRTs.
Figure 4-9 below demonstrates the clear relationship between temperature and carrier
biomass content between 17° C and 23° C where the densities fluctuate linearly from 3 g
MLSS/m2 and 7 g MLSS/m
2. The plot also illustrates the minimum and maximum biomass
concentrations on the carriers. At temperatures above 23° C, the biomass no longer increases on
the carriers, and the same is true for the biomass on the carriers at temperatures below 17° C.
Figure 4.5 also includes biomass concentrations taken during times of upset for the IFAS tank.
The most notable upset period was the yeast overgrowth in the tank in the early summer as a
result of adding sugar waste as an external carbon source to the anoxic zone before the IFAS
process. The unstable operating period associated with the start up of the demonstration tank is
also responsible for some of the outliers at lower temperatures.

68
y = -0.64x + 17.56
R2 = 0.94
0
2
4
6
8
10
12
14
15.0 17.0 19.0 21.0 23.0 25.0 27.0 29.0
Temperature (°C)
Bio
ma
ss D
ensi
ty (
g M
LS
S/m
2)
Outliers Resulting from Sugar
Waste Upset Event
Outliers Resulting from Process Startup
and Acclimation
Figure 4-9. Biomass Measurements on the Carriers vs. Temperature
4.3.3 Typical Nitrification Rate Test Results
Mixing intensity in the IFAS basin can be calculated using air flow into the coarse bubble
aerators. Figure 4-10 below plots the velocity gradient in the basin for the course of the
nitrification rate testing. The plot indicates that G in the IFAS tank remains relatively constant
over the course of the year at about 250 s-1
. This shows that as temperatures cool and the
aeration requirements decrease to maintain DO in the tank. Because of this drop in aeration,
mixing decreases slightly, however, as the water becomes more viscous during cooling, the G
value for the same air flow increases. It is this phenomenon that allows the velocity gradient to
remain relatively constant year round.
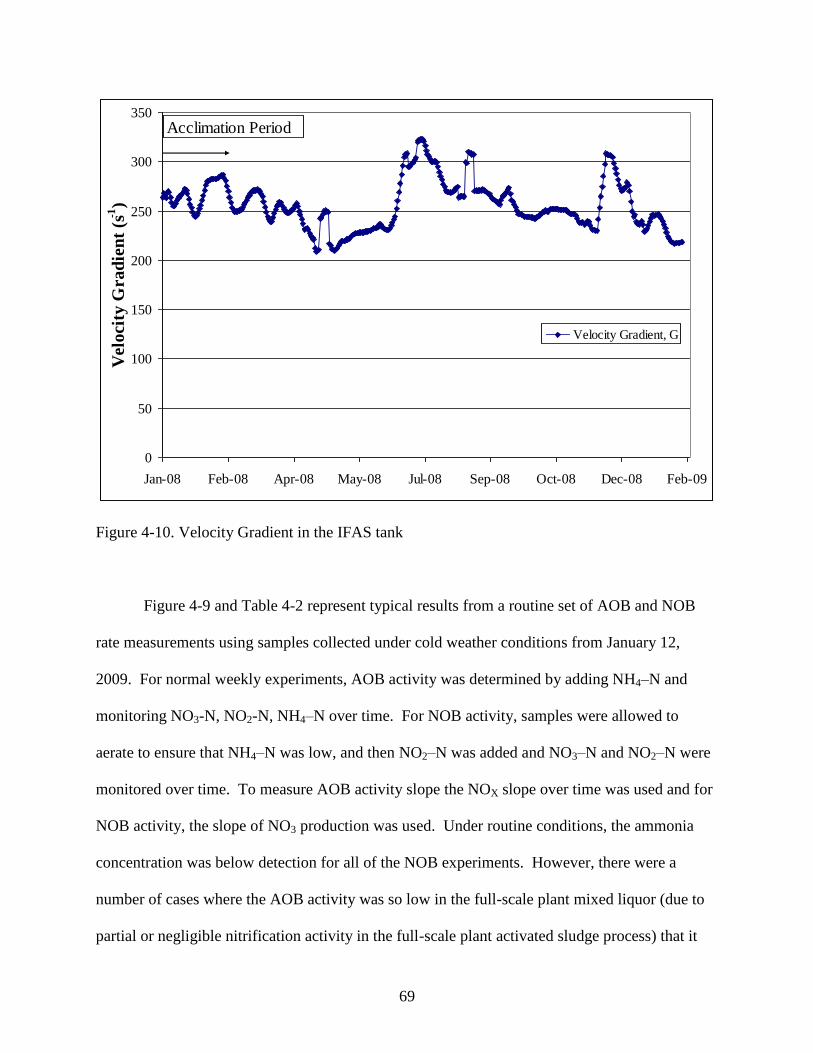
69
0
50
100
150
200
250
300
350
Jan-08 Feb-08 Apr-08 May-08 Jul-08 Sep-08 Oct-08 Dec-08 Feb-09
Velo
cit
y G
rad
ien
t (s
-1)
Velocity Gradient, G
Acclimation Period
Figure 4-10. Velocity Gradient in the IFAS tank
Figure 4-9 and Table 4-2 represent typical results from a routine set of AOB and NOB
rate measurements using samples collected under cold weather conditions from January 12,
2009. For normal weekly experiments, AOB activity was determined by adding NH4–N and
monitoring NO3-N, NO2-N, NH4–N over time. For NOB activity, samples were allowed to
aerate to ensure that NH4–N was low, and then NO2–N was added and NO3–N and NO2–N were
monitored over time. To measure AOB activity slope the NOX slope over time was used and for
NOB activity, the slope of NO3 production was used. Under routine conditions, the ammonia
concentration was below detection for all of the NOB experiments. However, there were a
number of cases where the AOB activity was so low in the full-scale plant mixed liquor (due to
partial or negligible nitrification activity in the full-scale plant activated sludge process) that it

70
was not possible to wait for complete ammonia depletion before spiking with nitrite and
beginning the NOB rate measurement. In order to calculate NOB rates for the full scale plant in
the presence of ammonia, it was first determined whether the AOB rates for the full scale plant
were higher than the NOB rates. This analysis was performed by checking for nitrite
accumulation in the AOB rate tests. An accumulation of nitrite during the AOB tests indicated
that while ammonia was being slowly oxidized, the NOB rate was even slower. If nitrite
accumulation was measured during the AOB rate test, then a regression analysis was performed
for the nitrite production rate during the AOB activity measurement. The NOB activity was
assumed to be the nitrate production rate in these AOB tests if the regression for nitrate
production was statistically significant. Nitrification rates on January 12, 2009 show that most of
the AOB and NOB activity in the IFAS process was occurring on the media and not the mixed
liquor as described by Figure 4-11 and Table 4-2.
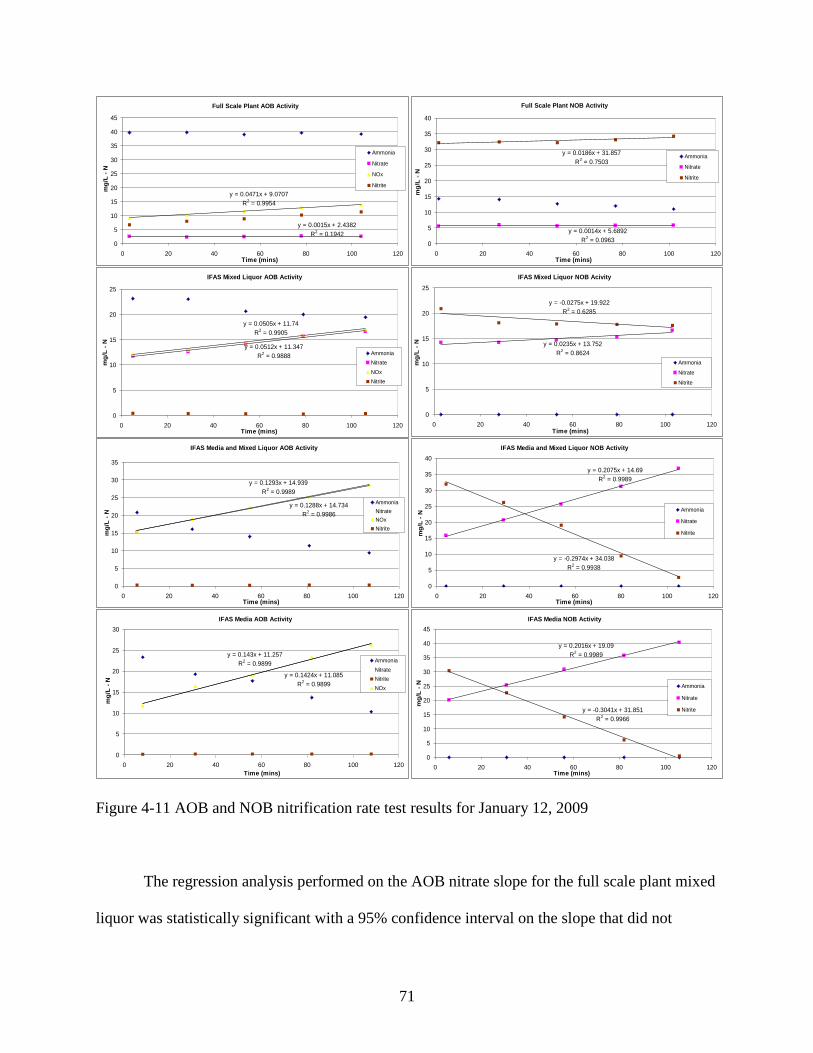
71
Full Scale Plant AOB Activity
y = 0.0015x + 2.4382
R2 = 0.1942
y = 0.0471x + 9.0707
R2 = 0.9954
0
5
10
15
20
25
30
35
40
45
0 20 40 60 80 100 120Time (mins)
mg
/L -
N
Ammonia
Nitrate
NOx
Nitrite
Full Scale Plant NOB Activity
y = 0.0014x + 5.6892
R2 = 0.0963
y = 0.0186x + 31.857
R2 = 0.7503
0
5
10
15
20
25
30
35
40
0 20 40 60 80 100 120Time (mins)
mg
/L -
N
Ammonia
Nitrate
Nitrite
IFAS Mixed Liquor AOB Activity
y = 0.0512x + 11.347
R2 = 0.9888
y = 0.0505x + 11.74
R2 = 0.9905
0
5
10
15
20
25
0 20 40 60 80 100 120Time (mins)
mg
/L -
N
Ammonia
Nitrate
NOx
Nitrite
IFAS Mixed Liquor NOB Acivity
y = 0.0235x + 13.752
R2 = 0.8624
y = -0.0275x + 19.922
R2 = 0.6285
0
5
10
15
20
25
0 20 40 60 80 100 120Time (mins)
mg
/L -
N
Ammonia
Nitrate
Nitrite
IFAS Media and Mixed Liquor AOB Activity
y = 0.1288x + 14.734
R2 = 0.9986
y = 0.1293x + 14.939
R2 = 0.9989
0
5
10
15
20
25
30
35
0 20 40 60 80 100 120Time (mins)
mg
/L -
N
Ammonia
Nitrate
NOx
Nitrite
IFAS Media and Mixed Liquor NOB Activity
y = 0.2075x + 14.69
R2 = 0.9989
y = -0.2974x + 34.038
R2 = 0.9938
0
5
10
15
20
25
30
35
40
0 20 40 60 80 100 120Time (mins)
mg
/L -
N
Ammonia
Nitrate
Nitrite
IFAS Media AOB Activity
y = 0.1424x + 11.085
R2 = 0.9899
y = 0.143x + 11.257
R2 = 0.9899
0
5
10
15
20
25
30
0 20 40 60 80 100 120
Time (mins)
mg
/L -
N
Ammonia
Nitrate
Nitrite
NOx
IFAS Media NOB Activity
y = 0.2016x + 19.09
R2 = 0.9989
y = -0.3041x + 31.851
R2 = 0.9966
0
5
10
15
20
25
30
35
40
45
0 20 40 60 80 100 120Time (mins)
mg
/L -
N Ammonia
Nitrate
Nitrite
Figure 4-11 AOB and NOB nitrification rate test results for January 12, 2009
The regression analysis performed on the AOB nitrate slope for the full scale plant mixed
liquor was statistically significant with a 95% confidence interval on the slope that did not
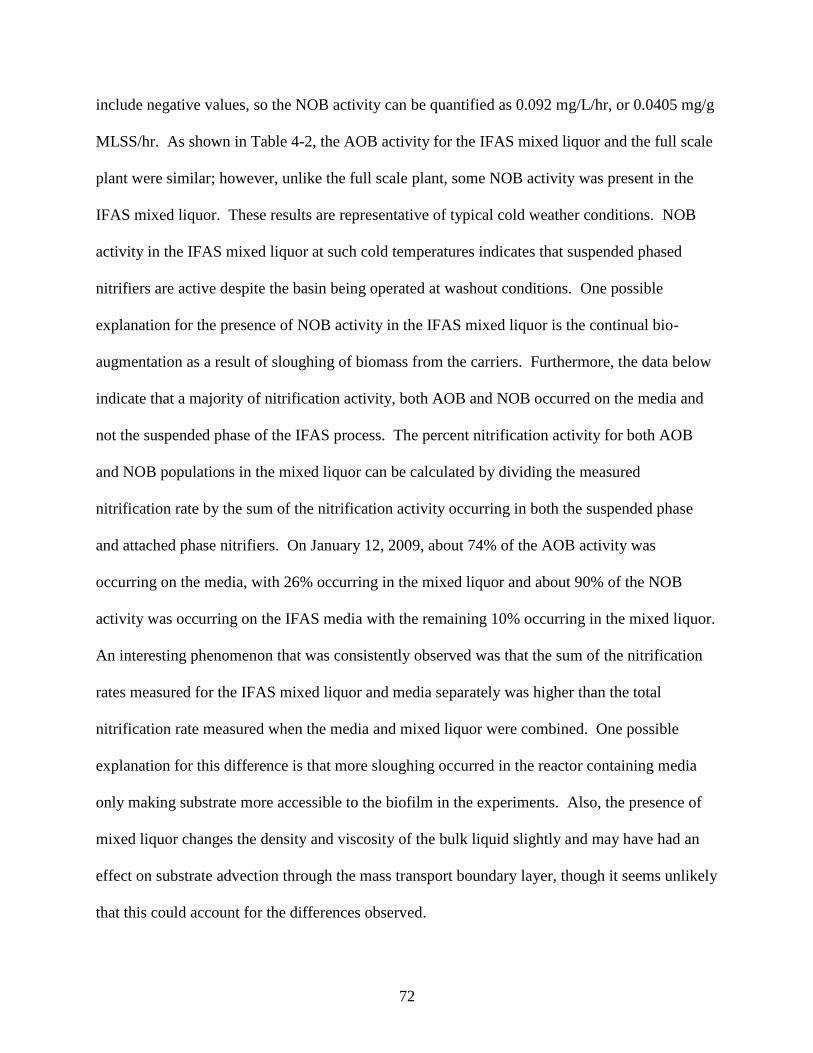
72
include negative values, so the NOB activity can be quantified as 0.092 mg/L/hr, or 0.0405 mg/g
MLSS/hr. As shown in Table 4-2, the AOB activity for the IFAS mixed liquor and the full scale
plant were similar; however, unlike the full scale plant, some NOB activity was present in the
IFAS mixed liquor. These results are representative of typical cold weather conditions. NOB
activity in the IFAS mixed liquor at such cold temperatures indicates that suspended phased
nitrifiers are active despite the basin being operated at washout conditions. One possible
explanation for the presence of NOB activity in the IFAS mixed liquor is the continual bio-
augmentation as a result of sloughing of biomass from the carriers. Furthermore, the data below
indicate that a majority of nitrification activity, both AOB and NOB occurred on the media and
not the suspended phase of the IFAS process. The percent nitrification activity for both AOB
and NOB populations in the mixed liquor can be calculated by dividing the measured
nitrification rate by the sum of the nitrification activity occurring in both the suspended phase
and attached phase nitrifiers. On January 12, 2009, about 74% of the AOB activity was
occurring on the media, with 26% occurring in the mixed liquor and about 90% of the NOB
activity was occurring on the IFAS media with the remaining 10% occurring in the mixed liquor.
An interesting phenomenon that was consistently observed was that the sum of the nitrification
rates measured for the IFAS mixed liquor and media separately was higher than the total
nitrification rate measured when the media and mixed liquor were combined. One possible
explanation for this difference is that more sloughing occurred in the reactor containing media
only making substrate more accessible to the biofilm in the experiments. Also, the presence of
mixed liquor changes the density and viscosity of the bulk liquid slightly and may have had an
effect on substrate advection through the mass transport boundary layer, though it seems unlikely
that this could account for the differences observed.
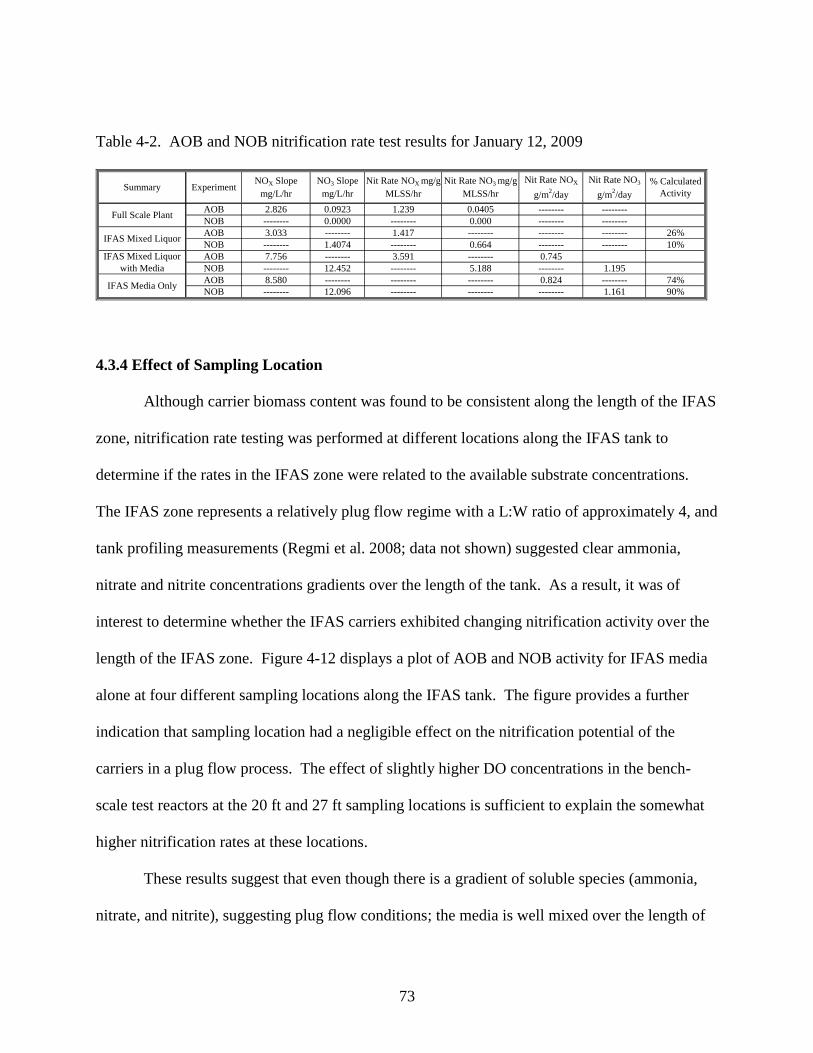
73
Table 4-2. AOB and NOB nitrification rate test results for January 12, 2009
AOB 2.826 0.0923 1.239 0.0405 -------- --------
NOB -------- 0.0000 -------- 0.000 -------- --------
AOB 3.033 -------- 1.417 -------- -------- -------- 26%
NOB -------- 1.4074 -------- 0.664 -------- -------- 10%
AOB 7.756 -------- 3.591 -------- 0.745
NOB -------- 12.452 -------- 5.188 -------- 1.195
AOB 8.580 -------- -------- -------- 0.824 -------- 74%
NOB -------- 12.096 -------- -------- -------- 1.161 90%
IFAS Mixed Liquor
IFAS Mixed Liquor
with Media
IFAS Media Only
Summary% Calculated
Activity
Full Scale Plant
ExperimentNOX Slope
mg/L/hr
NO3 Slope
mg/L/hr
Nit Rate NOX mg/g
MLSS/hr
Nit Rate NO3 mg/g
MLSS/hr
Nit Rate NOX
g/m2/day
Nit Rate NO3
g/m2/day
4.3.4 Effect of Sampling Location
Although carrier biomass content was found to be consistent along the length of the IFAS
zone, nitrification rate testing was performed at different locations along the IFAS tank to
determine if the rates in the IFAS zone were related to the available substrate concentrations.
The IFAS zone represents a relatively plug flow regime with a L:W ratio of approximately 4, and
tank profiling measurements (Regmi et al. 2008; data not shown) suggested clear ammonia,
nitrate and nitrite concentrations gradients over the length of the tank. As a result, it was of
interest to determine whether the IFAS carriers exhibited changing nitrification activity over the
length of the IFAS zone. Figure 4-12 displays a plot of AOB and NOB activity for IFAS media
alone at four different sampling locations along the IFAS tank. The figure provides a further
indication that sampling location had a negligible effect on the nitrification potential of the
carriers in a plug flow process. The effect of slightly higher DO concentrations in the bench-
scale test reactors at the 20 ft and 27 ft sampling locations is sufficient to explain the somewhat
higher nitrification rates at these locations.
These results suggest that even though there is a gradient of soluble species (ammonia,
nitrate, and nitrite), suggesting plug flow conditions; the media is well mixed over the length of
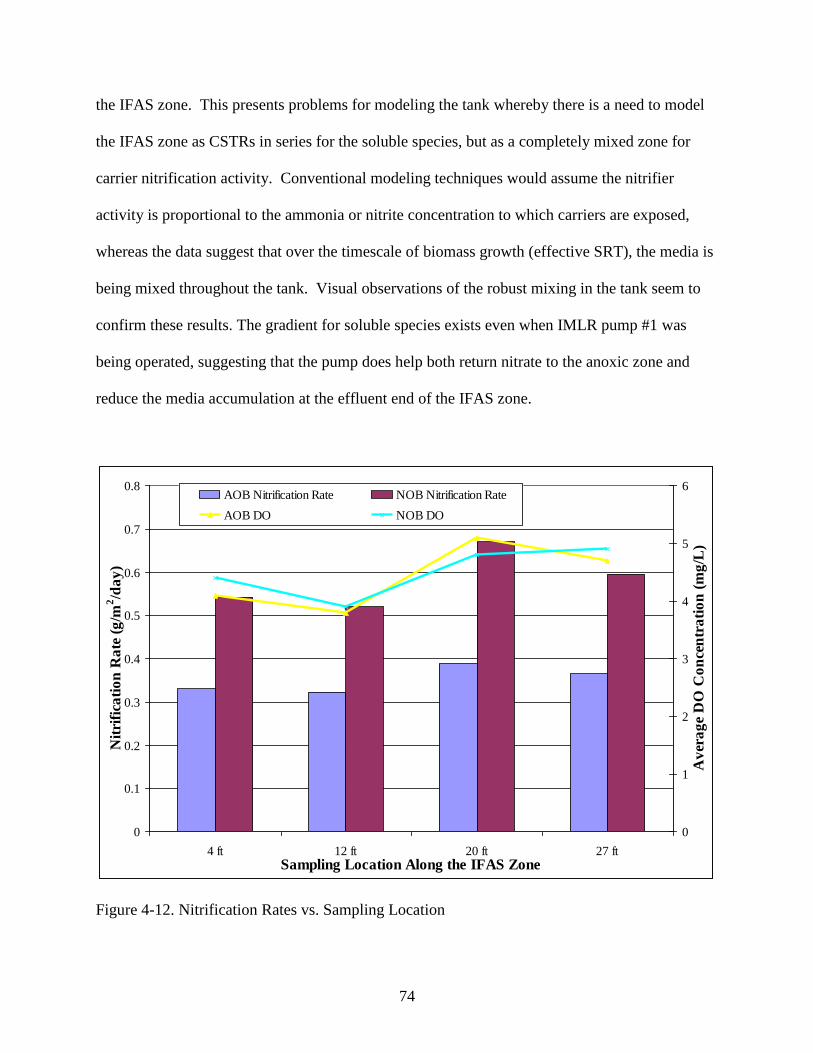
74
the IFAS zone. This presents problems for modeling the tank whereby there is a need to model
the IFAS zone as CSTRs in series for the soluble species, but as a completely mixed zone for
carrier nitrification activity. Conventional modeling techniques would assume the nitrifier
activity is proportional to the ammonia or nitrite concentration to which carriers are exposed,
whereas the data suggest that over the timescale of biomass growth (effective SRT), the media is
being mixed throughout the tank. Visual observations of the robust mixing in the tank seem to
confirm these results. The gradient for soluble species exists even when IMLR pump #1 was
being operated, suggesting that the pump does help both return nitrate to the anoxic zone and
reduce the media accumulation at the effluent end of the IFAS zone.
0
0.1
0.2
0.3
0.4
0.5
0.6
0.7
0.8
4 ft 12 ft 20 ft 27 ftSampling Location Along the IFAS Zone
Nit
rifi
cati
on
Ra
te (
g/m
2/d
ay
)
0
1
2
3
4
5
6
Av
era
ge
DO
Co
nce
ntr
ati
on
(m
g/L
)
AOB Nitrification Rate NOB Nitrification Rate
AOB DO NOB DO
Figure 4-12. Nitrification Rates vs. Sampling Location
75
4.3.5 Nitrification Kinetics
Figures 4-13 shows the AOB and NOB nitrification activity in the IFAS mixed liquor, the
IFAS media, the media and mixed liquor combined, and the full-scale plant mixed liquor over
the course of the testing period. Figure 4-13A suggests that AOB populations in the IFAS
suspended growth phase are less prone to complete washout, even at colder temperatures, and it
demonstrates the shift in AOB activity to the carriers in colder temperatures. The balance point
suggested by these data, where the IFAS mixed liquor and media have similar nitrification
capacity, is approximately 23°C, the same temperature that indicated a minimum carrier biomass
content (see Figure 4-9). Also, unlike the mixed liquor, which experienced a dramatic increase
in AOB activity during the warm weather conditions, the IFAS media demonstrated more
gradual changes in nitrification capacity as seasonal water temperature fluctuations occurred.
The observation that the sum of the nitrification rates in the individual phases of the IFAS
process were more than measured nitrification rates when the two phases were combined is also
apparent here.
Figure 4-13A also shows that there is a year round presence of AOB populations in the
mixed liquor of the full scale plant and the IFAS tank, despite being operated in washout
conditions. AOB activity in the IFAS mixed liquor can be explained by continual sloughing of
biomass off of the carriers which seeded the IFAS tank in cold temperatures. Also, until August,
Garrett wasting from the IFAS basin was used to seed the full scale plant, thus AOB activity in
the IFAS mixed liquor was transferred to the full scale plant mixed liquor.
Figure 4-13B compares the measured nitrification rates for each of the NOB experiments
conducted over the course of the year. This plot shows that unlike the AOB populations in the
IFAS tank, most of the NOB activity remained on the media, even in warmer summertime
76
conditions. The NOB activity was also much lower in the full scale plant than the AOB activity.
The NOB activity in the full scale plant did increase when the water temperature was warmer,
but experienced a washout condition as the James River Plant operators reduced the plant SRT in
response to the yeast overgrowth attributed to the addition of sugar waste as an external carbon
source, but NOB activity in the full scale plant resumed in late August and early September.
Figures 4-12C and 4-13D below show the percent total calculated AOB and NOB activity
in both the IFAS suspended phase and on the carriers. The percent total activity was calculated
by dividing the activity in the individual phases by the sum of the rates in the two phases, which
shows the percent total activity of the mixed liquor and media normalized to 100%.
The brief increase of percent AOB activity on the carriers and decrease in the mixed
liquor in June and July corresponds to the upset period caused by the addition of sugar waste to
the anoxic zone of the IFAS basin. Figure 4-13C shows that after October the nitrification on the
media quickly increased to about 75% of the total AOB activity and then leveled off. This
indicates that even in cold weather conditions that would normally result in complete washout of
AOB populations in the mixed liquor, about 25% of the AOB activity remains in the suspended
phase. NOB activity on the carriers accounted for at least 60% of the total NOB activity in the
IFAS tank, and as the temperature in the IFAS basin approaches 20° C, the NOB activity on the
carriers becomes as high as 80% of the total NOB activity.
As AOB populations, likely inhabiting the surface of the biofilm, oxidize ammonia to
nitrite, the nitrite becomes immediately available to NOB in the biofilm, having already diffused
in the form of ammonia. Because NOB populations seemed to inhabit the deeper parts of the
biofilm, this may have been the cause of less detachment of NOB and more accumulation on the
carriers, and therefore less bio-augmentation of NOB populations occurred in the IFAS mixed
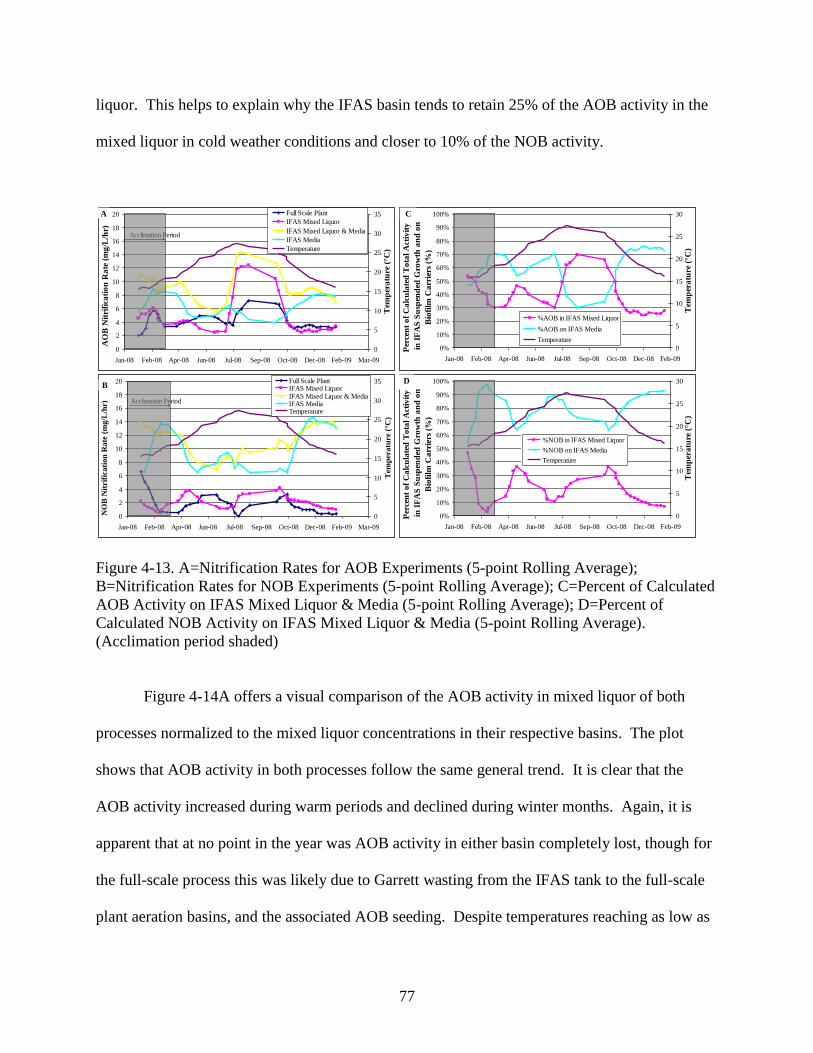
77
liquor. This helps to explain why the IFAS basin tends to retain 25% of the AOB activity in the
mixed liquor in cold weather conditions and closer to 10% of the NOB activity.
0
2
4
6
8
10
12
14
16
18
20
Jan-08 Feb-08 Apr-08 Jun-08 Jul-08 Sep-08 Oct-08 Dec-08 Feb-09 Mar-09
AO
B N
itri
fica
tio
n R
ate
(m
g/L
/hr)
0
5
10
15
20
25
30
35
Tem
per
atu
re (
°C)
Full Scale Plant
IFAS Mixed Liquor
IFAS Mixed Liquor & Media
IFAS Media
Temperature
Acclimation Period
A
0
2
4
6
8
10
12
14
16
18
20
Jan-08 Feb-08 Apr-08 Jun-08 Jul-08 Sep-08 Oct-08 Dec-08 Feb-09 Mar-09
NO
B N
itri
fica
tion
Rate
(m
g/L
/hr)
0
5
10
15
20
25
30
35T
emp
eratu
re (
°C)
Full Scale PlantIFAS Mixed LiquorIFAS Mixed Liquor & MediaIFAS MediaTemperature
Acclimation Period
B
0%
10%
20%
30%
40%
50%
60%
70%
80%
90%
100%
Jan-08 Feb-08 Apr-08 Jun-08 Jul-08 Sep-08 Oct-08 Dec-08 Feb-09
Per
cen
t o
f C
alc
ula
ted
To
tal
Act
ivit
y
in I
FA
S S
usp
end
ed G
row
th a
nd
on
Bio
film
Ca
rrie
rs (
%)
0
5
10
15
20
25
30
Tem
per
atu
re (
°C)
%NOB in IFAS Mixed Liquor
%NOB on IFAS Media
Temperature
D
0%
10%
20%
30%
40%
50%
60%
70%
80%
90%
100%
Jan-08 Feb-08 Apr-08 Jun-08 Jul-08 Sep-08 Oct-08 Dec-08 Feb-09
Per
cen
t o
f C
alc
ula
ted
To
tal
Act
ivit
y
in I
FA
S S
usp
end
ed G
row
th a
nd
on
Bio
film
Ca
rrie
rs (
%)
0
5
10
15
20
25
30
Tem
per
atu
re (
°C)
%AOB in IFAS Mixed Liquor
%AOB on IFAS Media
Temperature
C
Figure 4-13. A=Nitrification Rates for AOB Experiments (5-point Rolling Average);
B=Nitrification Rates for NOB Experiments (5-point Rolling Average); C=Percent of Calculated
AOB Activity on IFAS Mixed Liquor & Media (5-point Rolling Average); D=Percent of
Calculated NOB Activity on IFAS Mixed Liquor & Media (5-point Rolling Average).
(Acclimation period shaded)
Figure 4-14A offers a visual comparison of the AOB activity in mixed liquor of both
processes normalized to the mixed liquor concentrations in their respective basins. The plot
shows that AOB activity in both processes follow the same general trend. It is clear that the
AOB activity increased during warm periods and declined during winter months. Again, it is
apparent that at no point in the year was AOB activity in either basin completely lost, though for
the full-scale process this was likely due to Garrett wasting from the IFAS tank to the full-scale
plant aeration basins, and the associated AOB seeding. Despite temperatures reaching as low as

78
14.5 °C, which requires a minimum SRT of about 3.5 days to achieve nitrification and effluent
ammonia concentrations of 0.5 mg/L-N (process SRT at this time was 2.9 days), both basins
retained AOB populations year round. The IFAS mixed liquor was also constantly receiving
biomass that sloughed off of the media. This constant bio-augmentation of nitrifiers to the mixed
liquor helps to explain how the basins are able to maintain AOB activity, even under conditions
that would typically washout all autotrophic growth.
0
0.5
1
1.5
2
2.5
3
3.5
4
4.5
5
Jan-08 Feb-08 Apr-08 Jun-08 Jul-08 Sep-08 Oct-08 Dec-08 Feb-09 Mar-09
AO
B N
itri
fica
tio
n R
ate
(mg
/g M
LS
S/h
r)
0
5
10
15
20
25
30
35
Tem
per
atu
re (
°C)
Full Scale Plant
IFAS Mixed Liquor
Temperature
Acclimation PeriodA
0
0.2
0.4
0.6
0.8
1
1.2
1.4
1.6
1.8
2
Jan-08 Feb-08 Apr-08 Jun-08 Jul-08 Sep-08 Oct-08 Dec-08 Feb-09 Mar-09
AO
B N
itri
fica
tio
n R
ate
(g
/m2/d
ay)
0
5
10
15
20
25
30
35
Tem
per
atu
re (
°C)
IFAS Mixed Liquor & Media
IFAS Media
Temperature
Acclimation PeriodB
0
0.5
1
1.5
2
2.5
3
3.5
4
4.5
5
Jan-08 Feb-08 Apr-08 Jun-08 Jul-08 Sep-08 Oct-08 Dec-08 Feb-09 Mar-09
NO
B N
itri
fica
tio
n R
ate
(mg
/g M
LS
S/h
r)
0
5
10
15
20
25
30
35
Tem
per
atu
re (
°C)
Full Scale Plant
IFAS Mixed Liquor
Temperature
Acclimation PeriodC
0
0.2
0.4
0.6
0.8
1
1.2
1.4
1.6
1.8
2
Jan-08 Feb-08 Apr-08 Jun-08 Jul-08 Sep-08 Oct-08 Dec-08 Feb-09 Mar-09
NO
B N
itri
fica
tio
n R
ate
(g
/m2/d
ay
)
0
5
10
15
20
25
30
35
Tem
per
atu
re (
°C)
IFAS Mixed Liquor & Media
IFAS Media
Temperature
Acclimation PeriodD
Figure 4-14. Nitrification Rates: A=Mixed Liquor AOB (5-point Rolling Average); B=Mixed
Liquor NOB (5-point Rolling Average); C=Carrier AOB (5-point Rolling Average); D=Carrier
NOB (5-point Rolling Average). (Acclimation period shaded)

79
0
2
4
6
8
10
12
14
16
18
20
Jan-08 Feb-08 Apr-08 Jun-08 Jul-08 Sep-08 Oct-08 Dec-08 Feb-09 Mar-09
NO
B N
itri
fica
tio
n R
ate
(mg
/g M
LS
S/h
r)
0
5
10
15
20
25
30
35
Tem
per
atu
re (
°C)
IFAS Mixed Liquor & Media
IFAS Media
Temperature
Acclimation PeriodB
0
2
4
6
8
10
12
14
16
18
20
Jan-08 Feb-08 Apr-08 Jun-08 Jul-08 Sep-08 Oct-08 Dec-08 Feb-09 Mar-09
AO
B N
itri
fica
tio
n R
ate
(mg
/g M
LS
S/h
r)
0
5
10
15
20
25
30
35
Tem
per
atu
re (
°C)
IFAS Mixed Liquor & Media
IFAS Media
TemperatureAcclimation Period
A
Figure 4-15. Carrier Nitrification rates Normalized to biomass content: A=AOB; B=NOB.
(Acclimation period shaded)
4.3.6 Oxygen Uptake
Oxygen uptake rates (OURs) were also monitored in the batch experiments to be
compared with theoretical rates based on the extent of nitrification occurring. Figure 4-16 below
compares predicted OUR to measured OUR in the reactors. The predicted OUR was calculated
80
based on the stoichiometric oxygen requirement for ammonia and nitrite oxidation. It is clear
that all of the measured OURs for AOB experiments containing mixed liquor are positively
correlated with and slightly less than theoretical OURs. The difference in the plots can be
attributed to endogenous decay occurring simultaneously with the AOB rate tests. The measured
OUR for all of the NOB experiments containing mixed liquor do not demonstrate a clear
relationship for either the full-scale plant samples or the sample with IFAS mixed liquor with
media. It is unclear why this might be the case. It is clear, however, that for both AOB and NOB
OUR on the media only (Figure 4-16 D and H), the measured rate was very similar to the
theoretical rate suggesting that there was a distinct lack of heterotrophic decay associated with
the biofilm on the IFAS carries.
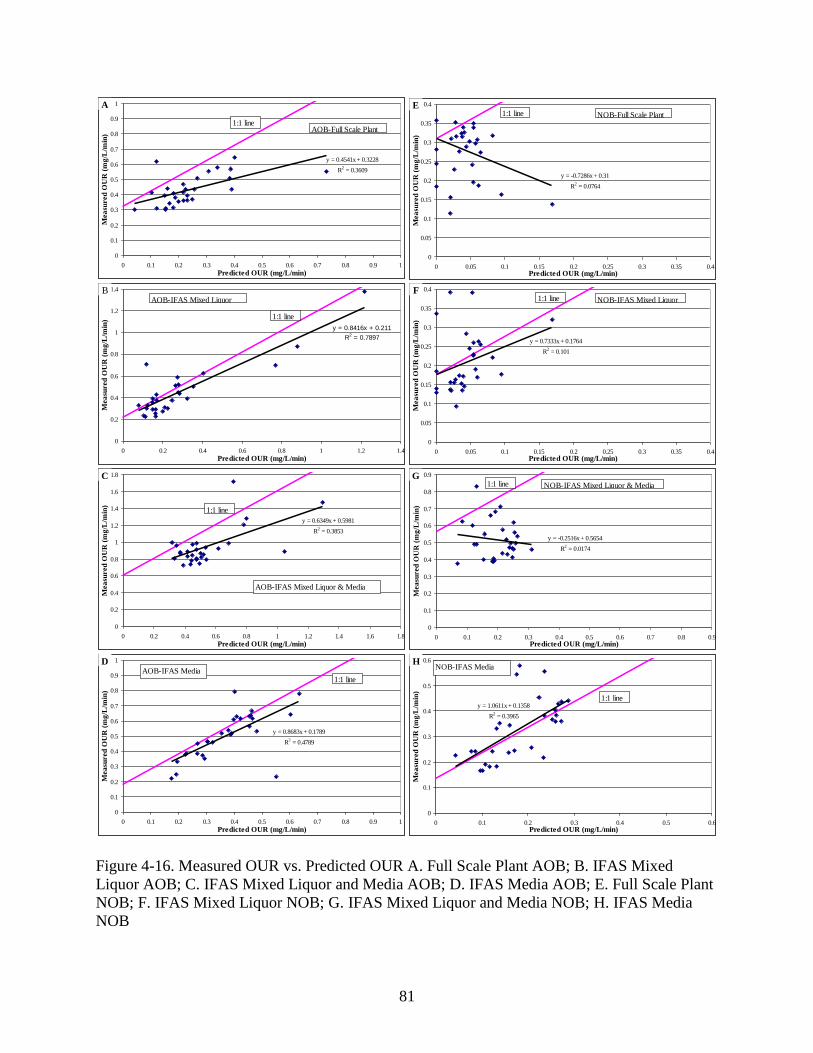
81
y = 0.4541x + 0.3228
R2 = 0.3609
0
0.1
0.2
0.3
0.4
0.5
0.6
0.7
0.8
0.9
1
0 0.1 0.2 0.3 0.4 0.5 0.6 0.7 0.8 0.9 1
Predicted OUR (mg/L/min)
Mea
sured
OU
R (
mg
/L/m
in)
AOB-Full Scale Plant1:1 line
A
y = -0.7286x + 0.31
R2 = 0.0764
0
0.05
0.1
0.15
0.2
0.25
0.3
0.35
0.4
0 0.05 0.1 0.15 0.2 0.25 0.3 0.35 0.4Predicted OUR (mg/L/min)
Mea
sured
OU
R (
mg
/L/m
in)
NOB-Full Scale Plant1:1 lineE
y = 0.8416x + 0.211
R2 = 0.7897
0
0.2
0.4
0.6
0.8
1
1.2
1.4
0 0.2 0.4 0.6 0.8 1 1.2 1.4
Predicted OUR (mg/L/min)
Mea
sured
OU
R (
mg
/L/m
in)
AOB-IFAS Mixed Liquor
1:1 line
B
y = 0.7333x + 0.1764
R2 = 0.101
0
0.05
0.1
0.15
0.2
0.25
0.3
0.35
0.4
0 0.05 0.1 0.15 0.2 0.25 0.3 0.35 0.4Predicted OUR (mg/L/min)
Mea
sured
OU
R (
mg
/L/m
in)
NOB-IFAS Mixed Liquor1:1 lineF
y = 0.6349x + 0.5981
R2 = 0.3853
0
0.2
0.4
0.6
0.8
1
1.2
1.4
1.6
1.8
0 0.2 0.4 0.6 0.8 1 1.2 1.4 1.6 1.8
Predicted OUR (mg/L/min)
Mea
sured
OU
R (
mg
/L/m
in)
AOB-IFAS Mixed Liquor & Media
1:1 line
C
y = -0.2516x + 0.5654
R2 = 0.0174
0
0.1
0.2
0.3
0.4
0.5
0.6
0.7
0.8
0.9
0 0.1 0.2 0.3 0.4 0.5 0.6 0.7 0.8 0.9Predicted OUR (mg/L/min)
Mea
sured
OU
R (
mg
/L/m
in)
NOB-IFAS Mixed Liquor & Media1:1 lineG
y = 0.8683x + 0.1789
R2 = 0.4789
0
0.1
0.2
0.3
0.4
0.5
0.6
0.7
0.8
0.9
1
0 0.1 0.2 0.3 0.4 0.5 0.6 0.7 0.8 0.9 1
Predicted OUR (mg/L/min)
Mea
sured
OU
R (
mg
/L/m
in)
AOB-IFAS Media1:1 line
D
y = 1.0611x + 0.1358
R2 = 0.3965
0
0.1
0.2
0.3
0.4
0.5
0.6
0 0.1 0.2 0.3 0.4 0.5 0.6Predicted OUR (mg/L/min)
Mea
sured
OU
R (
mg
/L/m
in)
NOB-IFAS Media
1:1 line
H
Figure 4-16. Measured OUR vs. Predicted OUR A. Full Scale Plant AOB; B. IFAS Mixed
Liquor AOB; C. IFAS Mixed Liquor and Media AOB; D. IFAS Media AOB; E. Full Scale Plant
NOB; F. IFAS Mixed Liquor NOB; G. IFAS Mixed Liquor and Media NOB; H. IFAS Media
NOB
82
4.4 CONCLUSION
Nitrification rate testing has offered a great deal of insight into the performance of the
IFAS process for a number of operating conditions and temperatures. Biofilm carrier content
serves as a tool when assessing process health and changes according to temperature and
process operation. Biofilm content measurements were homogeneous throughout the length of
the IFAS zone which indicates that the IFAS zone is well mixed, despite being a plug flow
reactor by nature. This trend is also consistent with nitrification activity. Nitrification rates,
both AOB and NOB, were constant on carriers throughout the length of the IFAS zone despite
the decline substrate concentration, also suggesting that IFAS zone is well mixed with respect to
biomass growth. As temperature changed seasonally, biomass moved on and off the carriers for
a number of reasons. As water temperature increased higher than 23 °C, carrier biomass content
began to decline significantly, corresponding with a significant shift of AOB activity from the
fixed film phase to the mixed liquor. This sloughing of biomass and shift of nitrification
activity to the mixed liquor occurred when operating conditions, like process SRT, supported
autotrophic growth in the suspended phase of the IFAS tank. Then, as temperature cooled in the
basin in the late autumn and early winter, biomass content on the carriers steadily increased
from about 3 g MLSS/m2 to about 7 g MLSS/m
2. This shift on the carriers occurred for two
reasons. One reason is that the IFAS basin began to approach washout conditions for nitrifiers.
As a result, autotrophs moved to the fixed film phase where they could be exposed to a higher
effective SRT. The second reason for the shift of biomass onto the carriers is probably a result
of a reduction in mixing input to the tank. At low temperatures, less aeration is required to
maintain DO in the tank, so the decreased aeration intensity likely also resulted in decreased
agitation of the media and thus less sloughing of biomass.
83
AOB and NOB activity localization is dependent on temperature and process SRT. AOB
activity appears to inhabit the surface of the biofilm and smoothly transition between the biofilm
and suspended fraction as temperature and operating conditions, such as SRT, change. AOB
activity in the mixed liquor represents half of the total AOB activity in the IFAS zone when
temperatures reach and exceed 23 °C. When temperature dropped to below 20 °C, AOB
activity on the media made up a maximum 75% of the total AOB activity in the IFAS tank.
When temperature in the basin peaked, AOB activity in the basin was at its lowest, making up
only 30% of the total AOB activity in the IFAS basin. The majority of NOB activity remains on
the carriers year round and makes much less of a transition from the biofilm to the mixed liquor
as temperatures and SRT increase and conditions that support autotrophic growth improve.
NOB on the carriers never decreased to less than 60% of the total NOB activity in the tank, and
NOB activity increased to over 90% of the total NOB activity in the tank during the colder
wintertime temperatures. This phenomenon indicates that NOB activity also has a much higher
affinity for the carriers and that NOB activity occurs deeper in the biofilm. This probably
makes sense given the immediate availability of nitrite produced in the biofilm as a result of
local AOB activity. However, AOB and NOB activity remains in the IFAS mixed liquor, even
during washout conditions, due to ―bio-augmentation‖ caused by sloughing of biomass off of
the carriers.
The data suggest two possible biofilm configurations as shown in Figure 4-17 below.
The most likely scenario (Figure 4-17A) would appear to involve AOB at the surface of the
biofilm and NOB located further within. This hypothesis is supported by effective Ks data and
the observation of more significant AOB activity in the mixed liquor during colder periods
(suggesting better bioaugmentation). However, it is also well accepted that suspended growth
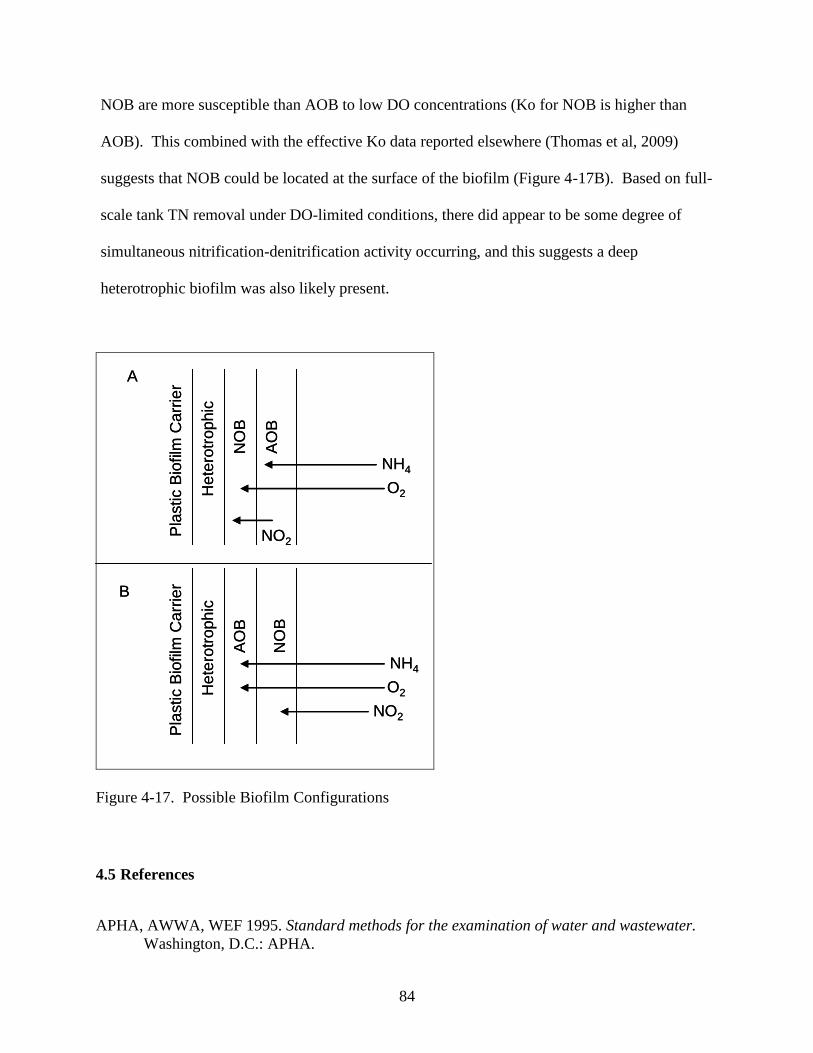
84
NOB are more susceptible than AOB to low DO concentrations (Ko for NOB is higher than
AOB). This combined with the effective Ko data reported elsewhere (Thomas et al, 2009)
suggests that NOB could be located at the surface of the biofilm (Figure 4-17B). Based on full-
scale tank TN removal under DO-limited conditions, there did appear to be some degree of
simultaneous nitrification-denitrification activity occurring, and this suggests a deep
heterotrophic biofilm was also likely present.
AO
B
NO
B
He
tero
troph
ic
Pla
stic B
iofilm
Ca
rrie
r
O2
NO2
NH4
AO
B
NO
B
He
tero
troph
ic
Pla
stic B
iofilm
Ca
rrie
r
O2
NO2
NH4
B
A
AO
B
NO
B
He
tero
troph
ic
Pla
stic B
iofilm
Ca
rrie
r
O2
NO2
NH4
AO
B
NO
B
He
tero
troph
ic
Pla
stic B
iofilm
Ca
rrie
r
O2
NO2
NH4
B
A
Figure 4-17. Possible Biofilm Configurations
4.5 References
APHA, AWWA, WEF 1995. Standard methods for the examination of water and wastewater.
Washington, D.C.: APHA.
85
Choi, N., Phillips, H., Johnson, T.L., Butler, R., Lauro, T. Pilot Testing Of MBBR And IFAS
Treatment Processes For Nitrification And Denitrification At The Mamaroneck WWTP.
Proceedings of the 80th
WEFTEC- National Conference of the Water Environment Federation,
San Diego, CA. 80: October 13-17, 2007.
Hubbell, S., McDowell, C. Cold Temperature BNR Using Integrated Fixed-Film Activated
Sludge (IFAS) Hybrid Technology. Proceedings of the 76th
WEFTEC- National Conference of
the Water Environment Federation. Los Angeles, CA, October 12-15, 2003.
McQuarrie, J., Rutt, K., Seda, J., Haegh, M. Observations From The First Year of Full-Scale
Operation - The IFAS/BNR Process At The Broomfield Wastewater Reclamation Facility,
Broomfield, CO. Proceedings of the 77th
WEFTEC- National Conference of the Water
Environment Federation. New Orleans, LA, October 2-6, 2004.
Onnis-Hayden, A., Dair, D., Johnson, C., Schramm, A., Gu, A. Kinetics And Nitrifying
Populations In Nitrogen Removal Processes At A Full-Scale Integrated Fixed-Film Activated
Sludge (IFAS) Plant. Proceedings of the 80th
WEFTEC- National Conference of the Water
Environment Federation. San Diego, CA, October 13-17, 2007.
Regmi, P. 2008. Biological Nutrient Removal Upgrade At The James River Wastewater
Treatment Plant. Civil and Environmental Engineering. Old Dominion University, Norfolk, VA.
Ross, D., Fernandes, W., Briggs, T., Kim, N., Booth, G., Neely, D., Welp, J. Integrated Fixed
Film Activated Sludge (IFAS) At The Lakeview WWTP: The Real Implementation Issues.
Proceedings of the 77th
WEFTEC- National Conference of the Water Environment Federation.
New Orleans, LA, October 2-6, 2004.
Water Quality Management Planning Regulation. Chapter 720. 9 VAC 25-820-70.
Yerrell, K., Gobbie, M., Dold, P., Jones, R., Sickerdick, L. Full-Scale Demonstration Of A Free-
Moving Media IFAS Process For Enhancing Nitrification Performance. Proceedings of the 74th
WEFTEC- National Conference of the Water Environment Federation. Atlanta, GA, October 13-
17, 2001.
86
5 MANUSCRIPT 2: TESTING OF PARAMETERS IMPACTING IFAS
NITRIFICATION PERFORMANCE
Abstract
The James River Treatment Plant (JRTP) has operated a 2 MGD Integrated Fixed Film
Activated Sludge (IFAS) demonstration study beginning in late 2007 to explore IFAS
performance and investigate the IFAS technology as an option for a full scale plant upgrade in
response to stricter nutrient discharge limits in the James River Basin. In addition to the weekly
nitrification rate measurements, experiments were also conducted to determine how operational
inputs such as dissolved oxygen (DO) and mixing affect the nitrification rates. Mixing intensity
had a clear impact on nitrification rates by increasing the velocity gradient in the bulk liquid and
decreasing the mass transfer boundary layer mass transfer resistance. At higher mixing
intensities, advection through the mass transfer boundary layer increased making substrate more
available to the biofilm. The affect of mixing was much more profound at low DO, whereas
increased mixing had less effect on nitrification rates at higher bulk liquid DO. DO also affected
nitrification rates, such that as DO increased it penetrated deeper into the biofilm increasing the
nitrification rate in a linear fashion until the biofilm became saturated. Another aspect of the
research was modeling effective half saturation effects for AOB and NOB activity in the fixed
film phase. The modeling work demonstrated that KS for AOB activity on the media was similar
to accepted suspended growth KS values, while KS for NOB activity on the media was
considerably higher than suspended growth KS. This trend indicates that nitrite was not as
bioavailable in the biofilm and resists diffusion into the deeper part of the biofilm where NOB
activity takes place. KO for both AOB and NOB activity in the biofilm was higher than typical
suspended growth values because of boundary layer and biofilm diffusion resistances. In

87
addition, the presence of readily degradable organics did not significantly affect nitrification
rates on the media, but did reduce nitrification rates in the mixed liquor. That, combined with
low chemical oxygen demand (COD) uptake rates indicates that little heterotrophic activity is
occurring on the media.
5.1 INTRODUCTION
As nutrient discharge limits continue to become more stringent, a number of approaches
have been taken to develop new techniques to meet these limits. The IFAS process is a relatively
new technology focused at retrofitting existing wastewater treatment plants that have limited
space for plant expansion. IFAS technology gives plants an ability to upgrade their conventional
activated sludge processes to a process that achieves year round nitrification without expanding
or increasing the plant’s footprint. Although this technology has been tested and proven to work,
especially in cold environments for plants operating below washout conditions, process kinetics
are still undefined. Many variables, such as bulk liquid DO and mixing intensity have a known
effect on biofilm kinetics, but IFAS kinetics have yet to be studied in depth in the context of
these parameters. In addition to analyzing performance based on DO and mixing regimes, half
saturation effects of the biofilm have not been identified for design and modeling purposes.
IFAS models that combine an IWA-style activated sludge model with a fundamental non-
empirical biofilm model (considering external mass transfer and multi-component biofilm
diffusion) have been developed, but calibrated with limited full-scale experience.
In 2005, new regulations were implemented as part of the Chesapeake Bay 2000
Agreement which require Hampton Roads Sanitation District (HRSD) wastewater treatment
plants (WWTPs) discharging to the James River Basin to reduce the aggregate mass discharge of
88
total nitrogen (TN) to 6,000,000 lbs/year (Water Quality Management Planning Regulation ).
HRSD staff concluded that biological nutrient removal with IFAS should be employed at the
16.7 MGD James River Treatment Plant (JRTP) as a cost effective strategy to help achieve this
aggregate goal, decreasing effluent TN at this facility to approximately 12 mg/L (annual
average). HRSD elected to conduct a demonstration-scale IFAS study at JRTP to evaluate the
performance of this process and to develop design criteria before implementation on a wider
scale. For this demonstration project, a single existing fully-aerobic conventional aeration basin
with dedicated secondary clarification, which was previously operated to achieve nitrification
during warm weather months only, was converted to a 1.86 MGD (2.22 MGD max month) IFAS
train in an MLE configuration with a 50% fill of AnoxKaldnes plastic biofilm carriers in the
aerobic zone only (K3 with a specific surface area of 500 m2/m
3). The IFAS process was
targeted to achieve complete, year-round nitrification at an operating solids residence time (SRT)
well below the washout value for nitrifiers during cold weather periods, suggesting that AOB
and NOB must colonize the IFAS carriers (McQuarrie et al. 2004). In addition, the IFAS
process has been demonstrated to achieve complete nitrification, even at temperatures as low as
8 °C (Hubbell et al. 2003). Not only does the IFAS process offer the potential for year round
nitrification, the technology has demonstrated much higher nitrification kinetics than can be
achieved in a conventional activated sludge process (Ross et al. 2004). In addition, some work
has been done to measure KO values for the IFAS process, but KS values have not been
calculated for the IFAS process (Yerrell et al. 2001).
Because diffusion of nutrients, substrate, and oxygen into the biofilm controls the
nitrification rate in an attached growth process it is important to improve the mass transfer
capability in the system. Mixing has a direct effect in the water film thickness which in turn
89
affects mass transport into the biofilm. Generally, the smaller the mass transfer boundary layer
around the biofilm, the faster substrate and oxygen can pass into the biofilm and become
available for the biomass. At this point very little is understood about how process mechanical
configuration (e.g. aeration intensity) affects mass transport boundary layer thickness. It is
known at a fundamental level that biofilms are diffusion limited by their nature instead of being
kinetically limited like mixed liquor (Boltz et al. 2009).
The goal of this research was to measure nitrification rates for both ammonia oxidizing
bacteria (AOB) and nitrite oxidizing bacteria (NOB) in both suspended growth and fixed film
phases from the IFAS demonstration tank at the James River Wastewater Treatment Plant
(JRWWTP), in Newport News, Virginia to achieve a number of observations. The specific
research goals for this project were to:
Achieve a better understanding of IFAS process kinetics
Quantify the effect of mixing and DO on mass transport boundary layer (i.e. mixing intensity)
Measure half saturation effects on the media to better understand mass transport issues for
ammonia, nitrite, and oxygen and calibrate existing models to optimize modeling of the IFAS
process and other biofilm processes
Measure the effect of COD addition on nitrification rates in the mixed liquor and on the
carriers
5.2 METHODOLOGY
These additional experimental campaigns were conducted in conjunction with the
nitrification rate testing from January 2008 through January 2009. These experiments target
external influences, such as mixing, DO, and presence of COD on maximum nitrification rates,
90
and also measure effective half saturation effects. These parameters identify operational set
points and influence design criteria for the IFAS process. These experiments target kinetics on
the IFAS media only, although some experiments on the IFAS mixed liquor were conducted for
comparative purposes. In this case, experiments were run at different DO setpoints and the
reactors
5.2.1 Bench Scale Reactor Construction
The batch reactors were constructed from 9 L rectangular clear polycarbonate containers
with screw-cap lids with an active reactor volume of 7 L. The mixer paddle extended through
the screw-cap opening, and holes were drilled in the top of the container to insert DO and pH
probes. The four reactors were aerated through an air stone and were fed pure oxygen at a low
rate, which maintained DO at varying DO depending on the goals of the campaign experiment.
The reactors were also equipped with a sample port located in the middle of the active volume
which allowed for samples to be taken throughout the course of the various experiments
performed.
The reactors were placed in a temperature-controlled water bath, and the temperature in
each individual reactor in order to maintain a temperature consistent with the temperature of the
IFAS tank, which was read and recorded every morning at the time at which the sample is taken.
The bath was turned on the day before sample collection to allow time for the bath to adjust to
the appropriate temperature.
The pH in the reactors was controlled to a setpoint between 7.2 and 7.3 for both the
ammonia spike and for the nitrite spike experiment. Automatic addition of alkalinity in the
form of a concentrated Na2CO3 solution was provided with Masterflex peristaltic pumps and
91
on/off control to each reactor as needed. If the pH increased to higher than the controlled values,
acid was added manually to return the reactor to the desired experimental pH. pH was also
logged continuously for each experiment with LABVIEW (National Instruments) and recorded
with the results from each test.
To separate mixing and oxygenation function, DO was controlled in the bench-scale
reactors using pure oxygen. This system included HACH ruggedized LDO probes and solenoid
valves connected to a relay controller and USB data acquisition and control system running
LABVIEW (National Instruments) on a laptop computer. This system was also used to record
temperature and DO every 10 sec for each experiment, from which oxygen uptake rates could be
calculated. Rotameters were used in series with the solenoid valves to regulate the oxygen
flowrate into the reactors when they were aerating. The DO setpoint varied for the campaign
experiments to illustrate the effect of DO on the performance of the carriers. The diagram shown
in Figure 5-1 displays a representation of the reactor construction.
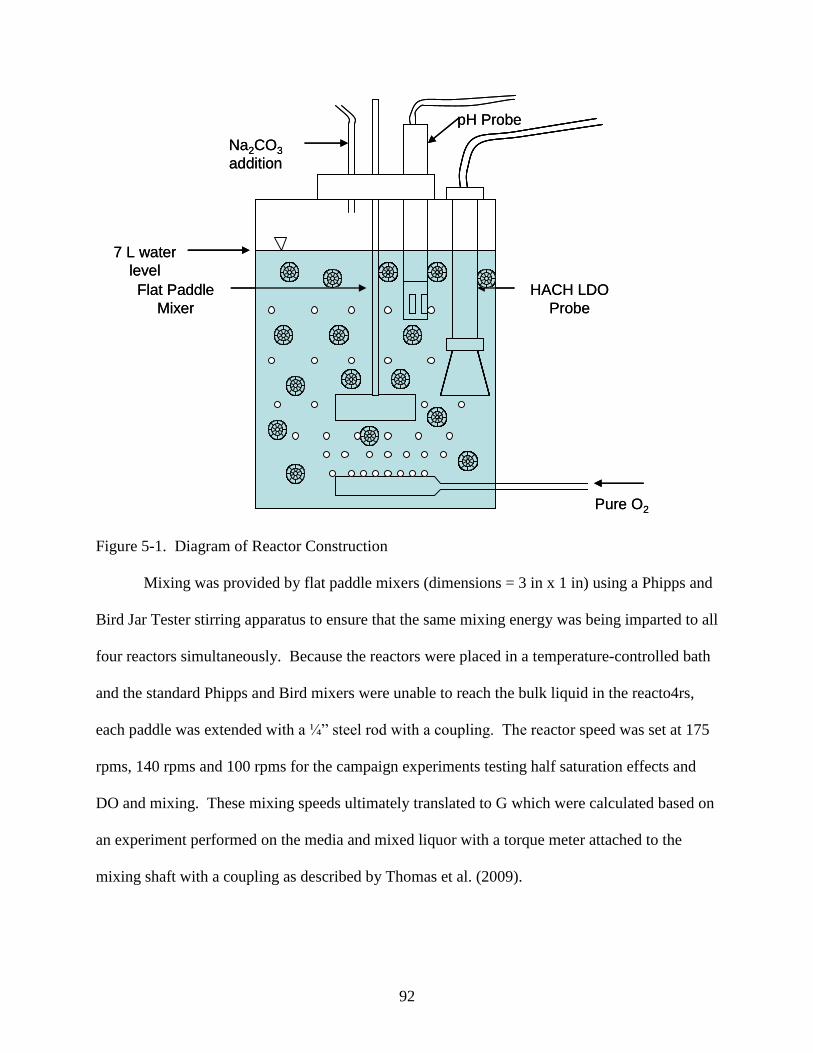
92
Pure O2
HACH LDO
Probe
pH Probe
Flat Paddle
Mixer
Na2CO3
addition
7 L water
level
Pure O2
HACH LDO
Probe
pH Probe
Flat Paddle
Mixer
Na2CO3
addition
7 L water
level
Figure 5-1. Diagram of Reactor Construction
Mixing was provided by flat paddle mixers (dimensions = 3 in x 1 in) using a Phipps and
Bird Jar Tester stirring apparatus to ensure that the same mixing energy was being imparted to all
four reactors simultaneously. Because the reactors were placed in a temperature-controlled bath
and the standard Phipps and Bird mixers were unable to reach the bulk liquid in the reacto4rs,
each paddle was extended with a ¼‖ steel rod with a coupling. The reactor speed was set at 175
rpms, 140 rpms and 100 rpms for the campaign experiments testing half saturation effects and
DO and mixing. These mixing speeds ultimately translated to G which were calculated based on
an experiment performed on the media and mixed liquor with a torque meter attached to the
mixing shaft with a coupling as described by Thomas et al. (2009).
93
5.2.2 Reactor Contents
For many of the campaign experiments, all four of the reactors were filled with 50% K3
Anox-Kaldnes media by volume. In order to achieve this desired media fill, about 5 L of
secondary effluent was first added to the reactors. Then a 2 L graduated cylinder was used to
add 3.5 L of media to each of the reactors and the reactors were then filled the rest of the way
with secondary effluent to a pre-calibrated line representing 7 L. Mixed liquor from the IFAS
tank were used in a number of campaign experiments and was poured into the reactors to the 7 L
mark.
5.2.3 Biomass Sample Collection
5.2.3.1 Nitrification Rate Testing
Samples for the campaign experiments were taken from the secondary clarifier and the
IFAS demonstration tank. Samples from the IFAS demonstration tank were collected with 5
gallon buckets near the middle of the IFAS zone in the demonstration reactor where there the
media fill fraction was likely to be about 50% by volume. After these samples were taken, they
were carried back to the lab where the media and bulk liquid were separated. For campaigns
only requiring IFAS media, the mixed liquor was discarded after separation, and for experiments
on the IFAS mixed liquor were separated, and the media was transported back to the IFAS tank.
This separation was done by pouring the sample into two buckets, one inside of the other. The
inside bucket contained numerous ¼-inch holes drilled into the bottom. The inner bucket was
then lifted out of the outer bucket allowing the mixed liquor to gently drain into the bucket
without holes. The bucket with holes in the bottom now containing media was gently dipped
94
into a bucket containing secondary effluent to rinse off any remaining biomass not attached to
the media.
In addition to the biomass samples collected on the morning for the experiments, enough
secondary effluent to fill the reactors and rinse the media was collected. After the samples were
collected from the plant, they were divided into four reactors. These four reactors contained
secondary effluent and media with a 50% fill by volume for campaign experiments focused on
the carriers, and IFAS mixed liquor for campaign experiments focused on the IFAS mixed liquor
alone.
5.2.4 Experimental Protocol
5.2.4.1 Half-Saturation Coefficient Evaluation (low NH4+-N and NO2-N): The reactors were
controlled to variable DO concentrations of 2, 4, 6, and 8 mg/L and allowed to mix and aerate
with pure O2 until each reactor reached the desired DO. The reactors were then spiked with
phosphate to ensure that the biomass was not nutrient limited and the reactors are spiked to 25
mg/L of either ammonia or nitrite. After the spike the reactors were sampled at appropriate
intervals to not only capture the linear rate of nitrification, but also the nitrification rate when
substrate concentrations dropped to low levels. The results from these tests were recorded and
analyzed to give the half saturation coefficient using four different DO concentrations. This test
was conducted three times for AOB and NOB activity on the media at 175 RPM and 100 RPMS
corresponding to a range of G values summarized in Table 3.1.1 and as twice for AOB and NOB
activity on the media at 100 rpms. In addition to testing the IFAS media, the same experiment
was conducted one for AOB and NOB activity in the mixed liquor at 175 rpms.

95
5.2.4.2 DO and Mixing: The four reactors, containing secondary effluent and a 50% fill of
media by volume were placed into the temperature-controlled bath. The reactors will be set to
their respective DO concentrations at 2, 4, 6, and 8 mg/L and allowed to mix and aerate with
pure O2 until each reactor has reached the desired DO. Three separate experiments will be
conduced in this configuration, each at different mixing velocities of 100 rpm, 140 rpm, and 175
rpm. The reactors will then be spiked with either 25 mg/L-N ammonia or nitrite and sampled
five times over a two hour period. These samples will be analyzed for ammonia, nitrate, and
nitrite. After each two hour experiment, the media and secondary effluent will be dumped out of
the reactors and replaced with fresh samples. The next experiment will then continue at the next
mixing velocity. This experiment was conducted twice for AOB and NOB on the IFAS media as
well as twice for the AOB and NOB activity in the IFAS mixed liquor.
5.2.4.3 Affect of COD addition on Nitrification Rates: In order to understand how
heterotrophic and autotrophic bacteria are distributed in the IFAS tank, and how COD uptake
affects nitrification rates on the IFAS media and mixed liquor, an experiment was conducted in
which four reactors were run, two containing IFAS mixed liquor and two with IFAS media in
secondary effluent at a measured 50% fill. Of these reactors, one containing mixed liquor, and
the other containing media were spiked with 200 mg/L COD as acetic acid, and then all four
reactors were spiked to 25 mg/L ammonia or nitrite depending on the population of nitrifiers
being studied. The reactors were then sampled 5 times over a two hour period and analysis of
COD uptake as well as nitrification kinetics.
96
5.2.5 Sample Preparation for Analysis
During the rate experiments, the samples collected every 25 minutes were taken from the
reactors using a 30mL syringe, followed by immediate filtration using a 0.45 µm PES membrane
filter into a scew-cap vial. After filtration, the samples were analyzed for various constituents
including NH4+-N, NO2-N, and NO3-N. Samples were normally analyzed in the field almost
immediately after they were collected, and in the case that immediate analysis was not possible
for whatever reason the samples were refrigerated to ensure that accurate analysis was conducted
for each experiment. In all cases, field analyses were completed within 24 hours. Samples for
MLSS and MLVSS analysis were collected in 500 mL HDPE bottles and stored at 4° C until
analysis by HRSD Central Environmental Laboratories (CEL). In some cases, filtered samples
were preserved for confirmation testing by HRSD CEL for NH4+-N and NOx-N. This additional
testing provided QA/QC for the analysis performed at the plant.
5.2.6 Sample Analysis
5.2.6.1 Total Ammonia Nitrogen (NH4+-N)
For field analysis, NH4+-N was analyzed using HACH colorimetric method TNT plus
832. Colorimetric methods were performed per HACH protocols with evaluation of matrix
interference and other issues as needed.
5.2.6.2 Nitrate (NO3--N)
For field analysis, NO3--N was analyzed using HACH colorimetric method TNT plus
836. Colorimetric methods were performed per HACH protocols with evaluation of matrix
interference and other issues as needed.
97
5.2.6.3 Nitrite (NO2--N)
Nitrite analysis was conducted in the field as soon as possible after sample filtration. The
standard colorimetric method will be performed using HACH Nitriver 3 reagent and 10 mL
samples. HACH method 8507 is a low range method, so all samples were diluted to
concentrations between 0.002 and 0.3 mg/L NO2-N and analyzed per standard protocols.
5.2.6.4 MLSS/MLVSS
Mixed Liquor Suspended Solids and Mixed Liquor Volatile Suspended Solids were
performed by both HRSD laboratories and in the VMI laboratories in accordance with Standard
Methods. Samples were collected for analysis at the end of every experiment and transported on
ice to one of the analysis locations.
5.3 RESULTS & DISCUSSION
5.3.1 DO and Mixing
Mixing intensity in the IFAS basin can be calculated using air flow into the coarse bubble
aerators. Figure 5-2 below plots the velocity gradient in the basin for the course of the
nitrification rate testing. The plot indicates that G in the IFAS tank remains relatively constant
over the course of the year at about 250 s-1
. This shows that as temperatures cool and the
aeration requirements decrease to maintain DO in the tank. Because of this drop in aeration,
mixing decreases slightly, however, as the water becomes more viscous during cooling, the G
value for the same air flow increases. It is this phenomenon that allows the velocity gradient to
remain relatively constant year round.

98
0
50
100
150
200
250
300
350
Jan-08 Feb-08 Apr-08 May-08 Jul-08 Sep-08 Oct-08 Dec-08 Feb-09
Velo
cit
y G
rad
ien
t (s
-1)
Velocity Gradient, G
Acclimation Period
Figure 5-2. Velocity Gradient in the IFAS tank
DO concentrations in the bulk liquid as well as mixing energy imparted to the water both
play a role in the mass transport of substrate to and within the biofilm. Figures 5-3A, 5-3B, 5-
3C, and 5-3D below outline the effects of both mixing energy and DO on AOB and NOB activity
on the carriers. Figures 5-3A and 5-3B summarize the mixing and DO effects on AOB activity
on the carriers for two different experiments conducted on November 18, 2008 and January 13,
2009. These dates correspond to dates when nitrification activity on the IFAS media was
recorded to be in excess of at least 60% of the AOB activity occurring in the IFAS basin
(Thomas et al, 2009). The figures demonstrate that with all experiments conducted nitrification
rates on the media increased steadily as DO concentrations were increased from 2 mg/L to 8
mg/L. The plots also indicate that AOB rates continue to increase in a linear fashion as DO
concentrations in the bulk liquor reach 8 mg/L. This indicates that the biofilm has not reached
99
saturation for AOB activity, even at DO of 8mg/L and that biofilm saturation occurs at a higher
DO. These plots help to visualize the dependence on substrate availability on biofilm kinetics
and that higher concentration of substrate in the bulk liquid allows the substrate to diffuse further
into the biofilm and become more available to nitrifying populations located on the carriers.
Similarly, NOB activity on the carriers was also tested by varying DO concentrations in
the bulk liquid and mixing intensity. Figures 5-3C and 5-3D below outline the results from NOB
experiments conducted on November 19, 2008 and January 14, 2009. As previously discussed,
these dates correspond with times in which more than 80% of the total NOB activity was
occurring on the media. Like the AOB experiments, it is clear from the figures that DO
concentrations in the bulk liquor impacts the nitrification rates on the IFAS carriers. However,
unlike the AOB experiments, NOB activity ceases to increase linearly as DO concentrations
exceed 6 mg/L in the bulk liquid. This observation indicates that the NOB populations are
saturated at lower DO concentrations than AOB populations.
Because the NOB activity does not increase with DO concentrations higher than 6 mg/L,
a clearer picture of mixing intensity effects can be observed in Figures 5-32C and 5-3D. Like the
AOB activity, mixing intensity imparted to the water does not affect nitrification kinetics as
much as DO; but, mixing energy still helps to increase substrate availability in the biofilm. In
Figure 5-3D, it seems that the saturating DO concentration is dictated in part by mixing. At
lower mixing speeds, the DO concentrations have a much higher effect on nitrification kinetics,
and by increasing the mixing energy in the water, the mass transport of substrate into the biofilm,
in this case DO, is much easier.
The plots also helps to show that mixing energy makes substrate more available to the
biofilm by making the water film surrounding the biofilm thinner, making mass transport
100
through the water film much easier. The mixing, however, does little to affect mass transport
through the biofilms, though it may have made them thinner by inducing higher detachment rate
in the bench-scale test reactors, unlike bulk DO concentrations which affect mass transport
through both the water film and the biofilm.
In addition, temperature makes some significant impacts on nitrification rates measured
for these experiments. As temperature decreases, microbial activity and metabolism slows
down, resulting in slower nitrification rates at colder temperatures. In addition, it has been
shown that carrier biofilm content increase with temperature as environmental conditions in the
IFAS tank approach washout conditions. The added biomass on the carriers creates more
resistance to diffusion into the biofilm, making substrate more difficult to access and slowing the
nitrification rates (Thomas et al. 2009). In addition to affecting biofilm diffusion, the diffusion
coefficient decreases as a result of an increase in water viscosity which creates more resistance in
the mass transfer boundary layer. Temperatures affects on water density also have an effect on
the velocity gradient in the water, G, which, in some ways, off-sets the effect on the diffusion
coefficient. As temperature decreases, the velocity gradient increases adding mixing energy to
the system.
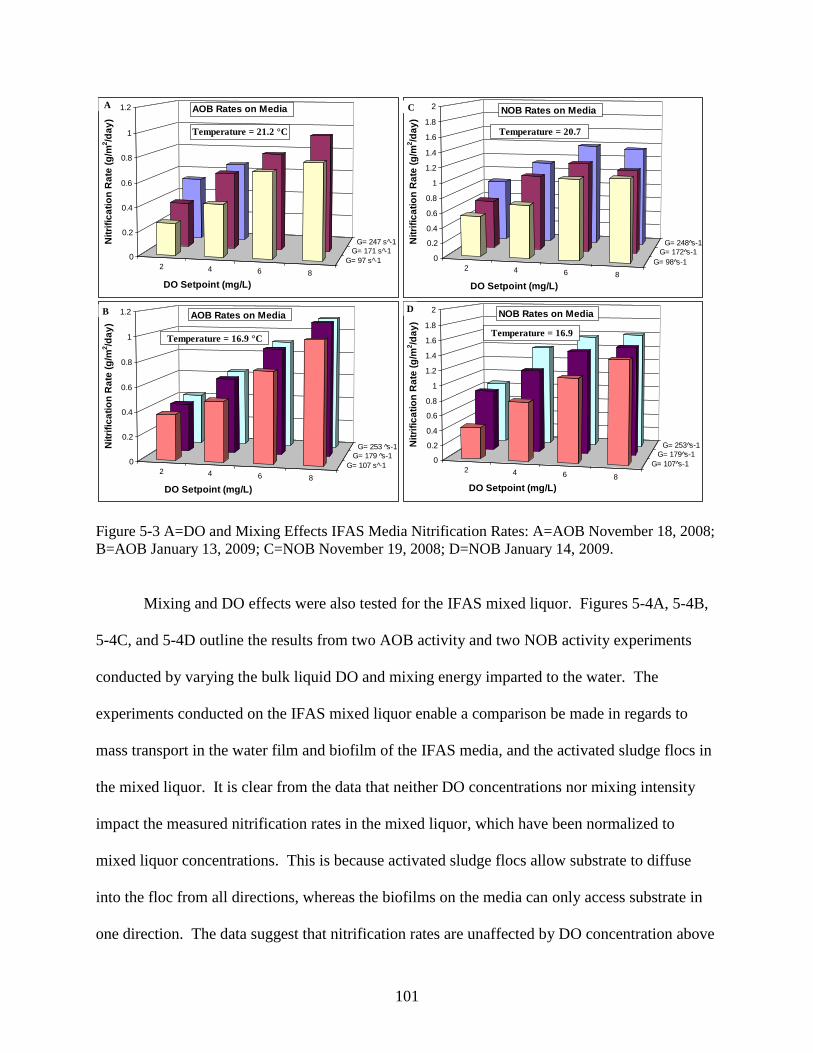
101
2 4 6 8
G= 97 s -1
G= 171 s -1
G= 247 s -1
0
0.2
0.4
0.6
0.8
1
1.2N
itri
fic
ati
on
Ra
te (
g/m
2/d
ay
)
DO Setpoint (mg/L)
AOB Rates on MediaA
Temperature = 21.2 °C
2 4 6 8
G= 98 s-1
G= 172 s-1
G= 248 s-1
0
0.2
0.4
0.6
0.8
1
1.2
1.4
1.6
1.8
2
Nit
rifi
ca
tio
n R
ate
(g
/m2/d
ay
)
DO Setpoint (mg/L)
NOB Rates on MediaC
Temperature = 20.7
°C
2 4 6 8
G= 107 s -1
G= 179 s-1
G= 253 s-1
0
0.2
0.4
0.6
0.8
1
1.2
Nit
rifi
ca
tio
n R
ate
(g
/m2/d
ay
)
DO Setpoint (mg/L)
AOB Rates on MediaB
Temperature = 16.9 °C
2 4 6 8
G= 107 s-1
G= 179 s-1
G= 253 s-1
0
0.2
0.4
0.6
0.8
1
1.2
1.4
1.6
1.8
2
Nit
rifi
ca
tio
n R
ate
(g
/m2/d
ay
)
DO Setpoint (mg/L)
NOB Rates on MediaD
Temperature = 16.9
°C
Figure 5-3 A=DO and Mixing Effects IFAS Media Nitrification Rates: A=AOB November 18, 2008;
B=AOB January 13, 2009; C=NOB November 19, 2008; D=NOB January 14, 2009.
Mixing and DO effects were also tested for the IFAS mixed liquor. Figures 5-4A, 5-4B,
5-4C, and 5-4D outline the results from two AOB activity and two NOB activity experiments
conducted by varying the bulk liquid DO and mixing energy imparted to the water. The
experiments conducted on the IFAS mixed liquor enable a comparison be made in regards to
mass transport in the water film and biofilm of the IFAS media, and the activated sludge flocs in
the mixed liquor. It is clear from the data that neither DO concentrations nor mixing intensity
impact the measured nitrification rates in the mixed liquor, which have been normalized to
mixed liquor concentrations. This is because activated sludge flocs allow substrate to diffuse
into the floc from all directions, whereas the biofilms on the media can only access substrate in
one direction. The data suggest that nitrification rates are unaffected by DO concentration above
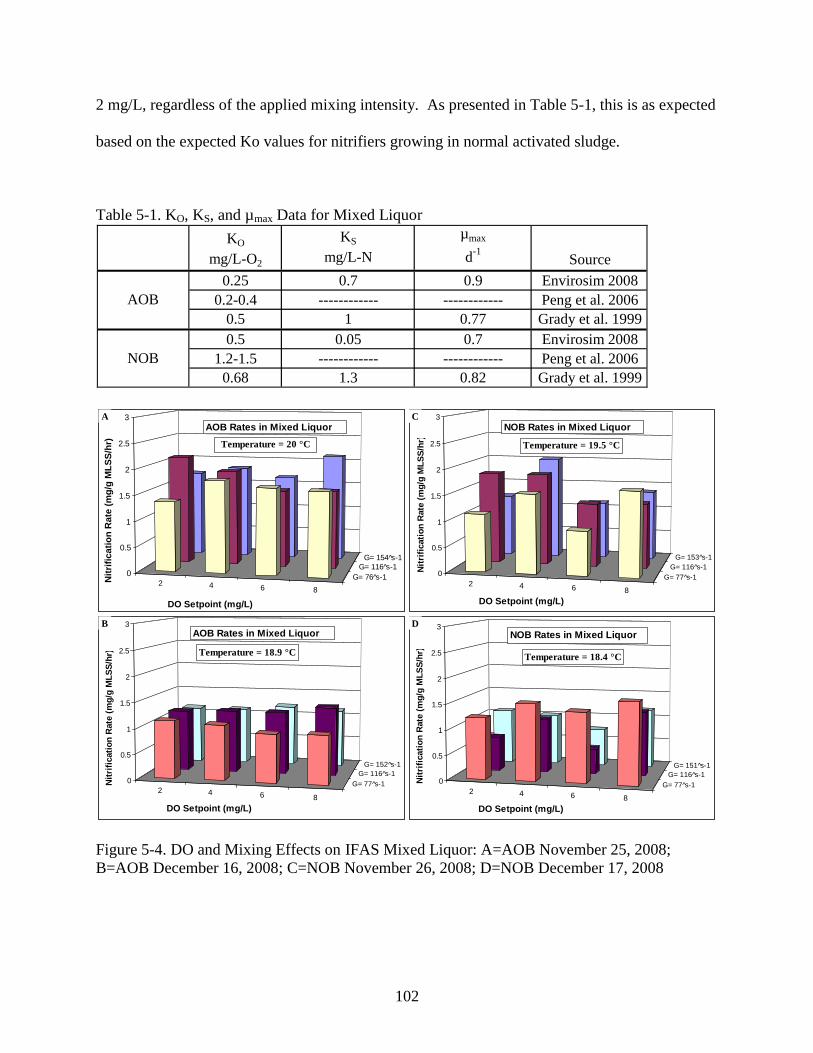
102
2 mg/L, regardless of the applied mixing intensity. As presented in Table 5-1, this is as expected
based on the expected Ko values for nitrifiers growing in normal activated sludge.
Table 5-1. KO, KS, and µmax Data for Mixed Liquor
KO
mg/L-O2
KS
mg/L-N
µmax
d-1
Source
0.25 0.7 0.9 Envirosim 2008
0.2-0.4 ------------ ------------ Peng et al. 2006
0.5 1 0.77 Grady et al. 1999
0.5 0.05 0.7 Envirosim 2008
1.2-1.5 ------------ ------------ Peng et al. 2006
0.68 1.3 0.82 Grady et al. 1999
AOB
NOB
2 4 6 8
G= 76 s-1
G= 116 s-1
G= 154 s-1
0
0.5
1
1.5
2
2.5
3
Nit
rifi
cati
on
Rate
(m
g/g
ML
SS
/hr)
DO Setpoint (mg/L)
AOB Rates in Mixed LiquorA
Temperature = 20 °C
2 4 6 8
G= 77 s-1
G= 116 s-1
G= 153 s-1
0
0.5
1
1.5
2
2.5
3N
itri
ficati
on
Rate
(m
g/g
ML
SS
/hr)
DO Setpoint (mg/L)
NOB Rates in Mixed LiquorC
Temperature = 19.5 °C
2 4 6 8
G= 77 s-1
G= 116 s-1
G= 152 s-1
0
0.5
1
1.5
2
2.5
3
Nit
rifi
cati
on
Rate
(m
g/g
ML
SS
/hr)
DO Setpoint (mg/L)
AOB Rates in Mixed LiquorB
Temperature = 18.9 °C
2 4 6 8
G= 77 s-1
G= 116 s-1
G= 151 s-1
0
0.5
1
1.5
2
2.5
3
Nit
rifi
cati
on
Rate
(m
g/g
ML
SS
/hr)
DO Setpoint (mg/L)
NOB Rates in Mixed LiquorD
Temperature = 18.4 °C
Figure 5-4. DO and Mixing Effects on IFAS Mixed Liquor: A=AOB November 25, 2008;
B=AOB December 16, 2008; C=NOB November 26, 2008; D=NOB December 17, 2008
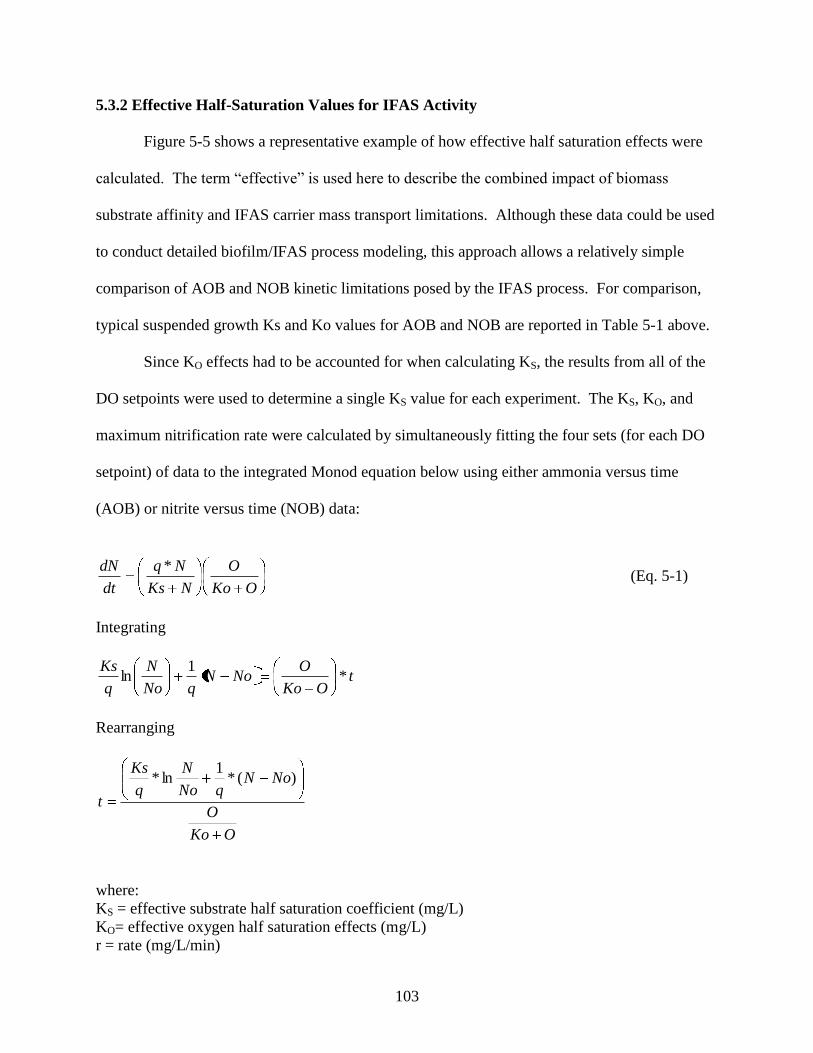
103
5.3.2 Effective Half-Saturation Values for IFAS Activity
Figure 5-5 shows a representative example of how effective half saturation effects were
calculated. The term ―effective‖ is used here to describe the combined impact of biomass
substrate affinity and IFAS carrier mass transport limitations. Although these data could be used
to conduct detailed biofilm/IFAS process modeling, this approach allows a relatively simple
comparison of AOB and NOB kinetic limitations posed by the IFAS process. For comparison,
typical suspended growth Ks and Ko values for AOB and NOB are reported in Table 5-1 above.
Since KO effects had to be accounted for when calculating KS, the results from all of the
DO setpoints were used to determine a single KS value for each experiment. The KS, KO, and
maximum nitrification rate were calculated by simultaneously fitting the four sets (for each DO
setpoint) of data to the integrated Monod equation below using either ammonia versus time
(AOB) or nitrite versus time (NOB) data:
OKo
O
NKs
Nq
dt
dN * (Eq. 5-1)
Integrating
tOKo
ONoN
qNo
N
q
Ks*
1ln
Rearranging
OKo
O
NoNqNo
N
q
Ks
t
)(*1
ln*
where:
KS = effective substrate half saturation coefficient (mg/L)
KO= effective oxygen half saturation effects (mg/L)
r = rate (mg/L/min)

104
q = maximum rate (mg/L/min)
N = substrate concentration (mg/L-N)
N0 = initial substrate concentration (mg/L-N)
O= DO concentration (mg/L)
t = time (minutes)
Bulk Liquid DO=2.4 mg/L
0
5
10
15
20
25
0 50 100 150 200 250time (mins)
NO
2 c
on
c. (m
g/L
NO
2-N
)
Measured
Modeled
Bulk Liquid DO=4.1 mg/L
0
5
10
15
20
25
30
0 50 100 150 200 250time (mins)
NO
2 c
on
c. (m
g/L
NO
2-N
)
Measured
Modeled
Bulk Liquid DO=6.1 mg/L
0
5
10
15
20
25
0 50 100 150 200 250time (mins)
NO
2 c
on
c. (m
g/L
NO
2-N
)
Measured
Modeled
Bulk Liquid DO=8.4 mg/L
0
5
10
15
20
25
0 50 100 150 200time (mins)
NO
2 c
on
c. (m
g/L
NO
2-N
)
Measured
Modeled
Figure 5-5. Representative Model Fitting for Ks and Ko effects- June 24, 2008
Table 5-2. Diffusion coefficients for Nitrite, Ammonium, and Oxygen at 25 °C
DW
cm2/s Source
Ammonium 1.95E-05 Lyde et al. 1996
Nitrite 1.91E-05 Lyde et al. 1996
2.10E-05 Lyde et al. 1996
2.60E-05 Nazaroff et al. 2001Oxygen
Table 5-2 above summarizes diffusion coefficients for ammonia, nitrite, and oxygen.
This table shows that there are insignificant differences in the ability for each of these substrates
to diffuse into the biofilm.
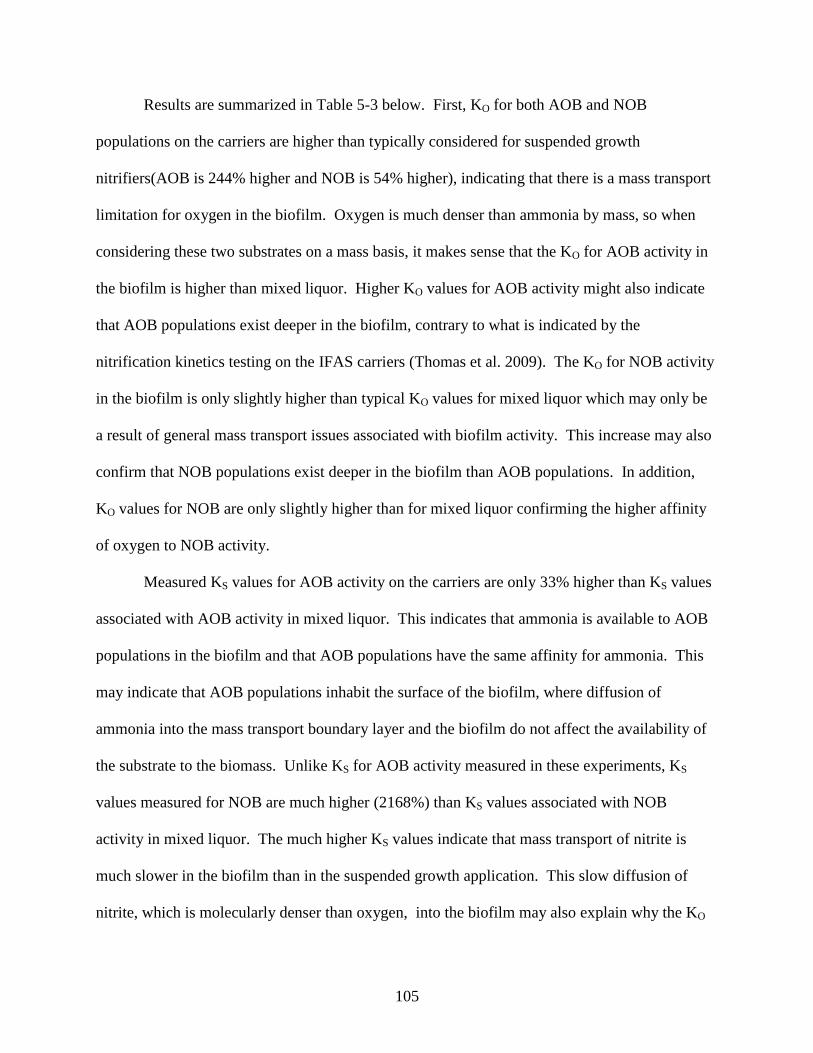
105
Results are summarized in Table 5-3 below. First, KO for both AOB and NOB
populations on the carriers are higher than typically considered for suspended growth
nitrifiers(AOB is 244% higher and NOB is 54% higher), indicating that there is a mass transport
limitation for oxygen in the biofilm. Oxygen is much denser than ammonia by mass, so when
considering these two substrates on a mass basis, it makes sense that the KO for AOB activity in
the biofilm is higher than mixed liquor. Higher KO values for AOB activity might also indicate
that AOB populations exist deeper in the biofilm, contrary to what is indicated by the
nitrification kinetics testing on the IFAS carriers (Thomas et al. 2009). The KO for NOB activity
in the biofilm is only slightly higher than typical KO values for mixed liquor which may only be
a result of general mass transport issues associated with biofilm activity. This increase may also
confirm that NOB populations exist deeper in the biofilm than AOB populations. In addition,
KO values for NOB are only slightly higher than for mixed liquor confirming the higher affinity
of oxygen to NOB activity.
Measured KS values for AOB activity on the carriers are only 33% higher than KS values
associated with AOB activity in mixed liquor. This indicates that ammonia is available to AOB
populations in the biofilm and that AOB populations have the same affinity for ammonia. This
may indicate that AOB populations inhabit the surface of the biofilm, where diffusion of
ammonia into the mass transport boundary layer and the biofilm do not affect the availability of
the substrate to the biomass. Unlike KS for AOB activity measured in these experiments, KS
values measured for NOB are much higher (2168%) than KS values associated with NOB
activity in mixed liquor. The much higher KS values indicate that mass transport of nitrite is
much slower in the biofilm than in the suspended growth application. This slow diffusion of
nitrite, which is molecularly denser than oxygen, into the biofilm may also explain why the KO
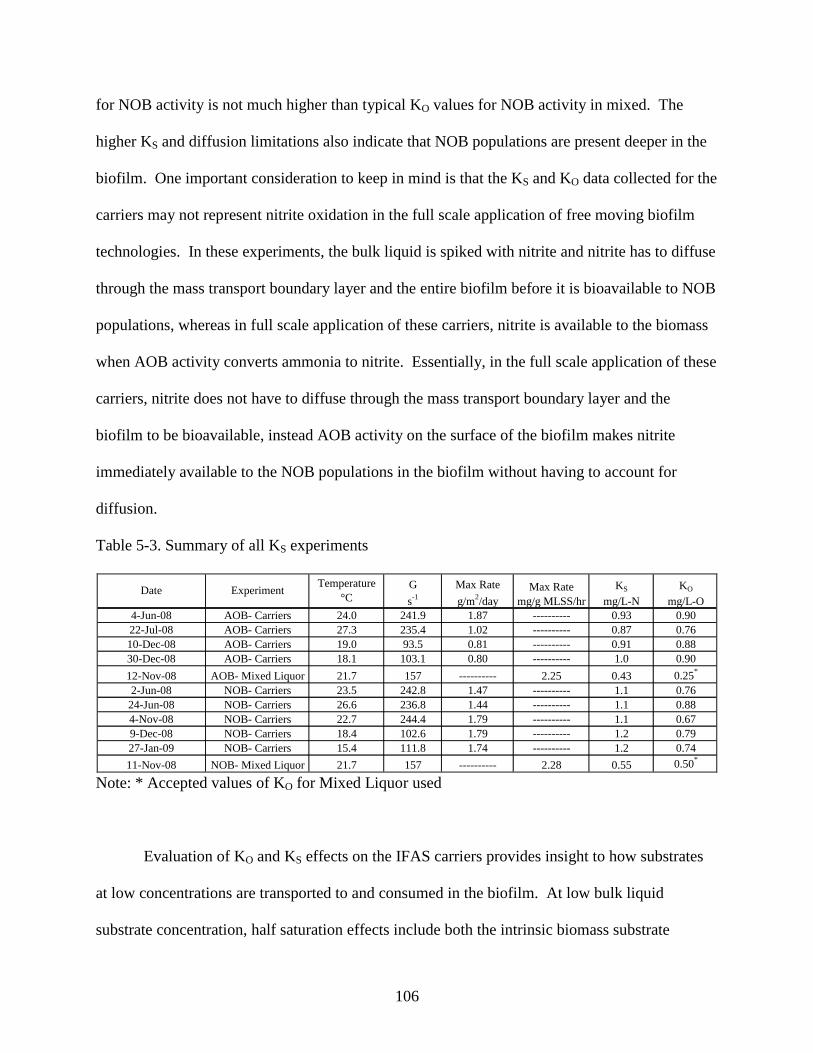
106
for NOB activity is not much higher than typical KO values for NOB activity in mixed. The
higher KS and diffusion limitations also indicate that NOB populations are present deeper in the
biofilm. One important consideration to keep in mind is that the KS and KO data collected for the
carriers may not represent nitrite oxidation in the full scale application of free moving biofilm
technologies. In these experiments, the bulk liquid is spiked with nitrite and nitrite has to diffuse
through the mass transport boundary layer and the entire biofilm before it is bioavailable to NOB
populations, whereas in full scale application of these carriers, nitrite is available to the biomass
when AOB activity converts ammonia to nitrite. Essentially, in the full scale application of these
carriers, nitrite does not have to diffuse through the mass transport boundary layer and the
biofilm to be bioavailable, instead AOB activity on the surface of the biofilm makes nitrite
immediately available to the NOB populations in the biofilm without having to account for
diffusion.
Table 5-3. Summary of all KS experiments
4-Jun-08 AOB- Carriers 24.0 241.9 1.87 ---------- 0.93 0.90
22-Jul-08 AOB- Carriers 27.3 235.4 1.02 ---------- 0.87 0.76
10-Dec-08 AOB- Carriers 19.0 93.5 0.81 ---------- 0.91 0.88
30-Dec-08 AOB- Carriers 18.1 103.1 0.80 ---------- 1.0 0.90
12-Nov-08 AOB- Mixed Liquor 21.7 157 ---------- 2.25 0.43 0.25*
2-Jun-08 NOB- Carriers 23.5 242.8 1.47 ---------- 1.1 0.76
24-Jun-08 NOB- Carriers 26.6 236.8 1.44 ---------- 1.1 0.88
4-Nov-08 NOB- Carriers 22.7 244.4 1.79 ---------- 1.1 0.67
9-Dec-08 NOB- Carriers 18.4 102.6 1.79 ---------- 1.2 0.79
27-Jan-09 NOB- Carriers 15.4 111.8 1.74 ---------- 1.2 0.74
11-Nov-08 NOB- Mixed Liquor 21.7 157 ---------- 2.28 0.55 0.50*
Max Rate
mg/g MLSS/hr
Max Rate
g/m2/day
KS
mg/L-N
KO
mg/L-ODate Experiment
Temperature
°C
G
s-1
Note: * Accepted values of KO for Mixed Liquor used
Evaluation of KO and KS effects on the IFAS carriers provides insight to how substrates
at low concentrations are transported to and consumed in the biofilm. At low bulk liquid
substrate concentration, half saturation effects include both the intrinsic biomass substrate
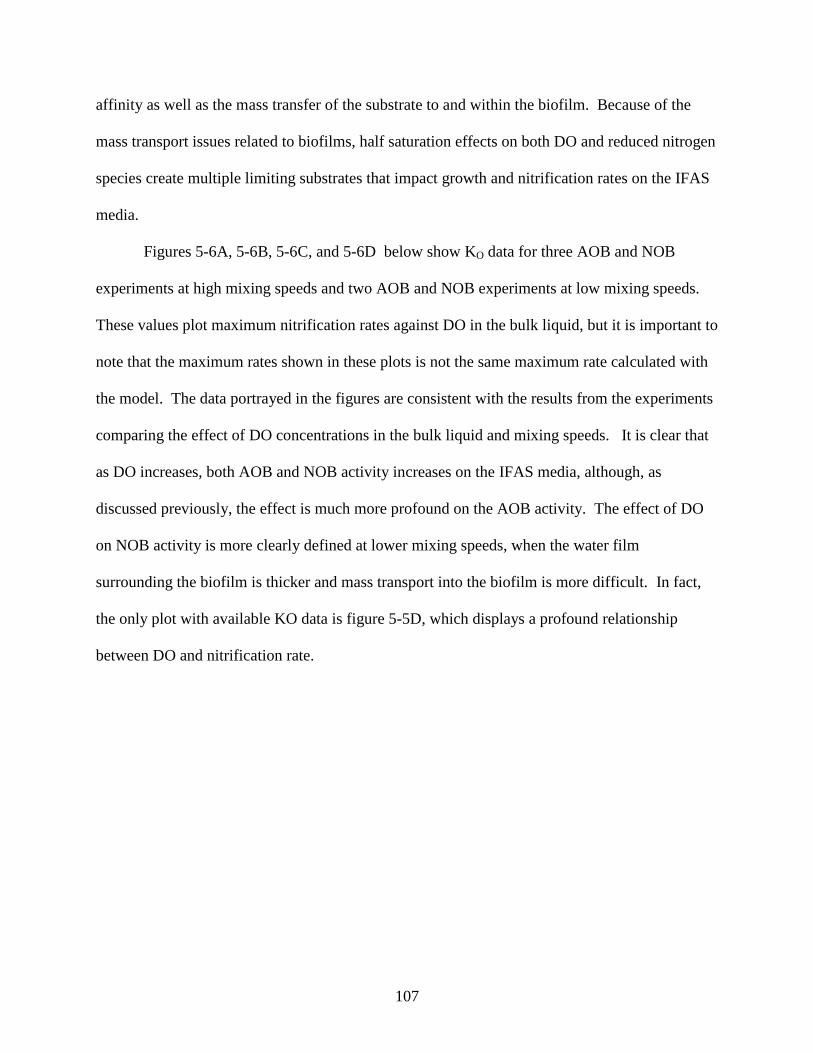
107
affinity as well as the mass transfer of the substrate to and within the biofilm. Because of the
mass transport issues related to biofilms, half saturation effects on both DO and reduced nitrogen
species create multiple limiting substrates that impact growth and nitrification rates on the IFAS
media.
Figures 5-6A, 5-6B, 5-6C, and 5-6D below show KO data for three AOB and NOB
experiments at high mixing speeds and two AOB and NOB experiments at low mixing speeds.
These values plot maximum nitrification rates against DO in the bulk liquid, but it is important to
note that the maximum rates shown in these plots is not the same maximum rate calculated with
the model. The data portrayed in the figures are consistent with the results from the experiments
comparing the effect of DO concentrations in the bulk liquid and mixing speeds. It is clear that
as DO increases, both AOB and NOB activity increases on the IFAS media, although, as
discussed previously, the effect is much more profound on the AOB activity. The effect of DO
on NOB activity is more clearly defined at lower mixing speeds, when the water film
surrounding the biofilm is thicker and mass transport into the biofilm is more difficult. In fact,
the only plot with available KO data is figure 5-5D, which displays a profound relationship
between DO and nitrification rate.
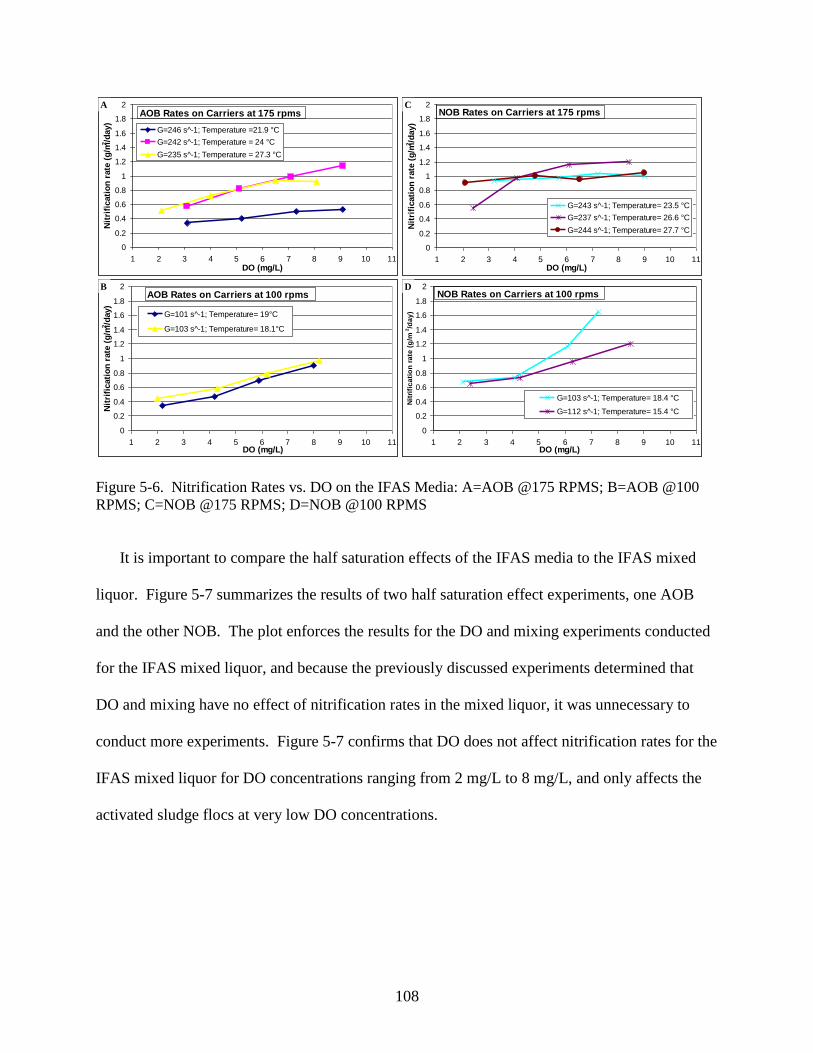
108
0
0.2
0.4
0.6
0.8
1
1.2
1.4
1.6
1.8
2
1 2 3 4 5 6 7 8 9 10 11DO (mg/L)
Nit
rifi
cati
on
rate
(g
/m2/d
ay)
G=246 s^-1; Temperature =21.9 °C
G=242 s^-1; Temperature = 24 °C
G=235 s^-1; Temperature = 27.3 °C
AOB Rates on Carriers at 175 rpmsA
0
0.2
0.4
0.6
0.8
1
1.2
1.4
1.6
1.8
2
1 2 3 4 5 6 7 8 9 10 11DO (mg/L)
Nit
rifi
cati
on
rate
(g
/m2/d
ay)
G=101 s^-1; Temperature= 19°C
G=103 s^-1; Temperature= 18.1°C
AOB Rates on Carriers at 100 rpmsB
0
0.2
0.4
0.6
0.8
1
1.2
1.4
1.6
1.8
2
1 2 3 4 5 6 7 8 9 10 11DO (mg/L)
Nit
rifi
cati
on
rate
(g
/m2/d
ay)
G=243 s^-1; Temperature= 23.5 °C
G=237 s^-1; Temperature= 26.6 °C
G=244 s^-1; Temperature= 27.7 °C
NOB Rates on Carriers at 175 rpmsC
0
0.2
0.4
0.6
0.8
1
1.2
1.4
1.6
1.8
2
1 2 3 4 5 6 7 8 9 10 11DO (mg/L)
Nit
rifi
ca
tio
n r
ate
(g
/m2/d
ay
)
G=103 s^-1; Temperature= 18.4 °C
G=112 s^-1; Temperature= 15.4 °C
NOB Rates on Carriers at 100 rpmsD
Figure 5-6. Nitrification Rates vs. DO on the IFAS Media: A=AOB @175 RPMS; B=AOB @100
RPMS; C=NOB @175 RPMS; D=NOB @100 RPMS
It is important to compare the half saturation effects of the IFAS media to the IFAS mixed
liquor. Figure 5-7 summarizes the results of two half saturation effect experiments, one AOB
and the other NOB. The plot enforces the results for the DO and mixing experiments conducted
for the IFAS mixed liquor, and because the previously discussed experiments determined that
DO and mixing have no effect of nitrification rates in the mixed liquor, it was unnecessary to
conduct more experiments. Figure 5-7 confirms that DO does not affect nitrification rates for the
IFAS mixed liquor for DO concentrations ranging from 2 mg/L to 8 mg/L, and only affects the
activated sludge flocs at very low DO concentrations.

109
0
2
4
6
8
10
12
14
16
18
1 2 3 4 5 6 7 8 9 10DO (mg/L)
Nit
rifi
ca
tio
n r
ate
(m
g/g
ML
SS
/hr)
AOB NOB
IFAS Mixed Liquor @ G=157 s^-1 Temperature= 21.7 °C
Figure 5-7. AOB and NOB Nitrification Rates on the IFAS Mixed Liquor versus DO
5.3.3 Effect of COD addition on Nitrification Rates
The IFAS mixed liquor and media were impacted by COD addition in different ways.
Figure 5-9 shows the results from two different experiments conducted comparing the how COD
addition affects both AOB and NOB nitrification rates on the IFAS media. From Figure 5-8, it is
clear that COD addition does not have an impact on nitrification kinetics for AOB or NOB
populations on the IFAS carriers. In addition to having no significant impact on nitrification
rates, Figure 5-8 demonstrates that the media demonstrated very low COD uptake rates,
indicating that very little to no heterotrophic growth has occurred on the media, and that most of
the biomass on the media appears to be autotrophic. As water temperature in the basin
decreased, the biomass concentration increased on the carriers. On December 2nd
, the water
temperature was 18.8 °C corresponding to a biomass content measurement of 5.09 g MLSS/m2,
and on January 28th
, the water temperature was 15.3 °C resulting in a increase of biomass content
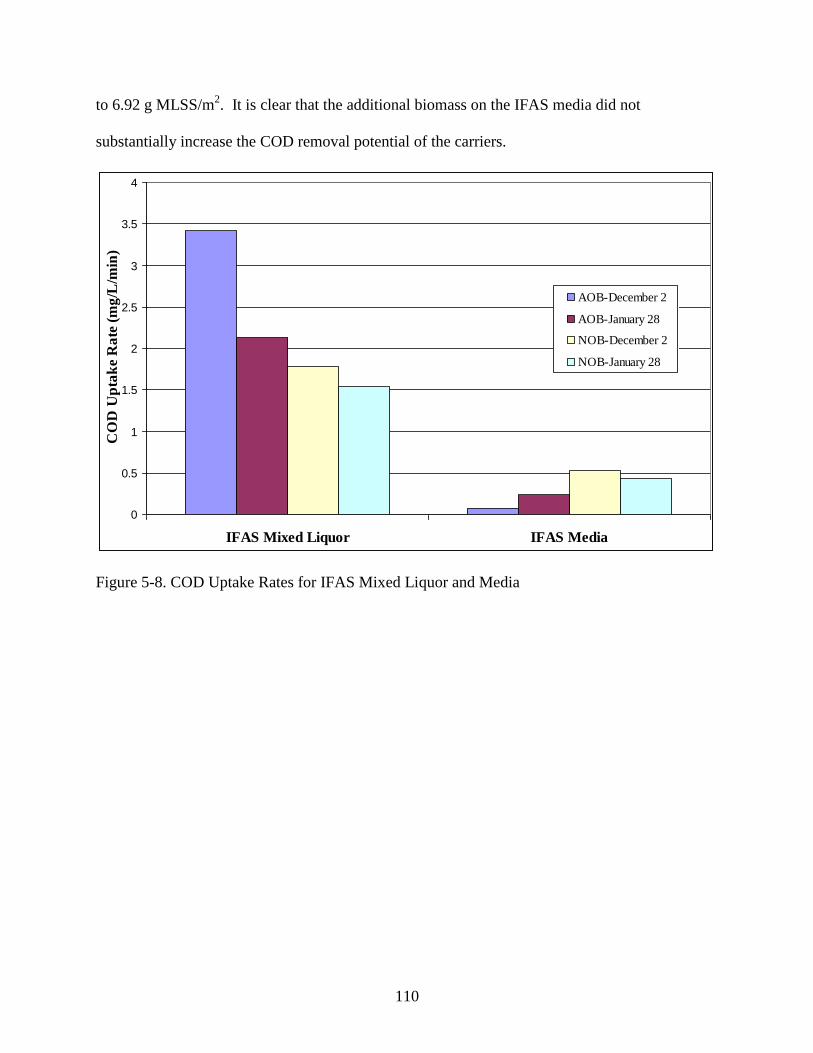
110
to 6.92 g MLSS/m2. It is clear that the additional biomass on the IFAS media did not
substantially increase the COD removal potential of the carriers.
0
0.5
1
1.5
2
2.5
3
3.5
4
IFAS Mixed Liquor IFAS Media
CO
D U
pta
ke
Ra
te (
mg
/L/m
in)
AOB-December 2
AOB-January 28
NOB-December 2
NOB-January 28
Figure 5-8. COD Uptake Rates for IFAS Mixed Liquor and Media
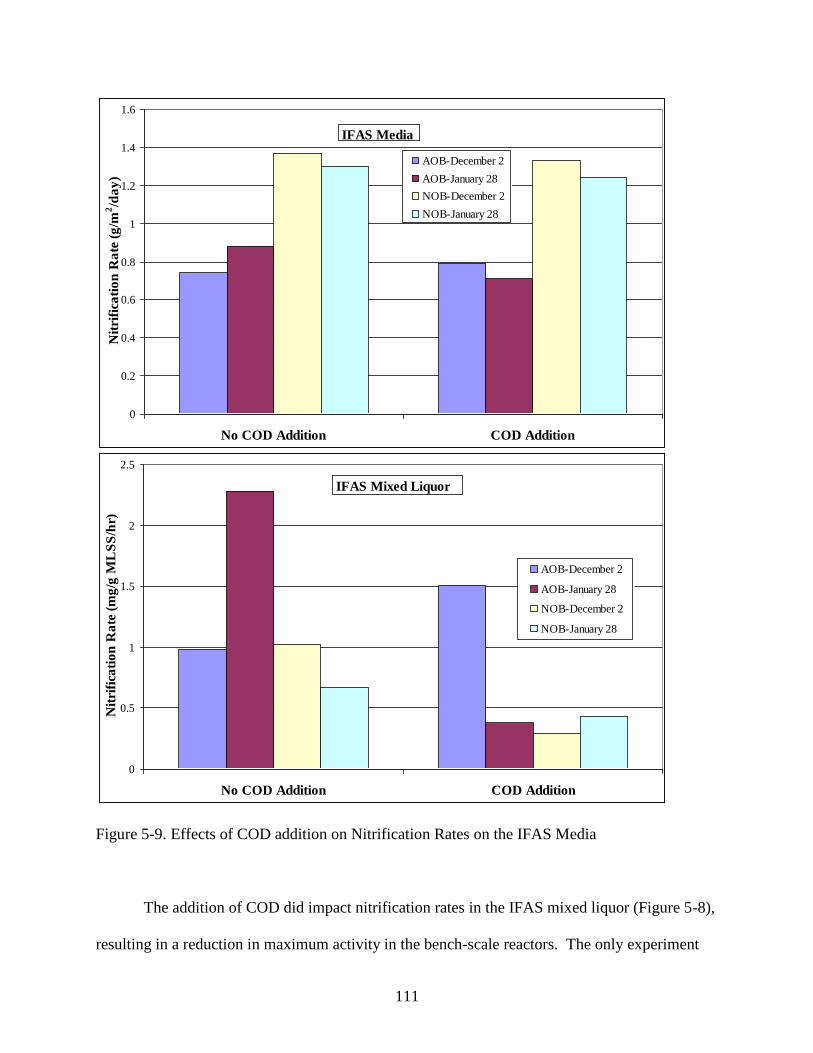
111
0
0.5
1
1.5
2
2.5
No COD Addition COD Addition
Nit
rifi
cati
on
Ra
te (
mg
/g M
LS
S/h
r)
AOB-December 2
AOB-January 28
NOB-December 2
NOB-January 28
IFAS Mixed Liquor
0
0.2
0.4
0.6
0.8
1
1.2
1.4
1.6
No COD Addition COD Addition
Nit
rifi
cati
on
Ra
te (
g/m
2/d
ay
)
AOB-December 2
AOB-January 28
NOB-December 2
NOB-January 28
IFAS Media
Figure 5-9. Effects of COD addition on Nitrification Rates on the IFAS Media
The addition of COD did impact nitrification rates in the IFAS mixed liquor (Figure 5-8),
resulting in a reduction in maximum activity in the bench-scale reactors. The only experiment
112
that did not reflect this trend was the AOB experiment conducted on December 2, 2008, which
shows an increase in ammonia oxidation rate. This can be explained by a rapid increase in the
reactor pH to values as high as 8.3 in all of the mixed liquor that received the COD spike (pH
controllers worked only with automatic addition of alkalinity, not acid). It is well known that
increases in pH can be beneficial for AOB activity (Park et al. 2007), and this change could have
been responsible for the unexpected AOB data on December 2. However, in other experiments
conducted, both AOB and NOB nitrification rates declined as a result of the addition of COD to
the mixed liquor.
5.4 CONCLUSIONS
The campaign experiments provided additional information about IFAS process kinetics.
Mixing and DO both affect maximum nitrification rates on the biofilm carriers. Increasing
mixing intensity in the IFAS process decreases the mass transfer boundary layer thickness
which increases substrate accessibility to the biofilm and the maximum nitrification rate. The
effect of mixing on the maximum nitrification rate on the carriers is much more profound at
lower DO. Bulk liquid DO also affects nitrification kinetics in the IFAS process, and the
relationship between DO and nitrification rate is roughly linear until the biofilm becomes
saturated with oxygen. After oxygen saturation occurs, nitrification rates cease to increase.
Oxygen saturation occurs at different bulk DO for AOB and NOB activity. Saturation occurs at
about 6 mg/L for NOB activity which is clearly shown by Figure 5-2. For AOB activity,
saturation does not occur until bulk DO rises above 8 mg/L. This research did not investigate
the effect of DO concentrations above 8 mg/L, so it is unknown exactly when oxygen saturation
occurs. This phenomenon contradicts much of the data collected indicating where AOB and
113
NOB populations inhabit the biofilm. Because oxygen saturation happens at a lower DO for
NOB populations, it appears that NOB activity is localized at the surface of the biofilm, and that
AOB activity occurs deeper in the biofilm. However, despite this observation, there is
overwhelming evidence that AOB activity is localized at the biofilm surface and that NOB
activity remains deeper in the biofilm. Molecular work to be completed by Pinto et al. (2009)
should help to answer these questions. Either way, as bulk liquid DO decreases, oxygen
becomes a limiting substrate and ultimately controls the maximum nitrification rate on the
carriers.
The data collected concerning the half saturation effects on the biofilm carriers suggests
that KS values in the IFAS process can be modeled using Monod kinetics and were, as expected,
higher than accepted KS values for mixed liquor. Modeled NOB effective KS values for the
carriers were 2168% higher than what is typically considered for suspended growth. This
indicates that nitrite accessibility in the biofilm is greatly limited by substrate diffusion. Limited
nitrite diffusion, however, is not altogether unexpected. Nitrite has a lower diffusivity than
ammonia or oxygen so it makes sense that the half saturation coefficient would be much higher
in the biofilm application. It is also consistent with NOB localized deeper within the biofilm.
KS for AOB activity was only 33% higher than what is accepted for suspended phase AOB
activity, indicating that ammonia is more easily accessed by the biofilm. This also indicates that
AOB populations inhabit the surface of the biofilm where substrate diffusion has less effect.
KO for both AOB and NOB activity in the biofilm is higher than typical mixed liquor
value because of the mass transport issues associated with the biofilm. For AOB, the measured
KO on the media was 244% more than values listed by Envirosim (2008), and NOB KO on the
media was 54% higher for NOBs than Envirosim (2008) values. This trend, however,
114
contradicts the diffusion coefficient for oxygen, which is higher than ammonia and nitrite. If KS
values for AOB activity in the biofilm was close to KS values for mixed liquor, then it would
seem that oxygen, having a higher diffusivity, would diffuse into the surface of the biofilm
easily and not be much higher than mixed liquor KO values.
The data suggest two possible biofilm configurations as shown in Figure 5-10 below.
The most likely scenario (Figure 5-10A) would appear to involve AOB at the surface of the
biofilm and NOB located further within. This hypothesis is supported by effective Ks data and
the observation of more significant AOB activity in the mixed liquor during colder periods
(suggesting better bioaugmentation). However, it is also well accepted that suspended growth
NOB are more susceptible than AOB to low DO concentrations (Ko for NOB is higher than
AOB). This combined with the effective Ko data reported elsewhere (Thomas et al, 2009)
suggests that NOB could be located at the surface of the biofilm (Figure 5-10B). Based on full-
scale tank TN removal under DO-limited conditions, there did appear to be some degree of
simultaneous nitrification-denitrification activity occurring, and this suggests a deep
heterotrophic biofilm was also likely present.
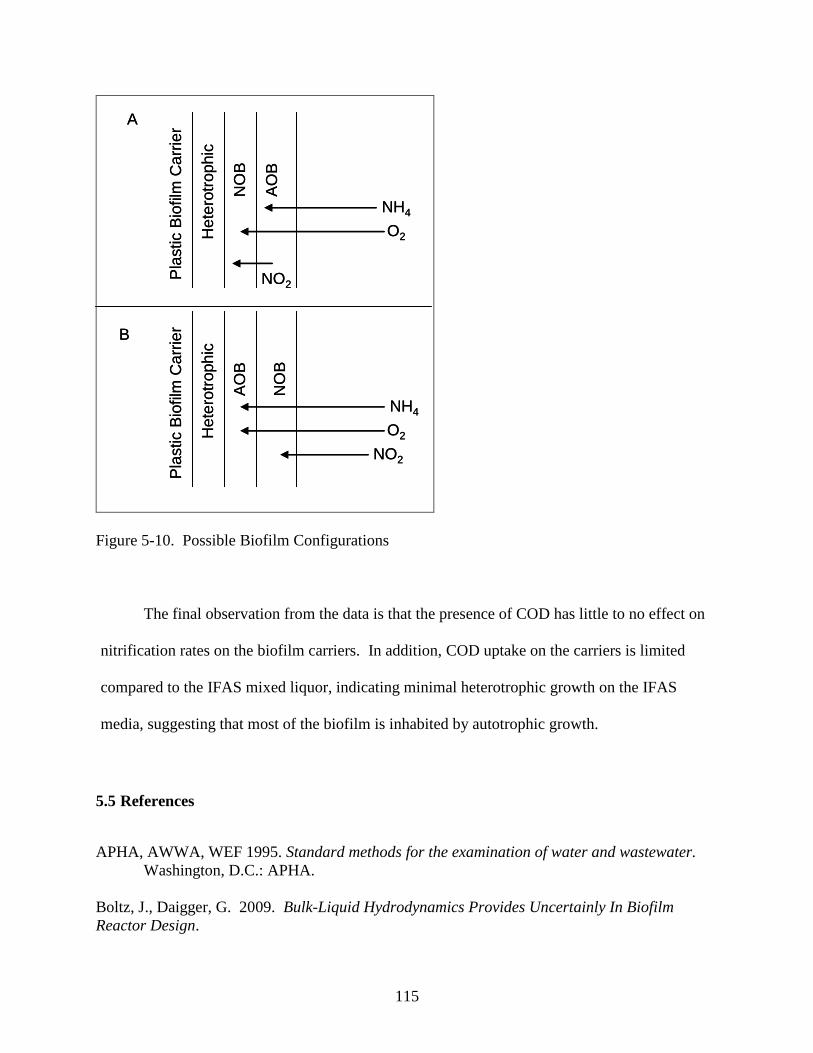
115
AO
B
NO
B
He
tero
troph
ic
Pla
stic B
iofilm
Ca
rrie
r
O2
NO2
NH4
AO
B
NO
B
He
tero
troph
ic
Pla
stic B
iofilm
Ca
rrie
r
O2
NO2
NH4
B
A
AO
B
NO
B
He
tero
troph
ic
Pla
stic B
iofilm
Ca
rrie
r
O2
NO2
NH4
AO
B
NO
B
He
tero
troph
ic
Pla
stic B
iofilm
Ca
rrie
r
O2
NO2
NH4
B
A
Figure 5-10. Possible Biofilm Configurations
The final observation from the data is that the presence of COD has little to no effect on
nitrification rates on the biofilm carriers. In addition, COD uptake on the carriers is limited
compared to the IFAS mixed liquor, indicating minimal heterotrophic growth on the IFAS
media, suggesting that most of the biofilm is inhabited by autotrophic growth.
5.5 References
APHA, AWWA, WEF 1995. Standard methods for the examination of water and wastewater.
Washington, D.C.: APHA.
Boltz, J., Daigger, G. 2009. Bulk-Liquid Hydrodynamics Provides Uncertainly In Biofilm
Reactor Design.
116
Envirosim, 2008. BioWin Version 3.0 Default parameters.
McQuarrie, J., Rutt, K., Seda, J., Haegh, M. Observations From The First Year of Full-Scale
Operation - The IFAS/BNR Process At The Broomfield Wastewater Reclamation Facility,
Broomfield, CO. Proceedings of the 77th
WEFTEC- National Conference of the Water
Environment Federation. New Orleans, LA, October 2-6, 2004.
Ross, D., Fernandes, W., Briggs, T., Kim, N., Booth, G., Neely, D., Welp, J. Integrated Fixed
Film Activated Sludge (IFAS) At The Lakeview WWTP: The Real Implementation Issues.
Proceedings of the 77th
WEFTEC- National Conference of the Water Environment Federation.
New Orleans, LA, October 2-6, 2004.
Thomas, W. 2009. Evaluation of Nitrification Kinetics for a 2.0 MGD IFAS Process
Demonstration. Civil and Environmental Engineering. Virginia Polytechnic Institute and State
University, Blacksburg, VA.
Water Quality Management Planning Regulation. Chapter 720. 9 VAC 25-820-70.
Yerrell, K., Gobbie, M., Dold, P., Jones, R., Sickerdick, L. Full-Scale Demonstration Of A Free-
Moving Media IFAS Process For Enhancing Nitrification Performance. Proceedings of the 74th
WEFTEC- National Conference of the Water Environment Federation. Atlanta, GA, October 13-
17, 2001
117
6 ENGINEERING SIGNIFICANCE
Nitrification rate testing has offered a great deal of insight into the performance of the
IFAS process for a number of operating conditions and temperatures. Biofilm carrier content
serves as a tool when assessing process health and changes according to temperature and
process operation. Biofilm content measurements were homogeneous throughout the length of
the IFAS zone which indicates that the IFAS zone is well mixed, despite being a plug flow
reactor by nature. This trend is also consistent with nitrification activity. Nitrification rates,
both AOB and NOB, were constant on carriers throughout the length of the IFAS zone despite
the decline substrate concentration, also suggesting that IFAS zone is well mixed with respect to
biomass growth. As temperature changed seasonally, biomass moved on and off the carriers for
a number of reasons. As water temperature increased higher than 23 °C, carrier biomass content
began to decline significantly, corresponding with a significant shift of AOB activity from the
fixed film phase to the mixed liquor. This sloughing of biomass and shift of nitrification
activity to the mixed liquor occurred when operating conditions, like process SRT, supported
autotrophic growth in the suspended phase of the IFAS tank. Then, as temperature cooled in the
basin in the late autumn and early winter, biomass content on the carriers steadily increased
from about 3 g MLSS/m2 to about 7 g MLSS/m
2. This shift on the carriers occurred for two
reasons. One reason is that the IFAS basin began to approach washout conditions for nitrifiers.
As a result, autotrophs moved to the fixed film phase where they could be exposed to a higher
effective SRT. The second reason for the shift of biomass onto the carriers is probably a result
of a reduction in mixing input to the tank. At low temperatures, less aeration is required to
maintain DO in the tank, so the decreased aeration intensity likely also resulted in decreased
agitation of the media and thus less sloughing of biomass.
118
AOB and NOB activity localization is dependent on temperature and process SRT. AOB
activity appears to inhabit the surface of the biofilm and smoothly transitions between the
biofilm and suspended fraction as temperature and operating conditions, such as SRT, change.
AOB activity in the mixed liquor represents half of the total AOB activity in the IFAS zone
when temperatures reach and exceed 23 °C. When temperature dropped to below 20 °C, AOB
activity on the media made up a maximum 75% of the total AOB activity in the IFAS tank.
When temperature in the basin peaked, AOB activity in the basin was at its lowest, making up
only 30% of the total AOB activity in the IFAS basin. The majority of NOB activity remains on
the carriers year round and makes much less of a transition from the biofilm to the mixed liquor
as temperatures and SRT increase and conditions that support autotrophic growth improve.
NOB on the carriers never decreased to less than 60% of the total NOB activity in the tank, and
NOB activity increased to over 90% of the total NOB activity in the tank during the colder
wintertime temperatures. This phenomenon indicates that NOB activity also has a much higher
affinity for the carriers and that NOB activity occurs deeper in the biofilm. This probably
makes sense given the immediate availability of nitrite produced in the biofilm as a result of
local AOB activity. However, AOB and NOB activity remains in the IFAS mixed liquor, even
during washout conditions, due to ―bio-augmentation‖ caused by sloughing of biomass off the
carriers.
The campaign experiments provided additional information about IFAS process kinetics.
Mixing and DO both affect maximum nitrification rates on the biofilm carriers. Increasing
mixing intensity in the IFAS process decreases the mass transfer boundary layer thickness
which increases substrate accessibility to the biofilm and the maximum nitrification rate. The
effect of mixing on the maximum nitrification rate on the carriers is much more profound at
119
lower DO. Bulk liquid DO also affects nitrification kinetics in the IFAS process, and the
relationship between DO and nitrification rate is roughly linear until the biofilm becomes
saturated with oxygen. After oxygen saturation occurs, nitrification rates cease to increase.
Oxygen saturation occurs at different bulk DO for AOB and NOB activity. Saturation occurs at
about 6 mg/L for NOB activity which is clearly shown by Figure 5-2. For AOB activity,
saturation does not occur until bulk DO rises above 8 mg/L. This research did not investigate
the effect of DO concentrations above 8 mg/L, so it is unknown exactly when oxygen saturation
occurs. This phenomenon contradicts much of the data collected indicating where AOB and
NOB populations inhabit the biofilm. Because oxygen saturation happens at a lower DO for
NOB populations, it would appear that NOB activity is localized at the surface of the biofilm,
and that AOB activity occurs deeper in the biofilm. However, despite this observation, there is
overwhelming evidence that AOB activity is localized at the biofilm surface and that NOB
activity remains deeper in the biofilm. Molecular work to be completed by Pinto et al (2009)
should help to answer these questions. Either way, as bulk liquid DO decreases, oxygen
becomes a limiting substrate and ultimately controls the maximum nitrification rate on the
carriers.
The data collected concerning the half saturation effects on the biofilm carriers suggest
that KS values in the IFAS process can be modeled using Monod kinetics and were, as expected,
higher than accepted KS values for mixed liquor. Modeled NOB effective KS values for the
carriers were 2168% higher than what is typically considered for suspended growth. This
indicates that nitrite accessibility in the biofilm is greatly limited by substrate diffusion. Limited
nitrite diffusion, however, is not altogether unexpected. Nitrite has a lower diffusivity than
ammonia or oxygen so it makes sense that the half saturation coefficient would be much higher
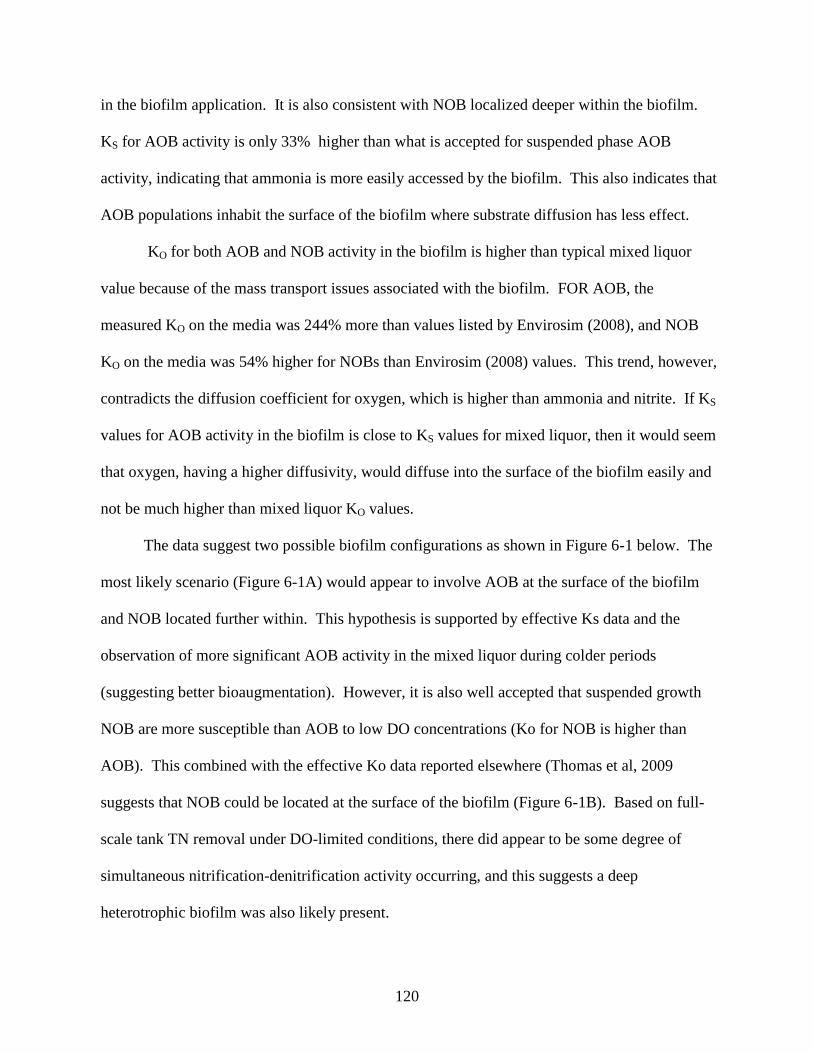
120
in the biofilm application. It is also consistent with NOB localized deeper within the biofilm.
KS for AOB activity is only 33% higher than what is accepted for suspended phase AOB
activity, indicating that ammonia is more easily accessed by the biofilm. This also indicates that
AOB populations inhabit the surface of the biofilm where substrate diffusion has less effect.
KO for both AOB and NOB activity in the biofilm is higher than typical mixed liquor
value because of the mass transport issues associated with the biofilm. FOR AOB, the
measured KO on the media was 244% more than values listed by Envirosim (2008), and NOB
KO on the media was 54% higher for NOBs than Envirosim (2008) values. This trend, however,
contradicts the diffusion coefficient for oxygen, which is higher than ammonia and nitrite. If KS
values for AOB activity in the biofilm is close to KS values for mixed liquor, then it would seem
that oxygen, having a higher diffusivity, would diffuse into the surface of the biofilm easily and
not be much higher than mixed liquor KO values.
The data suggest two possible biofilm configurations as shown in Figure 6-1 below. The
most likely scenario (Figure 6-1A) would appear to involve AOB at the surface of the biofilm
and NOB located further within. This hypothesis is supported by effective Ks data and the
observation of more significant AOB activity in the mixed liquor during colder periods
(suggesting better bioaugmentation). However, it is also well accepted that suspended growth
NOB are more susceptible than AOB to low DO concentrations (Ko for NOB is higher than
AOB). This combined with the effective Ko data reported elsewhere (Thomas et al, 2009
suggests that NOB could be located at the surface of the biofilm (Figure 6-1B). Based on full-
scale tank TN removal under DO-limited conditions, there did appear to be some degree of
simultaneous nitrification-denitrification activity occurring, and this suggests a deep
heterotrophic biofilm was also likely present.
121
AO
B
NO
B
He
tero
troph
ic
Pla
stic B
iofilm
Ca
rrie
r
O2
NO2
NH4
AO
B
NO
B
He
tero
troph
ic
Pla
stic B
iofilm
Ca
rrie
r
O2
NO2
NH4
B
A
AO
B
NO
B
He
tero
troph
ic
Pla
stic B
iofilm
Ca
rrie
r
O2
NO2
NH4
AO
B
NO
B
He
tero
troph
ic
Pla
stic B
iofilm
Ca
rrie
r
O2
NO2
NH4
B
A
Figure 6-1. Possible Biofilm Configurations
The final observation from the data is that the presence of COD has little to no effect on
nitrification rates on the biofilm carriers. In addition, COD uptake on the carriers is limited
compared to the IFAS mixed liquor, indicating minimal heterotrophic growth on the IFAS
media, suggesting that most of the biofilm is inhabited by autotrophic growth.
122
7 REFERENCES
AEsoy, A., Odegaard, H., Haegh, M, Risla, F., Bentzen, G. Upgrading Wastewater Treatment
Plants By The Use Of Biofilm Carriers, Oxygen Addition And Pre-treatment In The
Sewer Network. Civil and Environmental Engineering. Aaiborg University.
APHA, AWWA, WEF 1995. Standard methods for the examination of water and wastewater.
Washington, D.C.: APHA.
Boltz, J., Daigger, G. 2009. Bulk-Liquid Hydrodynamics Provides Uncertainly In Biofilm
Reactor Design.
Chen, S., Ling, J., Blancheton, J. 2006. Nitrification Kinetics Of Biofilm As Affected By Water
Quality Factors. Aquacultural Engineering: 34(3): 179-197.
Choi, N., Phillips, H., Johnson, T.L., Butler, R., Lauro, T. Pilot Testing Of MBBR And IFAS
Treatment Processes For Nitrification And Denitrification At The Mamaroneck WWTP.
Proceedings of the 80th
WEFTEC- National Conference of the Water Environment Federation,
San Diego, CA. 80: October 13-17, 2007.
Envirosim, 2008. BioWin Version 3.0 Default parameters.
Germain, E., Bancroft, L., Dawson, A., Hinrichs, C., Fricker, L., Pearce, P. 2007. Evaluation Of
Hybrid Processes For Nitrification By Comparing MBBR/AS And IFAS Configurations. Water
Science and Technology: 55(8-9): 43-49.
Grady, C., Daigger, G., Lim, H. 1999. Biological Wastewater Treatment, Theory And
Application. New York: Marcel Deker, Inc.
Head, M., Oleszkiewicz, J. 2005. Nitrifying Bacteria Addition Into Reactors Operating Near
Washout Conditions For Nitrification. Journal of Environmental Engineering and Science: 4(4):
257-264.
Hubbell, S., Krichten, D. Demonstration And Full Scale Results Of A Plant Upgrade For BNR
Using Integrated Fixed-Film Activated Sludge (IFAS) Technology. Proceedings of the 77th
WEFTEC- National Conference of the Water Environment Federation. New Orleans, LA,
October 2-6, 2004.
Hubbell, S., McDowell, C. Cold Temperature BNR Using Integrated Fixed-Film Activated
Sludge (IFAS) Hybrid Technology. Proceedings of the 76th
WEFTEC- National Conference of
the Water Environment Federation. Los Angeles, CA, October 12-15, 2003.
Jackson, D., Ripley, L., Maurina, T., Hubbell, S. Conversion from Contact Stabilization To
Nitrification Using Integrated Fixed Film Activated Sludge (IFAS) In The Colony, Texas.
Proceedings of the 80th
WEFTEC- National Conference of the Water Environment Federation.
San Diego, CA, October 13-17, 2007.
123
Johnson, T., McQuarrie, J., Shaw, A. Integrated Fixed-Film Activated Sludge (IFAS): The New
Choice For Nitrogen Removal Upgrades In The United States. Proceedings of the 77th
WEFTEC- National Conference of the Water Environment Federation. New Orleans, LA,
October 2-6, 2004.
Johnson, T., Shaw, A. A Pilot-Scale Comparison of IFAS And MBBR To Achieve Very Low Total
Nitrogen Concentrations. Proceedings of the 80th
WEFTEC- National Conference of the Water
Environment Federation. San Diego, CA, October 13-17, 2007.
Jones, R., Sen, D., Lambert, R. 1998. Full Scale Evaluation Of Nitrification Performance In An
Integrated Fixed Film Activated Sludge Process. Water Science and Technology: 38(1): 71-78.
Kaldate, A., Smedley, S., Turner, T. Evaluation Of IFAS Technology For TN Removal At
Chesterfield County BNR Program. Proceedings of the 81st WEFTEC- National Conference of
the Water Environment Federation. Chicago, IL, October 18-22, 2008.
Liubicich, J., Pitt, P., Psaltakis, E., Zabinski, A., Lauro, T. Bench Scale Testing Of The IFAS
Technology At The Mamaroneck WWTP. Proceedings of the 77th
WEFTEC- National
Conference of the Water Environment Federation. New Orleans, LA, October 2-6, 2004.
Lyde, D. 1996. CRC Handbook of Chemistry And Physics. 77.
Maas, C., Parker, W., Legge, R. Detachment Of Solids And Nitrifiers In IFAS Systems.
Proceedings of the 80th
WEFTEC- National Conference of the Water Environment Federation.
San Diego, CA, October 13-17, 2007.
Masterson, T., Federico, J., Duerr, S. Upgrading For Total Nitrogen Removal With A Porous
Media IFAS System. Proceedings of the 77th
WEFTEC- National Conference of the Water
Environment Federation. New Orleans, LA, October 2-6, 2004.
Metcalf & Eddy. 2003. Wastewater Engineering: Treatment and Reuse. Boston: McGraw-Hill,
Inc.
McQuarrie, J., Rutt, K., Seda, J., Haegh, M. Observations From The First Year of Full-Scale
Operation - The IFAS/BNR Process At The Broomfield Wastewater Reclamation Facility,
Broomfield, CO. Proceedings of the 77th
WEFTEC- National Conference of the Water
Environment Federation. New Orleans, LA, October 2-6, 2004.
Motsch, S., Fetherolf, D., Guhse, G., McGettigan, J., Wilson, T. MBBR and IFAS Pilot Program
For Denitrification At Fairfax County’s Norman Cole Pollution Control Plant. Proceedings of
the WEF Nutrient Removal Conference (2007). Baltimore, MD, March 4-7, 2007.
Nazaroff, W., Alvarez-Cohen, L. 2001. Environmental Engineering Science. New York: John
Wiley & Sons, Inc.
124
Nelson, D., Renner, T. Improving Performance Of A Conventional Activated Sludge WTF To
Provide Nitrification Utilizing Integrated Fixed Film Activated Sludge (IFAS). Proceedings of
the 80th
WEFTEC- National Conference of the Water Environment Federation. San Diego, CA,
October 13-17, 2007.
Odegaard, H., Rusten, B., Siljudalen, J. The Development Of The Moving Bed Biofilm Process-
From Idea To Commercial Product.
Onnis-Hayden, A., Dair, D., Johnson, C., Schramm, A., Gu, A. Kinetics And Nitrifying
Populations In Nitrogen Removal Processes At A Full-Scale Integrated Fixed-Film Activated
Sludge (IFAS) Plant. Proceedings of the 80th
WEFTEC- National Conference of the Water
Environment Federation. San Diego, CA, October 13-17, 2007.
Park, S., Bae, W., Chung, J., Baek, S. 2007. Empirical Model Of The pH Dependence Of The
Maximum Specific Nitrification Rate. Process Biochemistry: 42(12): 1671-1676.
Psaltakis, E., Liubicich, J, Pitt, P., Antonio, P., Posada, S. Demonstration Of Integrated Fixed
Film Activated Sludge Process For BNR At The Mamaroneck WWTP. Proceedings of the 76th
WEFTEC- National Conference of the Water Environment Federation. Los Angeles, CA,
October 12-15, 2003.
Randall, C., Sen, D. 1996. Full-Scale Evaluation Of An Integrated Fixed-Film Activated Sludge
(IFAS) Process For Enhanced Nitrogen Removal. Water Science and Technology: 33(12): 155-
162.
Randall, C., Sen, D. Improving The Aquifas (Unified) Computational Model For Activated
Sludge, IFAS and MBBR Systems By Embedding A Multi-Layer Biofilm Diffusion Model Within
A Multi-Cell Activated Sludge System. Proceedings of the WEF Nutrient Removal Conference
(2007). Baltimore, MD, March 4-7, 2007.
Regmi, P. 2008. Biological Nutrient Removal Upgrade At The James River Wastewater
Treatment Plant. Civil and Environmental Engineering. Old Dominion University, Norfolk, VA.
Ross, D., Fernandes, W., Briggs, T., Kim, N., Booth, G., Neely, D., Welp, J. Integrated Fixed
Film Activated Sludge (IFAS) At The Lakeview WWTP: The Real Implementation Issues.
Proceedings of the 77th
WEFTEC- National Conference of the Water Environment Federation.
New Orleans, LA, October 2-6, 2004.
Rusten, B., Hem, L., Odegaard, H. 1995. Nitrification Of Municipal Wastewater In Moving Bed
Biofilm Reactors. Water Environment Research: 67: 75-86
Sen, D., Murthy, S., Phillips, H., Pattarkine, V., Copithorn, R., Randall, C., Schwinn, D.,
Banerjee, S. Minimizing Aerobic And Post Anoxic Volume Requirements In Tertiary Integrated
Fixed-Film Activated Sludge (IFAS) And Moving Bed Biofilm Reactor (MBBR) systems Using
The Aquifas Model. Proceedings of the 80th
WEFTEC- National Conference of the Water
Environment Federation. San Diego, CA, October 13-17, 2007.
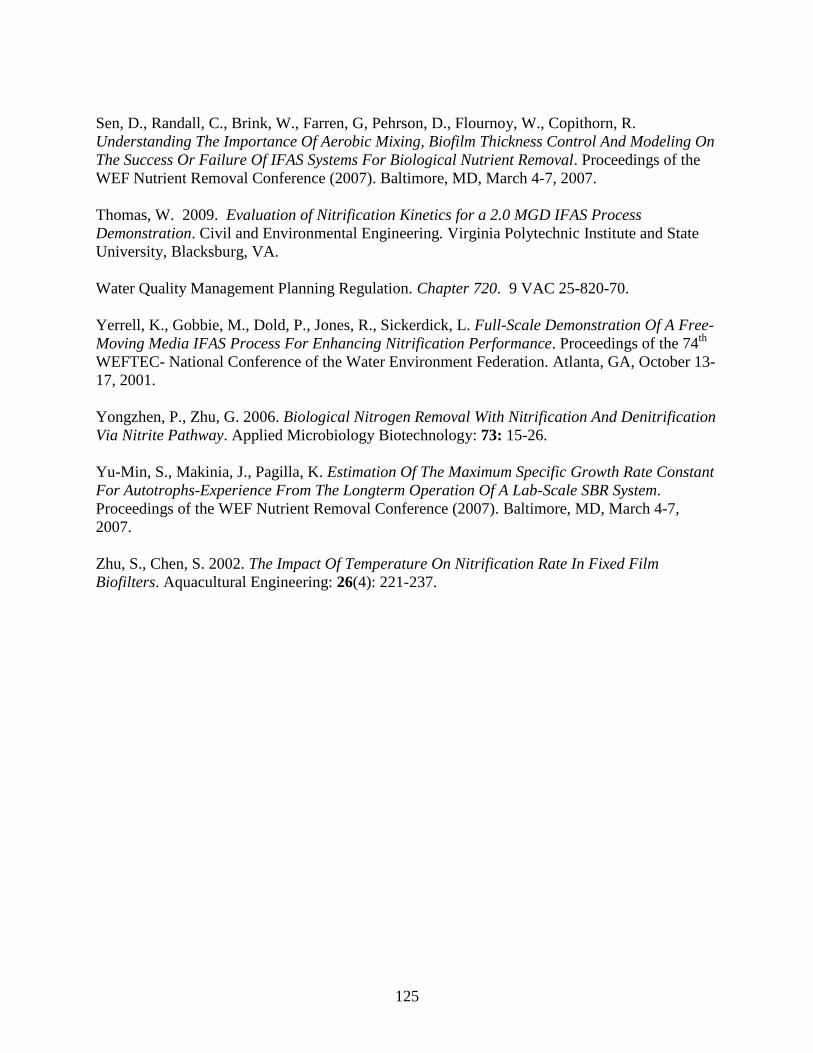
125
Sen, D., Randall, C., Brink, W., Farren, G, Pehrson, D., Flournoy, W., Copithorn, R.
Understanding The Importance Of Aerobic Mixing, Biofilm Thickness Control And Modeling On
The Success Or Failure Of IFAS Systems For Biological Nutrient Removal. Proceedings of the
WEF Nutrient Removal Conference (2007). Baltimore, MD, March 4-7, 2007.
Thomas, W. 2009. Evaluation of Nitrification Kinetics for a 2.0 MGD IFAS Process
Demonstration. Civil and Environmental Engineering. Virginia Polytechnic Institute and State
University, Blacksburg, VA.
Water Quality Management Planning Regulation. Chapter 720. 9 VAC 25-820-70.
Yerrell, K., Gobbie, M., Dold, P., Jones, R., Sickerdick, L. Full-Scale Demonstration Of A Free-
Moving Media IFAS Process For Enhancing Nitrification Performance. Proceedings of the 74th
WEFTEC- National Conference of the Water Environment Federation. Atlanta, GA, October 13-
17, 2001.
Yongzhen, P., Zhu, G. 2006. Biological Nitrogen Removal With Nitrification And Denitrification
Via Nitrite Pathway. Applied Microbiology Biotechnology: 73: 15-26.
Yu-Min, S., Makinia, J., Pagilla, K. Estimation Of The Maximum Specific Growth Rate Constant
For Autotrophs-Experience From The Longterm Operation Of A Lab-Scale SBR System.
Proceedings of the WEF Nutrient Removal Conference (2007). Baltimore, MD, March 4-7,
2007.
Zhu, S., Chen, S. 2002. The Impact Of Temperature On Nitrification Rate In Fixed Film
Biofilters. Aquacultural Engineering: 26(4): 221-237.

126
8 APPENDICES
8.1 Appendix A. Nitrification Rate Testing Results
Table 8-1. Full Scale Plant Results
Date
IFAS Avg. AOB Reactor Avg. NOB Reactor AOB MLSS NOB MLSS AOB NOx slope AOB NOx slope 5 pt rolling ave. AOB NOx slope NOB NO3 slope NOB NO3 slope 5 pt rolling ave. NOB NO3 slope Predicted AOB OUR Measured AOB OUR Measured AOB SOUR Measured AOB SOUR Predicted NOB OUR Measured NOB OUR Measured NOB SOUR Measured NOB SOUR AOB Nit Rate NOx* 5 pt rolling ave. AOB Nit Rate NOx* NOB Nit Rate NO3* 5 pt rolling ave. NOB Nit Rate NO3* P Source of Sample
Temperature (°C) Temperature (°C) Temperature (°C) mg/L mg/L mg/L/min mg/L/hr mg/L/min mg/L/min mg/L/hr mg/L/min mg/L/min mg/L/min mg O2/g MLSS/hr g/m2/day mg/L/min mg/L/min mg O2/g MLSS/hr g/m2/day mg/g MLSS/hr mg/g MLSS/hr mg/g MLSS/hr mg/g MLSS/hr mg/L P
28-Jan-08 N/A 17.5 17.5 2990 3200 0.000 0.000 2.000 0.130 7.800 6.600 0.044 0.033 0.000 0.669 2.438 2.117 YRWWTP
4-Feb-08 N/A 14.5 14.5 3110 3140 0.000 0.000 2.250 0.110 6.600 5.080 0.000 0.056 0.000 0.905 2.102 1.656 YRWWTP
11-Feb-08 N/A 14.5 14.5 2990 2980 0.100 6.000 3.070 0.090 5.400 4.185 0.422 0.033 2.007 1.508 1.812 1.400 YRWWTP
18-Feb-08 N/A 17.3 17.3 1860 1900 0.050 3.000 5.110 0.009 0.520 2.736 0.172 0.000 1.613 2.605 0.273 0.971 JRWWTP
25-Feb-08 N/A 16.2 16.2 1620 N/A 0.106 6.350 5.778 0.010 0.606 1.614 0.352 0.000 3.920 2.939 0.374 0.659 0.45 JRWWTP
3-Mar-08 N/A 14.9 15.5 1860 1900 0.170 10.200 5.320 0.009 0.557 0.643 0.559 0.011 5.484 2.941 0.293 0.360 JRWWTP
5-Mar-08 N/A 18.9 18.5 2000 1820 0.056 3.341 5.135 0.016 0.987 0.629 0.198 0.022 1.670 2.857 0.542 0.360 JRWWTP
6-Mar-08 N/A 16.8 16.8 1840 1740 0.062 3.710 4.629 0.009 0.548 0.704 0.209 0.011 2.016 2.449 0.315 0.374 JRWWTP
17-Mar-08 N/A N/A N/A 1740 1620 0.035 2.075 3.318 0.007 0.447 0.592 0.120 0.000 1.193 1.786 0.276 0.316 JRWWTP
7-Apr-08 N/A 17.7 17.5 2030 2200 0.064 3.820 3.404 0.016 0.980 0.545 0.223 0.037 1.882 1.938 0.445 0.291 JRWWTP
14-Apr-08 N/A 18.1 17.8 1680 1840 0.061 3.642 3.854 0.000 0.000 0.892 0.218 0.362 12.937 ------------ 0.095 0.163 5.315 ------------ 2.168 2.262 0.000 0.490 JRWWTP
21-Apr-08 N/A 20.8 20.7 1550 1800 0.063 3.770 3.946 0.013 0.750 1.482 0.216 0.418 16.189 ------------ 0.062 0.186 6.216 ------------ 2.432 2.364 0.417 0.904 JRWWTP
28-Apr-08 N/A 20.8 21.2 1640 1740 0.099 5.965 4.123 0.038 2.284 1.787 0.340 0.580 21.209 ------------ 0.082 0.317 10.918 ------------ 3.637 2.489 1.313 1.081 JRWWTP
13-May-08 N/A 18.6 18.4 1486 1448 0.042 2.531 4.579 0.057 3.397 2.007 0.154 0.311 12.568 ------------ 0.060 0.306 12.690 ------------ 1.703 2.589 2.346 1.173 JRWWTP
20-May-08 N/A 21.0 20.5 1880 1880 0.078 4.709 4.995 0.042 2.502 3.078 0.267 0.510 16.272 ------------ 0.054 0.196 6.265 ------------ 2.505 2.547 1.331 1.571 JRWWTP
17-Jun-08 N/A 21.5 21.3 2220 2400 0.099 5.920 4.760 0.018 1.103 3.169 0.388 0.571 15.422 ------------ 0.000 0.184 4.597 ------------ 2.667 2.404 0.460 1.454 JRWWTP
23-Jun-08 N/A 22.4 23.0 2630 2540 0.098 5.852 4.580 0.102 6.103 2.489 0.402 0.647 14.765 ------------ 0.000 0.243 5.746 ------------ 2.225 2.454 2.403 0.985 JRWWTP
7-Jul-08 N/A 26.4 26.7 1640 3740 0.080 4.788 3.795 0.046 2.737 1.989 0.308 0.556 20.350 ------------ 0.020 0.569 9.125 ------------ 2.919 2.062 0.73 0.719 JRWWTP
14-Jul-08 N/A 22.9 23.9 835 940 0.027 1.632 3.979 0.000 0.000 1.768 0.121 0.311 22.325 ------------ 0.037 0.314 20.058 ------------ 1.955 2.465 0.00 0.627 JRWWTP
21-Jul-08 N/A 26.5 26.3 1440 1710 0.0131 0.785 3.549 0.000 0.000 0.547 0.042 0.303 12.611 ------------ 0.048 0.302 10.598 ------------ 0.545 2.518 0.00 0.146 JRWWTP
28-Jul-08 N/A 27.6 26.8 1460 1080 0.114 6.837 5.317 0.000 0.000 0.000 0.391 0.438 18.020 ------------ 0.020 0.114 6.336 ------------ 4.683 3.033 0.000 0.000 JRWWTP
5-Aug-08 N/A 26.8 26.6 1490 1700 0.062 3.704 5.916 0.000 0.000 0.862 0.199 0.353 14.230 ------------ 0.000 0.281 9.925 ------------ 2.486 3.003 0.000 0.337 JRWWTP
18-Aug-08 N/A 26.8 26.2 2480 2660 0.227 13.627 7.189 0.000 0.000 1.657 0.731 0.554 13.396 ------------ 0.169 0.138 3.110 ------------ 5.495 3.338 0.000 0.575 JRWWTP
7-Oct-08 N/A 24.7 23.2 2560 2560 0.077 4.627 6.771 0.072 4.309 2.172 0.248 0.372 8.712 ------------ 0.064 0.274 6.419 ------------ 1.807 2.970 1.683 0.871 JRWWTP
13-Oct-08 N/A 24.9 23.9 3220 3340 0.119 7.150 6.648 0.066 3.976 2.690 0.384 0.510 9.500 ------------ 0.054 0.338 6.066 ------------ 2.221 2.832 1.191 1.162 JRWWTP
27-Oct-08 N/A 23.9 22.6 1670 1740 0.079 4.746 4.726 0.043 2.576 3.291 0.255 0.438 15.742 ------------ 0.054 0.350 12.077 ------------ 2.842 2.139 1.480 1.465 JRWWTP
28-Oct-08 N/A 22.4 21.6 1720 1780 0.051 3.090 4.246 0.043 2.589 2.430 0.166 0.344 12.000 ------------ 0.052 0.240 8.099 ------------ 1.796 1.903 1.45 1.129 JRWWTP
3-Nov-08 N/A 22.7 21.8 1980 1980 0.067 4.018 3.483 0.050 3.007 1.791 0.216 0.472 14.296 ------------ 0.037 0.323 9.795 ------------ 2.029 1.704 1.52 0.973 JRWWTP
10-Nov-08 N/A 21.2 20.6 3560 3660 0.037 2.226 3.096 0.000 0.000 1.402 0.119 0.618 10.422 ------------ 0.040 0.326 5.340 ------------ 0.625 1.428 0.00 0.750 JRWWTP
17-Nov-08 N/A 20.4 19.9 2720 1900 0.056 3.337 3.316 0.013 0.781 1.309 0.179 0.313 6.912 ------------ 0.033 0.276 8.717 ------------ 1.227 1.535 0.41 0.692 JRWWTP
24-Nov-08 N/A 20.4 19.5 1920 1740 0.047 2.811 3.186 0.011 0.633 0.963 0.151 0.394 12.308 ------------ 0.058 0.297 10.233 ------------ 1.464 1.471 0.36 0.503 JRWWTP
1-Dec-08 N/A 19.1 18.9 1800 1820 0.070 4.191 3.433 0.035 2.126 0.963 0.225 0.438 14.593 ------------ 0.039 0.339 11.176 ------------ 2.328 1.653 1.17 0.503 JRWWTP
8-Dec-08 N/A 17.5 16.9 1970 2240 0.056 3.367 3.622 0.021 1.278 1.013 0.181 0.412 12.535 ------------ 0.021 0.309 8.281 ------------ 1.709 1.586 0.570 0.469 JRWWTP
15-Dec-08 N/A 18.5 18.9 2250 2280 0.058 3.461 3.444 0.000 0.000 0.886 0.186 0.380 10.125 ------------ 0.043 0.288 7.579 ------------ 1.538 1.447 0.000 0.396 JRWWTP
22-Dec-08 N/A 17.7 17.3 4800 4260 0.071 4.282 3.171 0.017 1.027 0.461 0.230 0.365 4.568 ------------ 0.021 0.157 2.205 ------------ 0.892 1.229 0.241 0.162 JRWWTP
29-Dec-08 N/A 17.9 17.7 2500 2520 0.032 1.921 3.355 0.000 0.000 0.318 0.103 0.412 9.896 ------------ 0.029 0.315 7.512 ------------ 0.768 1.220 0.000 0.093 JRWWTP
12-Jan-09 N/A 17.3 17.6 2280 2360 0.047 2.826 3.260 0.000 0.000 0.433 0.152 0.303 7.964 ------------ 0.026 0.228 5.809 ------------ 1.239 1.110 0.000 0.131 JRWWTP
19-Jan-09 N/A 16.3 16.3 2580 2500 0.071 4.285 3.004 0.009 0.563 0.284 0.230 0.394 9.156 ------------ 0.000 0.357 8.578 ------------ 1.661 1.165 0.225 0.104 JRWWTP
26-Jan-09 N/A 15.6 15.8 3010 3020 0.050 2.985 3.365 0.010 0.573 0.379 0.160 0.442 8.808 ------------ 0.028 0.353 7.017 ------------ 0.992 1.297 0.190 0.138 JRWWTP
Reactor 1: Control Mixed Liquor - JR or YR
Table 8-2. IFAS Mixed Liquor Results
Date
IFAS Avg. AOB Reactor Avg. NOB Reactor AOB MLSS NOB MLSS AOB NOx slope AOB NOx slope 5 pt rolling ave. AOB NOx slope NOB NO3 slope NOB NO3 slope 5 pt rolling ave. NOB NO3 slope Predicted AOB OUR Measured AOB OUR Measured AOB SOUR Measured AOB SOUR Predicted NOB OUR Measured NOB OUR Measured NOB SOUR Measured NOB SOUR AOB Nit Rate NOx* 5 pt rolling ave. AOB Nit Rate NOx* NOB Nit Rate NO3* 5 pt rolling ave. NOB Nit Rate NO3* P
Temperature (°C) Temperature (°C) Temperature (°C) mg/L mg/L mg/L/min mg/L/hr mg/L/min mg/L/min mg/L/hr mg/L/min mg/L/min mg/L/min mg O2/g MLSS/hr g/m2/day mg/L/min mg/L/min mg O2/g MLSS/hr g/m2/day mg/g MLSS/hr mg/g MLSS/hr mg/g MLSS/hr mg/g MLSS/hr mg/L P
28-Jan-08 17.3 17.5 17.5 2540 2780 0.080 4.800 4.600 0.030 1.800 2.200 0.291 0.033 1.890 1.495 0.647 0.681
4-Feb-08 14.5 14.5 14.5 3000 3520 0.050 3.000 5.250 0.050 3.000 1.650 0.183 0.056 1.000 1.755 0.852 0.510
11-Feb-08 14.5 14.5 14.5 3760 3320 0.100 6.000 5.176 0.030 1.800 1.320 0.366 0.033 1.596 1.709 0.542 0.408
18-Feb-08 17.2 17.3 17.3 2840 3220 0.120 7.200 5.656 0.000 0.000 1.080 0.453 0.000 2.535 1.952 0.000 0.329
25-Feb-08 16.4 16.2 16.5 3200 2100 0.081 4.879 6.097 0.000 0.000 0.720 0.302 0.000 1.525 2.186 0.000 0.268 0.80
3-Mar-08 15.5 15.1 15.8 2320 2380 0.120 7.200 5.477 0.010 0.600 0.480 0.431 0.011 3.103 2.159 0.252 0.217
5-Mar-08 18.6 19.0 18.7 2400 2200 0.087 5.208 4.474 0.020 1.200 0.480 0.322 0.022 2.170 1.871 0.545 0.217
6-Mar-08 16.9 17.0 17.1 1980 2100 0.048 2.898 4.192 0.010 0.600 0.884 0.179 0.011 1.464 1.935 0.286 0.449
17-Mar-08 17.8 N/A N/A 2000 1760 0.036 2.187 3.632 0.000 0.000 1.786 0.152 0.000 1.093 1.768 0.000 0.973
7-Apr-08 18.8 17.8 17.5 1880 1740 0.058 3.470 3.748 0.034 2.019 2.214 0.259 0.037 1.846 1.837 1.160 1.191
14-Apr-08 19.5 18.3 18.0 1940 1780 0.073 4.400 4.013 0.085 5.110 2.980 0.321 0.391 12.084 ------------ 0.095 0.178 5.988 ------------ 2.268 1.899 2.871 1.581
21-Apr-08 20.3 20.9 20.9 2300 2040 0.096 5.788 4.172 0.056 3.339 3.624 0.404 0.628 16.384 ------------ 0.062 0.263 7.722 ------------ 2.516 2.006 1.637 1.902
28-Apr-08 20.8 21.0 21.4 2380 1980 0.070 4.221 4.182 0.074 4.432 3.800 0.284 0.434 10.946 ------------ 0.082 0.221 6.689 ------------ 1.774 1.989 2.238 1.960
13-May-08 21.0 18.7 18.8 1831 2009 0.050 2.979 3.663 0.054 3.220 2.778 0.212 0.312 10.215 ------------ 0.060 0.170 5.069 ------------ 1.627 1.790 1.603 1.385
20-May-08 22.0 21.2 20.9 2000 2000 0.059 3.521 2.974 0.048 2.898 2.110 0.245 0.375 11.242 ------------ 0.054 0.226 6.772 ------------ 1.761 1.492 1.449 1.058
17-Jun-08 26.1 21.8 21.8 1420 1860 0.030 1.804 2.494 0.000 0.000 1.436 0.117 0.708 29.913 ------------ 0.000 0.129 4.167 ------------ 1.271 1.296 0.000 0.672
23-Jun-08 26.5 22.5 23.5 2280 2180 0.039 2.345 2.585 0.000 0.000 1.193 0.166 0.227 5.969 ------------ 0.000 0.185 5.093 ------------ 1.029 1.169 0.000 0.451
7-Jul-08 25.4 26.5 26.8 2300 3440 0.030 1.820 2.625 0.018 1.060 1.135 0.112 0.224 5.851 ------------ 0.020 0.137 2.392 ------------ 0.791 1.211 0.308 0.374
14-Jul-08 26.3 23.6 24.2 3460 4020 0.057 3.435 5.252 0.033 2.007 1.348 0.226 0.302 5.239 ------------ 0.037 0.135 2.021 ------------ 0.993 1.505 0.499 0.412
21-Jul-08 27.6 26.7 26.6 1890 2460 0.062 3.722 7.646 0.043 2.609 1.348 0.354 0.499 15.836 ------------ 0.048 0.244 5.962 ------------ 1.969 2.314 1.061 0.412
28-Jul-08 27.6 28.0 26.9 5450 5540 0.249 14.938 11.815 0.018 1.065 2.964 0.878 0.871 9.592 ------------ 0.020 0.392 4.250 ------------ 2.741 2.843 0.192 0.628
5-Aug-08 27.8 27.2 26.9 2820 4100 0.239 14.316 12.164 0.000 0.000 3.258 0.768 0.699 14.870 ------------ 0.000 0.335 4.907 ------------ 5.077 2.940 0.000 0.727
18-Aug-08 27.3 26.9 26.2 6600 6590 0.378 22.665 12.443 0.152 9.138 3.322 1.216 1.378 12.531 ------------ 0.169 0.319 2.908 ------------ 3.434 2.870 1.387 0.731
7-Oct-08 25.1 24.7 23.6 3500 3500 0.086 5.182 10.438 0.058 3.476 3.694 0.278 0.519 8.899 ------------ 0.064 0.255 4.377 ------------ 1.480 2.767 0.993 0.947
13-Oct-08 25.3 24.8 23.8 3160 2700 0.085 5.116 8.610 0.049 2.929 4.259 0.275 0.587 11.141 ------------ 0.054 0.259 5.761 ------------ 1.619 2.179 1.085 1.189
27-Oct-08 23.7 23.8 22.6 2210 2300 0.082 4.913 4.715 0.049 2.926 2.826 0.264 0.512 13.898 ------------ 0.054 0.230 5.989 ------------ 2.223 1.867 1.272 1.147
28-Oct-08 22.9 22.1 21.5 2420 2340 0.086 5.174 3.972 0.047 2.825 2.567 0.278 0.449 11.143 ------------ 0.052 0.390 10.011 ------------ 2.138 1.718 1.207 1.211
3-Nov-08 22.4 22.6 22.0 1700 1680 0.053 3.190 3.505 0.033 1.976 2.339 0.171 0.375 13.251 ------------ 0.037 0.153 5.469 ------------ 1.876 1.596 1.176 1.164
10-Nov-08 22 21.1 21.0 2000 1660 0.024 1.466 3.145 0.036 2.181 2.376 0.079 0.330 9.900 ------------ 0.040 0.146 5.270 ------------ 0.733 1.424 1.314 1.217
17-Nov-08 21.2 20.3 20.3 2760 2100 0.046 2.782 2.658 0.030 1.785 2.229 0.149 0.293 6.380 ------------ 0.033 0.174 4.957 ------------ 1.008 1.248 0.850 1.174
24-Nov-08 19.9 20.3 19.8 2280 2020 0.052 3.113 2.480 0.052 3.111 2.065 0.167 0.427 11.235 ------------ 0.058 0.191 5.660 ------------ 1.366 1.067 1.540 1.032
1-Dec-08 19 19.2 19.1 2180 2120 0.046 2.739 2.746 0.035 2.093 2.094 0.147 0.358 9.852 ------------ 0.039 0.172 4.880 ------------ 1.256 1.148 0.987 0.950
8-Dec-08 18.2 17.5 17.5 2360 2460 0.038 2.300 2.801 0.019 1.153 1.962 0.123 0.328 8.348 ------------ 0.021 0.134 3.275 ------------ 0.975 1.129 0.469 0.881
15-Dec-08 18.5 18.5 19.1 2460 2580 0.047 2.794 2.562 0.039 2.329 1.652 0.150 0.391 9.526 ------------ 0.043 0.283 6.573 ------------ 1.136 1.049 0.903 0.719
22-Dec-08 17.5 17.6 17.4 3340 2220 0.051 3.057 2.621 0.019 1.126 1.515 0.164 0.291 5.235 ------------ 0.021 0.157 4.232 ------------ 0.915 1.082 0.507 0.654
29-Dec-08 18.2 18.0 17.9 1990 2140 0.032 1.921 2.909 0.026 1.560 1.284 0.103 0.230 6.942 ------------ 0.029 0.093 2.610 ------------ 0.965 1.177 0.729 0.561
12-Jan-09 17 17.4 17.7 2140 2120 0.051 3.033 2.937 0.023 1.407 1.117 0.163 0.253 7.090 ------------ 0.026 0.155 4.387 ------------ 1.417 1.132 0.664 0.498
19-Jan-09 16 16.1 16.2 2580 1648 0.062 3.739 2.898 0 0.000 1.114 0.201 0.272 6.332 ------------ 0.000 0.139 5.075 ------------ 1.449 1.186 0.000 0.496
26-Jan-09 15.2 15.4 15.7 2440 2520 0.037 3.386 0.025 1.490 0.966 0.119 0.299 7.364 ------------ 0.028 0.163 3.873 ------------ 0.911 1.259 0.591 0.418
Reactor 2: JR IFAS Mixed Liquor Only
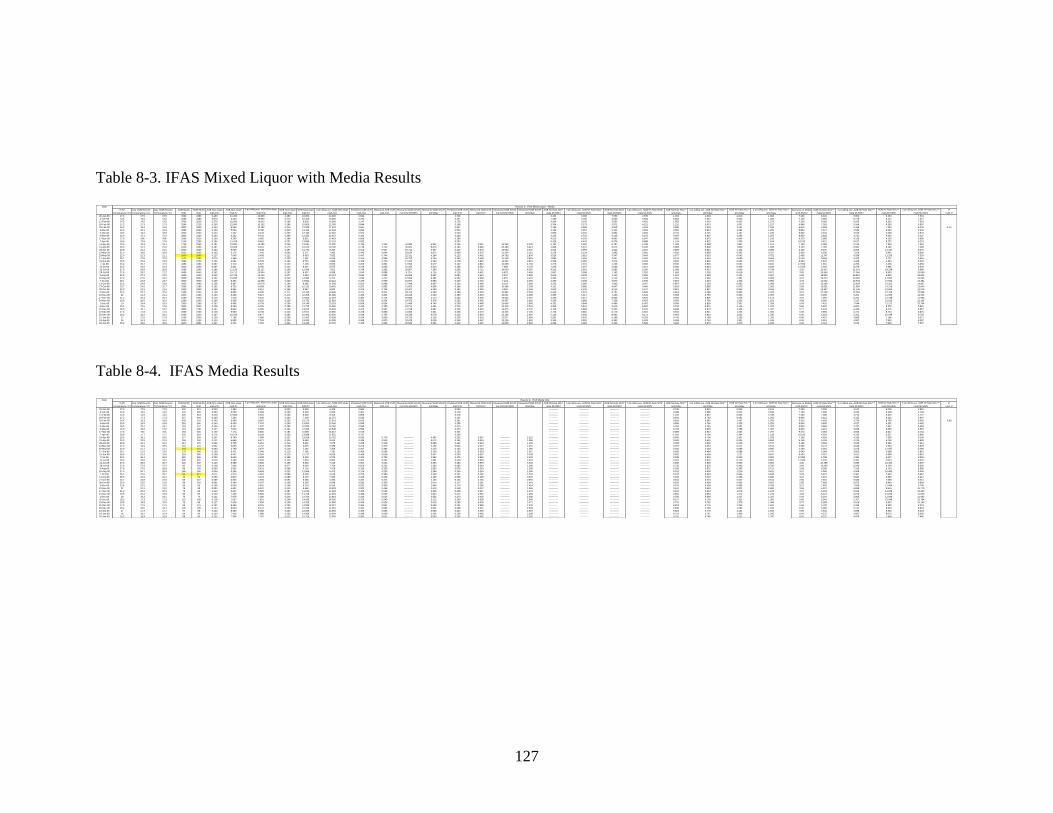
127
Table 8-3. IFAS Mixed Liquor with Media Results
Date
IFAS Avg. AOB Reactor Avg. NOB Reactor AOB MLSS NOB MLSS AOB NOx slope AOB NOx slope 5 pt rolling ave. AOB NOx slope NOB NO3 slope NOB NO3 slope 5 pt rolling ave. NOB NO3 slope Predicted AOB OUR Measured AOB OUR Measured AOB SOUR Measured AOB SOUR Predicted NOB OUR Measured NOB OUR Measured NOB SOUR Measured NOB SOUR AOB Nit Rate NOx* 5 pt rolling ave. AOB Nit Rate NOx* NOB Nit Rate NO3* 5 pt rolling ave. NOB Nit Rate NO3* AOB Nit Rate NOx** 5 pt rolling ave. AOB Nit Rate NOx** NOB Nit Rate NO3** 5 pt rolling ave. NOB Nit Rate NO3** Biomass on Media AOB Nit Rate NOx*** 5 pt rolling ave. AOB Nit Rate NOx*** NOB Nit Rate NO3*** 5 pt rolling ave. NOB Nit Rate NO3*** P
Temperature (°C) Temperature (°C) Temperature (°C) mg/L mg/L mg/L/min mg/L/hr mg/L/min mg/L/min mg/L/hr mg/L/min mg/L/min mg/L/min mg O2/g MLSS/hr g/m2/day mg/L/min mg/L/min mg O2/g MLSS/hr g/m2/day mg/g MLSS/hr mg/g MLSS/hr mg/g MLSS/hr mg/g MLSS/hr g/m2/day g/m2/day g/m2/day g/m2/day g MLSS/m2 mg/g MLSS/hr mg/g MLSS/hr mg/g MLSS/hr mg/g MLSS/hr mg/L P
28-Jan-08 17.3 17.5 17.5 3320 2380 0.190 11.400 10.600 0.280 16.800 14.200 0.812 0.308 3.434 3.008 7.059 4.789 1.094 1.018 1.613 1.363 7.200 6.333 5.900 9.333 7.931
4-Feb-08 14.5 14.5 14.5 3280 3480 0.070 4.200 10.950 0.270 16.200 13.350 0.292 0.297 1.280 3.182 4.655 4.584 0.403 1.051 1.555 1.282 7.100 2.366 6.179 9.127 7.527
11-Feb-08 14.5 14.5 14.5 3760 3620 0.270 16.200 10.612 0.160 9.600 13.266 1.147 0.176 4.309 3.103 2.652 4.451 1.555 1.019 0.922 1.273 7.200 9.000 6.015 5.333 7.519
18-Feb-08 17.2 17.3 17.3 3240 2720 0.200 12.000 10.132 0.180 10.800 12.786 0.844 0.198 3.704 3.173 3.971 4.122 1.152 0.973 1.037 1.227 6.840 7.018 5.564 6.316 6.957
25-Feb-08 16.4 16.3 16.6 3320 3300 0.154 9.258 10.782 0.215 12.928 11.978 0.667 0.237 2.789 3.490 3.918 4.164 0.889 1.035 1.241 1.150 6.910 5.359 5.766 7.484 6.233 0.70
3-Mar-08 15.5 15.1 15.9 2380 2660 0.150 9.000 8.786 0.240 14.400 12.548 0.650 0.264 3.782 3.057 5.414 4.662 0.864 0.843 1.382 1.205 8.830 4.077 4.530 6.523 6.294
5-Mar-08 18.6 19.2 18.8 2600 2500 0.124 7.452 8.244 0.203 12.160 12.352 0.524 0.223 2.866 3.218 4.864 4.840 0.715 0.791 1.167 1.186 8.830 3.376 3.919 5.508 5.870
6-Mar-08 16.9 17.1 17.2 2900 2420 0.104 6.222 8.716 0.208 12.451 12.537 0.444 0.228 2.145 3.746 5.145 5.272 0.597 0.837 1.195 1.204 8.830 2.818 3.731 5.640 5.427
17-Mar-08 17.8 N/A N/A 2060 2020 0.155 9.290 9.092 0.164 9.821 12.453 0.658 0.180 4.510 4.226 4.862 5.547 0.892 0.873 0.943 1.196 9.370 3.966 4.135 4.193 5.689
7-Apr-08 18.8 17.8 17.6 2140 2280 0.194 11.615 9.602 0.231 13.853 12.124 0.832 0.254 5.428 4.447 6.076 5.888 1.115 0.922 1.330 1.164 10.510 4.421 5.017 5.272 6.224
14-Apr-08 19.5 18.3 18.1 1760 2060 0.181 10.881 10.085 0.233 13.981 11.992 0.784 1.205 41.080 6.941 0.256 0.561 16.334 3.230 6.182 4.630 6.787 5.788 1.045 0.968 1.342 1.151 7.140 6.096 6.114 7.833 7.363
21-Apr-08 20.3 21.1 21.0 2520 1600 0.167 10.000 9.461 0.175 10.514 10.782 0.716 1.714 40.821 9.875 0.193 0.680 25.483 3.914 3.968 4.374 6.572 5.192 0.960 0.908 1.009 1.035 5.140 7.782 6.587 8.182 7.298
28-Apr-08 20.8 21.2 21.5 2820 2540 0.144 8.639 8.548 0.197 11.791 9.350 0.616 0.927 19.714 5.337 0.216 0.574 13.564 3.307 3.064 3.993 4.642 4.647 0.829 0.821 1.132 0.898 4.160 8.307 8.052 11.337 8.475
13-May-08 21.0 18.8 18.9 1911 2000 0.103 6.170 7.245 0.063 3.771 7.992 0.445 0.846 26.554 4.872 0.069 0.375 11.254 2.161 3.228 3.134 1.885 3.981 0.592 0.696 0.362 0.767 3.900 6.328 7.526 3.867 8.050
20-May-08 22.0 21.3 21.1 2000 2000 0.117 7.048 6.458 0.112 6.693 7.832 0.497 0.744 22.311 4.284 0.123 0.492 14.763 2.834 3.524 2.813 3.347 3.469 0.677 0.620 0.643 0.752 2.400 11.747 6.538 11.155 7.324
17-Jun-08 26.1 21.8 22.0 2320 2080 0.073 4.369 5.772 0.120 7.191 6.915 0.315 0.996 25.752 5.735 0.132 0.490 14.148 2.825 1.883 2.456 3.457 2.994 0.419 0.554 0.690 0.664 5.040 3.468 5.209 5.707 5.516
23-Jun-08 26.5 22.6 23.5 2560 2420 0.101 6.061 5.705 0.162 9.715 7.886 0.438 0.740 17.341 4.262 0.178 0.662 16.402 3.810 2.368 2.052 4.014 3.018 0.582 0.548 0.933 0.757 8.533 2.841 4.348 4.554 5.342
7-Jul-08 25.4 26.7 27.0 4080 3180 0.087 5.213 6.522 0.120 7.205 8.826 0.369 0.881 12.950 5.072 0.132 0.832 15.699 4.793 1.278 2.210 2.266 3.366 0.500 0.626 0.692 0.847 12.550 1.661 4.782 2.296 5.958
14-Jul-08 26.3 23.5 24.3 4840 4300 0.097 5.831 8.790 0.144 8.627 8.675 0.418 0.835 10.352 4.810 0.158 0.552 7.698 3.178 1.205 2.407 2.006 2.911 0.560 0.844 0.828 0.833 11.520 2.025 8.279 2.995 6.533
21-Jul-08 27.6 26.8 26.8 2580 2240 0.186 11.133 10.127 0.190 11.390 7.651 0.798 1.282 29.807 7.383 0.209 0.711 19.053 4.097 4.315 2.661 5.085 2.330 1.069 0.972 1.093 0.734 3.20 13.917 11.501 14.238 6.989
28-Jul-08 27.6 28.2 27.2 5480 5440 0.262 15.712 13.904 0.107 6.437 9.088 1.045 0.888 9.724 5.116 0.118 0.601 6.623 3.459 2.867 3.098 1.183 2.320 1.508 1.335 0.618 0.872 3.00 20.949 17.064 8.583 10.050
5-Aug-08 27.8 27.3 27.0 3500 4140 0.212 12.746 14.410 0.077 4.594 10.074 0.684 0.989 16.956 5.697 0.084 0.624 9.047 3.596 3.642 3.335 1.110 2.693 1.224 1.383 0.441 0.967 2.69 18.953 18.867 6.832 13.031
18-Aug-08 27.3 27.0 26.4 6960 6500 0.402 24.095 14.053 0.240 14.390 9.473 1.293 1.472 12.693 8.481 0.264 0.538 4.970 3.101 3.462 3.117 2.214 2.243 2.313 1.349 1.381 0.909 3.27 29.474 18.392 17.602 12.254
7-Oct-08 25.1 24.8 23.7 3500 3500 0.139 8.364 12.856 0.226 13.561 10.212 0.449 0.969 16.607 5.580 0.249 0.416 7.123 2.393 2.390 3.368 3.874 2.936 0.803 1.234 1.302 0.980 3.03 11.042 16.932 17.902 13.381
13-Oct-08 25.3 24.9 23.9 2900 2960 0.156 9.347 12.079 0.140 8.385 11.283 0.502 0.868 17.949 4.997 0.154 0.400 8.116 2.306 3.223 3.360 2.833 3.557 0.897 1.160 0.805 1.083 3.24 11.540 15.629 10.352 14.807
27-Oct-08 23.7 24.0 22.7 2360 2180 0.162 9.726 9.039 0.169 10.131 10.451 0.522 0.852 21.652 4.905 0.186 0.389 10.698 2.239 4.121 3.956 4.647 4.460 0.934 0.868 0.973 1.003 2.85 13.651 11.954 14.218 13.840
28-Oct-08 22.9 22.2 21.6 2460 2360 0.148 8.861 8.611 0.166 9.947 9.800 0.476 0.796 19.407 4.583 0.182 0.390 9.926 2.249 3.602 4.155 4.215 5.137 0.851 0.827 0.955 0.941 2.85 12.437 11.145 13.960 12.576
3-Nov-08 22.4 22.7 22.0 1380 1520 0.148 8.894 8.185 0.171 10.230 10.656 0.477 0.914 39.725 5.263 0.188 0.405 15.992 2.334 6.445 4.370 6.731 5.903 0.854 0.786 0.982 1.023 3.21 11.100 10.255 12.768 12.995
10-Nov-08 22 21.3 21.1 1840 1420 0.104 6.228 8.227 0.172 10.309 11.380 0.334 0.804 26.226 4.633 0.189 0.394 16.641 2.268 3.385 4.417 7.260 6.422 0.598 0.790 0.990 1.093 3.56 6.998 9.261 11.583 12.554
17-Nov-08 21.2 20.3 20.4 1680 1900 0.120 7.216 8.342 0.211 12.664 12.219 0.387 0.725 25.883 4.174 0.232 0.432 13.634 2.487 4.295 4.517 6.665 6.876 0.693 0.801 1.216 1.173 4.07 7.092 8.257 12.446 11.984
24-Nov-08 19.9 20.5 20.0 2280 1900 0.166 9.938 8.216 0.229 13.752 12.518 0.533 0.934 24.572 5.378 0.252 0.462 14.597 2.662 4.359 3.889 7.238 6.453 0.954 0.789 1.320 1.202 4.58 8.680 7.217 12.010 11.105
1-Dec-08 19 19.4 19.3 2300 2180 0.157 9.436 8.739 0.236 14.140 13.219 0.506 0.824 21.489 4.745 0.259 0.496 13.658 2.858 4.102 3.844 6.486 6.002 0.906 0.839 1.357 1.269 5.09 7.415 7.044 11.112 10.704
8-Dec-08 18.2 17.6 17.6 2500 2540 0.138 8.263 9.076 0.195 11.725 13.280 0.443 0.780 18.711 4.491 0.215 0.437 10.319 2.516 3.305 3.531 4.616 5.904 0.793 0.871 1.126 1.275 5.60 5.902 6.824 8.375 9.961
15-Dec-08 18.5 18.7 19.2 2800 2760 0.147 8.842 9.095 0.230 13.813 13.928 0.475 0.987 21.158 5.687 0.253 0.620 13.475 3.570 3.158 3.683 5.005 6.075 0.849 0.873 1.326 1.337 5.77 6.129 6.333 9.576 9.667
22-Dec-08 17.5 17.8 17.6 3260 2100 0.148 8.900 8.759 0.216 12.971 13.590 0.478 0.808 14.862 4.651 0.238 0.470 13.425 2.706 2.730 3.581 6.176 5.815 0.854 0.841 1.245 1.305 5.94 5.994 5.741 8.734 8.876
29-Dec-08 18.2 18.2 18.1 1960 2100 0.167 10.033 8.477 0.283 16.992 13.956 0.538 0.795 24.330 4.578 0.312 0.460 13.146 2.650 5.119 3.592 8.091 6.171 0.963 0.814 1.631 1.340 6.45 6.222 5.351 10.538 8.763
12-Jan-09 17 17.5 17.9 2160 2400 0.129 7.756 7.996 0.208 12.452 13.838 0.416 0.890 24.720 5.126 0.228 0.519 12.977 2.990 3.591 3.420 5.188 6.203 0.745 0.768 1.195 1.328 6.96 4.457 4.869 7.156 8.377
19-Jan-09 16 16.3 16.4 2040 2120 0.114 6.855 7.769 0.226 13.550 14.055 0.368 0.873 25.675 5.028 0.248 0.467 13.228 2.692 3.360 3.592 6.392 6.209 0.658 0.746 1.301 1.349 6.94 3.951 4.587 7.810 8.287
26-Jan-09 15.2 15.6 15.9 2800 2560 0.107 6.434 7.015 0.220 13.225 13.076 0.345 0.959 20.540 5.521 0.242 0.497 11.648 2.863 2.298 3.083 5.166 5.582 0.618 0.673 1.270 1.255 6.92 3.719 4.042 7.645 7.537
Reactor 3: IFAS Mixed Liquor + Media
Table 8-4. IFAS Media Results
Date
IFAS Avg. AOB Reactor Avg. NOB Reactor AOB MLSS NOB MLSS AOB NOx slope AOB NOx slope 5 pt rolling ave. AOB NOx slope NOB NO3 slope NOB NO3 slope 5 pt rolling ave. NOB NO3 slope Predicted AOB OUR Measured AOB OUR Measured AOB SOUR Measured AOB SOUR Predicted NOB OUR Measured NOB OUR Measured NOB SOUR Measured NOB SOUR AOB Nit Rate NOx* 5 pt rolling ave. AOB Nit Rate NOx* NOB Nit Rate NO3* 5 pt rolling ave. NOB Nit Rate NO3* AOB Nit Rate NOx** 5 pt rolling ave. AOB Nit Rate NOx** NOB Nit Rate NO3** 5 pt rolling ave. NOB Nit Rate NO3** Biomass on Media AOB Nit Rate NOx*** 5 pt rolling ave. AOB Nit Rate NOx*** NOB Nit Rate NO3*** 5 pt rolling ave. NOB Nit Rate NO3*** P
Temperature (°C) Temperature (°C) Temperature (°C) mg/L mg/L mg/L/min mg/L/hr mg/L/min mg/L/min mg/L/hr mg/L/min mg/L/min mg/L/min mg O2/g MLSS/hr g/m2/day mg/L/min mg/L/min mg O2/g MLSS/hr g/m2/day mg/g MLSS/hr mg/g MLSS/hr mg/g MLSS/hr mg/g MLSS/hr g/m2/day g/m2/day g/m2/day g/m2/day g MLSS/m2 mg/g MLSS/hr mg/g MLSS/hr mg/g MLSS/hr mg/g MLSS/hr mg/L P
28-Jan-08 17.3 17.5 17.5 340 212 0.023 1.354 5.651 0.000 0.000 6.400 0.084 0.000 ------------ ------------ ------------ ------------ 0.130 0.543 0.000 0.614 7.200 0.752 3.147 0.000 3.581
4-Feb-08 14.5 14.5 14.5 224 345 0.050 3.000 6.038 0.160 9.600 6.600 0.461 0.178 ------------ ------------ ------------ ------------ 0.288 0.580 0.922 0.634 7.100 1.690 3.413 5.408 3.738
11-Feb-08 14.5 14.5 14.5 226 343 0.210 12.600 6.531 0.160 9.600 8.315 0.909 0.178 ------------ ------------ ------------ ------------ 1.210 0.627 0.922 0.798 7.200 7.000 3.715 5.333 4.747
18-Feb-08 17.2 17.3 17.3 257 194 0.120 7.200 7.940 0.120 7.200 11.075 0.520 0.133 ------------ ------------ ------------ ------------ 0.691 0.762 0.691 1.063 6.840 4.211 4.325 4.211 5.997
25-Feb-08 16.4 16.3 16.6 240 143 0.142 8.499 8.967 0.253 15.173 12.553 0.613 0.281 ------------ ------------ ------------ ------------ 0.816 0.861 1.457 1.205 6.910 4.920 4.724 8.783 6.455 0.90
3-Mar-08 15.5 14.9 15.8 252 260 0.140 8.400 7.975 0.230 13.800 13.046 0.595 0.255 ------------ ------------ ------------ ------------ 0.806 0.766 1.325 1.252 8.830 3.805 4.017 6.251 6.482
5-Mar-08 18.6 19.1 18.7 104 147 0.136 8.137 7.970 0.283 16.992 13.784 0.586 0.314 ------------ ------------ ------------ ------------ 0.781 0.765 1.631 1.323 8.830 3.686 3.787 7.697 6.569
6-Mar-08 16.9 16.8 17.0 173 169 0.127 7.640 8.385 0.201 12.066 13.548 0.550 0.223 ------------ ------------ ------------ ------------ 0.733 0.805 1.158 1.301 8.830 3.461 3.608 5.466 5.878
17-Mar-08 17.8 N/A N/A 194 246 0.120 7.174 8.465 0.181 10.887 13.512 0.515 0.201 ------------ ------------ ------------ ------------ 0.689 0.813 1.045 1.297 9.370 3.063 3.833 4.647 6.154
7-Apr-08 18.8 17.7 17.7 220 264 0.176 10.574 8.169 0.233 13.998 11.851 0.757 0.259 ------------ ------------ ------------ ------------ 1.015 0.784 1.344 1.138 10.510 4.024 4.132 5.327 5.966
14-Apr-08 19.5 18.1 18.0 177 246 0.147 8.799 7.386 0.227 13.619 10.762 0.633 0.779 ------------ 4.487 0.252 0.367 ------------ 2.115 ------------ ------------ ------------ ------------ 0.845 0.709 1.307 1.033 7.140 4.929 4.156 7.630 6.146
21-Apr-08 20.3 20.9 21.0 158 240 0.111 6.660 6.571 0.145 8.684 9.045 0.483 0.533 ------------ 3.072 0.161 0.345 ------------ 1.986 ------------ ------------ ------------ ------------ 0.639 0.631 0.834 0.868 5.140 5.183 4.179 6.758 5.689
28-Apr-08 20.8 21.1 21.4 114 170 0.062 3.725 5.210 0.110 6.621 7.678 0.268 0.449 ------------ 2.588 0.122 0.243 ------------ 1.402 ------------ ------------ ------------ ------------ 0.358 0.500 0.636 0.737 4.160 3.582 4.630 6.366 7.011
13-May-08 21.0 18.4 18.5 116 101 0.052 3.095 4.712 0.038 2.305 6.388 0.223 0.376 ------------ 2.168 0.043 0.227 ------------ 1.307 ------------ ------------ ------------ ------------ 0.297 0.452 0.221 0.613 3.900 3.175 4.646 2.364 6.623
20-May-08 22.0 21.1 21.1 143 121 0.063 3.769 4.672 0.119 7.162 7.206 0.267 0.384 ------------ 2.215 0.133 0.184 ------------ 1.060 ------------ ------------ ------------ ------------ 0.362 0.448 0.688 0.692 2.400 6.281 4.215 11.937 6.469
17-Jun-08 26.1 21.5 22.0 170 140 0.105 6.311 5.046 0.119 7.166 7.781 0.456 0.566 ------------ 3.259 0.133 0.333 ------------ 1.915 ------------ ------------ ------------ ------------ 0.606 0.484 0.688 0.747 5.040 5.009 3.855 5.688 5.801
23-Jun-08 26.5 22.4 24.0 253 280 0.108 6.457 5.264 0.213 12.777 8.826 0.466 0.616 ------------ 3.547 0.236 0.557 ------------ 3.209 ------------ ------------ ------------ ------------ 0.620 0.505 1.227 0.847 8.533 3.027 3.511 5.990 5.851
7-Jul-08 25.4 26.4 26.9 384 290 0.093 5.600 6.188 0.158 9.496 9.372 0.403 0.792 ------------ 4.562 0.176 0.545 ------------ 3.139 ------------ ------------ ------------ ------------ 0.538 0.594 0.912 0.900 12.550 1.785 4.351 3.027 5.936
14-Jul-08 26.3 23.0 24.2 280 325 0.070 4.182 6.456 0.125 7.526 8.862 0.304 0.462 ------------ 2.661 0.139 0.353 ------------ 2.034 ------------ ------------ ------------ ------------ 0.401 0.620 0.723 0.851 11.520 1.452 5.391 2.613 6.031
21-Jul-08 27.6 26.6 26.7 122 102 0.140 8.388 5.885 0.165 9.892 7.130 0.604 0.641 ------------ 3.694 0.183 0.578 ------------ 3.332 ------------ ------------ ------------ ------------ 0.805 0.565 0.950 0.684 3.20 10.485 5.856 12.364 6.057
28-Jul-08 27.6 27.9 27.2 82 114 0.128 7.654 5.414 0.077 4.619 7.764 0.550 0.231 ------------ 1.330 0.085 0.242 ------------ 1.396 ------------ ------------ ------------ ------------ 0.735 0.520 0.443 0.745 3.00 10.205 6.293 6.159 8.550
5-Aug-08 27.8 27.0 26.8 96 105 0.060 3.602 5.431 0.069 4.116 7.416 0.193 0.330 ------------ 1.902 0.076 0.243 ------------ 1.399 ------------ ------------ ------------ ------------ 0.346 0.521 0.395 0.712 2.69 5.356 7.130 6.120 9.556
18-Aug-08 27.3 26.7 26.4 145 140 0.054 3.245 4.463 0.211 12.664 6.472 0.174 0.223 ------------ 1.284 0.234 0.216 ------------ 1.246 ------------ ------------ ------------ ------------ 0.312 0.428 1.216 0.621 3.27 3.969 5.908 15.492 8.359
7-Oct-08 25.1 24.6 23.7 94 117 0.071 4.270 4.001 0.096 5.789 6.645 0.229 0.383 ------------ 2.208 0.107 0.192 ------------ 1.104 ------------ ------------ ------------ ------------ 0.410 0.384 0.556 0.638 3.03 5.637 5.367 7.642 8.667
13-Oct-08 25.3 24.6 24.1 43 93 0.059 3.543 4.373 0.086 5.170 7.083 0.190 0.248 ------------ 1.428 0.096 0.165 ------------ 0.949 ------------ ------------ ------------ ------------ 0.340 0.420 0.496 0.680 3.24 4.374 5.830 6.382 9.213
27-Oct-08 23.7 23.8 22.8 69 107 0.089 5.345 4.925 0.091 5.485 6.393 0.287 0.374 ------------ 2.153 0.101 0.165 ------------ 0.950 ------------ ------------ ------------ ------------ 0.513 0.473 0.527 0.614 2.85 7.501 6.535 7.698 8.414
28-Oct-08 22.9 22.0 21.8 59 116 0.091 5.464 5.197 0.105 6.305 6.946 0.293 0.350 ------------ 2.014 0.117 0.181 ------------ 1.041 ------------ ------------ ------------ ------------ 0.525 0.499 0.605 0.667 2.85 7.669 6.673 8.849 8.809
3-Nov-08 22.4 22.5 22.0 50 65 0.100 6.003 5.810 0.154 9.214 8.159 0.322 0.459 ------------ 2.646 0.170 0.245 ------------ 1.414 ------------ ------------ ------------ ------------ 0.576 0.558 0.885 0.783 3.21 7.492 7.096 11.499 9.740
10-Nov-08 22 21.1 21.0 79 58 0.094 5.631 6.187 0.143 8.559 10.003 0.302 0.465 ------------ 2.679 0.158 0.237 ------------ 1.365 ------------ ------------ ------------ ------------ 0.541 0.594 0.822 0.960 3.56 6.327 6.859 9.616 10.770
17-Nov-08 21.2 20.2 20.3 73 66 0.110 6.607 6.669 0.187 11.231 11.694 0.355 0.520 ------------ 2.996 0.208 0.257 ------------ 1.479 ------------ ------------ ------------ ------------ 0.634 0.640 1.078 1.123 4.07 6.493 6.563 11.038 11.320
24-Nov-08 19.9 20.4 19.9 96 83 0.120 7.228 6.880 0.245 14.708 12.665 0.388 0.509 ------------ 2.934 0.272 0.361 ------------ 2.080 ------------ ------------ ------------ ------------ 0.694 0.660 1.412 1.216 4.58 6.313 6.073 12.846 11.030
1-Dec-08 19 19.2 19.1 76 74 0.131 7.878 7.280 0.246 14.760 13.819 0.423 0.616 ------------ 3.551 0.273 0.435 ------------ 2.508 ------------ ------------ ------------ ------------ 0.756 0.699 1.417 1.327 5.09 6.191 5.865 11.599 11.093
8-Dec-08 18.2 17.3 17.3 110 106 0.118 7.057 7.651 0.234 14.069 14.392 0.379 0.540 ------------ 3.112 0.260 0.359 ------------ 2.066 ------------ ------------ ------------ ------------ 0.677 0.735 1.351 1.382 5.60 5.041 5.707 10.049 10.784
15-Dec-08 18.5 18.5 19.0 73 98 0.127 7.629 7.934 0.239 14.328 14.560 0.409 0.628 ------------ 3.615 0.265 0.429 ------------ 2.471 ------------ ------------ ------------ ------------ 0.732 0.762 1.375 1.398 5.77 5.289 5.516 9.933 10.143
22-Dec-08 17.5 17.6 17.5 94 121 0.141 8.464 8.075 0.235 14.093 14.027 0.454 0.631 ------------ 3.634 0.261 0.385 ------------ 2.220 ------------ ------------ ------------ ------------ 0.813 0.775 1.353 1.347 5.94 5.700 5.264 9.490 9.213
29-Dec-08 18.2 18.0 18.1 100 106 0.144 8.643 8.147 0.259 15.549 14.015 0.464 0.665 ------------ 3.831 0.288 0.441 ------------ 2.539 ------------ ------------ ------------ ------------ 0.830 0.782 1.493 1.345 6.45 5.360 5.111 9.643 8.818
12-Jan-09 17 17.3 17.7 97 98 0.143 8.580 8.082 0.202 12.096 13.694 0.460 0.636 ------------ 3.666 0.224 0.455 ------------ 2.619 ------------ ------------ ------------ ------------ 0.824 0.776 1.161 1.315 6.96 4.931 4.898 6.952 8.303
19-Jan-09 16 16.2 16.4 64 54 0.124 7.418 7.986 0.233 14.006 13.594 0.398 0.609 ------------ 3.505 0.259 0.405 ------------ 2.335 ------------ ------------ ------------ ------------ 0.712 0.767 1.345 1.305 6.94 4.275 4.697 8.073 8.006
26-Jan-09 15.2 15.4 15.8 98 90 0.122 7.304 7.767 0.212 12.725 12.943 0.392 0.521 ------------ 3.003 0.235 0.382 ------------ 2.200 ------------ ------------ ------------ ------------ 0.701 0.746 1.222 1.242 6.92 4.222 4.476 7.356 7.460
Reactor 4: IFAS Media Only
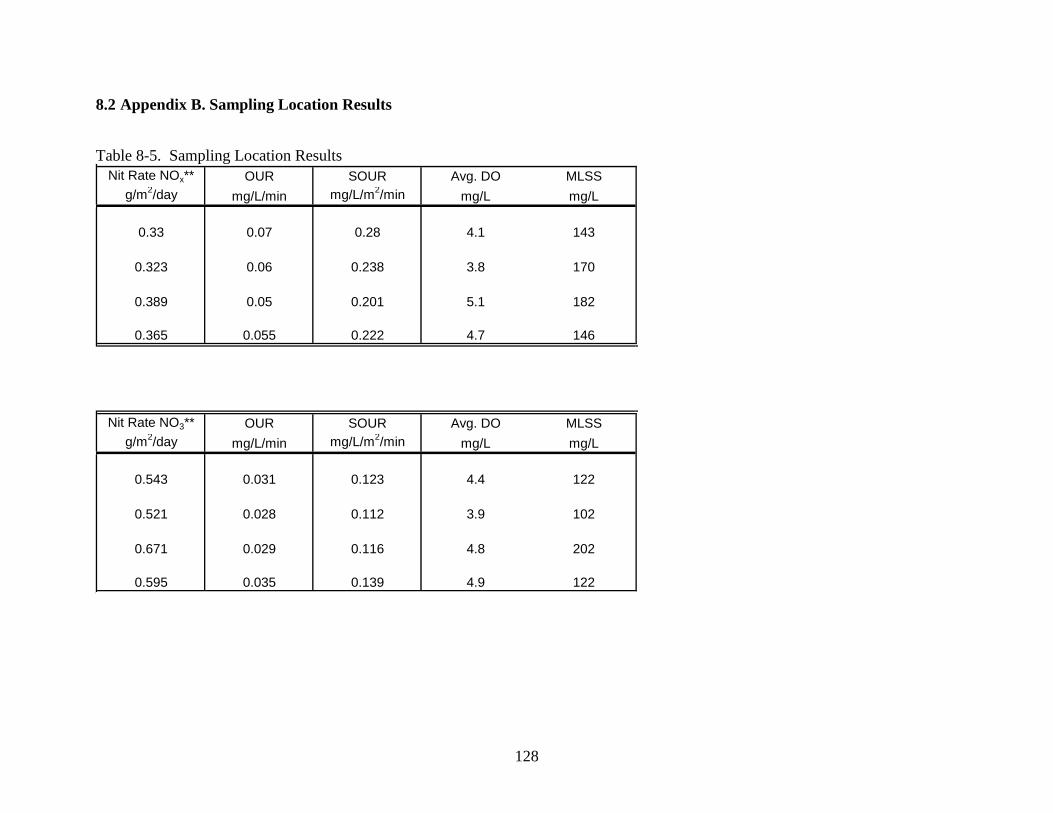
128
8.2 Appendix B. Sampling Location Results
Table 8-5. Sampling Location Results
Nit Rate NOx** OUR SOUR Avg. DO MLSS
g/m2/day mg/L/min mg/L/m
2/min mg/L mg/L
0.33 0.07 0.28 4.1 143
0.323 0.06 0.238 3.8 170
0.389 0.05 0.201 5.1 182
0.365 0.055 0.222 4.7 146
Nit Rate NO3** OUR SOUR Avg. DO MLSS
g/m2/day mg/L/min mg/L/m
2/min mg/L mg/L
0.543 0.031 0.123 4.4 122
0.521 0.028 0.112 3.9 102
0.671 0.029 0.116 4.8 202
0.595 0.035 0.139 4.9 122
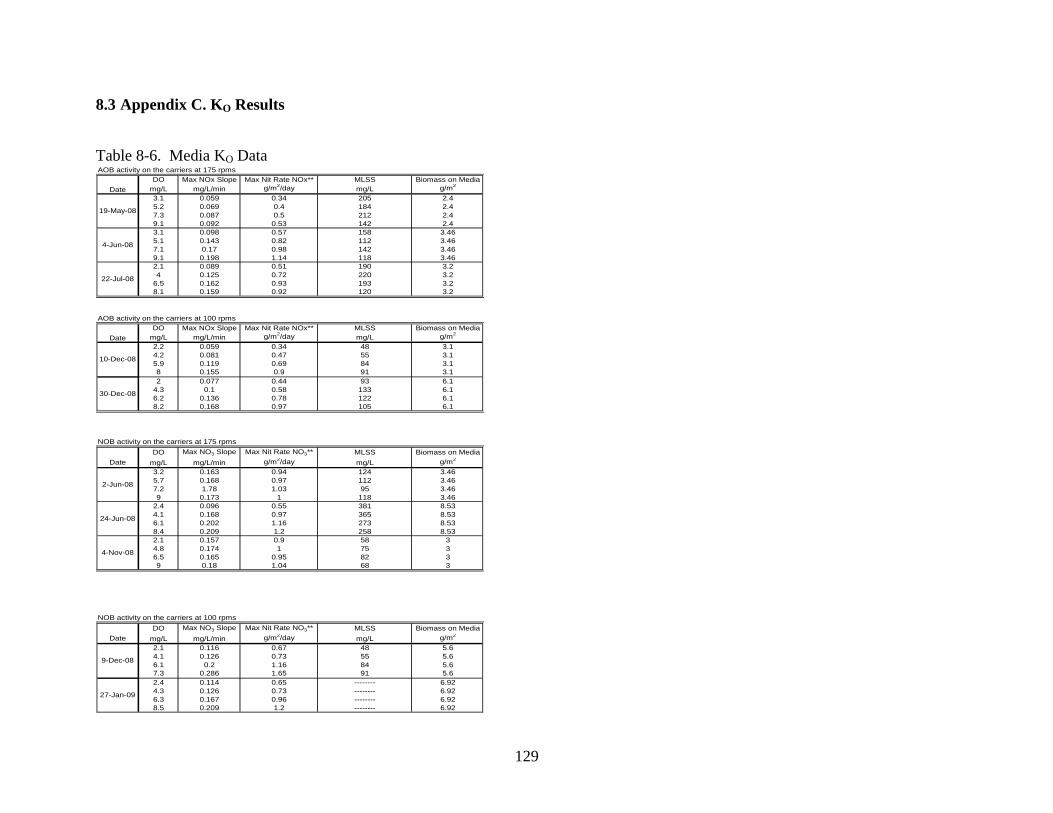
129
8.3 Appendix C. KO Results
Table 8-6. Media KO Data
AOB activity on the carriers at 175 rpms
DO Max NOx Slope Max Nit Rate NOx** MLSS Biomass on Media
mg/L mg/L/min g/m2/day mg/L g/m
2
3.1 0.059 0.34 205 2.4
5.2 0.069 0.4 184 2.4
7.3 0.087 0.5 212 2.4
9.1 0.092 0.53 142 2.4
3.1 0.098 0.57 158 3.46
5.1 0.143 0.82 112 3.46
7.1 0.17 0.98 142 3.46
9.1 0.198 1.14 118 3.46
2.1 0.089 0.51 190 3.2
4 0.125 0.72 220 3.2
6.5 0.162 0.93 193 3.2
8.1 0.159 0.92 120 3.2
AOB activity on the carriers at 100 rpms
DO Max NOx Slope Max Nit Rate NOx** MLSS Biomass on Media
mg/L mg/L/min g/m2/day mg/L g/m
2
2.2 0.059 0.34 48 3.1
4.2 0.081 0.47 55 3.1
5.9 0.119 0.69 84 3.1
8 0.155 0.9 91 3.1
2 0.077 0.44 93 6.1
4.3 0.1 0.58 133 6.1
6.2 0.136 0.78 122 6.1
8.2 0.168 0.97 105 6.1
NOB activity on the carriers at 175 rpms
DO Max NO3 Slope Max Nit Rate NO3** MLSS Biomass on Media
mg/L mg/L/min g/m2/day mg/L g/m
2
3.2 0.163 0.94 124 3.46
5.7 0.168 0.97 112 3.46
7.2 1.78 1.03 95 3.46
9 0.173 1 118 3.46
2.4 0.096 0.55 381 8.53
4.1 0.168 0.97 365 8.53
6.1 0.202 1.16 273 8.53
8.4 0.209 1.2 258 8.53
2.1 0.157 0.9 58 3
4.8 0.174 1 75 3
6.5 0.165 0.95 82 3
9 0.18 1.04 68 3
NOB activity on the carriers at 100 rpms
DO Max NO3 Slope Max Nit Rate NO3** MLSS Biomass on Media
mg/L mg/L/min g/m2/day mg/L g/m
2
2.1 0.116 0.67 48 5.6
4.1 0.126 0.73 55 5.6
6.1 0.2 1.16 84 5.6
7.3 0.286 1.65 91 5.6
2.4 0.114 0.65 -------- 6.92
4.3 0.126 0.73 -------- 6.92
6.3 0.167 0.96 -------- 6.92
8.5 0.209 1.2 -------- 6.92
19-May-08
4-Jun-08
22-Jul-08
Date
Date
10-Dec-08
30-Dec-08
Date
9-Dec-08
27-Jan-09
2-Jun-08
24-Jun-08
Date
4-Nov-08
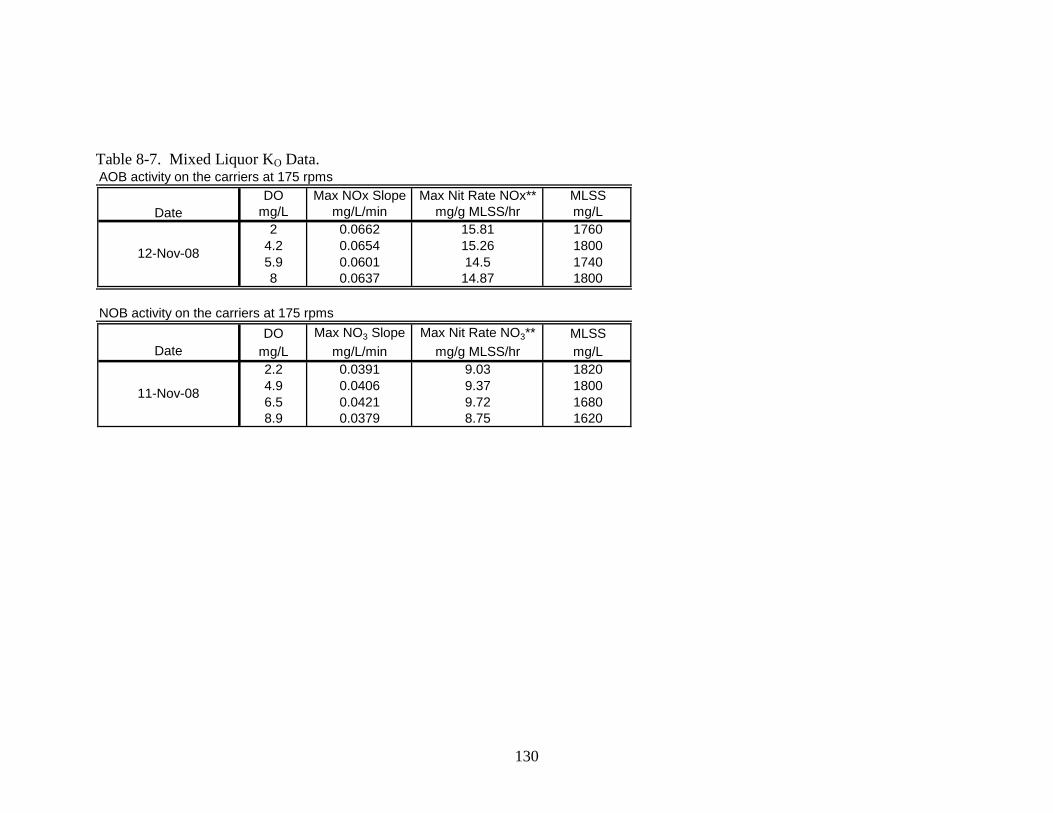
130
Table 8-7. Mixed Liquor KO Data. AOB activity on the carriers at 175 rpms
DO Max NOx Slope Max Nit Rate NOx** MLSS
mg/L mg/L/min mg/g MLSS/hr mg/L
2 0.0662 15.81 1760
4.2 0.0654 15.26 1800
5.9 0.0601 14.5 1740
8 0.0637 14.87 1800
NOB activity on the carriers at 175 rpms
DO Max NO3 Slope Max Nit Rate NO3** MLSS
mg/L mg/L/min mg/g MLSS/hr mg/L
2.2 0.0391 9.03 1820
4.9 0.0406 9.37 1800
6.5 0.0421 9.72 1680
8.9 0.0379 8.75 1620
Date
12-Nov-08
Date
11-Nov-08
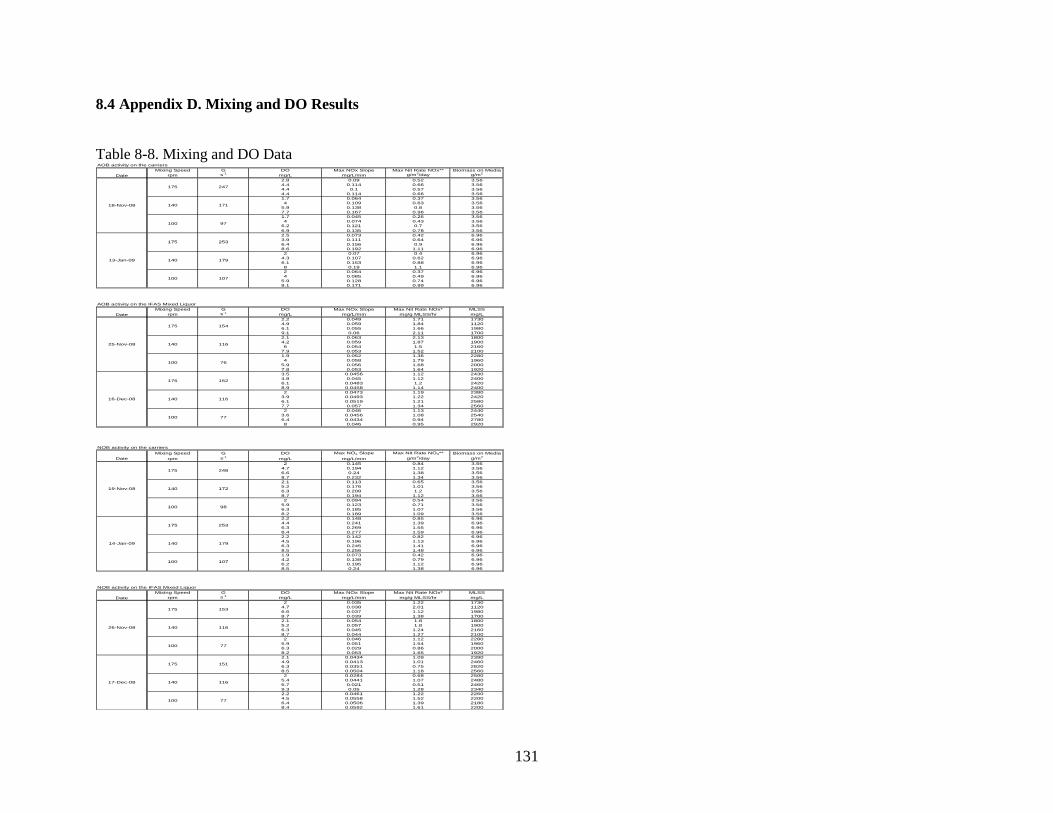
131
8.4 Appendix D. Mixing and DO Results
Table 8-8. Mixing and DO Data AOB activity on the carriers
Mixing Speed G DO Max NOx Slope Max Nit Rate NOx** Biomass on Media
rpm s-1
mg/L mg/L/min g/m2/day g/m
2
2.8 0.09 0.52 3.56
4.4 0.114 0.66 3.56
4.4 0.1 0.57 3.56
4.4 0.114 0.66 3.56
1.7 0.064 0.37 3.56
4 0.109 0.63 3.56
5.9 0.138 0.8 3.56
7.7 0.167 0.96 3.56
1.7 0.045 0.26 3.56
4 0.074 0.43 3.56
6.2 0.121 0.7 3.56
6.9 0.135 0.78 3.56
2.5 0.073 0.42 6.96
3.9 0.111 0.64 6.96
6.4 0.156 0.9 6.96
8.6 0.192 1.11 6.96
2 0.07 0.4 6.96
4.3 0.107 0.62 6.96
6.1 0.153 0.88 6.96
8 0.19 1.1 6.96
2 0.064 0.37 6.96
4 0.085 0.49 6.96
5.9 0.128 0.74 6.96
8.1 0.171 0.99 6.96
AOB activity on the IFAS Mixed Liquor
Mixing Speed G DO Max NOx Slope Max Nit Rate NOx* MLSS
rpm s-1
mg/L mg/L/min mg/g MLSS/hr mg/L
2.2 0.049 1.71 1730
4.9 0.059 1.84 1120
6.1 0.055 1.66 1980
9.1 0.06 2.11 1700
2.1 0.063 2.13 1800
4.2 0.059 1.87 1900
6 0.054 1.5 2160
7.9 0.053 1.52 2100
1.9 0.052 1.36 2280
4 0.058 1.79 1960
5.9 0.056 1.68 2000
7.8 0.053 1.64 1920
3.5 0.0456 1.12 2430
4.8 0.045 1.12 2400
6.1 0.0483 1.2 2420
8.9 0.0458 1.14 2400
2 0.0473 1.19 2380
3.9 0.0493 1.22 2420
6.1 0.0519 1.21 2580
7.7 0.057 1.34 2560
2 0.046 1.13 2440
3.6 0.0456 1.08 2540
6.4 0.0434 0.94 2780
8 0.046 0.95 2920
NOB activity on the carriers
Mixing Speed G DO Max NO3 Slope Max Nit Rate NO3** Biomass on Media
rpm s-1
mg/L mg/L/min g/m2/day g/m
2
2 0.145 0.84 3.56
4.7 0.194 1.12 3.56
6.6 0.24 1.38 3.56
8.7 0.232 1.34 3.56
2.1 0.113 0.65 3.56
5.2 0.176 1.01 3.56
6.3 0.208 1.2 3.56
8.7 0.194 1.12 3.56
2 0.094 0.54 3.56
5.9 0.123 0.71 3.56
6.3 0.185 1.07 3.56
8.2 0.189 1.09 3.56
2.2 0.148 0.85 6.96
4.4 0.241 1.39 6.96
6.3 0.269 1.55 6.96
8.4 0.277 1.59 6.96
2.2 0.142 0.82 6.96
4.5 0.196 1.13 6.96
6.3 0.245 1.41 6.96
8.5 0.256 1.48 6.96
1.9 0.073 0.42 6.96
4.2 0.138 0.79 6.96
6.2 0.195 1.12 6.96
8.5 0.24 1.38 6.96
NOB activity on the IFAS Mixed Liquor
Mixing Speed G DO Max NOx Slope Max Nit Rate NOx* MLSS
rpm s-1
mg/L mg/L/min mg/g MLSS/hr mg/L
2 0.035 1.22 1730
4.7 0.038 2.01 1120
6.6 0.037 1.12 1980
8.7 0.039 1.38 1700
2.1 0.054 1.8 1800
5.2 0.057 1.8 1900
6.3 0.045 1.24 2160
8.7 0.044 1.27 2100
2 0.046 1.12 2280
5.9 0.051 1.54 1960
6.3 0.029 0.86 2000
8.2 0.053 1.65 1920
2.1 0.0434 1.09 2390
4.9 0.0413 1.01 2460
6.3 0.0351 0.75 2820
8.5 0.0504 1.18 2560
2 0.0284 0.68 2500
5.4 0.0441 1.07 2480
6.7 0.021 0.51 2460
9.3 0.05 1.28 2340
2.2 0.0461 1.22 2260
4.5 0.0558 1.52 2200
6.4 0.0506 1.39 2180
8.4 0.0592 1.61 2200
Date
18-Nov-08
154
116140
175
140
100
Date
247
100
19-Nov-08
Date
175
171
97
13-Jan-09
175 253
140 179
100 107
76
16-Dec-08
175 152
140 116
100 77
25-Nov-08
175
248
140 172
100 98
14-Jan-09
175 253
140 179
100 107
Date
26-Nov-08
175 153
140 116
100 77
151
140 116
100 77
17-Dec-08
175
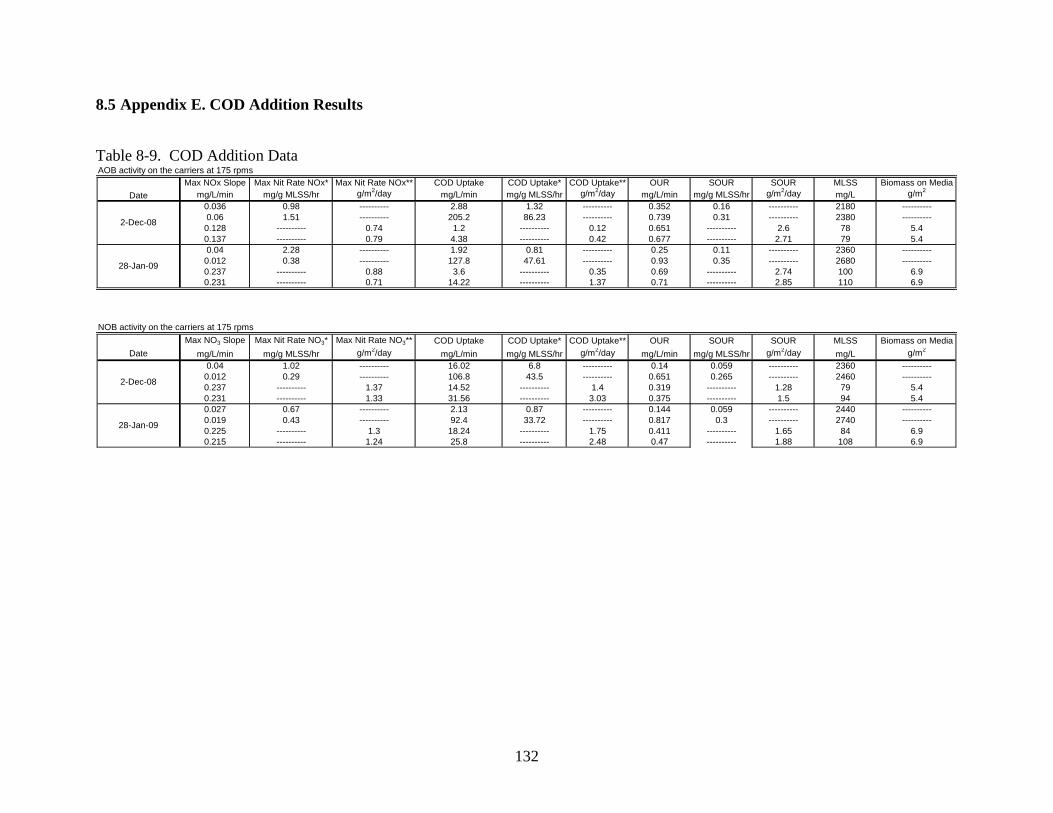
132
8.5 Appendix E. COD Addition Results
Table 8-9. COD Addition Data AOB activity on the carriers at 175 rpms
Max NOx Slope Max Nit Rate NOx* Max Nit Rate NOx** COD Uptake COD Uptake* COD Uptake** OUR SOUR SOUR MLSS Biomass on Media
mg/L/min mg/g MLSS/hr g/m2/day mg/L/min mg/g MLSS/hr g/m
2/day mg/L/min mg/g MLSS/hr g/m
2/day mg/L g/m
2
0.036 0.98 ---------- 2.88 1.32 ---------- 0.352 0.16 ---------- 2180 ----------
0.06 1.51 ---------- 205.2 86.23 ---------- 0.739 0.31 ---------- 2380 ----------
0.128 ---------- 0.74 1.2 ---------- 0.12 0.651 ---------- 2.6 78 5.4
0.137 ---------- 0.79 4.38 ---------- 0.42 0.677 ---------- 2.71 79 5.4
0.04 2.28 ---------- 1.92 0.81 ---------- 0.25 0.11 ---------- 2360 ----------
0.012 0.38 ---------- 127.8 47.61 ---------- 0.93 0.35 ---------- 2680 ----------
0.237 ---------- 0.88 3.6 ---------- 0.35 0.69 ---------- 2.74 100 6.9
0.231 ---------- 0.71 14.22 ---------- 1.37 0.71 ---------- 2.85 110 6.9
NOB activity on the carriers at 175 rpms
Max NO3 Slope Max Nit Rate NO3* Max Nit Rate NO3** COD Uptake COD Uptake* COD Uptake** OUR SOUR SOUR MLSS Biomass on Media
mg/L/min mg/g MLSS/hr g/m2/day mg/L/min mg/g MLSS/hr g/m
2/day mg/L/min mg/g MLSS/hr g/m
2/day mg/L g/m
2
0.04 1.02 ---------- 16.02 6.8 ---------- 0.14 0.059 ---------- 2360 ----------
0.012 0.29 ---------- 106.8 43.5 ---------- 0.651 0.265 ---------- 2460 ----------
0.237 ---------- 1.37 14.52 ---------- 1.4 0.319 ---------- 1.28 79 5.4
0.231 ---------- 1.33 31.56 ---------- 3.03 0.375 ---------- 1.5 94 5.4
0.027 0.67 ---------- 2.13 0.87 ---------- 0.144 0.059 ---------- 2440 ----------
0.019 0.43 ---------- 92.4 33.72 ---------- 0.817 0.3 ---------- 2740 ----------
0.225 ---------- 1.3 18.24 ---------- 1.75 0.411 ---------- 1.65 84 6.9
0.215 ---------- 1.24 25.8 ---------- 2.48 0.47 ---------- 1.88 108 6.9
2-Dec-08
28-Jan-09
Date
Date
2-Dec-08
28-Jan-09