Embed Size (px)
Citation preview

Evaluation of geogrids for stabilising weak pavement subgrade
Xiaochao Tang1, Ghassan R. Chehab* and Angelica Palomino2
Department of Civil and Environmental Engineering, The Pennsylvania State University, University Park, PA, USA
(Received 24 February 2008; final version received 7 June 2008 )
This study attempts to identify mechanical and physical properties of geogrids that are critical to their effectiveness in thestabilisation of pavement subgrade. Geogrid properties, including aperture size, wide-width tensile strength and junctionstrength, for four geogrid products are correlated with bench-scale interface test results, including direct shear and pull-out,and accelerated pavement testing (APT) results. APT is conducted through the use of a one-third scale APT device, themodel mobile load simulator (MMLS3) on geogrid-reinforced pavement sections. The pavement sections are constructed ona subgrade soil with a low California bearing ratio. The performance of each pavement section is evaluated by measuringsurface rutting at various trafficking stages. The analysis reveals a strong relationship between performance and junction andtensile strength of geogrids at small strains, whereas aperture size has a positive correlation with pull-out test results.
Keywords: geogrid; subgrade stabilisation; pavement; bench-scale testing; accelerated testing, MMLS3
1. Introduction
Geogrids have been widely used as reinforcement in
structures with unbound materials, such as pavements,
slopes, retaining walls and embankments. It has been shown
that, in a pavement system, the inclusion of geogrids at the
interface between a pavement base course and subgrade can
significantly improve the performance of the pavement on a
weak subgrade according to both laboratory tests and full-
scale field experiments (Barksdale et al. 1989, Al-Qadi et al.
1994, 2007, Perkins 1999, Hufenus et al. 2006). Given a
proper ratio of geogrid aperture size to aggregate grain size,
geogrids provide lateral confinement to the pavement
aggregate base course (ABC) through shear resistance and
friction between the geogrid and surrounding aggregate.
The confinement due to the geogrid increases themodulus of
the aggregate, which leads to an improved vertical stress
distribution over the subgrade and consequent reduction in
vertical subgrade deformation (Love 1984, Hass et al. 1988).
Reduction indeformation also results fromreduction in shear
stress transfer at the geogrid–subgrade interface (Perkins
1999). Additional types andmechanisms of reinforcement –
surface friction along the geogrid, passive thrust against
the geogrid’s bearing ribs, aggregate interlocking between
the apertures, and/or soil–soil friction – aremobilised by the
presence of geogrids depending on the application and type
of environmental and loading conditions (Shukla 2002).
The effectiveness of geogrid reinforcement is highly
dependent on physical and mechanical properties, i.e. index
properties, of the geogrid and on the properties of the
interface between the geogrid and the surroundingmaterials.
Results from direct shear and pull-out tests are the most
commonly used parameters depicting the soil–geogrid
interaction characteristics. Characteristics identified through
those tests are a function of the geogrid material mechanical
properties, shape and texture, as well as soil and aggregate
properties, such as gradation, plasticity, density and
moisture content, applied normal stress and loading rate
(Ingold 1983, Jewell et al. 1984, Farrag et al. 1993).
Identification of geogrid properties critical for
optimising the effectiveness of a specific reinforcement
mechanism can be achieved by correlating the known
geogrid properties, e.g. junction strength, with the
response of geogrids in bench-scale interface tests and
model-scale performance tests. Accelerated pavement
testing (APT) has been used successfully for evaluating
geogrid performance for pavement applications in the
USA since 1909 (Metcalf 1996). The advantages of APT
are the ability to conduct performance tests at relatively
low costs over a short time period, and the ability to
control the loading and environmental conditions.
This study focuses on correlating the index properties
of geogrids with the results of bench-scale testing and
accelerated testing. Testing includes standard index
property tests, interface tests, including direct shear and
pull-out tests and APT. An in-depth analysis is then
conducted to correlate the values of index properties with
the results of bench-scale testing and performance-based
APT. Through the correlation analysis, the geogrid index
properties that most influence the performance of geogrids
as a means for flexible pavement subgrade stabilisation are
identified.
ISSN 1029-8436 print/ISSN 1477-268X online
q 2008 Taylor & Francis
DOI: 10.1080/10298430802279827
http://www.informaworld.com
*Corresponding author. Email: [email protected]
International Journal of Pavement Engineering
Vol. 9, No. 6, December 2008, 413–429
Downloaded By: [Palomino, Angel] At: 15:02 31 March 2009
2. Experimental design
2.1 Materials
2.1.1 Geogrids
Four commonly used biaxial geogrid products are selected
for this study and are herein designated as Grids A–D.
Grids A and D are composed of high tenacity polyester
multifilament yarns and coated with a proprietary polymer
and polyvinyl chloride coating, respectively. Grid B is
made of woven polypropylene (PP) yarns, while Grid C is
made of extruded PP sheets. Based on the measured
flexural rigidity as per ASTMD1388, Grids A, B and D are
classified as flexible geogrids, while Grid C is classified as
a stiff geogrid (Koerner 1998).
2.1.2 Subgrade soil
The subgrade material is a silty sand. Table 1 provides a
summary of the subgrade soil properties. The soil grain
size distribution is shown in Figure 1. The soil is classified
as SW-SM, which is a well-graded silty sand in accordancewith ASTM D2487 and A-2-4(0) in accordance with
AASHTO M145.
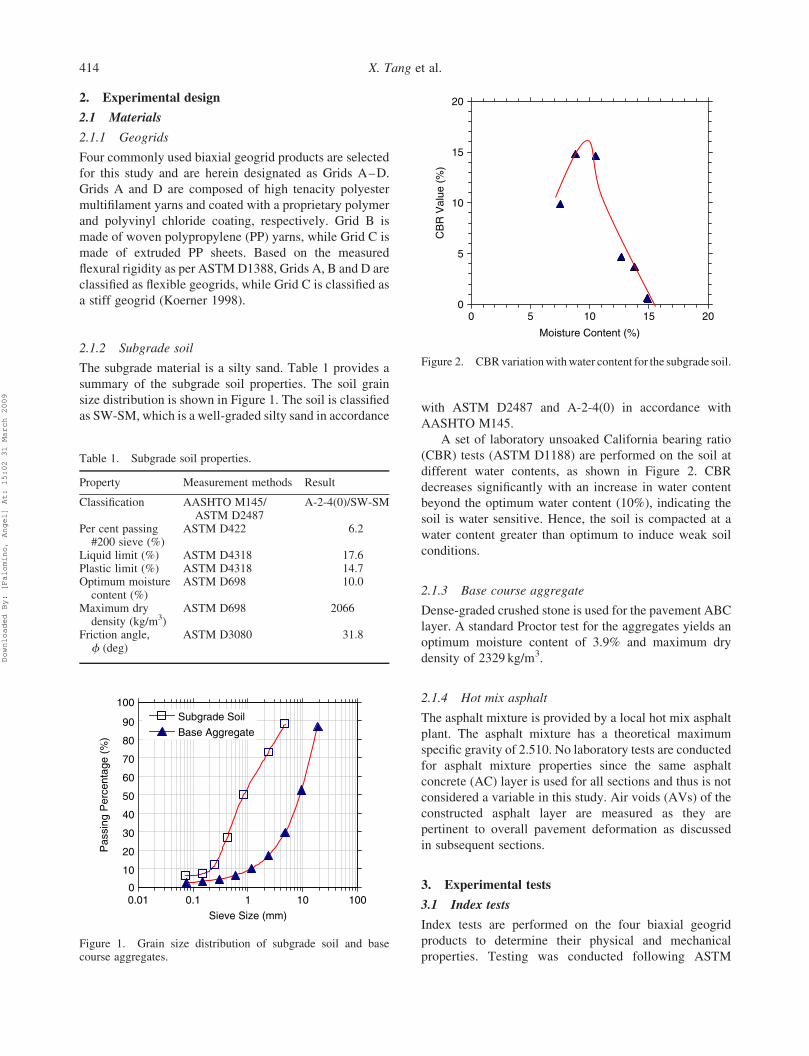
A set of laboratory unsoaked California bearing ratio
(CBR) tests (ASTM D1188) are performed on the soil at
different water contents, as shown in Figure 2. CBR
decreases significantly with an increase in water content
beyond the optimum water content (10%), indicating the
soil is water sensitive. Hence, the soil is compacted at a
water content greater than optimum to induce weak soil
conditions.
2.1.3 Base course aggregate
Dense-graded crushed stone is used for the pavement ABC
layer. A standard Proctor test for the aggregates yields an
optimum moisture content of 3.9% and maximum dry
density of 2329 kg/m3.
2.1.4 Hot mix asphalt
The asphalt mixture is provided by a local hot mix asphalt
plant. The asphalt mixture has a theoretical maximum
specific gravity of 2.510. No laboratory tests are conducted
for asphalt mixture properties since the same asphalt
concrete (AC) layer is used for all sections and thus is not
considered a variable in this study. Air voids (AVs) of the
constructed asphalt layer are measured as they are
pertinent to overall pavement deformation as discussed
in subsequent sections.
3. Experimental tests
3.1 Index tests
Index tests are performed on the four biaxial geogrid
products to determine their physical and mechanical
properties. Testing was conducted following ASTMFigure 1. Grain size distribution of subgrade soil and basecourse aggregates.
Table 1. Subgrade soil properties.
Property Measurement methods Result
Classification AASHTO M145/ASTM D2487
A-2-4(0)/SW-SM
Per cent passing#200 sieve (%)
ASTM D422 6.2
Liquid limit (%) ASTM D4318 17.6Plastic limit (%) ASTM D4318 14.7Optimum moisturecontent (%)
ASTM D698 10.0
Maximum drydensity (kg/m3)
ASTM D698 2066
Friction angle,f (deg)
ASTM D3080 31.8
Figure 2. CBRvariationwithwater content for the subgrade soil.
X. Tang et al.414
Downloaded By: [Palomino, Angel] At: 15:02 31 March 2009
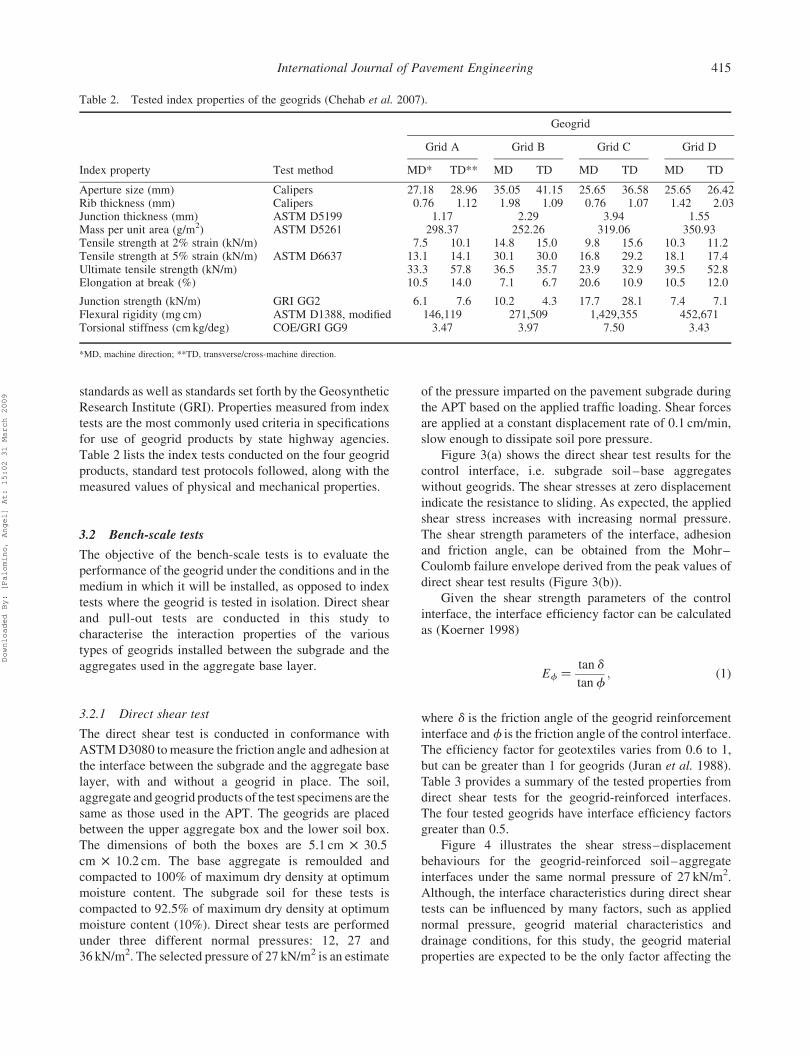
standards as well as standards set forth by the Geosynthetic
Research Institute (GRI). Properties measured from index
tests are the most commonly used criteria in specifications
for use of geogrid products by state highway agencies.
Table 2 lists the index tests conducted on the four geogrid
products, standard test protocols followed, along with the
measured values of physical and mechanical properties.
3.2 Bench-scale tests
The objective of the bench-scale tests is to evaluate the
performance of the geogrid under the conditions and in the
medium in which it will be installed, as opposed to index
tests where the geogrid is tested in isolation. Direct shear
and pull-out tests are conducted in this study to
characterise the interaction properties of the various
types of geogrids installed between the subgrade and the
aggregates used in the aggregate base layer.
3.2.1 Direct shear test
The direct shear test is conducted in conformance with
ASTMD3080 tomeasure the friction angle and adhesion at
the interface between the subgrade and the aggregate base
layer, with and without a geogrid in place. The soil,
aggregate and geogrid products of the test specimens are the
same as those used in the APT. The geogrids are placed
between the upper aggregate box and the lower soil box.
The dimensions of both the boxes are 5.1 cm £ 30.5
cm £ 10.2 cm. The base aggregate is remoulded and
compacted to 100% of maximum dry density at optimum
moisture content. The subgrade soil for these tests is
compacted to 92.5% of maximum dry density at optimum
moisture content (10%). Direct shear tests are performed
under three different normal pressures: 12, 27 and
36 kN/m2. The selected pressure of 27 kN/m2 is an estimate
of the pressure imparted on the pavement subgrade during
the APT based on the applied traffic loading. Shear forces
are applied at a constant displacement rate of 0.1 cm/min,
slow enough to dissipate soil pore pressure.
Figure 3(a) shows the direct shear test results for the
control interface, i.e. subgrade soil–base aggregates
without geogrids. The shear stresses at zero displacement
indicate the resistance to sliding. As expected, the applied
shear stress increases with increasing normal pressure.
The shear strength parameters of the interface, adhesion
and friction angle, can be obtained from the Mohr–
Coulomb failure envelope derived from the peak values of
direct shear test results (Figure 3(b)).
Given the shear strength parameters of the control
interface, the interface efficiency factor can be calculated
as (Koerner 1998)
Ef ¼tan d
tanf; ð1Þ
where d is the friction angle of the geogrid reinforcement
interface and f is the friction angle of the control interface.
The efficiency factor for geotextiles varies from 0.6 to 1,
but can be greater than 1 for geogrids (Juran et al. 1988).
Table 3 provides a summary of the tested properties from
direct shear tests for the geogrid-reinforced interfaces.
The four tested geogrids have interface efficiency factors
greater than 0.5.
Figure 4 illustrates the shear stress–displacement
behaviours for the geogrid-reinforced soil–aggregate
interfaces under the same normal pressure of 27 kN/m2.
Although, the interface characteristics during direct shear
tests can be influenced by many factors, such as applied
normal pressure, geogrid material characteristics and
drainage conditions, for this study, the geogrid material
properties are expected to be the only factor affecting the
Table 2. Tested index properties of the geogrids (Chehab et al. 2007).
Geogrid
Grid A Grid B Grid C Grid D
Index property Test method MD* TD** MD TD MD TD MD TD
Aperture size (mm) Calipers 27.18 28.96 35.05 41.15 25.65 36.58 25.65 26.42Rib thickness (mm) Calipers 0.76 1.12 1.98 1.09 0.76 1.07 1.42 2.03Junction thickness (mm) ASTM D5199 1.17 2.29 3.94 1.55Mass per unit area (g/m2) ASTM D5261 298.37 252.26 319.06 350.93Tensile strength at 2% strain (kN/m) 7.5 10.1 14.8 15.0 9.8 15.6 10.3 11.2Tensile strength at 5% strain (kN/m) ASTM D6637 13.1 14.1 30.1 30.0 16.8 29.2 18.1 17.4Ultimate tensile strength (kN/m) 33.3 57.8 36.5 35.7 23.9 32.9 39.5 52.8Elongation at break (%) 10.5 14.0 7.1 6.7 20.6 10.9 10.5 12.0
Junction strength (kN/m) GRI GG2 6.1 7.6 10.2 4.3 17.7 28.1 7.4 7.1Flexural rigidity (mg cm) ASTM D1388, modified 146,119 271,509 1,429,355 452,671Torsional stiffness (cm kg/deg) COE/GRI GG9 3.47 3.97 7.50 3.43
*MD, machine direction; **TD, transverse/cross-machine direction.
International Journal of Pavement Engineering 415
Downloaded By: [Palomino, Angel] At: 15:02 31 March 2009

interface since all other factors are held constant among
the four tests.
3.2.2 Pull-out test
Pull-out tests are conducted on four geogrids in a medium
consisting of the base course aggregates used in the
pavement section as per ASTM D6706 in the machine
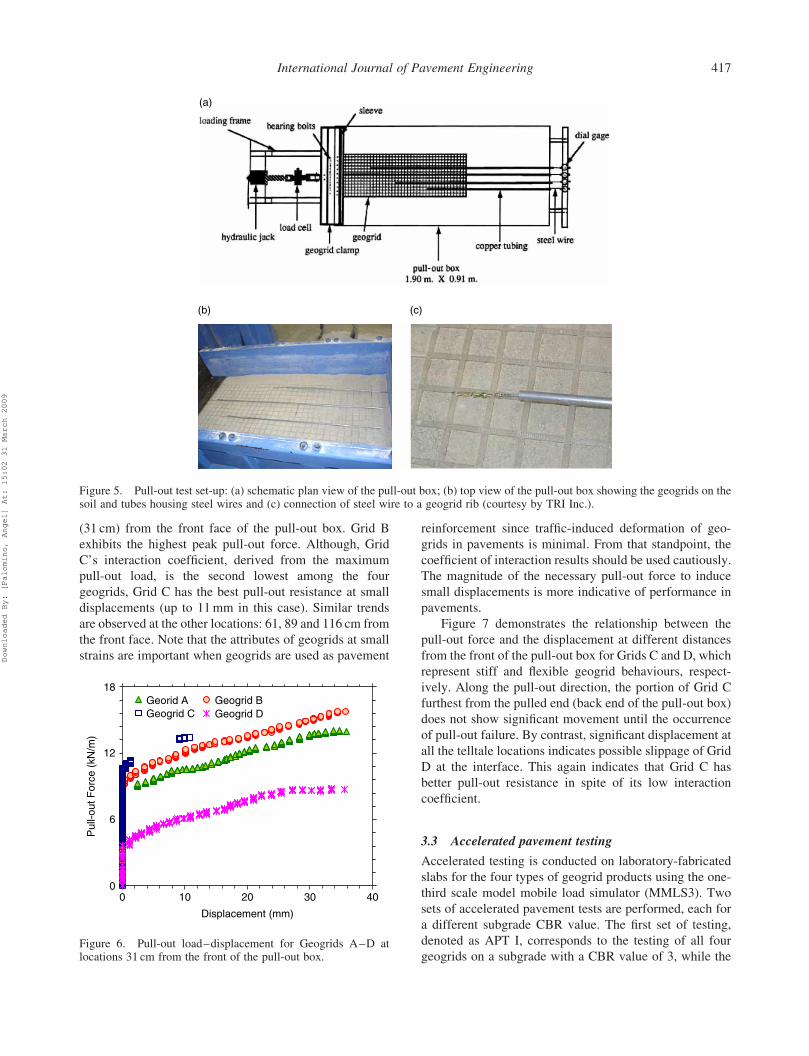
direction of the geogrid. The pull-out test set-up is shown
in Figure 5. The geogrid samples are cut into
1.2m £ 0.6m sections and inserted into a 0.4m thick
compacted aggregate layer with the machine direction ribs
oriented parallel to the pull-out direction. All pull-out tests
are carried out under a normal pressure of 6.9 kN/m2 and at
a displacement rate of 0.1 cm/min. The geogrid displace-
ments are measured at the front and at 31, 61, 89 and
116 cm away from the front through a telltale system
having steel wires connecting geogrids to linear variable
differential transformers.
The interaction coefficient, Ci, represents the ratio of
the average interface strength to the internal shear strength
of the base course aggregates and is used herein to quantify
the reinforcement effectiveness for pull-out tests. Ci is
calculated according to Bergado and Chai (1994) and
Tatlisoz et al. (1998) as
Ci ¼P
2WLðcþ sn tanfÞ; ð2Þ
where Ci is the coefficient of interaction, P is the maximum
pull-out load, sn is the applied normal pressure, c is the
adhesion of soil medium tested, f is the friction angle of
soil medium tested,W is the width of the geogrid specimen
and L is the embedded length of the geogrid in the soil.
Ci is a function of frictional characteristics between the
geogrids and the surrounding unbound materials, the
strength of the geogrid junctions, the flexural stiffness of
the transverse ribs and the geogrid per cent open area.
The calculated interaction coefficients for the four geogrid
cases are presented in Table 3. A strong bond between the
soil and the geogrid corresponds to an interaction
coefficient value greater than 1. An interaction coefficient
less than 0.5 implies a weak bond between the geogrid and
the surrounding materials and/or possible breakage of
geogrid cells. Most values reported for geosynthetics range
between 0.5 and 1 (Mohiuddin 2003).
Figure 6 shows the pull-out force–displacement
relationships for Grids A–D at the nearest location
Figure 3. Direct shear tests: (a) shear stress–displacement under three normal pressures and (b) friction angle of the control interface.
Table 3. Results of the direct shear and pull-out tests.
Property Grid A Grid B Grid C Grid D Control
Friction angle,dpeak (deg)
28.6 44.0 48.0 32.7 44.2
Efficiencyfactor, Ef
0.56 0.99 1.14 0.66 N/A
Adhesion,c (kN/m2)
1.72 0.00 0.00 3.69 0
Interactioncoefficient, Ci
0.86 1.00 0.82 0.62 N/A
Figure 4. Shear stress–displacement at the subgrade–aggregate base interface under a pressure of 27 kN/m2 for thecontrol case and with each of the four tested geogrids.
X. Tang et al.416
Downloaded By: [Palomino, Angel] At: 15:02 31 March 2009
(31 cm) from the front face of the pull-out box. Grid B
exhibits the highest peak pull-out force. Although, Grid
C’s interaction coefficient, derived from the maximum
pull-out load, is the second lowest among the four
geogrids, Grid C has the best pull-out resistance at small
displacements (up to 11mm in this case). Similar trends
are observed at the other locations: 61, 89 and 116 cm from
the front face. Note that the attributes of geogrids at small
strains are important when geogrids are used as pavement
reinforcement since traffic-induced deformation of geo-
grids in pavements is minimal. From that standpoint, the
coefficient of interaction results should be used cautiously.
The magnitude of the necessary pull-out force to induce
small displacements is more indicative of performance in
pavements.
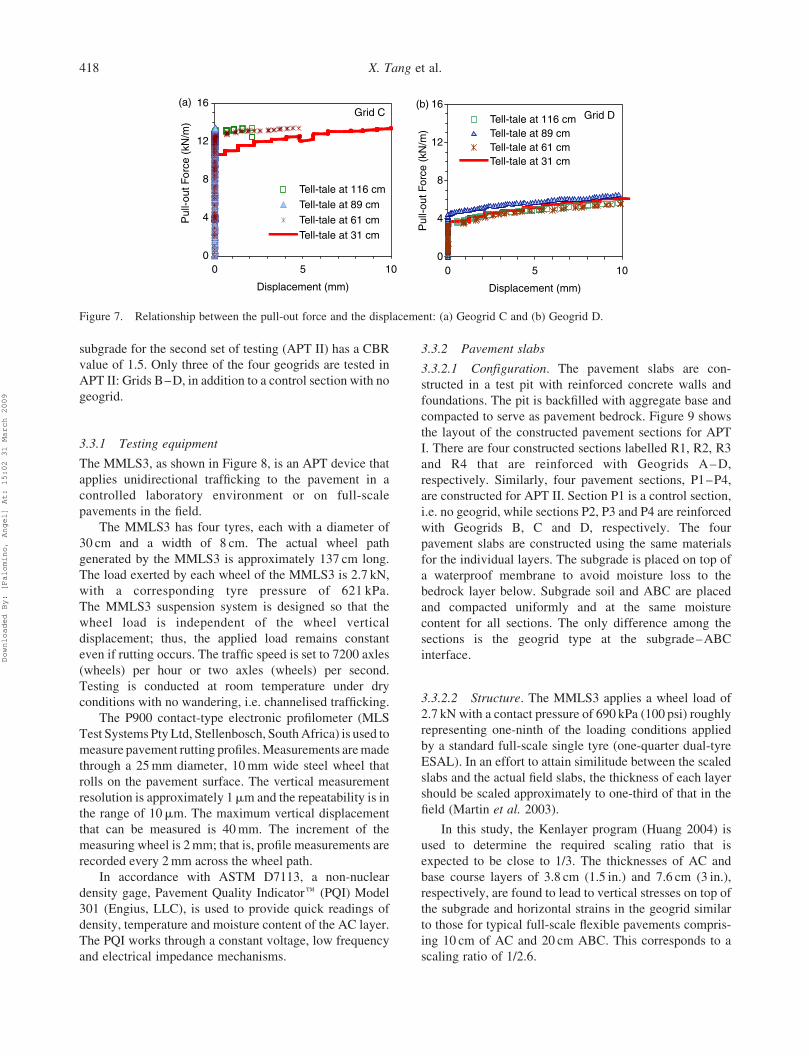
Figure 7 demonstrates the relationship between the
pull-out force and the displacement at different distances
from the front of the pull-out box for Grids C and D, which
represent stiff and flexible geogrid behaviours, respect-
ively. Along the pull-out direction, the portion of Grid C
furthest from the pulled end (back end of the pull-out box)
does not show significant movement until the occurrence
of pull-out failure. By contrast, significant displacement at
all the telltale locations indicates possible slippage of Grid
D at the interface. This again indicates that Grid C has
better pull-out resistance in spite of its low interaction
coefficient.
3.3 Accelerated pavement testing
Accelerated testing is conducted on laboratory-fabricated
slabs for the four types of geogrid products using the one-
third scale model mobile load simulator (MMLS3). Two
sets of accelerated pavement tests are performed, each for
a different subgrade CBR value. The first set of testing,
denoted as APT I, corresponds to the testing of all four
geogrids on a subgrade with a CBR value of 3, while the
Figure 5. Pull-out test set-up: (a) schematic plan view of the pull-out box; (b) top view of the pull-out box showing the geogrids on thesoil and tubes housing steel wires and (c) connection of steel wire to a geogrid rib (courtesy by TRI Inc.).
Figure 6. Pull-out load–displacement for Geogrids A–D atlocations 31 cm from the front of the pull-out box.
International Journal of Pavement Engineering 417
Downloaded By: [Palomino, Angel] At: 15:02 31 March 2009
subgrade for the second set of testing (APT II) has a CBR
value of 1.5. Only three of the four geogrids are tested in
APT II: Grids B–D, in addition to a control section with no
geogrid.
3.3.1 Testing equipment
The MMLS3, as shown in Figure 8, is an APT device that
applies unidirectional trafficking to the pavement in a
controlled laboratory environment or on full-scale
pavements in the field.
The MMLS3 has four tyres, each with a diameter of
30 cm and a width of 8 cm. The actual wheel path
generated by the MMLS3 is approximately 137 cm long.
The load exerted by each wheel of the MMLS3 is 2.7 kN,
with a corresponding tyre pressure of 621 kPa.
The MMLS3 suspension system is designed so that the
wheel load is independent of the wheel vertical
displacement; thus, the applied load remains constant
even if rutting occurs. The traffic speed is set to 7200 axles
(wheels) per hour or two axles (wheels) per second.
Testing is conducted at room temperature under dry
conditions with no wandering, i.e. channelised trafficking.
The P900 contact-type electronic profilometer (MLS
Test Systems Pty Ltd, Stellenbosch, SouthAfrica) is used to
measure pavement rutting profiles.Measurements aremade
through a 25mm diameter, 10mm wide steel wheel that
rolls on the pavement surface. The vertical measurement
resolution is approximately 1mm and the repeatability is in
the range of 10mm. The maximum vertical displacement
that can be measured is 40mm. The increment of the
measuring wheel is 2mm; that is, profile measurements are
recorded every 2mm across the wheel path.
In accordance with ASTM D7113, a non-nuclear
density gage, Pavement Quality Indicatore (PQI) Model
301 (Engius, LLC), is used to provide quick readings of
density, temperature and moisture content of the AC layer.
The PQI works through a constant voltage, low frequency
and electrical impedance mechanisms.
3.3.2 Pavement slabs
3.3.2.1 Configuration. The pavement slabs are con-
structed in a test pit with reinforced concrete walls and
foundations. The pit is backfilled with aggregate base and
compacted to serve as pavement bedrock. Figure 9 shows
the layout of the constructed pavement sections for APT
I. There are four constructed sections labelled R1, R2, R3
and R4 that are reinforced with Geogrids A–D,
respectively. Similarly, four pavement sections, P1–P4,
are constructed for APT II. Section P1 is a control section,
i.e. no geogrid, while sections P2, P3 and P4 are reinforced
with Geogrids B, C and D, respectively. The four
pavement slabs are constructed using the same materials
for the individual layers. The subgrade is placed on top of
a waterproof membrane to avoid moisture loss to the
bedrock layer below. Subgrade soil and ABC are placed
and compacted uniformly and at the same moisture
content for all sections. The only difference among the
sections is the geogrid type at the subgrade–ABC
interface.
3.3.2.2 Structure. The MMLS3 applies a wheel load of
2.7 kN with a contact pressure of 690 kPa (100 psi) roughly
representing one-ninth of the loading conditions applied
by a standard full-scale single tyre (one-quarter dual-tyre
ESAL). In an effort to attain similitude between the scaled
slabs and the actual field slabs, the thickness of each layer
should be scaled approximately to one-third of that in the
field (Martin et al. 2003).
In this study, the Kenlayer program (Huang 2004) is
used to determine the required scaling ratio that is
expected to be close to 1/3. The thicknesses of AC and
base course layers of 3.8 cm (1.5 in.) and 7.6 cm (3 in.),
respectively, are found to lead to vertical stresses on top of
the subgrade and horizontal strains in the geogrid similar
to those for typical full-scale flexible pavements compris-
ing 10 cm of AC and 20 cm ABC. This corresponds to a
scaling ratio of 1/2.6.
Figure 7. Relationship between the pull-out force and the displacement: (a) Geogrid C and (b) Geogrid D.
X. Tang et al.418
Downloaded By: [Palomino, Angel] At: 15:02 31 March 2009

3.3.2.3 Construction. The pavement subgrade soil is
compacted in three lifts with a vibratory plate compactor.
The compactor travel direction ensures consistency of the
soil density throughout the pit. The geogrids are carefully
unrolled to avoid folds and wrinkles and placed directly on
the subgrade layer. The geogrids from adjacent sections
have a 7.6 cm overlap to ensure adequate development
length, and the ends of the geogrid sections are folded
against the pit walls to obtain necessary anchorage and
slight pre-tensioning, as well as to prevent shifting of the
geogrids out of position (Figure 9). The geogrid is overlaid
with an ABC layer compacted using a vibratory plate
compactor. A 6% AV content is targeted for the AC layer.
The target AV is similar to that targeted in field
construction and is expected not to significantly contribute
to the overall rutting of the pavement, since the low CBR
of the subgrade would lead to extensive deformation that
dominates the overall pavement rutting. Table 4 presents
the as-constructed layer properties for both APTs I and II.
The AC layer density is measured along the wheel path
for each section using the PQI non-nuclear density gage
prior to MMLS3 trafficking. Figure 10 presents a contour
plot of the measured AV distribution for each section
measured after construction and before trafficking.
The asphalt layer in sections R3 and P3 reinforced by Grid
C has significantly higherAVs than the other sections in both
test sets. It is highly likely that the highACAVs in these two
sections result from the attributes of the geogrid itself, which
has a significantly higher stiffness than the other geogrids
tested, given the uniform compaction technique and
consistent pavement structure and materials used. Further
studies that incorporate different types of geogrids and
subgrade soils are needed to confirm and further understand
the mechanisms causing this phenomenon.
Figure 8. One-third scale MMLS3: (a) schematic, units in mm and (b) MMLS3 mounted on top of a laboratory pavement slab.
International Journal of Pavement Engineering 419
Downloaded By: [Palomino, Angel] At: 15:02 31 March 2009

3.3.3 Accelerated trafficking of slabs
3.3.3.1 APT I. A total of 140,000 MMLS3 traffic
cycles are applied to each section. Rutting accumulation at
specific locations throughout each section is measured and
averaged. Figure 11(a) shows the rutted wheel path for each
section. To shed light on the accumulation of deformation
as trafficking cycles are applied, the measured rutting profile
for section R3 at various traffic cycles is also plotted in
Figure 11(c).
3.3.3.2 APT II. Rutting failure in the APT II test sections
occurs well before 140,000 MMLS3 traffic cycles can be
applied. Hence, MMLS3 trafficking is applied to each
section of the APT II slab until rutting failure occurs.
The control section P1 exhibits extensive deformation
after 40,000 wheel applications, while similar deformation
is observed at 70,000 applications for section P2.
Trafficking is stopped at 100,000 wheel applications for
sections P3 and P4. Figure 11(b) shows the rutted wheel
paths for the fours sections. The extensive rutting and
resulting cracking at the edge of the wheel path for the
control section P1 is clearly visible. The measured rutting
profile for section P3 is also shown in Figure 11(d).
4. Observations and analysis of results
Except for the difference in geogrid products, the
experimental variables are minimised as much as possible
in the bench-scale testing and APT. The subgrade soil,
ABC and asphalt materials are consistent for all tests. It is
therefore reasonable to presume that most of the difference
in the performance is due to the intrinsic properties of
geogrids and their interaction characteristics with the
medium in which they are placed. This section first covers
the observation and analysis of the performance of the
geogrids from accelerated trafficking. An attempt is then
made to find possible correlations among physical and
mechanical properties of geogrids (index properties),
mechanistic parameters from bench-scale testing and
performance from accelerated testing of the scaled slabs.
The comparisons conducted are limited to particular index
Table 4. As-constructed pavement layer properties.
APTSubgrade
thickness (cm)Base course
thickness (cm) AC thickness (cm) Subgrade moisture content (%) Subgrade CBR value (%)
I 23.6 6.6 3.8 14 3II 15.2 6.6 3.8 14.8 1.5
Figure 9. Pavement section layout: (a) dimensions, units in cmand (b) plan view of the section and geogrid installation.
R4
Figure 10. AV content distribution in the asphalt layer: arrows represent compaction path (same for both test sets) and shadingrepresents the range of AV content: (a) APT I and (b) APT II.
X. Tang et al.420
Downloaded By: [Palomino, Angel] At: 15:02 31 March 2009

properties that are deemed important for pavement
applications, i.e. low strain conditions.
4.1 Performance of geogrids – accelerated testing
4.1.1 APT I
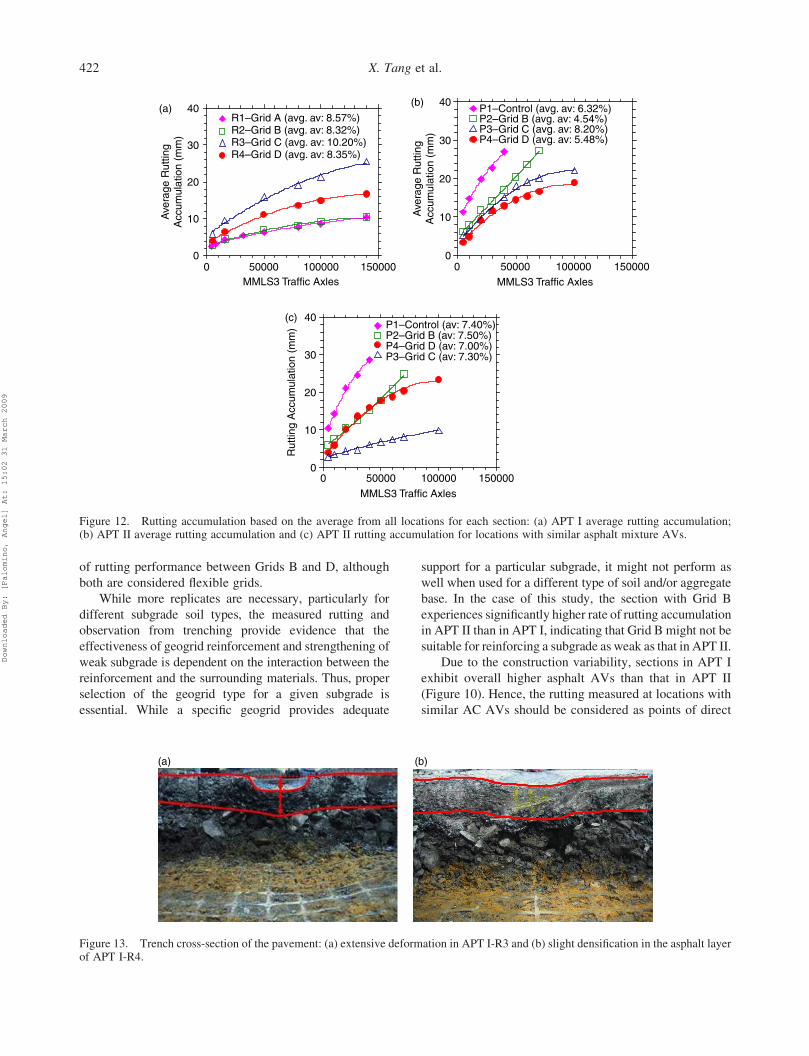
In APT I, themost significant rutting is observed for section
R3 (Grid C), as shown in Figure 12(a). However, this could
partially be attributed to the highAVof theAC layer and the
possible densification of that layer (Figure 10(a)).
By comparing the other three sections R1, R2 and R4
which had relatively similar AV, it is evident that Grids A
and B exhibit similar rutting for this type of subgrade soil,
with higher rutting in section R4 reinforced with Grid D.
After trafficking, the slab is trenched across the travel
direction to expose the pavement cross-section. Figure 13
shows extensive densification occurred in the AC layer of
section R3 with minimal densification occurring in R4.
A significant amount of soil slurry is observed underneath
the wheel path at the geogrid–aggregate base interface,
probably due to soil pumping from the subgrade into the
aggregate base layer during traffic loading.
4.1.2 APT II
The control section P1 exhibits significantly higher rutting
that accumulated relatively quickly (failure occurs at
40,000 cycles) compared to the reinforced sections (failure
between 70,000 and 100,000 cycles). This illustrates the
ability of geogrids to stabilise weak subgrade and potential
to minimise pavement deformation under the traffic load.
Similar to APT I, section P3 reinforced with Geogrid C
exhibits relatively higher rutting among the reinforced
sections, probably due to the higher AVs and consequent
rutting of the AC layer (Figure 12(b)).
In order to minimise the effect of variation in the AV
content of the asphalt layer, the rutting accumulation at
locations with similar compacted asphalt AVs is presented
in Figure 12(c). Section P2 (Grid B) has the second highest
cumulative rutting among the four test sections. The rate of
rutting accumulation for sections P1 and P2 is slightly
higher than that for sections P3 and P4. Significantly
higher rutting is observed for section P4 (Grid D) when
compared to that for P3 (Grid C). Overall, the relatively
stiffer geogrid, Grid C, shows the best performance with
respect to the rutting resistance for the tested pavement on
this specific weak subgrade.
4.1.3 Comparison between APTs I and II
The significant variable in designing the sections of APTs I
and II is the subgrade CBR, with a subgrade CBR of 3 and
1.5 for APTs I and II, respectively. The ranking of the
geogrid products in terms of the ability to minimise
subgrade rutting is somewhat different between APTs I
and II. One noticeable difference is the switch in ranking
Figure 11. Rutting of the wheel paths: (a) APT I and (b) APT II; measured rutting profile at various stages of trafficking for sections:(c) R3 in APT I and (d) P3 in APT II based on the average from all measured locations along the wheel path.
International Journal of Pavement Engineering 421
Downloaded By: [Palomino, Angel] At: 15:02 31 March 2009
of rutting performance between Grids B and D, although
both are considered flexible grids.
While more replicates are necessary, particularly for
different subgrade soil types, the measured rutting and
observation from trenching provide evidence that the
effectiveness of geogrid reinforcement and strengthening of
weak subgrade is dependent on the interaction between the
reinforcement and the surrounding materials. Thus, proper
selection of the geogrid type for a given subgrade is
essential. While a specific geogrid provides adequate
support for a particular subgrade, it might not perform as
well when used for a different type of soil and/or aggregate
base. In the case of this study, the section with Grid B
experiences significantly higher rate of rutting accumulation
in APT II than in APT I, indicating that Grid B might not be
suitable for reinforcing a subgrade as weak as that in APT II.
Due to the construction variability, sections in APT I
exhibit overall higher asphalt AVs than that in APT II
(Figure 10). Hence, the rutting measured at locations with
similar AC AVs should be considered as points of direct
Figure 12. Rutting accumulation based on the average from all locations for each section: (a) APT I average rutting accumulation;(b) APT II average rutting accumulation and (c) APT II rutting accumulation for locations with similar asphalt mixture AVs.
Figure 13. Trench cross-section of the pavement: (a) extensive deformation in APT I-R3 and (b) slight densification in the asphalt layerof APT I-R4.
X. Tang et al.422
Downloaded By: [Palomino, Angel] At: 15:02 31 March 2009
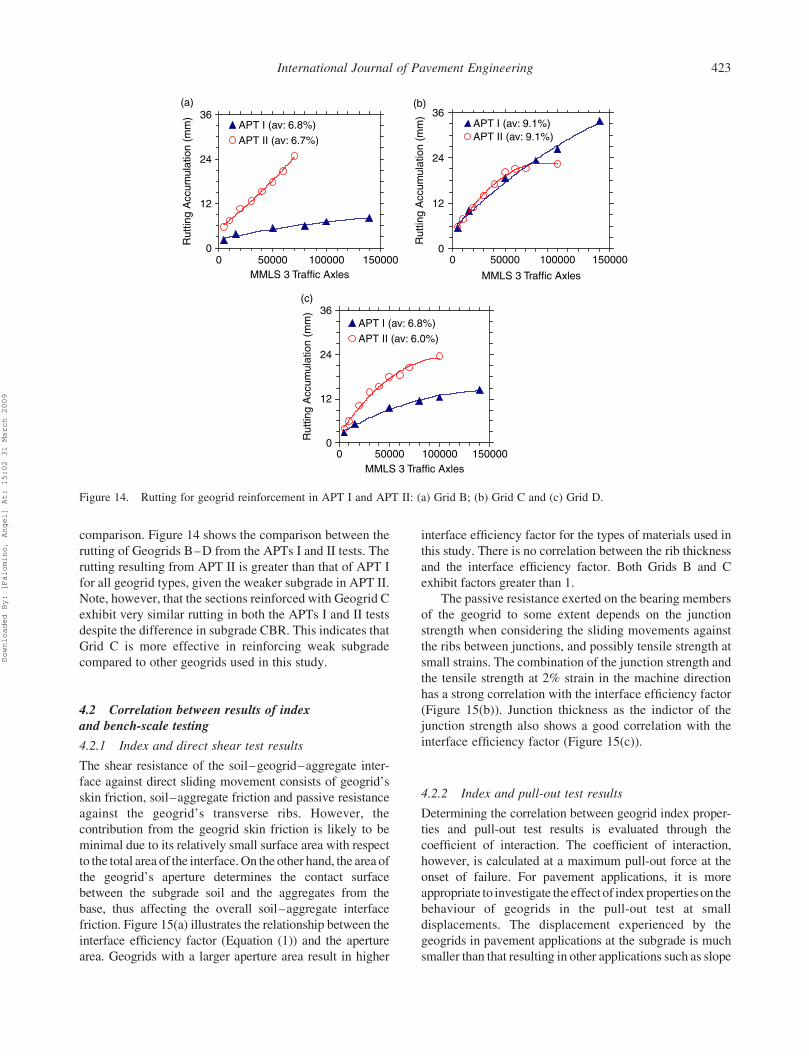
comparison. Figure 14 shows the comparison between the
rutting of Geogrids B–D from the APTs I and II tests. The
rutting resulting from APT II is greater than that of APT I
for all geogrid types, given the weaker subgrade in APT II.
Note, however, that the sections reinforced with Geogrid C
exhibit very similar rutting in both the APTs I and II tests
despite the difference in subgrade CBR. This indicates that
Grid C is more effective in reinforcing weak subgrade
compared to other geogrids used in this study.
4.2 Correlation between results of indexand bench-scale testing
4.2.1 Index and direct shear test results
The shear resistance of the soil–geogrid–aggregate inter-
face against direct sliding movement consists of geogrid’s
skin friction, soil–aggregate friction and passive resistance
against the geogrid’s transverse ribs. However, the
contribution from the geogrid skin friction is likely to be
minimal due to its relatively small surface area with respect
to the total area of the interface.On the other hand, the area of
the geogrid’s aperture determines the contact surface
between the subgrade soil and the aggregates from the
base, thus affecting the overall soil–aggregate interface
friction. Figure 15(a) illustrates the relationship between the
interface efficiency factor (Equation (1)) and the aperture
area. Geogrids with a larger aperture area result in higher
interface efficiency factor for the types of materials used in
this study. There is no correlation between the rib thickness
and the interface efficiency factor. Both Grids B and C
exhibit factors greater than 1.
The passive resistance exerted on the bearing members
of the geogrid to some extent depends on the junction
strength when considering the sliding movements against
the ribs between junctions, and possibly tensile strength at
small strains. The combination of the junction strength and
the tensile strength at 2% strain in the machine direction
has a strong correlation with the interface efficiency factor
(Figure 15(b)). Junction thickness as the indictor of the
junction strength also shows a good correlation with the
interface efficiency factor (Figure 15(c)).
4.2.2 Index and pull-out test results
Determining the correlation between geogrid index proper-
ties and pull-out test results is evaluated through the
coefficient of interaction. The coefficient of interaction,
however, is calculated at a maximum pull-out force at the
onset of failure. For pavement applications, it is more
appropriate to investigate the effect of indexproperties on the
behaviour of geogrids in the pull-out test at small
displacements. The displacement experienced by the
geogrids in pavement applications at the subgrade is much
smaller than that resulting in other applications such as slope
Figure 14. Rutting for geogrid reinforcement in APT I and APT II: (a) Grid B; (b) Grid C and (c) Grid D.
International Journal of Pavement Engineering 423
Downloaded By: [Palomino, Angel] At: 15:02 31 March 2009

stabilisation and retaining walls; moreover, a complete
pull-out of the geogrid does not occur. Thus, for pavement
applications, evaluating the load–displacement relationship
at small displacements is more meaningful to the pull-out
behaviour compared to the coefficient of interaction derived
from a single value of the maximum pull-out load.
With regard to the fact that small strains in geosynthetics
are typically developed for reinforced soil structure
(McGown et al. 2005), it is more relevant to compare the
geogrid’s behaviour and interaction properties, such as
in a pull-out test, at small displacements when they will
be subjected to in the medium and under normal operational
conditions. The displacements of the geogrids for subgrade
stabilisation are expected to beminimal. Figure 16 shows the
load–displacement relationship for the four geogrids up to
5mm displacement. Due to limitations in instrumentation,
unit displacements less than 0.3mm cannot be measured.
Figure 16 shows that within the first 5mm of displacement,
the slope of the pull-out force–displacement curves is nearly
the same for all tested grids. Grid C exhibits the highest pull-
out force at small displacements in spite of its low
interaction coefficient (Table 3). Furthermore, the rankings
in Figure 16 reveal a direct correlationwith the friction angle
and the efficiency factor from direct shear results, with the
exception of Grid D.
Although the index properties of Grid D and its
behaviour from direct shear test are comparable to other
geogrids, particularly Grid A, it is highly likely that the
significantly lower pull-out forces measured are due to
experimental errors, and thus the pull-out results of Grid D
can be considered as an anomaly. This proposition
Figure 15. Correlation between Ef (interface efficiency factor) and geogrid index properties: (a) aperture area; (b) sum of the junctionstrength and the tensile strength at 2% strain in the machine direction and (c) junction thickness.
Figure 16. Pull-out force versus displacement for the variousgeogrid types at small displacements.
X. Tang et al.424
Downloaded By: [Palomino, Angel] At: 15:02 31 March 2009

is confirmed by the fact that the average rutting for the
section with Grid D is not as low as the pull-out force results
suggest, and is actually less than that for all other sections in
APT II (Figure 12(b)). Thus, Grid Dwill not be incorporated
in the investigation of correlations linked to the pull-out
force.
Figure 17 illustrates the correlation between the index
properties and the pull-out force at 5mm. It can be
concluded that an insignificant correlation exists between
the increase in aperture area and flexural rigidity and an
increase in the pull-out force measured at 5mm. Stronger
correlations are observed for tensile strength at 2% strain
and efficiency factor from direct shear.
Figure 18 shows that there is no evident correlation
between the index properties and the coefficient of
interaction. However, it is worth to further discuss the
effect of the aperture area on the interaction coefficient. In
order for effective interlocking of the aggregate–geogrid
skeleton to take place, the ratio of aperture size to
aggregate particle size should allow aggregates to strike
through the aperture. Maximum interaction efforts can be
achieved when the grain size is similar to that of the
Figure 17. Effect of geogrid properties on the pull-out force measured at 5mm displacement.
International Journal of Pavement Engineering 425
Downloaded By: [Palomino, Angel] At: 15:02 31 March 2009

geogrid aperture size (Shukla 2002). As can be seen in
Table 2, the aperture sizes of Geogrids A–D are greater
than 25.4mm (1 in.). The course aggregate gradation
suggests that ,87% of the material passes the 19mm
(0.75 in.) sieve. The surrounding material grain size
distribution, relatively dense graded with nominal
maximum aggregate size of 17.5mm (1/2 in.), may
positively impact that interlock. Grid B has the largest
apertures among the other geogrid products used in this
study (Table 2), which could partially explain its highest
interaction coefficient, Ci (Equation (2)).
4.3 Correlation between index, bench-scale testingand accelerated testing results
Figure 19 shows the relationships between the geogrid
bench-scale test results, namely the coefficient of
interaction and the interface efficiency factor, and the
measured subgrade rutting from the accelerated testing
APTs I and II, while Figure 20 relates the geogrid index
properties to the measured rutting. It is observed that the
effects of ultimate strength, junction strength and bench-
scale testing properties on measured rutting are not
strongly evidenced, possibly due to the dominance of low
Figure 18. Correlation between index properties and coefficient of interaction.
X. Tang et al.426
Downloaded By: [Palomino, Angel] At: 15:02 31 March 2009

cyclic strains occurring in the geogrids at the subgrade
level when compared to high strain levels applied under a
monotonic loading condition until failure in index testing.
In none of the accelerated testing runs are any of the
geogrid samples stretched to a strain limit close to or at
failure based on the observations of geogrids after
trenching. This is in line with observations made from
full-scale sections in the field (Perkins 1999).
Flexural rigidity and aperture area seem to affect the
rutting according to trends that are dependent on the CBR.
For the subgrade soil CBR of 3.0 in APT I, the general
trend shows increased rutting with increases in aperture
area and flexural rigidity. The trend is reversed for APT II,
in which the subgrade soil CBR is 1.5.
The observations above do not offer conclusive
correlations between some index properties, bench-scale
Figure 19. Correlation of mechanistic properties from bench-scale testing with average rutting from APT.
Figure 20. Correlation of geogrid properties from index testing with average rutting from APT.
International Journal of Pavement Engineering 427
Downloaded By: [Palomino, Angel] At: 15:02 31 March 2009
testing properties and measured rutting under trafficking.
More trials and replicates of APT need to be conducted to
evaluate the statistical significance of any observed
correlations and to assess the possibility of statistical
interaction between the properties and their effects on
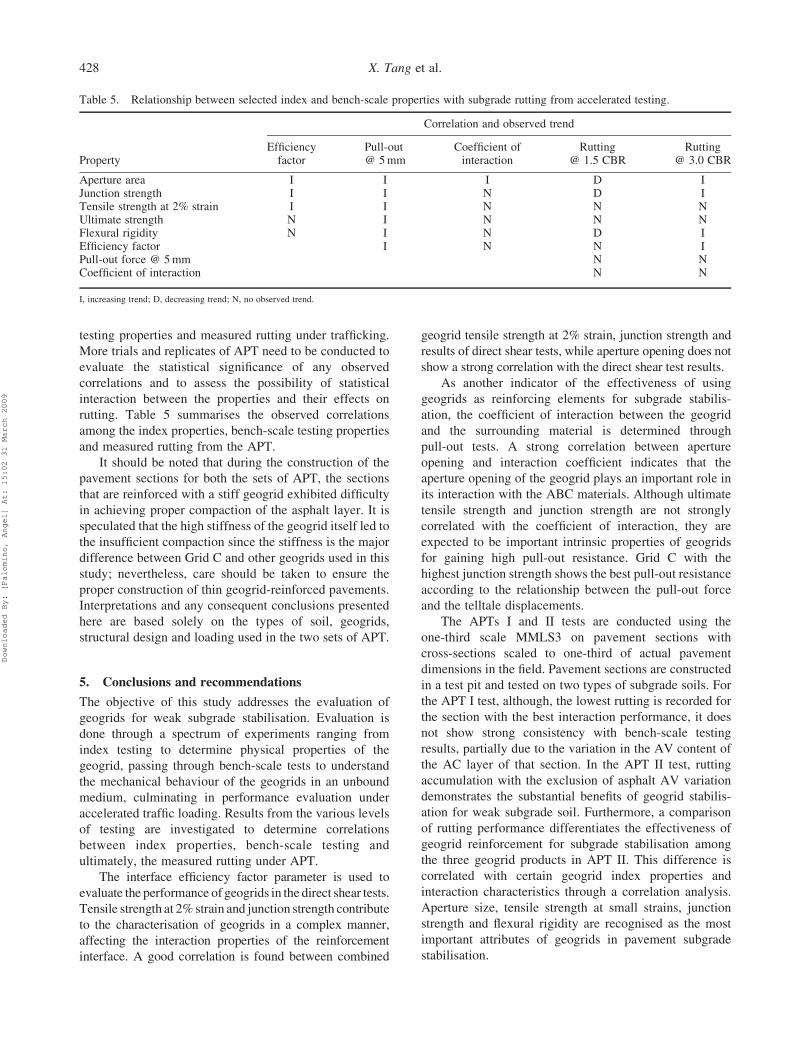
rutting. Table 5 summarises the observed correlations
among the index properties, bench-scale testing properties
and measured rutting from the APT.
It should be noted that during the construction of the
pavement sections for both the sets of APT, the sections
that are reinforced with a stiff geogrid exhibited difficulty
in achieving proper compaction of the asphalt layer. It is
speculated that the high stiffness of the geogrid itself led to
the insufficient compaction since the stiffness is the major
difference between Grid C and other geogrids used in this
study; nevertheless, care should be taken to ensure the
proper construction of thin geogrid-reinforced pavements.
Interpretations and any consequent conclusions presented
here are based solely on the types of soil, geogrids,
structural design and loading used in the two sets of APT.
5. Conclusions and recommendations
The objective of this study addresses the evaluation of
geogrids for weak subgrade stabilisation. Evaluation is
done through a spectrum of experiments ranging from
index testing to determine physical properties of the
geogrid, passing through bench-scale tests to understand
the mechanical behaviour of the geogrids in an unbound
medium, culminating in performance evaluation under
accelerated traffic loading. Results from the various levels
of testing are investigated to determine correlations
between index properties, bench-scale testing and
ultimately, the measured rutting under APT.
The interface efficiency factor parameter is used to
evaluate the performance of geogrids in the direct shear tests.
Tensile strength at 2%strain and junction strength contribute
to the characterisation of geogrids in a complex manner,
affecting the interaction properties of the reinforcement
interface. A good correlation is found between combined
geogrid tensile strength at 2% strain, junction strength and
results of direct shear tests, while aperture opening does not
show a strong correlation with the direct shear test results.
As another indicator of the effectiveness of using
geogrids as reinforcing elements for subgrade stabilis-
ation, the coefficient of interaction between the geogrid
and the surrounding material is determined through
pull-out tests. A strong correlation between aperture
opening and interaction coefficient indicates that the
aperture opening of the geogrid plays an important role in
its interaction with the ABC materials. Although ultimate
tensile strength and junction strength are not strongly
correlated with the coefficient of interaction, they are
expected to be important intrinsic properties of geogrids
for gaining high pull-out resistance. Grid C with the
highest junction strength shows the best pull-out resistance
according to the relationship between the pull-out force
and the telltale displacements.
The APTs I and II tests are conducted using the
one-third scale MMLS3 on pavement sections with
cross-sections scaled to one-third of actual pavement
dimensions in the field. Pavement sections are constructed
in a test pit and tested on two types of subgrade soils. For
the APT I test, although, the lowest rutting is recorded for
the section with the best interaction performance, it does
not show strong consistency with bench-scale testing
results, partially due to the variation in the AV content of
the AC layer of that section. In the APT II test, rutting
accumulation with the exclusion of asphalt AV variation
demonstrates the substantial benefits of geogrid stabilis-
ation for weak subgrade soil. Furthermore, a comparison
of rutting performance differentiates the effectiveness of
geogrid reinforcement for subgrade stabilisation among
the three geogrid products in APT II. This difference is
correlated with certain geogrid index properties and
interaction characteristics through a correlation analysis.
Aperture size, tensile strength at small strains, junction
strength and flexural rigidity are recognised as the most
important attributes of geogrids in pavement subgrade
stabilisation.
Table 5. Relationship between selected index and bench-scale properties with subgrade rutting from accelerated testing.
Correlation and observed trend
PropertyEfficiencyfactor
Pull-out@ 5mm
Coefficient ofinteraction
Rutting@ 1.5 CBR
Rutting@ 3.0 CBR
Aperture area I I I D IJunction strength I I N D ITensile strength at 2% strain I I N N NUltimate strength N I N N NFlexural rigidity N I N D IEfficiency factor I N N IPull-out force @ 5mm N NCoefficient of interaction N N
I, increasing trend; D, decreasing trend; N, no observed trend.
X. Tang et al.428
Downloaded By: [Palomino, Angel] At: 15:02 31 March 2009

By comparing the rutting behaviour among sections in
the two sets of APT, certain geogrid products are found to
be more suitable for use in conjunction with a stronger
subgrade. It is therefore possible that geogrids that meet
the criteria in physical and mechanical properties
identified above will provide sufficient reinforcement for
weak subgrade soils.
Observations and correlations made are limited to the
two types of subgrade soils and one aggregate type used for
subbase. A high number of variables exist in conducting the
accelerated testing, including soil types, geogrid types, base
layer aggregate gradation, moisture conditions and AVs of
asphalt layers, among others. Important variables to
consider include the extent of mixing between the subgrade
soil and the base layer aggregates in addition to the exact
location of the interface with respect to the geogrid after
compaction. Thus, awider scale study should be conducted,
minimising these variables as much as possible and
including instrumentation for displacement measurement
within each layer, strain measurement on the geogrid and
stress at the subgrade.
Notes
1. Email: [email protected]. Email: [email protected]
References
Al-Qadi, I.L., et al., 1994. Laboratory evaluation of geosynthetic-reinforced pavement sections. Transportation ResearchRecord 1439, Washington, DC, 25–31.
Al-Qadi, I.L., et al., 2007. Accelerated full-scale testing ofgeogrid-reinforced flexible pavements. TRB 2007 AnnualMeeting (CD-ROM). Washington, DC: TransportationResearch Board, National Research Council.
Barksdale, R.D., Brown, S.F., and Chan, F., 1989. Potentialbenefits of geosynthetics in flexible pavement systems.National Cooperative Highway Research Program (NCHRP)Report No. 315. Washington, DC: Transportation ResearchBoard, National Research Council.
Bergado, D.T. and Chai, J.-C., 1994. Pullout force/displacementrelationship of extensible grid reinforcements. Geotextileand Geomembrane, 13, 295–316.
Chehab, G.R., Palomino, A.M., and Tang, X., 2007. Laboratoryevaluation and specification development for geogrids for
highway engineering applications. Report No. FHWA-PA-2007-009-050110.
Farrag, K., Acar, Y.B., and Juran, I., 1993. Pull-out resistanceof geogrid reinforcements. Geotextiles and Geomembranes,12 (2), 133–159.
Hass, R., Wall, J., and Carroll, R.G., 1988. Geogridreinforcement of granular bases in flexible pavements.Transportation Research Record 1188. Washington, DC,19–27.
Huang, Y.H., 2004. Pavement analysis and design. Upper SaddleRiver, NJ: Pearson Prentice Hall.
Hufenus, R., et al., 2006. Full-scale field tests on geosyntheticreinforced unpaved roads on soft subgrade. Geotextiles andGeomembranes, 24 (1), 21–37.
Ingold, T.S., 1983. Laboratory pullout testing of gridreinforcements in sand. Geotechnical Testing Journal, 6 (3),101–111.
Jewell, R.A., et al., 1984. Interaction between soil and geogrids.Proceedings of the conference on polymer grid reinforce-ment. London: Thomas Telford, 18–30.
Juran, I., et al., 1988. Pull-out response of geotextiles andgeogrids (synthesis of available experimental data). Proceed-ings of symposium on geotextiles for soil improvement.ASCE, GSP No.18. Reston, VA: ASCE, 92–111.
Koerner, R.M., 1998. Designing with geosynthetics. 4th ed.New Jersey: Prentice Hall.
Love, J.P., 1984. Model testing of geogrids in unpaved roads.Dissertation (Doctoral). University of Oxford, Oxford, UK.
Martin, A.E., et al., 2003. Pavement response and rutting forfull-scale and scaled APT. Journal of TransportationEngineering, 129 (4), 451–461.
McGown, A., et al., 2005. Testing biaxial geogrids forspecification and design purposes. GRI-18 GeosyntheticsResearch and Development in Progress. Conference atGeoFrontiers, Reston, VA, ASCE.
Metcalf, J.B., 1996. Application of full-scale acceleratedpavement testing. NCHRP Synthesis of Highway PracticeNo. 235. Washington, DC: Transportation Research Board,National Research Council.
Mohiuddin, A., 2003. Analysis of laboratory and field pull-outtests of geosynthetics in clayer soils. Thesis. Louisiana StateUniversity, Baton Rouge, Louisiana.
Perkins, S.S., 1999. Geosynthetic reinforcement of flexiblepavements: laboratory based pavement test sections. ReportNo. FHWA/MT-99-001/8138. US Department of Transpor-tation, Federal Highway Administration, Washington, DC.
Shukla, S.K., 2002. Geosynthetics and their applications.London: Thomas Telford.
Tatlisoz, N., Edil, T.B., and Benson, C.H., 1998. Interactionbetween reinforcing geosynthetics and soil-tire chipmixtures. Journal of Geotechnical and GeoenvironmentalEngineering, 124 (11), 1109–1119.
International Journal of Pavement Engineering 429
Downloaded By: [Palomino, Angel] At: 15:02 31 March 2009