Embed Size (px)
Citation preview

1
EVALUATION OF EVAPOTRANSPIRATION-BASED AND SOIL-MOISTURE-BASED IRRIGATION CONTROL IN TURF
Arjun Vasanth1, Garry L.Grabow1, Dan Bowman2, Rodney L. Huffman1, and Grady L.
Miller2 1Department of Biological and Agricultural Engineering
2Department of Crop Science North Carolina State University
ABSTRACT
A study was initiated in Fall of 2006 to compare two types of commercially available irrigation control technologies, one based on estimates of evapotranspiration (ET) and the other based on feedback from soil moisture sensors. Water applied and turf quality from one ET-based system and two sensor-based systems were compared to a standard time-based irrigation schedule. Irrigation frequency was also a component of the study. Estimates of turf ET were obtained from the Penman-Monteith equation using on-site weather data, and also from an atmometer. On average the “add-on” soil-moisture-based system applied the least amount of water while the ET-based treatment applied the most water. Once-a-week irrigation frequencies used the least amount of water and daily frequencies the most when averaged across all technologies. In general, minimally acceptable turf quality was maintained by all technologies and frequencies, although during the last month of the study some treatments became noticeably stressed. The “on-demand” sensor-based system resulted in the best combination of water efficiency and turf quality.
INTRODUCTION
Turfgrass is a major part of the urban and sub-urban landscape in the state of North Carolina, with acreage equal to 44% of the state’s harvested crop acreage (NCDA 2001). North Carolina residences using irrigation systems increased 29.4% between 1994 and 1999 (NCDA, 2001). With drought a recurring problem, several municipalities in North Carolina have imposed water-use restrictions on turf and landscape irrigation.
Variability and irregularity in rainfall make irrigation scheduling difficult in North Carolina and an efficient irrigation schedule (applying the right amount of water at the right time) is essential in meeting the dual goals of water conservation and acceptable turf quality. Under-irrigation and over-irrigation can negatively affect turfgrass quality (Cardenas-Lailhacar et al., 2005) and over-irrigation results in waste of water and leaching of nutrients. With increasing competition for water resources, controllers that use feedback technologies show promise for improved water management.
So-called “smart” irrigation technologies can be separated into two categories - those that use a feedback sensor to monitor the amount of moisture in the root zone, and those that use weather data and a soil-water budget to adjust irrigations.
Controller clock systems are an essential part of automated turf irrigation systems. There are two types of controller systems; open loop systems and closed loop systems. In the open loop system, the operator decides on the amount of water that will be applied
244

2
and when the irrigation will occur. This information is programmed into the controller and water is applied accordingly. Open loop systems normally have a clock to start irrigation. In a closed loop system, the operator develops a general control strategy using feedback from various sensors. The controller uses sensor data to make detailed decisions of when to apply water and how much to apply (Zazueta et al., 2002; Boman et al. 2002).
The simplest form of closed loop irrigation system is an irrigation system that is controlled by a soil moisture sensor. The sensor is wired in series with the electrical solenoid valve. The sensor acts as a switch opening the circuit between the controller and the valve when the water content is high preventing any pre-programmed irrigation and closing the circuit when watering is needed.
Another type of system used in turfgrass irrigation control is based on controllers that use weather information to estimate ET and adjust irrigation using a soil-water budget. An ET controller can make adjustments to the watering schedule based on weather conditions without requiring human interaction. ET controllers receive information from local or on-site weather stations and adjust watering durations to match ET.
The objective of the research presented in this paper is to compare two general types of commercially available irrigation control technologies; one based on estimates of evapotranspiration (ET) and the other based on feedback from soil moisture sensors. Water use and turf quality from these technologies were compared to results from a standard time based irrigation schedule. The study also incorporates the effect of irrigation frequency.
MATERIALS AND METHODS
This study was initiated in Fall 2007 at the North Carolina State University Lake
Wheeler Turf Field Laboratory, Raleigh, North Carolina. The soil is a Cecil sandy loam (fine, kaolinitic, thermic Typic Kanhapludults), having a field capacity of approximately 32% by volume.
The experiment site was established to `Confederate’ tall fescue (Festuca arundinacea Schreb) using sod. Forty 13ft x 13ft plots were irrigated independently by four quarter circle pop-up spray head sprinklers (Toro 570 12’ series with 23º trajectory) with a discharge rate of 0.5gpm at 30 psi. Prior to sodding, the field site was leveled and the irrigation system installed. The irrigation system uses water from a nearby irrigation pond that is filtered with a 60 mesh filter and pressure regulated at 30 psi. Water meters (5/8 in x 3/4 in, 20 gpm max flow, 5 gallons per pulse, AMCO Water Metering Systems Inc. Ocala, Florida) measure flow to four plots each, and flow to each plot is controlled by a separate solenoid valve.
A transformer (Model no: 9070TF100, 100Va 24volts, Square D) was installed to power 4 zones since the irrigation controller clocks do not have sufficient power to activate them simultaneously. An anemometer was connected to the datalogger to log wind data and also to interrupt the power supply if wind exceeded 10 mph during irrigation. This ensured that water did not drift to adjacent plots. A weather station (Watchdog 700, Spectrum Technologies, Plainfield, Illinois) was installed at the site to record weather data and estimate reference evapotranspiration by the Penman-Montieth method. A separate tipping bucket rain gauge was logged by the CR10X logger, and a
245

3
recording atmometer with a #30 canvas cover to simulate grass reference ET (ET0) was installed on site.
Experimental Design and Monitoring
Two factors, control technology and irrigation frequency, were examined in this study. The irrigation control treatments included a standard time-based controller programmed with historical ET data, an ET controller system and two soil moisture sensor feedback systems.
Two soil moisture sensor based systems, the Acclima Digital TDT RS-500 and CS-3500 (Acclima Inc., Meridian, Idaho) were selected for evaluation of soil moisture sensor based systems. The RS-500 soil-moisture feedback system is designed as an “add-on” system to be added to any standard irrigation clock. A single soil-water content setpoint is used to prevent irrigation when the soil-water content is above the setpoint. The CS-3500 system is an “on-demand” system that uses two soil-water content setpoints, one to initiate irrigation and one to terminate irrigation. An Intellisense TIS-240 series (Toro Inc) controller was chosen as the ET-based system. Rain sensors (Irritrol Systems Inc., Riverside, Calif.) were added to the Intellisense controller and the standard time based controller. All treatments, except the on-demand system, were set to water daily, twice a week, or once a week.
There were ten treatments combining control type and watering frequency (3 technologies x 3 frequencies + 1 on-demand technology), with four replicates of each arranged in a randomized complete block design (figure 1). All the plots in the second block (rep) were individually monitored for soil-water content by Acclima digital TDT sensors. These sensors were wired to the Acclima CS3500 system to record soil moisture every 10 minutes. Monitoring sensors where placed 12 inches from control sensors for those plots using sensor feedback. The ten water meters were logged by a Campbell Scientific CR10X and a pulse count multiplexer (Campbell Scientific Inc., Logan, Utah). Irrigations were scheduled such that only one of the four plots served by each water meter was irrigated at one time.
All controllers except the ET controller were programmed to start between 0030 and 0600 hrs, to reduce potential wind drift and decrease evaporation. The ET controller was allowed to irrigate only after the other treatments were irrigated (after 0600 hr) so that flow through the water meters could be traced to the ET controller as irrigation durations of the ET controller constantly changed.
Turf quality was rated weekly using the standard turf quality index. This index is based upon a 1-9 scale with 9 representing the best possible turf quality. Turf quality was assessed once a week in the morning to minimize confounding of temperature-induced stress. Canopy temperatures were taken once a week late in the afternoon in sunny conditions to maximize temperature differences between treatments. Twenty weeks of water use data were collected while fifteen weeks of turf quality and canopy temperature were recorded.
246

4
Figure 1. Site schematic showing plot layout and irrigation treatments
Standard timer-based irrigation
These treatments represent an average homeowner system set to apply water at a fixed interval (1, 2, 7x per week) and duration to replace the historical irrigation requirement (adjusted monthly) of a cool season turf. A rain switch was set with a different threshold for each frequency treatment (1x – 0.75 in, 2x – 0.50 in and 7x – 0.25 in). Monthly long-term gross irrigation requirements based upon local 30 year climate averages are given in table 1.
247

5
Soil moisture-based add-on system (one setpoint) Soil-moisture feedback sensors were placed in block 2 plots of each irrigation
frequency and connected to the Acclima RS500 modules. These modules were connected to a Toro controller with three independent programs similar to the time based controller. The controller was set to apply the same amount of water as the standard time-based system. The RS500 system has a Time Domain Transmissivity (TDT) moisture sensor that measures the volumetric moisture percentage of the soil and prevents irrigation above a user-supplied moisture content. The volumetric soil-water setpoint used in this study was 24%, equivalent to 75% of field capacity per manufacturer directions. Table 1 Monthly long-term reference ET, turf ET, precipitation, effective precipitation, net irrigation requirement, and gross irrigation requirement (inches)
Month ETo ETc1 Precipitation Eff. Ppt.2 NIR3 GIR4 April 5.91 4.72 2.59 1.56 3.17 3.96 May 6.94 5.56 3.92 2.32 3.23 4.04 June 6.67 5.34 3.68 2.08 3.26 4.08 July 7.43 5.95 4.01 2.46 3.49 4.36 August 6.87 5.50 4.02 2.36 3.14 3.92 September 5.54 4.43 3.19 1.74 2.69 3.36
1 ETc = ET0 x crop coefficient (kc). A kc of 0.8 was used for cool season turf 2 Effective precipitation calculated using the SCS-TR21 method 3 Net irrigation requirement (NIR)= ETc-Eff. Ppt. 4 Gross irrigation requirement (GIR) = NIR/0.8. (Field determined CU = 80%). Soil moisture based on-demand system (two setpoints)
The Acclima CS3500 soil moisture feedback controller system uses the same sensor as the RS500 system; however it is designed as a “water on demand” system. The upper and lower setpoints were set at 30% and 21% volumetric moisture, respectively, with the lower setpoint (turn-on) corresponding to a depletion of 67% of plant-available soil water, and the upper setpoint (turn off) being just below field capacity. Cycle and soak times of 10 minutes were programmed to allow for water infiltration and movement to the sensor.
248
6
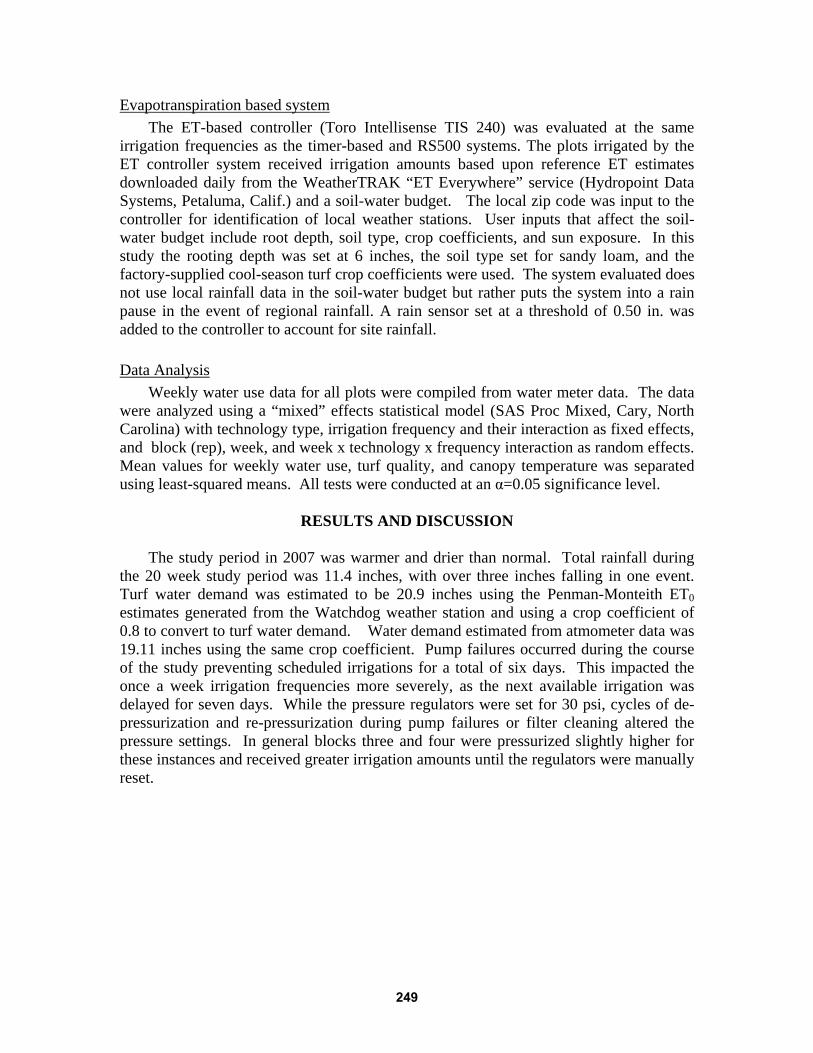
Evapotranspiration based system The ET-based controller (Toro Intellisense TIS 240) was evaluated at the same
irrigation frequencies as the timer-based and RS500 systems. The plots irrigated by the ET controller system received irrigation amounts based upon reference ET estimates downloaded daily from the WeatherTRAK “ET Everywhere” service (Hydropoint Data Systems, Petaluma, Calif.) and a soil-water budget. The local zip code was input to the controller for identification of local weather stations. User inputs that affect the soil-water budget include root depth, soil type, crop coefficients, and sun exposure. In this study the rooting depth was set at 6 inches, the soil type set for sandy loam, and the factory-supplied cool-season turf crop coefficients were used. The system evaluated does not use local rainfall data in the soil-water budget but rather puts the system into a rain pause in the event of regional rainfall. A rain sensor set at a threshold of 0.50 in. was added to the controller to account for site rainfall. Data Analysis
Weekly water use data for all plots were compiled from water meter data. The data were analyzed using a “mixed” effects statistical model (SAS Proc Mixed, Cary, North Carolina) with technology type, irrigation frequency and their interaction as fixed effects, and block (rep), week, and week x technology x frequency interaction as random effects. Mean values for weekly water use, turf quality, and canopy temperature was separated using least-squared means. All tests were conducted at an α=0.05 significance level.
RESULTS AND DISCUSSION
The study period in 2007 was warmer and drier than normal. Total rainfall during the 20 week study period was 11.4 inches, with over three inches falling in one event. Turf water demand was estimated to be 20.9 inches using the Penman-Monteith ET0 estimates generated from the Watchdog weather station and using a crop coefficient of 0.8 to convert to turf water demand. Water demand estimated from atmometer data was 19.11 inches using the same crop coefficient. Pump failures occurred during the course of the study preventing scheduled irrigations for a total of six days. This impacted the once a week irrigation frequencies more severely, as the next available irrigation was delayed for seven days. While the pressure regulators were set for 30 psi, cycles of de-pressurization and re-pressurization during pump failures or filter cleaning altered the pressure settings. In general blocks three and four were pressurized slightly higher for these instances and received greater irrigation amounts until the regulators were manually reset.
249

7
Standard time based irrigation system Cumulative net irrigation for the three frequencies were; once a week – 16.88 inches
twice a week – 16.92 inches and daily – 15.62 inches. The values for the cumulative irrigation are nearly the same for the three frequencies as they were programmed to apply the same irrigation amounts weekly and only differed in the setting of rain sensor threshholds. The daily treatment skipped irrigation on 28 occasions (22 due to the rain sensor override and 6 due to pump failures). Acclima add-on system (one setpoint)
The Acclima add-on system used less water than the timer based system. This was due to the volumetric soil water content being above the setpoint on several occasions when irrigation was scheduled. The cumulative gross irrigation amounts were, once a week – 8.56 inches twice a week – 12.81 inches and daily – 13.87 inches. Figure 2 shows rainfall, irrigation and the soil-water content for the system set to irrigate daily. The lower amount of applied water for the daily irrigation is mainly because of a higher proportion of skipped irrigation opportunities. The daily irrigation treatment skipped 34 potential irrigations.
Figure 2. Soil-water content, rain, and irrigation for the Acclima add-on system set to irrigate daily. The horizontal dashed line represents the setpoint above which irrigations were disabled. Dots represent soil-water measured by the control sensor. This sensor was placed 12 inches from the monitoring sensor.
250

8
Acclima on-demand system (two set-point) The cumulative gross irrigation over the twenty week period was 17.64 inches. The
Acclima CS3500 system failed twice during the experimental study once on the 14th of May and again on the 12th of June. No soil-water data was collected by the monitoring (continuous) sensors for all the treatments from 14-18 May and 12-18 June. No irrigation occurred for the on-demand treatment during these periods. Figure 3 shows soil-water content, irrigation and rainfall during the study period.
Figure 3. Soil-water content, rain, and irrigation for the Acclima on-demand system set to allow irrigation daily. The horizontal dashed lines represents the upper and lower setpoints
ET controller system
The cumulative gross irrigation amounts over the twenty week study period were once a week –16.27 inches, twice a week – 24.54 inches and daily – 25.66 inches. These amounts were substantially higher than most of the other treatments. The high values for the twice a week and daily frequencies may have been because the system did not account for the local rainfall events that occurred. It also appeared that the reference ET estimates of the system were high. The once a week gross irrigation amount was not as high as the twice a week or daily amounts because the controller limited the application to the amount that could be stored in the 6 inch root zone. The cumulative irrigation application for all treatments and frequencies are given in table 2.
251

9
Figure 4. Soil-water content, rain, and irrigation for the Intellisense TIS 240 controller set to irrigate twice a week.
Table 2. Cumulative gross irrigation depth (inches) applied between 22nd April and 8th September 2007
Technology
frequency once a week twice a week Daily
Timer1 16.88 16.92 15.62 AC12 8.56 12.81 13.87 ET3 16.27 24.54 25.66
On demand system Ac24 17.64
1 Standard timer-based treatment 2Acclima add-on system (one setpoint) 3Toro TIS-240 Intellisense controller 4Acclima on-demand system (two setpoint)
252

10
Weekly water application Analysis of variance revealed that the technology effect, frequency effect and their
interaction were all significant. The lsmeans estimates for weekly total applied water are given in table 3.
Comparison between technologies: The means of the technologies were different when compared across frequencies. The Acclima add-on system applied the least water while the ET system applied the most water. Table 3 Least-squared mean estimates for average weekly total applied water, inches1
Frequency
once a week twice a week Daily Average of Frequencies
Ac2 on demand system 0.85b Ac1 0.44a 0.68b 0.72bc 0.62a
Technology ET 0.79cd 1.24e 1.37e 1.13c Tim 0.94d 0.90d 0.83cd 0.89b
Average of
Technologies 0.72a 0.94b 0.97b - 1Numbers with the same letters in the last row represent no significant difference in frequencies across all technologies; numbers with the same letters in the far right column indicate no statistically significant difference between technologies across all frequencies; and numbers in the body of the table with the same letters indicate no statistically significant difference between technology x frequency combinations. Comparison between frequencies: Similar analysis of different frequencies across technologies showed that the once a week treatments were significantly different from both the twice a week and daily frequency treatments. On average the once a week schedules used the least amount of water followed by twice a week frequency and then the daily treatment. Technology by Frequency Comparisons: The Acclima add-on system (Ac1) at a once a week frequency applied the least amount of water, followed by the twice a week and daily Ac1 treatments. The once a week ET treatment, was not statistically different than the Ac1 daily treatment or any of the timer-based treatments. The ET controller at twice a week and daily frequencies applied the most water. Canopy Temperature
The statistical model was similar to that used for water use. There were significant differences in canopy temperature between treatments. ET treatments had the lowest temperatures and the Ac1 treatments had the highest temperatures. The temperatures were inversely correlated to applied water. There were no differences in average canopy temperatures between frequencies across technologies.
253

11
Turf Quality The means of the turf quality ratings were not statistically different for most of the
treatments and frequencies and the minimum acceptable turf quality (4-6) was met by all the plots. Though the plots had healthy turf for most of the experimental period, quality declined in some of the treatments in the last month of the study when the daily ET values were high and no appreciable rainfall occurred. In addition there were six days when irrigation did not occur due to pump failures. Some plots suffered from the effects of substantial soil cuts that occurred when the two terraces were built and leveled. This seemed to affect both fertility and soil physical properties (infiltration rate and water holding capacity). The plots that looked the worst also had the highest canopy temperatures. Since the statistical model include block (rep) as a random effect, the effect of the cuts and fills on turf quality were blocked as the cuts and fills tended to be associated with certain blocks. Table 4 Least-squared mean estimates for turf quality1
frequency
once a week Twice a week Daily Average of
Frequencies Ac2 on demand system 8.97a Ac1 8.37b 8.45b 7.83c 8.22d
Technology ET 8.33b 8.5b 8.87a 8.57b Tim 7.9c 8.58b 8.96a 8.36c
Average of Technologies 8.22b 8.52a 8.43a -
1Numbers with the same letters in the last row represent no significant difference in frequencies across all technologies; numbers with the same letters in the far right column indicate no statistically significant difference between technologies across all frequencies; and numbers in the body of the table with the same letters indicate no statistically significant difference between technology x frequency combinations.
CONCLUSIONS
• The Acclima water on demand system was the most effective system applying less than the ET controller while maintaining excellent turf quality. This system is expensive but maybe ideal for commercial landscaping applications.
• The Acclima add-on systems can reduce water use, but if the timer is not programmed to apply enough water, turf quality can suffer as it operates on prohibiting irrigation rather than initiating irrigation. These systems may be more effectively used by setting the controller to daily apply an amount equal to a management allowable depletion, e.g. 25% of field capacity with a setpoint of 75% of field capacity, and letting the system override scheduled irrigation events until that condition is met. In this study, the daily frequency was set to apply a maximum of only 0.15 inches or 8% of field capacity to satisfy a long-term daily irrigation requirement. Since the season was warmer and drier than normal, the system “fell behind”.
254

12
• The Toro Intellisense controller followed trends in weather, but applied more water than required. The use of more representative weather stations or adjustment of the controller would be beneficial for water conservation. Quality of turf irrigated by this system was excellent.
• “Smart” irrigation technologies hold promise for efficient irrigation by conserving water while maintaining acceptable turf quality.
REFERENCES
Boman, B., S. Smith and B. Tullos. 2002. Control and automation in citrus microirrigation systems. Institute of Food and Agricultural Science, University of Florida Gainesville, FL. Document no CH194.
Cardenas-Lailhacar, B., M.D. Dukes and G.L. Miller 2005. sensor based control of irrigation in Bermudagrass. ASAE. Paper no: 052180. Tampa, Fl: ASAE.
NCDA. North Carolina Turfgrass survey. 2001. North Carolina Department of Agriculture and Consumer Services.
Zazueta, F.S., A.G. Smajstrla and G.A. Clark. 2002. Irrigation system controllers. SS-AGE-22. Institute of Food and Agricultural Sciences, University of Florida, Gainesville, FL. Available at http://edis.ifai.ufl.edu/AE097.
255