Embed Size (px)
Citation preview

Evaluating the Importance of Strength, Power, and Performance Tests in an NCAA Division I Football Program.
By Jack B. Johnson Jr.
Dissertation submitted to the Graduate Faculty of the Virginia Polytechnic Institute and
State University in partial fulfillment for the degree of
DOCTOR OF PHILOSOPHY
In
Curriculum and Instruction
APPROVED:
_______________________ Charles R. Baffi, Chairman
__________________ __________________ Roy M. Gentry Kurt Eschenmann ___________________ ___________________ Richard K. Stratton Kerry J. Redican
Keywords: Power, Speed, Strength
November, 2001
Blacksburg, Virginia

ii
Evaluating the Importance of Strength, Power, and Performance Tests between Starters and Non-starters in
An NCAA Division I Football Program
By Jack B. Johnson Jr.
ABSTRACT
Strength and conditioning professionals spend a great deal of time and effort trying to improve athletic performance. Even as coaches evaluate each athlete by using the results of a vast battery of tests, there has been considerable speculation and discussion about the physical attributes of Division I football players and their playing status. The purpose of this study was to determine what influence strength, power, and performance tests scores have on an individual’s playing status. One hundred and five football players from Virginia Tech, between the 1994 and the 2000 season were used in this study. The subjects had to be in the Virginia Tech strength and conditioning program for at least 4 years and in their last year of competition. The subjects were classified as “starters” or “non-starters” according to their playing status. The subjects were grouped into one of three groups. The three groups were the Skill group, Combo group, and the Line-of-Scrimmage (L.O.S.) group. Each subject participated in a series of tests conducted by the strength and conditioning staff. Starters and non-starters were compared to each other on 6 different tests and bodyweight. The tests used in this study consisted of the bench press, back squat, power clean, push jerk, vertical jump, 40-Yard dash, and bodyweight. The tests were ranked in order of importance, by using a Proc StepDisc statistical procedure, from highest to lowest for each of the three groups. The results of the Proc StepDisc statistical procedure showed that there are distinct rankings for each group. The Skill group rank ordering were: 1) vertical jump, 2) power clean, 3) 40-Yard dash, 4) back squat, 5) bodyweight, 6) push jerk, 7) bench press. The Combo group rank ordering were: 1) 40-Yard dash, 2) bodyweight, 3) bench press, 4) back squat, 5) vertical jump, 6) push jerk, 7) power clean. The L.O.S. group rank ordering were: 1) bodyweight, 2) vertical jump, 3) bench press, 4) back squat, 5) power clean, 6) push jerk, 7) vertical jump. The Skill group results indicate that power is the most important factor differentiating between starters and non-starters. Simultaneously, the Combo group results indicate that speed is the most important factor differentiating between starters and non-starters. Also, the L.O.S. group results indicate that bodyweight is the most important factor differentiating between starters and non-starters.

iii
ACKNOWLEDGMENTS A debt of gratitude is owed to all members of the committee: Dr. Charles Baffi
(Chair), Dr. Mike Gentry, Dr. Kurt Eschenmann, Dr. Richard Stratton, and Dr. Kerry
Redican. Without their help and support this project would not have been possible.
Statistical advisors Dr. Morgan and Mr. Keunypo Kim and editing advisor Christine Bala
were invaluable to me in this endeavor.
A special thanks is extended to my family and friends who have helped me during
this time of study. Their support and assistance have helped my tremendously during the
time of this study.
I also extend my appreciation to the Virginia Tech Football Team and Strength
and Conditioning Staff whose cooperation and support have made this project a reality.

iv
TABLE OF CONTENTS
Page
ABSTRACT ii ACKNOWLEDGMENTS iii LIST OF TABLES vi INTRODUCTION 1 Introduction 1 Statement of the Problem 4 Research Questions 5 Purpose 5 Research Hypothesis 5 Limitations 6 Significance of the Study 7 Definitions 7 REVIEW OF LITERATURE 9 Introduction 9 Program Objectives and Goals 10 Testing and Evaluation 12 The Age Factor 14 Bodyweight and Performance 16 The Placement of Athletes into Position Groups 18 Comparisons of Football Players by Positions 19 Comparisons of Starters vs. Non-starters 23 Speed 26 The Vertical Jump as a Test of Power 27 Summary 28 METHODS 30 Subjects 30 General Method 32 Tests 32 Instruments and Apparatus 34 Procedures 35 Testing 37 Data Analysis and Statistical Treatment 38

v
RESULTS 39 Results for Skill Group 39 Results for Combo Group 41 Results for L.O.S. Group 42 DISCUSSION,CONCLUSIONS,RECOMMENDATIONS,and IMPLICATIONS 45 Introduction 45 Skill Group Discussion 46 Combo Group Discussion 49 L.O.S. Group Discussion 53 Conclusions 55 Possible Future Studies and Recommendations 56 Implications for the Strength and Conditioning Coach 57 REFERENCES 58 APPENDIX A 64 APPENDIX B 73 APPENDIX C 78 APPENDIX D 84 CURRICULUM VITAE 85

vi
LIST OF TABLES
Table Page 1 Subjects Categorized into Position Groups 31 2 Number of Athletes in Each Group 31 3 Step 1 of Proc StepDisc Prcedure for the Skill Group 40 4 Rank Ordering of Tests for the Skill Group 40 5 Step 1 of Proc StepDisc Procedure for the Combo Group 41 6 Rank Ordering of Tests for the Combo Group 42 7 Step 1 of Proc StepDisc Procedure for the L.O.S. Group 43 8 Rank Ordering of Tests for the L.O.S. Group 44 9 Descriptive Data for All Subjects 73 10 Descriptive Data for Non-Starters 73 11 Descriptive Data for Starters 74 12 Descriptive Data for Skill Group 74 13 Descriptive Data for Combo Group 74 14 Descriptive Data for L.O.S. Group 75 15 Descriptive Data for Non-Starters in Skill Group 75 16 Descriptive Data for Starters in Skill Group 75 17 Descriptive Data for Non-Starters in Combo Group 76 18 Descriptive Data for Starters in Combo Group 76 19 Descriptive Data for Non-Starters in L.O.S. Group 76 20 Descriptive Data for Starters in L.O.S. Group 77

vii
21 Skill Group Results (Step Table) 78 22 Combo Group Results (Step Table) 80 23 L.O.S. Group Results (Step Table) 82

Chapter I
INTRODUCTION
The sport of football is one of the most popular sports in the United States. We, as fans, are amazed at
the size and the strength of the athletes who play this physical game. The sport of football, at the Division I
level or professionally, is comprised mainly of athletes of uncharacteristic size, speed, and strength. Strength
and conditioning programs have helped many athletes become stronger, faster, and, in some cases, larger.
These programs have also succeeded in providing athletes with the ability to enhance their performance. “It is a
commonly accepted fact that many football skills can be enhanced through proper strength training and
conditioning. Although one repetition maximum strength tests and related assessments such as sprint and jump
tests are not measures of football ability, they are believed to reflect the physical performance characteristics
representative of football playing potential” (Fry & Kramer, 1991, p. 126).
Outside of practice, football players at the Division I level spend a great deal of time and effort in
training sessions that are conducted by strength and conditioning coaches. These training sessions are designed
to make the football athlete stronger, more powerful, quicker, faster, and in some cases larger. These
resistance-training programs are designed to enhance the performance of the athletes. A strength and
conditioning program is an important fixture in the career of a football player. The effectiveness of a well-
developed strength and conditioning program that is designed to improve the athlete’s physical development
and his performance on the field has been documented through scientific research. The program design needs
to consist of research-based and scientifically proven principals that will yield significant benefits (Pearson
Faigenbaum, A., Conley, M. & Kraemer, W.J., 2000).
Athletes spend a lot of time and effort trying to improve their athletic performance. Strength and
conditioning coaches have helped these athletes achieve a high level of athletic performance through resistance
training. This training is used to help improve the athlete’s strength, power, flexibility, and speed. The

Johnson 2
improvement of all or one of these factors may help in enhancing the athlete’s performance on his or her
respective playing field or court (Pearson & Gehlsen, 1998). Resistance training has had a major impact on the
physical characteristics and the performance characteristics of football players. This impact is representative of
Arthur & Bailey’s (1998) explication on the history of the performance of football players: “The improvement
of performance in football over the past few years has been phenomenal. Twenty years ago, the average
lineman weighed 240 to 250 pounds and ran a 5.2-second 40-yard dash. This was considered to be nearing the
genetic potential for a player. Now running backs that weigh 240 pounds are running 4.4-second 40-yard
dashes. Strength training has made the single, most positive contribution to this improvement. Today sports
conditioning and strength training influence every football program in the country. Players now find it
necessary to lift weights and do conditioning drills to better prepare themselves for the competitive rigors of a
football season” (Arthur & Bailey, 1998, p. 82 ).
Evaluating an athlete’s performance tests is a very common occurrence for many strength and
conditioning professionals. For a couple of decades researchers and coaches have taken test scores and used
them to predict the potential of an athlete. In the sport of football everything is measured and evaluated. These
evaluations may lead to some position changes in some of the athletes. Testing athletes in physical performance
tests is extremely important to the evaluation process of NCAA Division I athletes.
Testing athletes may provide the coach with information about the physical attributes of the players.
This information may be used as a predictor of the athlete’s playing status. This information may also give the
coaches information about the physical conditioning of the players. The information can then be processed in a
manner to help make accurate evaluations of the athletes.
The physical attributes of Division I football players are measured in a variety of ways by a battery of
very different tests designed to assess an athlete’s ability to perform a certain skill or function. For example,
testing football players provides a way to assess their ability to play the sport of football. “One reason for

Johnson 3
testing is to assign positions and ranking. All coaches want to be sure they are putting their best athletes in the
game” (Graham, 1994).
In 1994, Arce identified two main objectives for the evaluation of athletes. The first is to determine
whether the athlete has the strength, power, and skill to play the game. The second is to evaluate whether the
athlete is making gains in his or her training program.
Testing athletes can help a coach determine the potential of a player to play at a certain position.
Testing also provides a way to evaluate an athlete’s ability or potential to perform specific skills needed to excel
in their respective positions. Coaches often use these tests to evaluate not only athletic ability but as a predictor
of the potential for injuries that may arise during the season. In addition, testing will also help the strength and
conditioning staff to develop individual programs for the athletes who may be injured or need assistance in
certain areas of training. Strength and conditioning professionals need some type of testing protocol to help in
the evaluation process of their athletes. This testing process needs to include all areas of training, such as
strength, power, and speed, that might reflect strengths and weaknesses that the athlete may posses. The testing
needs to be administered in a safe and effective manner to ensure an accurate evaluation (Ebben, 1998).
Evaluating performance tests of a football player may not only give a coach in-sight regarding an
athlete’s playing status and position potential but it also may be used as a way for strength and conditioning
professionals to re-evaluate their own program. These findings may give the strength and conditioning staff
insight to areas that may need more attention. For example, if an athlete tests poorly in power tests then the
strength and conditioning professionals could alter the program to help the athlete improve in this area.
In addition, evaluating strength, power, and performance tests may yield some interesting data. These
data may inform the strength and conditioning coach which test or tests may be more accurate in predicting
playing status; thus providing the correct information for implementing changes in program design. This
knowledge of prediction may be useful in changing the strength and conditioning program to be modified to fit

Johnson 4
the information gained from the evaluation of the strength, power, and performance tests. The strength and
conditioning coach could then quantify which test more accurately identifies the characteristics of that position
or position group. For example, the coach may be able to rank the tests in order of importance pertaining to
position groups and this ranking may give the strength and conditioning coach new insight into program
implementation.
Strength and conditioning professionals have conducted evaluations of various physical tests for many
years. These professionals have obtained much needed information about the performance of their athletes.
Now with the same information the strength and conditioning professional can draw conclusions regarding
which tests are more accurate in predicting playing status. If these professionals can make these predictions and
if they are able to rank these tests in order of importance then we can begin to see what tests or areas of training
are more important than others for a specific position or position group. Having information regarding the
usefulness of tests and their ranking can give the strength and conditioning professional insight regarding which
areas should be addressed more intensely than others for different positions or position groups. This
information can help strength and conditioning professionals create sport specific strength and conditioning
programs for athletes.
Statement of the Problem
Strength and conditioning professionals spend a lot of time and effort trying to improve athletic
performance. Coaches evaluate each athlete by utilizing the results of a number of tests. These tests help the
coach determine position rankings on a depth chart. The evaluation of these tests could help the coaches decide
which position is best suited for a particular athlete, while it is not clear as to what extent this assessment may
influence the coach’s decision regarding the playing status of an athlete, it is possible that these assessments
may become a useful tool to a coach in determining the playing status of an athlete. There has been
Johnson 5
considerable speculation and discussion about the physical attributes of Division I football players and their
playing status (Berg, K., Latin, R.W. & Baechle, T. 1990; Black & Roundy, 1994; Fry & Kraemer, 1991).
Many strength and conditioning coaches test their athletes and make evaluations based on their performance on
the tests. The problem, therefore, lies in the inability of many coaches to determine which tests are important
indicators of playing status. One important area of inquiry is to evaluate strength, power, and performance tests
between starters and non-starters at a NCAA Division I football program in order to determine whether starters
score higher on the strength, power, and performance tests compared to the non-starters.
Purpose
The purpose of this study was to determine what the relationship is between strength, power, and
performance test score on a playing status. These findings may be used to help the strength and conditioning
professional develop programs that may be more sport specific for certain positions or position groups.
Research Questions
The specific questions addressed by this study are:
1. Is there a relationship between these various tests and playing status?
2. Can the ranking of these tests in order of importance help the strength and conditioning professional
create programs that are more training group-specific?
Research Hypothesis
1. Ho: There is no statistical difference in the strength, power, and performance tests that are ranked in
order of importance between the starters and the non-starters in the Skill group.

Johnson 6
2. Ho: There is no statistical difference in the strength, power, and performance tests that are ranked in
order of importance between the starters and the non-starters in the Combo group.
3. Ho: There is no statistical difference in the strength, power, and performance tests that are ranked in
order of importance between the starters and the non-starters in the Line of Scrimmage (L.O.S.)
group.
Limitations
The following limitations were inherent in the design of this study:
1. The dependent variable in this study encompasses only four parameters
[strength, power, performance tests (40-yard dash, Vertical Jump), and body weight] which might
influence playing status in this sport. Therefore, generalizations to playing status are limited to the
variables this study covers.
2. Only subjects who have participated in at least 4 years in the Virginia Tech strength and
conditioning program were considered for this study.
3. The effects of only six tests and body weight were measured and investigated: There are two
strength tests (bench press, and back squat), two power tests (push jerk and power clean), two
performance tests (40 yard dash, and vertical jump), and a body weight measurement.
4. Subjects were placed into one of three groups that will be consistent with conditioning groups during
their training sessions. These three categories are the Skill group, Combo group, and the L.O.S.
group.
Johnson 7
Significance of the Study
Evaluating strength, power, and performance tests have yielded valuable information for the strength
and conditioning profession. This study was designed to indicate a rank ordering of tests in order of importance
that would separate starters from non-starters. This rank ordering of tests have produced interesting information
that may lead to a re-structuring of program design among many strength and conditioning programs.
This study has helped strength and conditioning professionals, at Virginia Tech and hopefully elsewhere
to understand the difference between athletes in the three position groups. This study also indicates what area of
training needs to be a focus for these different position groups.
Most strength and conditioning programs would like for their programs to be as sport-specific, in their
training methods, as possible. The data presented in this study will help the Virginia Tech strength and
conditioning program, and hopefully other programs, gravitate towards a more sport-specific training protocol.
Definitions
Speed is “the displacement per unit time and is typically quantified as the time taken to cover a fixed
distance. Tests of speed are not usually conducted over distances greater than 200m because longer distances
reflect anaerobic or aerobic capacity more than absolute ability to propel the body at maximal speed” (Baechle
& Earle, 2000, p. 290).
Strength is “the force or tension a muscle or, more correctly, a muscle group can exert against a
resistance in one maximal effort” (Foss. & Keteyian, 1998, p. 340). Strength can be measured by a number of
different tests, such as the bench press and the back squat. Baechle and Groves define strength as “the ability to
exert maximum force during a single effort. It can be measured by determining a 1-repetition maximum effort,
referred to as a ‘1RM’, in one or more exercises” (1998, p. 5).

Johnson 8
Power is “a measurement of the ability to exert force at higher speeds. More precisely, power is the
product of the force exerted on an object and the velocity of the object in the direction in which the force is
exerted” (Baechle, 1994, p.29). Power is tested in a variety of ways. “Understanding power capacity and how it
can be created is one of the primary keys to optimizing athletic performance. Power should not be confused
with strength. Power is the capacity to do a given amount of work as rapidly as possible. By this definition,
power includes the elements of strength and speed. It is dynamic strength coupled with movement speed.
Speed is the ability to apply force rapidly when snatching, cleaning, throwing, or sprinting” (O’Shea, Patrick,
1999, p. 34). There are a few lifts that qualify as an evaluation for power. These lifts are the Olympic style
lifts: the snatch, push jerk, and the power clean.

Johnson 9
Chapter II
REVIEW OF LITERATURE
Football is one of the most popular games in the U.S. today (Arnold, J.A., Coker,T.P., & Micheli, R.P.,
1977). The history of football goes back as early as 500 B.C., and is believed by many historians to have its
roots in the Greek and Roman Culture. We know that the English laid the blueprint for this sport around 1600
A.D. In 1866, Henry Chyadwick presented the game of football to the United States. No one expected this
game to be as popular as it is today. After World War I football began to show signs of its popularity among
the people (Arnold et al., 1977).
The game has changed dramatically since those early days on the gridiron. Many people are attracted to
the game by the size and the pure athletic ability of the athletes. One of the most significant changes has been
the addition of a strength and conditioning program to help the athletes obtain superior strength and
conditioning status unlike the athletes that are not being trained. College football is big business in these
modern times. Many athletic departments spend a tremendous amount of money in order to support this sport.
The hope and determination of the athletic department is to receive monetary returns in the success of their
football program. Athletes and coaches are always looking for ways to gain an edge on their competition. In
the last few decades, this edge has been sought through the strength and conditioning programs. The
importance and effectiveness of a strength and conditioning program is a considerable advantage for the athlete,
coach, and entire athletic department (Pullo, 1992).
Since the game of football is very popular the thought is that there would be a large body of research
devoted to this popular sport. However, the reality is that there is very little research available in this area.
“Football is the least studied sport in the U.S. today. We have very little direct scientific evidence on the
physical demands of the sport, the recovery process, or the effects of long-term participation. The reason for

Johnson 10
the lack of direct research on a sport that is one of the leaders in revenue generation remains unclear. Research
on the training related aspects of the sport also remains indirect and speculative, due to the fact that the subjects
are typically untrained men and not football players” (Kraemer, 1997, p. 131). Although football is one of the
least studied sports, the players have been involved in resistance training for decades. This training has given
the player the ability to become a more complete athlete. The research that is available indicates that strength
and conditioning programs have shown to improve strength, power, speed, and vertical jump measures. The
increases in these variables have been proven to improve athletic performances (Stone et al., 2000).
Making a reliable evaluation on a collegiate strength and conditioning program will consist of many
variables that are measurable and some that are not measured in this study. Programs are evaluated primarily
on measurable variables that can be quantified, but to make an accurate yet reliable evaluation of a program, the
coach has to consider the intangible portion of a program. The “intangibles” are non-measurable characteristics
that a good strength and conditioning program must have in order to be successful. Examples of the
“intangibles” are knowledge of the game, heart, and motivation. The “intangible” characteristics will not be
investigated in this study.
Program Objectives and Goals
Each strength and conditioning program has set some “formal” and “informal” program objectives to be
obtained. These objectives are set as guidelines to be met in order to have a successful strength and
conditioning program.
Baechle and Earle stated that “program objectives are specific means of attaining program goals. To
state program goals without listing ways in which these goals might be attained can result in athletes never
achieving them. Program objectives should encompass all areas of the program to ensure that the goals are
attained. Following is a list of goals that strength and conditioning programs should incorporate into their

Johnson 11
regime if they are not already present. These goals will help the athlete obtain a high level of competition and
these goals are also used in the evaluation process of each athlete.
1. Design and administer strength, flexibility, aerobic, plyometric, and other training programs that
reduce the likelihood of injuries and improve athletic performance. More precisely, designing
training programs that create the desired results in body composition, hypertrophy, strength,
muscular endurance, cardiovascular endurance, speed, agility, coordination, balance, and power.
2. Develop training programs to account for biomechanical and physiological differences among
individual athletes, taking into account their ages, sex training status, physical limitations, and injury
status.
3. Recognize acute and chronic physiological responses and adaptations to training and their
implications for the design of sport-specific training programs.
4. Educate athletes on the importance of good nutrition and its role in health and performance.
5. Educate athletes about the abuse and effects of performance-enhancing substances, relevant school
policy, legal legislation, and safe and viable alternatives” (Baechle & Earle, 2000, p. 568).
This description of the “program objectives” outlines what most strength andconditioning programs
want to accomplish in their own program. If the strength and conditioning staff can reach these objectives, then
they are on the right path for success.
The benefits of a strength and conditioning program can be broken up into two parts. All strength and
conditioning programs want to increase athletic performance and prevent injury. These are two common
universal goals that every program states in their “mission statement”. Baechle and Earle have given an
example of a mission statement that is widely used, in one form or another, by most strength and conditioning
programs. “To provide to athletes the means by which they can train consistently, sensibly, and systematically
over designated periods of time, in a safe, clean, and professional environment to help prevent injury and

Johnson 12
improve athletic performance” (Baechle & Earle, 2000, p. 568). This mission statement encompasses the two
universal goals of a strength and conditioning program. If the strength and conditioning staff attains this
mission then the program should be successful.
Before an evaluation of a strength and conditioning program can proceed, there has to be a set of
specific goals to be obtained. The evaluation of tests, programs, and athletes needs to first be stated in
obtainable goals that are specific. The most significant goal, of the strength and conditioning program, is to
improve athletic performance. This concept is the central ideal for the prosperity of the strength and
conditioning program. The improvement of variables, such as, strength, power, speed, and vertical jump ability
will contribute to the enhancement of athletic performance. “This alone could serve as the mission statement
for the program; however, strength and conditioning professionals in whose programs injuries have occurred
realize that injury prevention should also be a goal” (Baechle & Earle, 2000, p. 568).
Testing and Evaluation
When the first year athletes begin the program they are tested, on strength, power, and speed, so the
strength and conditioning coaches can evaluate the athlete’s fitness levels. The testing and evaluation process
of athletes has two main objectives. The first objective is to identify the possibility of any pre-existing physical
conditions that might hinder the athlete’s performance. This might range from pre-existing injuries to lower
than average scores on strength, power, and speed tests. Low strength, power, and speed test scores may show
weaknesses in specific areas. The identification of inadequacies in some of these tests could give the strength
and conditioning coach the ability to design a program to help the athlete in these specific areas (Arce, 1994).
The second objective is to measure the athlete’s sport-specific skills. This measurement will produce
information about the level of preparation the athlete has achieved. This information might also render
information about the position or positions that might be most suited for the athlete. Once these two objectives

Johnson 13
are met then the strength and conditioning coach can begin the process of tailoring the program for the athletes
(Arce, 1994).
The athletes are evaluated at the beginning to determine their fitness level. The strength and
conditioning coach has the responsibility of assessing the level of fitness for every athlete. Once this has been
attained then the strength and conditioning coach must be able to coach athletes at different fitness levels. A
university’s strength and conditioning program can be evaluated on its ability to accommodate all levels of
athletes at the same time. There could be athletes that have participated in structured strength programs and
also some athletes that have never resistance trained a day in their lives. The goal is to be able to have a
program that can accommodate both types of athletes. “It is important to understand that in training football
players, the ‘pretraining’ status of the players will affect the amount of development that can be expected with
just short-term training. Thus mistakes in exercise prescription can lead to little or no changes. Individualized
and periodized training is vital for development” (Kraemer & Gotshalk, 2000, p. 803).
Most strength and conditioning programs test their athletes for the purpose of monitoring the progress of
their athletes. This testing enables the strength and conditioning coaches to evaluate their athletes and their
program. The testing process needs to be an integral part of the strength and conditioning program. This
process should be in direct concurrence with the design of the program. The evaluation of athletes should not
be conducted in a manner in which, the process does not follow the design of the program. This should work
together within the training program at the appropriate times to produce the most accurate results (Gambetta,
1998).
The testing of athletes needs to be sport-specific. This will enable the coaches or the investigators to
evaluate these tests under the assumption that they are valid quantifiers since they are sport-specific. The
strength and conditioning coach needs to understand the athlete’s sport. The tests that are chosen by the
strength and conditioning coach need to fit the parameters of the sport for optimal evaluation. “When selecting

Johnson 14
tests, the strength and conditioning professional should analyze the energy system demands of the sport the
athlete is being measured for. For example, while a 1.5 mile run is an excellent field test for measuring
cardiorespiratory endurance in sports requiring a lot of energy from the oxidative energy system, it is not an
appropriate test for football, which primarily on the ATP-PC energy system. A more appropriate running test
for football would be a short-distance sprint such as a 40-yard dash” (Graham, 1994, p. 9). Sport-specific
training is crucial to the success of every strength and conditioning program. Sport-specific programs create
training that is designed to mimic movements that the athletes perform in competition. The idea, therefore, is to
make these movements stronger, faster, and more powerful (Foss & Keteyian, 1998). “According to the
principle of specificity, conditioning programs must approximate the mechanical and movement speed
requirements of the sport. Test items should assess the physical characteristics it takes to succeed in a specific
sport and the adaptations that occur in response to the prescribed conditioning program” (Ebben, 1998, p. 42).
During testing, the strength and conditioning staff wants to ensure that the tests being used on the athlete reflect
the sports physical demands on the athlete. This is a major concept when discussing the testing of athletes.
Many coaches will evaluate athletes on tests that do not reflect the sports energy system demands. The tests
being administered have to be able to evaluate not only the athlete but also the sport in which the athlete
participates in, in this case football. Tests that represent the sports energy system are a must.
The Age Factor
Many investigators conclude that strength, speed, power, and size are all good indicators on the ability
to start. It seems that a few studies are designed to show predictors on the ability to become a starter over a
non-starter. The one variable that many of these studies do not take in consideration is the chronological age
factor. Many of these studies are not designed to control for age. The literature that is being reviewed does not
focus on this issue but age is a very important factor when discussing playing status. Age could possibly play

Johnson 15
an important role in playing status. Usually, the more physically mature athlete will score higher on power,
strength, and speed tests, than the less physically mature athlete. These higher test scores may result in a
starting position for the physically more mature athlete. The maturation of an athlete is a concept that might be
overlooked in many studies. In a study by Barker and colleagues in 1993, they found that the, “starters were
stronger than non-starters; consequently, 1-RM and 1-RM x body mass squat strength may be a determining
factor as to which players start. It should be noted that starters were also older than non-starters (20.4 +- 1.0 vs.
19.3 =- 0.9 years). Therefore the strength differences between starters and non-starters may be related to
strength training experience and maturation” (Barker et al., 1993, p. 231). Barker and colleagues realized that
age is a very important factor in determining playing status. Many athletes are starters because they have been
in the program longer than other athletes. The starters may have a greater understanding of the program and
this understanding places them with the opportunity to start. Evaluating athletes by testing them on strength,
power, speed, and endurance might render conclusions about an athlete’s physical maturation. This study, as in
other studies, reveals that age is also a factor to be recognized and controlled. Age might not be able to be
controlled completely but there needs to be a serious attempt in controlling for age. Older athletes have usually
been in a sound strength and conditioning program longer than younger athletes therefore, the older athletes
have had more time to reap the benefits of the strength and conditioning program.
In this study, players who have participated in four years of the strength and conditioning program have
been investigated. Starters and non-starters have to be in the Virginia Tech strength and conditioning program
for at least four years. This will allow all of the subjects to be exposed to the strength and conditioning program
for the same amount of time. Hopefully, this will counter the problems that Barker et al ran into.

Johnson 16
Bodyweight and Performance
There are many studies that are concerned with bodyweight and performance. Many studies direct their
attention to the bodyweight issue. Bodyweight, in the sport of football is an interesting issue. The sizes of the
players have always been discussed as an important issue. There is a lot of emphasis placed on bodyweight by
the coaches and by the players themselves. Coaches want the biggest athletes possible. In 1975, Wickkiser and
Kelly researched the topic of body composition. They asked coaches and players what they thought was their
“ideal” bodyweight. “It was found that the players perceived their ‘ideal weight’ to be 9.1 pounds heavier than
the ideal weight selected by the investigators. The coach also overestimated the weight by 6.2 pounds. This
finding in conjunction with a negative correlation of .69 between percentage of fat and 40-yard dash speed for
players evaluated in the present study, would appear to indicate the need for increased emphasis in making
recent body compositional findings more accessible to football coaches and players. It appears that far too
much emphasis is placed upon total body weight by the coach and the athlete” (Wickkiser & Kelly, 1975,
p. 201).
In 1993, Mayhew, J.L., Bemben, M.G., Piper, F.C., Ware, J.S., Rohrs, D.M. & Bemben, D.A.
conducted a study to determine the relationship between the seated shot put test and the bench press. The
investigators found that the seated shot put test and the bench press “may be influenced by size and
muscularity” (1993, p. 95). The same investigators concluded that the most determinant factor between the
relationship of the seated shot put test and the bench press is bodyweight. They found that being a larger person
may produce higher scores on the seated shot put test - bench press relationship (Mayhew et al., 1993). The
investigators were not attempting to make a connection between body size and performance on the field. The
investigators were making a connection between two different upper body strength-power tests. The
investigators found that body size does play an important role in upper body strength but this finding does little
to distinguish between upper body strength and performance on the field. Mayhew et al. even states that, “two
Johnson 17
important questions are left unanswered by the current research: What is the relationship between bench press
power and football performance? And what is the relationship between sports performance and changes in
upper body strength and power resulting from periods of heavy training” (Mayhew et al., 1993).
In 1994, Bale, P., Colley, E., Mayhew, J.L., Piper, F.C., & Ware,J.S. conducted a similar study where
they wanted to compare strength measures between positions. The investigators reported that the back is
relatively stronger than the offensive linemen when bodymass is taken into consideration (Bale et al., 1994).
But the linemen have greater strength than the back when comparing absolute strength (Bale et al., 1994). The
investigators found that, “the larger player is also stronger when strength is measured by the ability to perform
maximum absolute bench press and deadlift exercises” (Bale et al., 1994, p. 388).
In this sense, the studies by Bale et al. and by Mayhew et al. conclude with the same findings. Both of
these studies have found that typically larger athletes produce greater absolute strength and power than smaller
athletes.
Bodyweight is undoubtedly a very important measure to be evaluated by the coaches. However, how
much emphasis should be placed on this measure alone? In a study by McDavid in 1977, the researcher
investigated football playing potential tests. Bodyweight as used in a classification index was used to determine
the relationship to the test criterion. “The investigator was surprised to note that the classification index item
had a negative but non-significant relationship to the test criterion. This may cause a re-evaluation of the
importance of size alone in football. It seems obvious that size combined with other attributes contributes to a
stellar performer” (McDavid, 1977, p. 101). In these studies that investigate bodyweight, the researchers have
distinguished that bodyweight is a predictor for playing status. However, they all also agree that an excess in
body fat could be detrimental to the athletes overall performance.
Seiler et al. conducted a study very similar to McDavid and to Wickkiser and Kelly by evaluating forty-
one collegiate football players, through an investigation their anaerobic power. This study examined the idea

Johnson 18
that larger athletes are always the superior performers. The authors used a battery of anaerobic power tests to
answer the question. They found that football players are much more powerful than untrained males. It is
interesting to note that while the authors almost had the same conclusions as the previous studies, they also
conceived that “for linemen to be able to execute the explosive movements necessary at the higher levels of
collegiate football, greater efforts should be made to bring their body composition closer in line with other
athletes on a football team. A leaner, more explosive lineman may out-perform a heavier but less powerful
counterpart if both display the same technical proficiency on the field” (Seiler et al., 1990, p. 14). This study has
the same conclusion as McDavid (1977) and Wickkiser & Kelly (1975).
In this sense, the issue of bodyweight has become a very important issue, with regard to its direct
correlation to performance. These studies are in agreement that being a larger athlete may increase performance
capabilities in some positions, although, having an excess amount of body fat may be detrimental to the athletes
performance (Bale et al., 1994; Mayhew et al., 1993; McDavid, 1977; Seiler et al., 1990;& Wickkiser & Kelly,
1975).
The Placement of Athletes into Position Groups
The authors of many studies have placed the various positions into position groups. This is a very
common occurrence since many of the positions are very similar in movement and skill performance. “These
different biomechanical and physiologic position demands tend to separate into distinct categories according to
physical attributes. In general, offensive linemen and defensive linemen can be grouped together because these
players today tend to be taller, and larger, and have higher levels of body fat, are relatively slower, and have
greater absolute strength and power than do the other positions. In general, offensive backs, wide receivers, and
defensive backs tend to have the lowest levels of body fat, fastest sprint times, quickest reaction times, and
highest relative VO2 max value. Inside linebackers and tightends tend to form a group next to the linemen in

Johnson 19
body size, strength, and power, where as outside linebackers and fullbacks form the group between the small
backs and the inside linebackers and tightends” (Kraemer & Gotshalk, 2000, p. 796).
Pincievero and Bompa classify the positions into three groups. “Based on measurements of size, body
composition, strength, speed and endurance, 3 distinct groups of football players may be established: (i)
offensive and defensive linemen; (ii) defensive backs, and offensive backs, and wide receivers; and (iii)
linebackers and tight-ends. The position of tightend may also represent a transitional group along with
linebackers, although they have been grouped with either the offensive backs, the offensive linemen or the
linebackers. Since the position of tight-end requires the player to make blocks on defensive linemen as well as
to run down field to catch passes as a receiver, it would seem justifiable to place these players in a category with
the linebackers as a transitional group between backs and linemen” (Pincievero & Bompa, 1997, p. 256).
These are some examples of how to categorize position into position groups. There may be some different
position groups in other studies but the main theme is consistent.
Comparisons of Football Players by Positions
The research indicates that Division 1 football players are becoming bigger and stronger. Throughout
the years the game of football has seen an increase of size, strength, and speed of the athletes. This increase is
caused by the preparation of the athletes, genetics, and the rule changes of the game. For example, the rule
changes have allowed for the offensive linemen to use their hands in pass protection. The use of the hands has
given the offensive linemen the ability to position block. The offensive linemen have become extremely large
and strong athletes since they can now use their hands in pass protection. The linemen do not have to move as
much during blocking since they can use their hands. These athletes have to become big and strong to keep the
defensive players away from the quarterback. This physical development can also be attributed to the athlete’s
preparation in a strength and conditioning program. Genetics has also played an important role in the athlete’s

Johnson 20
physical capabilities. Rule changes and strategy changes of the game have caused a shift in the prototype
athlete. Depending upon the position, the athlete has to be able to fulfill the requirements of that position
(Kraemer & Gotshalk, 2000). These days it is not unusual to find an offensive lineman who is over 6’6” in
height and who weighs more than 300 pounds. This was unheard of 15 – 20 years ago. The linemen in that era
were not near as large, on an average, as the linemen now. Athletes are making incredible strides in strength,
speed, and size. Strength and conditioning programs are influencing every major Division I football program in
the nation. Athletes that were once thought of being near or at their genetic potential are making great increases
in their physical capabilities. This was once thought to be impossible. Athletes that were once the size of
linemen are now playing various skill positions, like running backs, and they are faster than the backs of
previous years. This occurrence is caused by the influence of a strength and conditioning program (Arthur &
Bailey, 1998).
In 1985, Olson and Hunter sent out surveys to see if athletes were bigger, stronger, and faster than
athletes ten years before. The investigators looked at football players from the 1974 season and compared them
to the players of the 1984 season. The investigators found that the athletes in 1984 were faster, bigger, and
stronger than those ten years previous in 1974. The improvements that the athletes made over this ten-year
period suggest that the strength and conditioning program had a major influence in this occurrence (Olson &
Hunter, 1985). Today’s athletes spend so much time and effort in the strength and conditioning facility that they
are reaping benefits those previous generations did not have the opportunity to participate in.
In 1968, Costill, D.L., Hoffman, W.M., Kehoe, F., Miller, S.J. & Myers, W.C. produced a study that
compared the anaerobic power among college football players by position and by players that were grouped by
ability levels. The investigators found that there are clear and distinct differences between backs and linemen,
in regards to anaerobic power. The investigators found that for all athletes to be successful, the major

Johnson 21
characteristic is lower body power production. This power production is a key element for an athlete to have a
successful college career (Costill et al., 1968).
In 1976, Smith and Byrd conducted a similar test to that of Costill et al. The investigators concluded,
“it appears that participation in football provides no particular advantage in pulmonary function, but does
beneficially affect the percentage body fat and aerobic capacity of players. Further, there are clear physiologic
differences between backs and linemen” (Smith & Byrd, 1976, p. 302).
These early studies try to identify the various tests that will help coaches evaluate their athletes. These
early studies are the beginning research for this topic. They laid the groundwork for other investigators who
need to expand the field of research in the sport of football. For example, two decades later Seiler et al.
conducted a study to try and quantify power outputs of collegiate football players as a team and by position.
This study is very similar to the studies conducted by Smith and Byrd (1976) and Costill et al. (1968). In the
study by Seiler et al., the investigators placed athletes into three position groups according to their performance
requirements on the field. The data from this study suggests that football players are more powerful than
untrained males. This is a very obvious occurrence point, but it is one that needs to be mentioned. The
investigators also concluded that linemen were stronger and more powerful than the backs and skill position
players (Seiler et al., 1990). This finding is in agreement with the conclusions from Smith and Byrd in 1976
and Costill et al. in 1968.
Kraemer and Lincoln observed how much change occurs in the body of football players over a
longitudinal period. “We analyzed the rosters of Pennsylvania State University football players for height and
body mass over a 30-year period (i.e., 1967, 1977, 1987, and 1997 teams). For major colleges, the move toward
offensive and defensive players averaging 300 pounds each is closer each decade, and many NFL teams have
already achieved it. It is interesting to note that the largest athletes in our sample, such as the offensive
linemen, made the most significant gains in body mass over the 3 decades, whereas the smallest athletes, such

Johnson 22
as the defensive backs and running backs, essentially made no changes at all in body mass. With all of the
recent attention to the larger fullbacks who block and are tackled by bigger people, we noted the same trend in
our data, as the middle-sized athletes (the fullbacks and linebackers) made significant weight gains only over
the last 10 years. The size differences among players have been a classic finding over the years, with only the
magnitude being different” (Kraemer & Gotshalk, 2000, p. 799).
In 1990 Berg and colleagues produced a study on the relationship between size, strength, speed, power,
and body fat in Division I college football players to team success. “The purpose of this study was to describe
65 Division I NCAA football teams with respect to height, weight, bench press and squat strength, 40-yd dash
speed, vertical jump, and body fatness” (Berg et al., 1990, p. 395).
The investigators found that the interior linemen were stronger when absolute strength is taken into
consideration. The athletes that are performing in these positions contain a higher level of body fatness but
these athletes are still extremely strong. Size and strength seem to be the two main physical attributes of these
positions (Berg et al., 1990).
The linebackers and tightends make up the intermediate group and these athletes are representative of
the larger linemen group and the smaller, quicker, skill position and backs group. The athletes in this group
tend to have a combination of physical attributes from the lineman and from the backs. These athletes are large,
leaner than the linemen, and they are strong and fast (Berg et al., 1990). The offensive and defensive backs are
typically representative of low body fatness and these athletes are usually the fastest athletes on the team (Berg
et al., 1990).
The problem with this study (Berg et al.) is that it is another survey-based study. The study lost its
validity when the authors could not control the testing of the athletes. The authors even mentioned, “the
validity of these data is limited by the fact that measurements were made by many different people using no

Johnson 23
pre-established methodology. For example, 40-yd dash time was measured at most schools by stopwatch; only
two used electronic measurement” (Berg et al., 1994, p. 396).
Much of the data in the study by Berg et al. is not as valid and objective, as the authors would like it to
be. For instance, when judging a parallel back squat the strength and conditioning coach should judge the lift
“good” when the top of the quadriceps is parallel to the floor. Baechle and Earle have described accurately the
testing techniques for a strength and conditioning coach. Many strength coaches might judge this lift differently
or on how they “see it”. Parallel to some is not parallel to others. The investigators would gain consistency and
validity if they had control over the testing. Because of the great number of subjects, presented in this study,
this concept was impossible to achieve. Therefore, there is a realization and an understanding that this data is
not as valid, reliable, and objective, as the investigators would like it to be.
In a study by Fry & Kraemer, the investigators seemed to take a look at the issue of positions groups
compared to other position groups. They found that “linemen had greater absolute strength when compared
with backs and receivers. On the other hand, backs and receivers exhibited greater vertical jump ability and
faster sprint times when compared to linemen, as has also been previously reported. When strength values are
corrected for body weight, backs and receivers sometimes exhibit greater relative strength levels than linemen,
but not in all instances. Power cleans, 40-yard sprints and back squats have all been reported to significantly
discriminate between starters and non-starters” (Fry & Kraemer, 1991, p. 126).
Comparisons of Starters vs. Non-Starters
Today’s research also spends a lot of energy dealing with comparisons of strength, power, and speed
tests between starters and non-starters. Athletes are becoming bigger and stronger; but does this size and
strength actually determine who is going to become a starter and who is a non-starter? Performance evaluations
of collegiate football players are of continuing interest among the strength and conditioning professional.

Johnson 24
In 1999, Schmidt examined the strength and physiological measures in a Division III football program.
Although Schmidt is utilizing information from a Division III College, it is still very applicable to this study and
to other studies that involve only Division I athletes because the athletes train in the same manner and the
athletes are the same age (Schmidt, 1999). Schmidt compared starters to non-starters on various tests. The tests
were the seated medicine ball put, sit and reach, vertical jump, timed sit-ups (1 minute), pull-ups, leg press (1
rep max), bench press (1 rep max), dips, and the 300-yard shuttle. The investigator did not distinguish between
position groups or positions. The investigator classified the athletes by being a starter or a non-starter and not
by positions. By doing this the investigator cannot make comparisons based on positions or position groups.
The investigators found that the starters typically scored higher on every test. The one exception was the timed
sit-up test (Schmidt, 1999). This finding explains that starters are typically stronger, faster, and more powerful
than the non-starters (Schmidt, 1999).
In 1987, McCormick et al. conducted a study earlier than Schmidt (1999). This study by McCormick et
al. is very similar to that of Schmidt. The investigators compared the starters to the non-starters as a whole.
They did not break the athletes up into positions or position groups. This is the same format that Schmidt did in
1999. McCormick evaluated 70 South Dakota players. The athletes were evaluated on six tests. The tests used
were the 1 rep max bench press, power clean, leg press, five-yard shuttle, 10-yard sprint, and the 40-yard dash
(McCormick et al., 1987). “Starters had significantly (p<.05) greater bench press and power clean strength
scores, faster 10 yard dashes that non-starters. Discriminent analysis selected the power clean, 10 yard dash, 40
yard dash, body weight, and height as major factors differentiating starter form non-starters (Wilk’s
lambda=0.73). The fundamental performance characteristics of speed, power, size, and cardiovascular
condition can be used to successfully select football players” (McCormick, 1987, p. 60).
A study by Black and Roundy found that there are differences between positions and between playing
status, starters vs. non-starters. They found that players who scored high on tests of strength, power, and speed

Johnson 25
were more likely to be starters on a given team. Black and Roundy sent surveys to 44 head strength and
conditioning coaches. Comparisons were made between starters and non-starters for 16 positions. The tests
used in this study were the bench press, back squat, vertical jump, bodyweight, and the 40-yard dash. The
starters at the positions of offensive line, tight-end, quarterback, fullback, defensive tackle, inside linebacker,
cornerback, and free safety scored higher on the bench press than the non-starters. The starters at the positions
of defensive tackle, outside linebackers, cornerbacks, offensive center, offensive guard, wide receiver, and
quarterback scored higher on the 40-yard dash than the non-starters. The starters at the positions of outside
linebacker, cornerback, offensive guard, tight-end, wide receiver, and running back scored higher on the squat
than the non-starters. The starters scored higher on the vertical jump test in the positions of outside linebacker,
cornerback, and wide receiver. The starters at the positions of defensive tackle, outside linebacker, inside
linebacker, strong safety, and tightend had significantly higher bodyweights than the non-starters (Black &
Roundy, 1994). This data concludes that the evaluation of tests may be used as a tool to distinguish starters
from non-starters.
Fry and Kraemer conducted a study in 1991 that is very comparable to Black and Roundy’s study that
was conducted in 1994. Fry and Kraemer found that “the bench press, power clean, 40 yard dash, and vertical
jump effectively differentiated between division of play as well as playing abilities, but the back squat was a
relatively poor differentiator” (Fry & Kraemer, 1991, p. 136).
Fry and Kraemer produced 6 position groups (offensive backs, Offensive linemen, Receivers, Defensive
linemen, linebackers, and Defensive backs). Comparisons of playing ability were made between the starters
and the non-starters for each position group. “Significant differences were found between starters and non-
starters for five position groups reported significant differences for the 40-yard dash. On the other hand, only
offensive backs demonstrated significant differences between starters and non-starters for five position groups
for the bench press, power clean and vertical jump, while four position groups reported significant differences
Johnson 26
for the 40-yard dash. On the other hand only offensive backs demonstrated significant differences between
starters and non-starters for the back squat” (Fry & Kraemer, 1991, p. 137).
There are many tests that can be used to compare starters to non-starters. The investigators in all of the
previous studies that have been mentioned found that starters typically scored higher on some or all of the tests
(Berg et al., 1994; Black & Roundy, 1994; Fry & Kraemer, 1991; McCormick, 1987; Schmidt, 1999). Coaches
want their strongest, largest, and fastest athletes on the field. The review of the studies in this section indicates
that stronger, larger, more powerful, and the faster athletes are typically starters. “The effectiveness of test items
for evaluating football playing ability is controversial. There are numerous examples of players with
outstanding test scores who seldom play. However, there are also numerous examples of players with
outstanding test performances who are outstanding on the field. This study shows that, in general, those players
who score high on tests of strength, power, and speed were also selected as starters by their coaches” (Black &
Roundy, 1994, p. 83).
Speed The test for speed is an important component of an athlete’s physical capabilities to be measured. The
40-yard dash is a universal test for speed in the sport of football. Speed is a very important criterion for a
football player’s ability. “One important criterion measure, which could be used to test the concurrent validity
of predictors of football ability, is speed. Football is clearly a sport where short all-out explosive bursts of
power play an important part in performance” (Burke, E.J., Winslow, M.S. & Strube, W.V., 1980, p. 178).
The 40-yard dash is an extremely controversial test for speed. “Speed is often tested with the 40-yard
dash. It is doubtful this practice will ever be discontinued. Speed is an important physical ability in football.
Many conditioning programs seek to develop and test the athlete’s speed” (Ebben, 1998, p. 44). The 40-yard
dash is a test that most professionals and non-professionals identify football players with speed. “The 40-yard
sprint has been the traditional ‘gold standard’ of assessing speed in football players, although few players ever

Johnson 27
run this distance in a game. This is especially true for linemen. This distance is probably most important for
many special team players, who routinely cover 40 to 60 yards on punts and kickoffs. As with many traditional
beliefs in football, almost all professional scouts and most professional, collegiate, and high-school teams have
used this test as a marker of football speed” (Kraemer & Gotshalk, 2000, p. 800 ). Many people believe that the
40-yard dash is a poor test of speed. There has been some question as to the specificity of this test since there is
rarely a time when football players run 40 yards (Crews & Meadors, 1978). Many people believe that the 40-
yard dash is not representative of speed for football players since they rarely run that distance. These opposers
of the 40-yard dash may consider a 5-yard dash or a 15-yard dash as a more comparable test for speed among
football players (Crews & Meadors, 1978).
Crews and Meadors investigated this problem with the testing of speed in 1978. They concluded that,
“It has been questioned by some persons as to whether the 40-yard dash, the traditional method of measuring
speed in football players, is an appropriate test of football speed. This doubt is a reflection of the fact that there
is few times a player actually runs 40 yards during a game. This is especially true of a lineman. A finding of
this investigation was a high positive relationship between 5 and 40-yard run times (.80) and between 15 and
40-yard run times (.94). It is apparent that performance in a 40-yard run is representative of how fast a player
moves at 5 and 15-yards, and thus is an appropriate test of football speed” (Crews & Meadors, 1978, p. 169).
The Vertical Jump as a Test of Power The vertical jump is a test for lower body power. This is a non-resistant exercise used to measure
jumping ability. This test is very important because the ability to jump is a measure of power. In many sports,
such as football and basketball, power is a very important component for athletes. The athletes in these sports
rely on power to succeed (Hedrick & Anderson, 1996).

Johnson 28
Power cleans and jerks are exercises that can be used to measure total body power. These indicators of
power are a different measure than the vertical jump since a resistance is being used by the two Olympic-style
lifts. “The snatch and the clean and jerk have been widely accepted as a viable means for increasing lower body
power” (Hedrick & Anderson, 1996, p. 8).
The clean and jerk are two Olympic-style lifts that can be used to increase vertical jump ability. The
Olympic-style lifts involve speed. This speed is transferred from the body to the bar. In performing these lifts
power is produced in much the same way as an athlete jumping in the air as high as they can. Coaches would
often give cues to their athletes when performing Olympic-style lifts. One of the most common cues is to
perform vertical jump with the bar in your hands (Garhammer & Gregor, 1992).
The vertical jump test, the power clean, and the push jerk are all tests of power. The difference is that
the power clean and the push jerk are exercises that can increase vertical jumping ability. But performing the
vertical jump cannot increase the power clean and the push jerk (Hedrick & Anderson, 1996).
The vertical jump is a non-resistance test of lower body power while the power clean and the push jerk
are weight-bearing tests of total body power.
Summary
All of the studies agreed on one level or another that in Division 1 football, the athletes are becoming
bigger, stronger, and faster than the athletes of previous years. The research has also indicated that starters
seem to score significantly higher in the performance tests than non-starters. “The game of football in the
United States continues to grow in popularity as a spectator sport. In addition, players are becoming bigger,
stronger, faster, and more powerful. The physiologic demands of the game have been highly influenced by
official rule changes and football strategies to gain competitive advantages on the field” (Kraemer & Gotshalk,
2000, p. 812).

Johnson 29
The actual benefits that an athlete will gain from a collegiate strength and conditioning program are
fairly obvious. The athlete, in most cases, will leave the program stronger, faster, and in better condition, in
most cases, than when they came into the program. In the sport of football, the athletes are usually bigger in
lean body weight than when they first came into the program. Pearson and Gehlsen found that performance
enhancement was significantly increased through a strength and conditioning program at Ball State University.
This study used football players who were on the roster to complete the investigation. “Two players were
unable to complete the study because of injury. The remaining 20 players had an average body mass increase of
1.1 kg. From 84.2+/- 8.8 kg to 85.3 +/- 8.4 kg. There were significant decreases in the 40-yard dash and flying
40, respectively, a 2% and 3% decrease in time. All other performance test values showed a significant increase
(Pearson, D., R., & Gehlsen, G., M., 1998)”. This explains the basic concept presented in this research.
Athletes are going to become stronger, faster, and more powerful when participating in a strength and
conditioning program. The starters are usually going to score higher in the strength, power, and performance
tests than the non-starters. In completing the review of existing research on this topic, it is logical that the
athletes in today’s venue are stronger, faster, and more powerful than those of venues past. This concept also
coincides with the notion that starters are more likely to score higher on strength and conditioning tests than
non-starters.
These findings produce more evidence in the importance of a strength and conditioning program. The
evaluation process of the strength and conditioning program is also noted to be of the utmost importance to the
strength and conditioning professional. The evaluations made in the testing of athletes have given the strength
and conditioning professional reliable information about the athletes, the program, and about the significance of
the tests themselves.

Johnson 30
Chapter III
METHODS
In this chapter the methods, procedures, and the subjects are described. The design and the analysis of
this study are also explained. Furthermore, a description of the subjects is presented and is followed by a
general methodology. Following this, the test section is explained. The procedure section has been explained
thereafter. This section includes information concerning the step-by-step procedures used in this study. Finally,
the design of this study is explained and then the statistical analysis is discussed in this chapter.
Subjects The total subject pool consisted of 452 Virginia Tech football players between the 1994 season and the
2000 season. These subjects were all male. The subjects participated in the Virginia Tech strength and
conditioning program for at least 4 years. The subjects were academic seniors, red-shirt seniors or juniors, or
graduate students. These subjects had to be in their final year of competition to be included in this study.
Transfers, however, were not included in this study.
A total of 105 football players who were a mean age of 22 were used in this study. The subjects were
classified as “starters” or “non-starters” according to their playing status. Subjects had to start at least 7 games
in their final season of competition to be classified as a “starter”. If a player was considered a starter in an
earlier year of competition but not in his final year of competition, he was considered a “non-starter”.
The subjects were placed into one of three groups according to their training group during the summer
strength and conditioning program in their final year of competition at Virginia Tech. The 3 groups were the
Skill group, the Combo group, and the Line of Scrimmage (L.O.S.) group. The Skill group consisted of the
receivers, cornerbacks, rover linebackers, whip linebackers, and safeties. The Combo group consisted of inside
linebackers, tight-ends, quarterbacks, tailbacks, fullbacks, and defensive ends. The L.O.S. consisted of

Johnson 31
defensive tackles and offensive linemen. The offensive linemen consist of the guards, tackles, and the centers.
The specialists group, which contains the place-kickers, kick-off specialists, holders, and punters, were omitted
from this study. The specialists group was omitted from this study because they did not identify with the norms
of any of the 3 position groups. Table 1 clarifies the break up of positions into position groups in which the
subjects were categorized according to their training groups:
Table 1
Skill Group receivers, cornerbacks, rover linebackers, whip linebackers, safety’s
Combo Group inside linebackers, tight-ends, quarterbacks, tailbacks, fullbacks,defensive ends
L.O.S. Group offensive linemen, defensive tackles
The number of athletes in each group is illustrated in Table 2.
Table 2
Group Starters Non-Starters Total Skill
18 10 28
Combo
24 19 43
L.O.S.
21 _________
13 _________
34 _________
Total 63 Total 42 Grand Total 105

Johnson 32
General Method Each subject participated in a series of tests conducted by the strength and conditioning staff. Starters
and non-starters were compared to each other on 6 different tests and body weight. The tests were ranked in
order of importance, by using a Proc StepDisc statistical procedure, from highest to lowest for each of the three
groups. There were two strength tests, which were the bench press and the back squat, two power tests, which
were the power clean, and the push jerk, and there were two performance tests, which were the 40-yard dash
and the vertical jump. The athlete’s body weight was also measured.
The groups were formed in a way that they train and condition together during the summer. There are 3
groups during summer conditioning and the groups in this study are consistent with the summer conditioning
groups.
Tests
Each test represents a parameter in evaluating athletic performance. Strength is measured using the
bench press and the back squat.
The bench press is a good indicator of strength in the upper body since it requires involvement of many
of the major muscles in the upper body. This exercise targets the pectoralis major, tricep, and the anterior
deltoid muscle groups. Moreover, this exercise can be used as a test for upper body strength. The procedure for
the bench press exercise is located in Appendix A. “Many coaches and athletes incorporate the bench press as a
major exercise to develop the upper body. The bench press is a good lift for developing muscular size and
strength and should be included in your program” (Arthur& Bailey, 1998, p. 76).
The back squat is the most common test used to measure lower body strength in a strength and
conditioning program that follows the principle of functional lifting. This exercise targets the gluteus maximus,

Johnson 33
semimembranosus, semitendinosus, biceps femoris, vastus lateralis, vastus medialis, and the rectus femoris.
This exercise can be used as a test for lower body strength. The procedure for the back squat exercise is located
in Appendix A. “Many strength coaches and professionals consider the squat exercise essential for the full
development of athletic potential. O’Shea and Wegner stated that “the full squat must be considered the
cornerstone exercise, because it quickly stimulates overall strength increases in both men and women.
Neglecting this exercise retards overall physical development and prevents the athlete from achieving optimal
performance” (Chandler & Stone, 1991, p. 52). When discussing lower body strength, the squat is the most
common comparison test that strength and conditioning coaches use to compare scores. The back squat is a lift
that incorporates all of the major muscle groups of the lower body. The back squat is looked upon as the best
test or indicator of lower body strength.
To measure power we use the push jerk and the clean. The power clean is an exercise for power. This
exercise is targets maximum muscular power (high-speed strength) (Baechle & Earle, 2000). This test targets
the gluteus maximus, semimembranosus, semitendinosus, biceps femoris, vastus lateralis, vastus intermdius,
vastus medialis, rectus femoris, soleus, gastrincnemius, deltoids, and the trapezius muscles groups (Baechle &
Earle, 2000). The procedure for the power clean exercise is located in the Appendix A.
The push jerk is an exercise for training power. This exercise targets maximum muscular power (high-
speed strength) (Baechle & Earle, 2000). This exercise can also be used as a test of power. This test targets the
gluteus maximus, semimembranosus, semitendinosus, biceps femoris, vastus lateralis, vastus intermedius,
rectus femoris, soleus, gastrocnemius, and the deltoid muscle groups (Baechle & Earle, 2000). The procedure
for the push jerk exercise is located in the Appendix A.
Performance tests are measured by the 40-yard dash and the vertical jump. The vertical jump test is a
test of lower body, non-resistance maximum power (Baechle & Earle, 2000). In simplistic terms, the vertical
jump tests jumping ability. This is an important test for any athlete. “Many strength and conditioning programs

Johnson 34
use the vertical jump test to measure the physiological adaptations from training. Vertical jump testing is
commonly used (a) to measure improvements in the vertical jump for sports (e.g., basketball) in which jumping
ability helps performance, and (b) as a general measure of lower body power in sports such as football that
require high levels of lower body power“ (Hedrick & Anderson, 1996, p. 9 ). The vertical jump is an excellent
measure of lower body power and it is easy for the athlete to perform with a low-risk of injury. The procedure
for the vertical jump exercise is located in Appendix A.
It is a common notion that in football, speed is measured by the 40-yd dash. Speed is an important
component of any athletic venue. The 40-yard dash is a test for speed. The athlete runs as fast as he can for
forty yards. Investigators with watches take the athlete’s 40-Yard dash times with watches.
This is a test that everyone can identify with. People can tell what a fast 40-yd dash time is but they
might not know what a fast 10-yd dash time would be. So, the 40-yd dash is the gold standard test. “Speed is
often tested with the 40-yd dash. It is doubtful this practice will ever be discontinued. Speed is an important
physical ability in football. Many conditioning programs seek to develop and test the athlete’s speed” (Ebben,
1998, p. 44). The procedure for the 40-yard dash exercise is located in Appendix A.
Instruments and Apparatus The equipment used in performing the bench press is discussed in this quote. “Olympic-style
weightlifting set with enough total weight to accommodate the maximum lift of the strongest athlete. A sturdy
bench-press bench with integral bar rack of adjustable height” (Baechle & Earle, 2000, p. 292).
In performing the back squat, the equipment used is discussed in this quote. “Olympic-style
weightlifting set with enough total weight to accommodate the maximum lift of the strongest athlete. A sturdy

Johnson 35
squat rack with adjustable spotting bars to support the weight bar should the athlete be unable to rise” (Baechle
& Earle, 2000, p. 292).
For the power clean and the push jerk, the equipment used in performing is discussed in this quote.
“Olympic-style set weightlifting with enough total weight to accommodate the maximum lift of the strongest
athlete. A lifting platform or designated area set apart from the rest of the facility for safety” (Baechle & Earle,
2000, p. 292).
The equipment used in performing the vertical jump is discussed in this quote. The use of a commercial
Vertec device. The Vertec consists of a met al base, with a long met al shaft. At the top are colored vanes that
are spaced ½” apart that rotate when touched for easy measurement.
The equipment used in performing the 40-yard dash is discussed in this quote. “Flat running surface
with start and finish lines marked 40 yards apart, with at least 20 yards after the finish line for deceleration”
(Baechle & Earle, 2000, p. 300). Furthermore, stopwatches should be used.
Bodyweight was taken on a scale that is calibrated for maximum accuracy.
Procedures
There are two major testing periods throughout the year. The first testing period is in the spring
semester around mid-March. Athletes are tested immediately before spring break. It is during this testing
period that the athlete’s 40-yard dash times are obtained. An athlete’s scores in the bench, squat, clean, jerk,
and the vertical jump are also recorded during this testing period.
The second testing session begins right before the football season starts. This session is usually in late
July or early August. Test scores are gathered in the bench, squat, clean, jerk, and vertical jump during this
testing period. This is a very important testing session because it is the last testing session of the year. The

Johnson 36
investigator of this study want to look at the athlete’s last testing session so all of the athletes test scores over
their four-year to five-year period can be taken into account. After all of the test scores have been gathered in
the respective athletes playing tenure, here at Virginia Tech, the investigator then picked their personnel best in
each lift. Even though the last testing period scores are gathered, a test score from one of the previous maxing
sessions might be recorded if it is a higher score than the last test score. The athlete’s personnel best test scores
over their four to five years of participation are recorded and used in this study.
The reason the 40-yard dash times are taken from the first testing session is because the 40-yard dash is
administered during this testing period. The 40-yard dash is not performed during the second testing period
because there is a chance of injury when running the 40-Yard dash. It is to close to the season to test this test
because of the risk of injury.
The bench press was measured by using a one-repetition max. The athlete performs the lift with as
much weight as he can for one repetition. Both the push jerk and the power clean are measured in this same
manner. The squat was measured by using a three-repetition max because it lowers the risk of injury. The
athlete performs the lift with as much weight as he can execute for three repetitions. The weight that the athlete
used for the three-repetition max is then divided by 91% to get an estimated max. Example: 500 pounds
(weight used for 3 repetitions) is divided by 91% or .91 = approximately 550 pounds. So 550 pounds would be
the athlete’s max on back squat.
The vertical jump was measured by using a Vertec. To measure vertical jump the coach wants to take
the standing height of the subject with both arms fully extended overhead. Then the athlete will jump-up and
touch the highest possible vane. The athlete will continue to jump until he has three misses. To get the vertical
jump score the coach will measure the difference between the standing height and the jumping height.

Johnson 37
Three coaches with watches timed the 40-yard dash. Each athlete received three attempts. The times of
the three watches were averaged together for each attempt. The best averaged time was the athletes 40-yard
dash score.
Body weight was taken by a scale that is calibrated correctly so that there will be an accurate reading.
Testing The basic design of the study consisted of the testing of the athletes and ranking the tests in order of
importance or significance. The athletes have been tested in their relative years of participation. Their test
scores from all six tests and their bodyweight have been recorded. While the athletes have been placed into
groups according to their positions, they have also been given a playing status of either starter or non-starter.
The details of these groupings have been explained in the previous section.
The athlete’s test scores were then compared to each other by playing status. Starters were compared to
non-starters by group. A Proc StepDisc statistical analysis was used to place the tests in order of importance,
starting with the test which most signifies a difference between starters and non-starters, and then working
down to the test that least signifies a difference between starters and non-starters.
This procedure was carried out for each of the three position groups (Skill group, Combo group, L.O.S.
group). A Proc StepDisc statistical analysis has been performed on each position group. This analysis produces
the order of importance for each test, for each group. This information can and will be used by the strength and
conditioning professional. This information is a way to evaluate the tests being administered to the athletes and
this information is a way to evaluate the strength and conditioning program.
All of the testing during this study was conducted under the direction of Dr. Mike Gentry. The
collection of data has been performed in the same process between the 1994 and the 2000 season. Because the
collection of data has been under the direction of Dr. Gentry the data has been collected in a reliable and
consistent manner.

Johnson 38
Data Analysis and Statistical Treatment
The statistical analysis used to test the hypotheses in this study was a Proc StepDisc Procedure. This
analysis was used to rank the tests in order of importance from the most significant to the least significant test.
This procedure was carried out for all three position groups, comparing starters to non-starters. (Skill group,
Combo group, L.O.S. group)
Essentially, this procedure is appropriate when you have “a classification variable and several quantitative
variables, the STEPDISC procedure performs a stepwise discriminate analysis to select a subset of the
quantitative variables for use in discrimination among the classes. The set of variables that make up each class
is assumed to be multivariate normal with a common covariance matrix. The STEPDISC procedure can use
forward selection, backward elimination, or stepwise selection. The STEPDISC procedure is a useful prelude to
further analyses using the CANDISC procedure or the DISCRIM procedure. With PROC STEPDISC, variables
are chosen to enter or leave the model according to one of two criteria:
1. the significance level of an F-test from an analysis of covariance, where the variables already chosen act
as covariates and the variable under consideration is the dependent variable.
2. The squared partial correlation for predicting the variable under consideration from the CLASS variable,
controlling for the effects of the variables already selected for the model. (Proc Stepdisc, 2001).

Johnson 39
Chapter IV
RESULTS
The results suggest that for each position group, there are tests that are ranked in order of importance.
Or more specifically, the tests are ranked in order of most differentiating significance between starters and non-
starters. Therefore, each test is ranked in order from most difference to least difference. The results were
recorded for each position group: Skill group, Combo group, L.O.S. group.
The bench press, back squat, push jerk, bodyweight, and the clean were recorded in pounds while the
vertical jump was recorded in inches, and the 40-yard dash was recorded in seconds. The descriptive statistics
are located in Appendix B. The step tables for the Proc StepDisc procedure are located in Appendix C. The
Skill group, Combo group, and the L.O.S. group step procedures are in Appendix C.
Skill Group Results
The tests for the Skill group are ranked in order of importance, beginning with the most important to the
least important:
1. Vertical Jump 2. Power Clean 3. 40-yard Dash 4. Back Squat 5. Bodyweight 6. Push Jerk 7. Bench Press
Table 3 shows the tests that are significant at the p<.05 level for the skill group are the: bench press,
power clean, push jerk, 40-Yard dash, vertical jump, and bodyweight.
The F-values and the p-values for each test are listed in Table 4. This table shows the results of the Proc
Stepdisc Procedure analysis performing a stepwise discriminate Analysis on the Skill position group. The level

Johnson 40
of significance is p<0.7. The level of significance is set this high in order to encompass all of the tests in a rank
ordering of importance from highest to lowest.
Table 3 Proc StepDisc Procedure for the Skill Group
Step 1 Variable R-Square F-Value Pr > F Tolerance Bench Press 0.1965 6.36 0.0181 1.000 Back Squat 0.1176 3.47 0.0740 1.000 Power Clean 0.2923 10.74 0.0030 1.000 Push Jerk 0.2040 6.66 0.0158 1.000 40-yard Dash 0.3280 12.69 0.0014 1.000 Vertical Jump 0.3353 13.12 0.0012 1.000 Bodyweight 0.1866 5.96 0.0217 1.000
Table 4
Tests in ranking order from most significant to least significant within the Skill position group.
Variable R-Square F-Value Pr > F Tolerance 1. Vertical Jump 0.3353 13.12 0.0012 1.000 2. Power Clean 0.1264 3.62 0.0687 0.7498 3. 40-yard Dash 0.0549 1.39 0.2494 0.3382 4. Back Squat 0.0341 0.81 0.3766 0.3299 5. Bodyweight 0.0679 1.60 0.2189 0.3228 6. Push Jerk 0.0086 0.18 0.6739 0.1813 7. Bench Press 0.0234 0.48 0.4972 0.1407
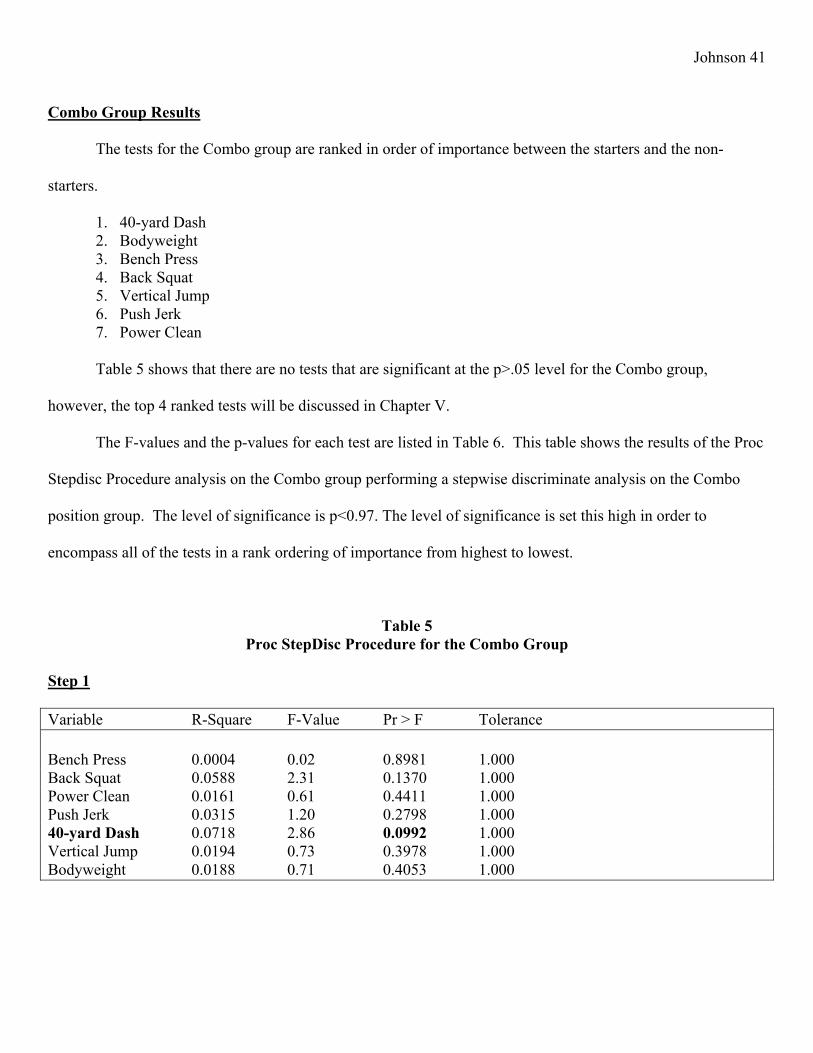
Johnson 41
Combo Group Results
The tests for the Combo group are ranked in order of importance between the starters and the non-
starters.
1. 40-yard Dash 2. Bodyweight 3. Bench Press 4. Back Squat 5. Vertical Jump 6. Push Jerk 7. Power Clean
Table 5 shows that there are no tests that are significant at the p>.05 level for the Combo group,
however, the top 4 ranked tests will be discussed in Chapter V.
The F-values and the p-values for each test are listed in Table 6. This table shows the results of the Proc
Stepdisc Procedure analysis on the Combo group performing a stepwise discriminate analysis on the Combo
position group. The level of significance is p<0.97. The level of significance is set this high in order to
encompass all of the tests in a rank ordering of importance from highest to lowest.
Table 5 Proc StepDisc Procedure for the Combo Group
Step 1 Variable R-Square F-Value Pr > F Tolerance Bench Press 0.0004 0.02 0.8981 1.000 Back Squat 0.0588 2.31 0.1370 1.000 Power Clean 0.0161 0.61 0.4411 1.000 Push Jerk 0.0315 1.20 0.2798 1.000 40-yard Dash 0.0718 2.86 0.0992 1.000 Vertical Jump 0.0194 0.73 0.3978 1.000 Bodyweight 0.0188 0.71 0.4053 1.000

Johnson 42
Table 6
Tests in ranking order from most significant to least significant within the Combo position group.
Variable R-Square F-Value Pr > F Tolerance 1. 40-Yard Dash 0.0718 2.86 0.0992 1.000 2. Bodyweight 0.1206 4.94 0.0327 0.7087 3. Bench Press 0.0365 1.33 0.2574 0.4929 4. Back Squat 0.0306 1.07 0.3072 0.4660 5. Vertical Jump 0.0210 0.71 0.4060 0.3573 6. Push Jerk 0.0070 0.23 0.6374 0.3545 7. Power Clean 0.0001 0.00 0.9637 0.3385
L.O.S. Group Results
The tests for the L.O.S. group are ranked in order of importance between the starters and the non-
starters.
1. Bodyweight 2. Vertical Jump 3. Bench Press 4. Back Squat 5. Power Clean 6. Push Jerk 7. 40-yard Dash

Johnson 43
Table 7 shows that the tests that are significant at the p>.05 level for the L.O.S. group are the: bench
press, push jerk, vertical jump, and bodyweight.
The F-values and the p-values for each test are listed in Table 8. This table shows the results of the Proc
Stepdisc Procedure analysis performing a stepwise discriminate analysis on the L.O.S. position group. The
level of significance is p<0.99. The level of significance is set this high in order to encompass all of the tests in
a rank ordering of importance from highest to lowest.
Table 7 Proc StepDisc Procedure for the L.O.S. group.
Step 1 Variable R-Square F-Value Pr > F Tolerance Bench Press 0.2240 8.66 0.0062 1.000 Back Squat 0.0531 1.68 0.2046 1.000 Power Clean 0.0733 2.37 0.1339 1.000 Push Jerk 0.1677 6.05 0.0199 1.000 40-yard Dash 0.0491 1.55 0.2229 1.000 Vertical Jump 0.1276 4.39 0.0448 1.000 Bodyweight 0.2709 11.15 0.0023 1.000

Johnson 44
Table 8
Tests in ranking order from most significant to least significant within the L.O.S. position group.
Variable R-Square F-Value Pr > F Tolerance 1. Bodyweight 0.2709 11.15 0.0023 1.000 2. Vertical Jump 0.2237 8.36 0.0072 0.9925 3. Bench Press 0.0599 1.78 0.1926 0.7771 4. Back Squat 0.0634 1.83 0.1876 0.6635 5. Power Clean 0.0798 2.25 0.1453 0.6074 6. Push Jerk 0.0009 0.02 0.8794 0.4821 7. 40-yard Dash 0.0000 0.00 0.9801 0.3451
The Proc Stepdisc analysis procedure found that between all three groups there are very different rankings
of tests being observed. Each group has separate rankings of tests, which are observed in Table 4 for the Skill
group, Table 6 for the Combo group, and Table 8 for the L.O.S. group.

Johnson 45
Chapter V
DISCUSSION, CONCLUSIONS, RECOMMENDATIONS, AND IMPLICATIONS
Introduction
Today’s athletes are becoming bigger, stronger, and faster (Costill et al., 1968; Kraemer & Gotshalk
2000; Olson & Hunter, 1985; Smith & Byrd, 1976; Stone et al., 2000). This is a function of most strength and
conditioning programs that evaluate their athletes on various tests used to measure their performance in
categories, such as strength, power, and speed. In this sense, the strength and conditioning professional uses
these tests to evaluate the athlete by comparing scores to another population’s scores.
The tests that are being evaluated, the bench press, back squat, power clean, push jerk, 40-yard dash,
vertical jump, and bodyweight, are all core exercises that are a mainstay for many strength and conditioning
programs (Black & Roundy, 1994; Fry & Kraemer, 1991). These tests are used to make comparisons between
types of athletes. In connection to this, the comparison made in this study, focused primarily on the starters and
the non-starters of Virginia Tech’s football team between the 1994 to the 2000 season. Playing status is the
issue of utmost importance. Also, with the review of literature that has established the importance of evaluating
tests (Arthur & Bailey, 1998; Gambetta, 1998; Graham, 1994; Kraemer& Gotshalk, 2000;), many previous
investigators showed evaluations between starters and non-starters on the same tests that are instituted in this
current study. The collecting of data that represents test scores between starters and non-starters in three
position groups, may help the strength and conditioning professional in proper and sport-specific program
design.
The purpose of this study was to determine what influence the strength, power, and performance tests
scores have on an individual’s playing status. These findings may be used to help the strength and conditioning
professional develop programs that may be more sport-specific for certain positions or position groups.

Johnson 46
Areas of key inquiry to be considered are the ability to rank the tests in order of importance. Can an
accurate assumption be made in ranking strength, power, and performance tests in order of importance? Is there
a relationship between these various tests and playing status? Can we make an accurate premise concerning
sport-specific training when looking at the ranking order of these tests?
Skill Group Discussion
Seven tests, which are the bench press, back squat, power clean, push jerk, vertical jump, 40-yard dash,
and bodyweight, were ranked in order of importance for each position group by the investigator of this study. A
Proc Stepdisc procedure was used to rank the tests in order of importance. In the skill group the tests were
ranked accordingly:
1.Vertical Jump 2. Power Clean 3. 40-Yard Dash 4. Back Squat 5. Bodyweight 6. Push Jerk 7. Bench Press
The rank ordering of the tests is the issue of importance. Although some of the mentioned tests may not
be significant at the p>.05 level the tests will still be discussed in this section.
The rank ordering of these tests suggests that power and speed can be used to distinguish a starter from a
non-starter in the skill position group. These data suggest that power and speed, in that order, are the most
important factors that separate starters from non-starters.
The tests of vertical jump and power clean are representative of power production. The vertical jump is
a test of lower body power. It measures jumping ability, which is a non-resistance test of power. This is the first
ranked test. The power clean is also a test of power and this is the second ranked test. These two tests
determine that power is the most important factor for the skill position group.

Johnson 47
Power is important for this group because of the explosive hip and leg power these athletes need to
posses in order to excel (Kraemer & Gotshalk, 2000). Power, being the number one factor in the skill position
group is not a surprising finding because of the position requirements. The athletes need to have great lower
body power in order to jump, and change directions in a hurry. This jumping ability is a measure of power,
which is an important requirement for these positions.
The 40-yard dash is the third ranked test to distinguish between starters and non-starters. Speed is a
factor that is easily predicted to rank high, because of the nature of the skill group positions. The skill group
positions, such as receivers and defensive backs, rely on speed and power to excel in the game of football (Fry
& Kraemer, 1991; Kraemer & Gotshalk, 2000). Athletes in the Skill group depend upon quickness, speed, and
power to cover receivers, run routes, and make tackles and blocks (Kraemer & Gotshalk, 2000; Pincervo &
Bompa, 1997). According to Kraemer and Gotshalk ,“Wide receivers became taller, big enough to fend off an
initial ‘bump’, and faster runners (for example the San Francisco 49’ers Jerry Rice). In response, defensive
backs generally became smaller and less bulky, but also quicker and faster (for example, the Washington
Redskins Darrell Green and the Dallas Cowboys, Deion Sanders), relying now on shadowing, quickness, and
speed to recover rather than route disruption and more contact downfield to defend against the passing game”
(2000, p. 797 )
This study also suggests that bodyweight and strength are the least important factors that distinguish
between starters and non-starters. This finding is also consistent with the previous studies conclusions on this
topic (Black & Roundy, 1994; Kraemer & Gotshalk, 2000; Pincievero & Bompa, 1997;). Bodyweight was
ranked fifth, while push jerk was ranked sixth, and the bench press was ranked seventh. Although the strength
and bodyweight factors are not as highly ranked as the speed and power factors, this is not to say that strength
and bodyweight do not contribute to the athlete’s success.

Johnson 48
It is interesting to note that the starters and non-starters are closer together on scores on the bench press,
back squat, push jerk, and the bodyweight than initially thought. This finding may suggest that the emphasis of
the training program that the athletes take part in may cater to strength movements. This emphasis on strength
movements, such as the bench press and the back squat, may create an environment where there is little
difference between starters and non-starters. The bench press and the back squat are two core strength lifts that
the athletes perform at Virginia Tech.
These two lifts are core strength exercises that the athlete may identify with more than other lifts. The
identification of these common lifts may cause the athletes, to place more emphasis on these two exercises than
others, which would lead to a closer gap between the starters and the non-starters.
The back squat and the bench press are also two lifts that are less complex to perform than other lifts,
such as, the Olympic-style lifts. The less complexity level might also lead to a closer gap between starters and
non-starters. These exercises are easier to perform than other exercises. Since the athletes are not pushing and
pulling against each other like the linemen and the linebackers do during competition, the skill position players
are more related to the types of movements that incorporate speed and power.
These data may also suggest that bodyweight may not contribute much on factors that differentiate
between starters and non-starters within the skill position group. This finding is consistent with studies
conducted by Berg et al., Black & Roundy, Kraemer & Gotshalk, and Pincivero & Bompa. Typically, the
athletes in this position group rely on speed and power to succeed in this sport. Bodyweight, therefore, would
not be considered a key factor that would separate a starter from a non-starter. These athletes need to be quick
enough to elude bigger linemen, fast enough to cover quick wide receivers, and fast enough to run passing
routes. Being bigger and possibly carrying a higher percentage of body fat may be detrimental to the athlete
(Kraemer & Gotshalk, 2000; Pincievero & Bompa, 1997). This higher percentage of body fat will usually
translate into a higher bodyweight measurement.

Johnson 49
The athletes in the skill group are smaller than athletes in the other two groups. They are also faster than
the athletes in the other two groups. These findings seem to conclude that the athletes in the Skill position
group are very powerful and fast. This finding is reflective of the difference between the starters and the non-
starters in the Skill group.
The main premise that has been established from the findings in the Skill group is that the starters seem
to be able to move better than the non-starters. The concept of movement as a major distinguisher between the
starters and the non-starters is derived from the vertical jump test, the Olympic-style lifts, such as, the power
clean, and the 40-yard dash. These are all tests of movement. For an athlete to be able to excel at one of these
positions in the Skill group, he must be able to move. Although this study does not take into consideration
lateral movement or shorter sprints, the findings still indicate that the ability to move the body is a key factor in
the success of an athlete in the Skill group. Future studies should utilize the short sprint tests and lateral
movement tests if the data are attainable. These tests may indicate further evidence that the ability to move the
body fast in different planes could be an important role for these athletes.
Another factor that may contribute to the ranking order is genetic potential. The starters could be
genetically more gifted in the areas of speed and power. This may be the one factor that could determine
playing status without evaluating any tests. In simple terms, the starter may be faster and more powerful than
the non-starters and there may be nothing that the non-starters can do about it.
Combo Group Discussion
Seven tests, (bench press, back squat, power clean, push jerk, vertical jump, 40-yard dash, and
bodyweight), were ranked in order of importance for each position group by the investigator of this study. A
Proc Stepdisc procedure was used to rank the tests in order of importance. In the combo position group the tests
were ranked accordingly:

Johnson 50
1. 40-Yard Dash 2. Bodyweight 3. Bench Press 4. Back Squat 5. Vertical Jump 6. Push Jerk 7. Power Clean
The rank ordering of the tests is the issue of importance. Although some of the mentioned tests may not be
significant at the p>.05 level the tests will still be discussed in this section.
The rank ordering of these tests suggests that the findings that distinguish a starter
from a non-starter are a combination of speed, size, and strength. This finding is consistent with other
investigators conclusions about these positions and/or position group (Berg et al.; Fry & Kraemer; Kraemer &
Gotshalk; Pincevero & Bompa). This finding is best represented in a quote by Pincivero and Bompa : “As a
result, an equal development of power, strength, speed, endurance, and agility is optimal for linebackers since
their duties range from contacting offensive linemen and tackling running backs to running downfield to cover
receivers and tight ends” (1997, p. 257). Although this quote only discusses the linebacker position it is still
representative of the combo position group. The positions in the Combo group are very similar in position
requirements, size, strength, power production, and speed (Kraemer & Gotshalk, 2000; Pincievero & Bompa,
1997). The athletes, regardless of whether they are linebackers, tightends, or fullbacks, are very similar in their
physical capabilities.
The rankings show that speed is the most important factor for this position group. This factor has been
an emphasis for Virginia Tech football. Speed has been emphasized on defense and in the skill positions on
offense for years. This emphasis might lead to a faster player becoming a starter rather than a player who is not
as fast. Virginia Tech plays an attacking defense that penetrates the offensive gaps. This penetration has to be
brought about with speed. The faster the athlete, the quicker he can fill the hole or close the gap on a running

Johnson 51
back. Speed being ranked number one, reflects the type of athletes that are being recruited for these positions at
Virginia Tech. Defensive ends, which are in the combo position group, are smaller and faster than defensive
ends of traditional defenses. These ends have to be able to move fast in order to succeed.
Bodyweight, which ranks second, reflects the importance of size on the field. This coupled with speed
reflects the importance of athletes in this position group having size and speed (Pincivero & Bompa,1997). Size
and speed are important to the athletes in the Combo group. These athletes have to be able to take on larger
linemen. This size will help these athletes complete their assignment. Fullbacks have to block larger linemen
and linebackers, while the linebackers have to shed blocks from the massive offensive linemen. Size is an
important attribute to obtain if the athlete is in the combo position group.
The bench press is ranked third, while the back squat is ranked fourth. This finding suggests that
strength is a very important factor that separates a starter from a non-starter. The athletes who belong in this
position group have to be strong to take on larger individuals.
For the bench press which is a test of upper body strength, Combo group players must have strong upper
bodies in order to shed blocks and make blocks. At the same time, the back squat is a test of lower body
strength. These athletes need to have great lower body strength in order to have good leg drive. This leg drive
will help the athlete make blocks and tackles.
Power is the last factor that distinguishes between starters and non-starters in this group. The vertical
jump is ranked fifth, the push jerk is ranked sixth, and the power clean is ranked seventh. This is a very
surprising finding. Before this study, the factor of power was thought to possibly be the most important factor
for this group. The reason behind why this result is not so clear may be attributed to the athletes in this group
who are quite powerful; also, and there is not much difference between the starters and the non-starters. For
whatever reason, power does not differentiate well between starters and non-starters.

Johnson 52
In this position group, there is an interesting event that occurs that is more visible than in the other
groups. When looking at the p-values for the tests, the changing of the bench press p-value from step 1 to step 3
is of interest. In step 1 the 40-yard dash had the lowest p-value of 0.0992. The bench press had the highest p-
value of 0.8981. In step 2 bodyweight had the highest p-value of 0.0327. The bench press had the highest p-
value of 0.8011. But during step 3, the bench press was raised to the highest rank with a p-value of 0.2574.
This may show a correlation between bench press and bodyweight within the Combo group at Virginia Tech.
These findings can provide strength and conditioning professionals with insight regarding the
programming needs of a Combo group athlete. The program needs to reflect an interest in developing faster
and larger athletes for these positions. It seems that strength also plays an important role in developing these
athletes. The key finding is the speed factor. It seems to play an important role for differentiating between
starters and non-starters. Therefore, speed may be an emphasis for the training of these athletes. More
specifically, speed coupled with the production of large, strong athletes would be optimal for this position group
(Berg et al., 1990; Fry & Kraemer, 1991; Kraemer & Gotsholk, 2000; Pincevero & Bompa, 1997).
The main conclusion that is drawn about the Combo group is that the athletes have to have size and
speed in order to succeed. The ability to be able to run fast while having good size can help in many ways. The
Combo group is wedged between the L.O.S. group, which contains much larger and stronger athletes, and the
Skill group which contains athletes that are smaller and faster. The biggest difference between the starters and
non-starters in the Combo group is bodyweight and the 40-yard dash times. This indicates that in order to start
an athlete must be able to compete with both types of athletes from the Skill group and the L.O.S group.
Another factor that may contribute to the ranking order is genetic potential. The starters could be
genetically more gifted in the areas of speed, size, and strength. The genetic potential may be the one factor
that could determine playing status without evaluating any tests. In simple terms, the starter may be faster and
larger, and stronger than the non-starters and there may be nothing that the non-starters can do about it.

Johnson 53
L.O.S. Group Discussion
Seven tests, which are the bench press, back squat, power clean, push jerk, vertical jump, 40-yard dash,
and bodyweight, were ranked in order of importance for each position group by the investigator of this study. A
Proc Stepdisc procedure was used to rank the tests in order of importance. In the L.O.S. position group the tests
were ranked accordingly:
1. Bodyweight 2. Vertical Jump 3. Bench Press 4. Back Squat 5. Power Clean 6. Push Jerk 7. 40-yard Dash
The rank ordering of the tests is the issue of importance. Although some of the mentioned tests may not
be significant at the p>.05 level the tests will still be discussed in this section.
The rank ordering of these tests suggest that the findings that distinguish a starter
from a non-starter in this group are a combination of size, lower body non-resistance power, and strength.
Bodyweight was ranked as the number one differentiator between starters and non-starters. This means that the
starters were more likely to be heavier than the non-starters. This finding is consistent with findings of other
investigators regarding bodyweight and the importance of size in these positions (Berg et al., 1990; Fry &
Kraemer, 1991; Kraemer & Gotshalk, 2000; Pincevero & Bompa, 1997). In order to be competitive, the athlete
needs to be large. The athlete has to have size to move other large bodies out of the way (Kraemer & Gotshalk,
2000). This finding was not a surprise; as expected, the larger athletes in these positions tend to get more
playing time than their small counterparts (offensive linemen and defensive linemen).
The vertical jump was the test that ranked second for the combo position group. Contrary to the
bodyweight finding, the vertical jump finding, was a surprise. This finding suggests that not only does the

Johnson 54
athlete need size but also lower body power. This lower body power is an indicator of explosion, and therefore
can be indicative of offensive and defensive linemen exploding off the line of scrimmage. Explosion is
important because these athletes need to move large, strong men off of the line of scrimmage. The offensive
linemen are relying on power and size to move the defensive linemen and linebackers out of the way of the
play. The defensive linemen are relying on size and power to get rid of the offensive linemen’s block so they
can make a tackle.
Strength was the next factor to be ranked. The bench press ranked third, while the back squat ranked
forth. As discussed earlier, the bench press is a test of upper body strength, while the back squat is a test of
lower body strength. Strength has been cited to be an important attribute for these positions since these
positions require the athletes to push and pull each other for positional ground (Berg et al., 1990; Fry &
Kraemer, 1991; Kraemer & Gotshalk, 2000; Pincevero & Bompa, 1997).
The power clean was ranked fifth, while the push jerk was ranked sixth. These two tests are resistance-
bearing exercises that assess total body power. One possible reason that these exercises are not ranked higher
may be that most of the athletes in this L.O.S. group are quite powerful and there is not much difference
between the starters and the non-starters. For whatever conclusion there may be, total body weight-bearing
resistance power is not a highly ranked factor differentiating between starters and non-starters.
Speed was the last factor that differentiated between starters and non-starters. This was not a surprise.
Offensive and defensive interior linemen are not required to run long distances at fast speed. These athletes are
required to be productive in a 5 to 10-yard distance. These athletes are more suited to place an emphasis on size
rather than speed. Size is a more productive attribute than speed is for this position group (Pincivero & Bompa,,
1997).
These findings can give strength and conditioning professional’s insight regarding the design of
strength and conditioning programs for the L.O.S. group athlete. The program needs to emphasis the

Johnson 55
development of larger athletes with lower body power, and strong athletes. The program may incorporate core
strength movements to create stronger athletes. Diets may also become available for athletes to follow, in order
to become larger. The key is to gain lean body mass and not excess fat. Excess fat has been shown to be
detrimental to the athlete’s performance (Bale et al., 1994; Mayhew et al., 1993; Wickkiser & Kelly, 1975;).
The most important finding in the L.O.S. group is the idea of lower body power being ranked so high.
In order for the athletes in the L.O.S. group to succeed they must possess great size and lower body power.
During the game the athletes in this group are making contact and collisions with other athletes that are the
same size and strength or in some cases larger and stronger. In order to be a starter the athlete needs to have
good size and power in order to succeed.
Another factor that may contribute to the ranking order is genetic potential. The starters could be
genetically more gifted in the areas of size, lower body power, and strength. The genetic potential may be the
one factor that could determine playing status without evaluating any tests. In simple terms, the starter may be
genetically larger, stronger, and more powerful in the lower body than the non-starters and there may be nothing
that the non-starters can do about it.
Conclusions
On the basis of the results of this study, the null hypotheses were rejected for the Skill Group and the
L.O.S. group, but the null hypothesis was retained for the Combo Group since there were no tests that
significantly distinguished starters from non-starters at the p>.05 level. Although there was significant
difference in the Combo Group there still appears to be a distinct rank ordering of tests between starters and
non-starters in all three-position groups. The tests are ranked in order of most important to least important for
each position group. All three-position groups found results that are training group-specific for their position
requirements.

Johnson 56
For the skill position group, results indicate that power is the most important factor differentiating
between starters and non-starters followed by speed, strength, and bodyweight.
In the combo position group, results indicate that speed is the most important factor differentiating
between starters and non-starters followed by bodyweight, strength, and power.
And finally, the L.O.S. position group results indicate that bodyweight is the most important factor
differentiating between starters and non-starters followed by lower body power, strength, total body power, and
speed.
It is interesting to note the different and complex requirements of each position group. It seems that the
skill group relies on power, speed, and less on strength and size. The combo group is indicative the fact that
they are a combination of the skill position group and the L.O.S. group. These athletes rely on speed, size, and
strength. The L.O.S. group relies on size, lower body power, and strength to excel in the game of football.
It should be noted that these results are only indicative of the Virginia Tech football program. However,
this study may hold true for teams that run a similar strength and conditioning program, and run a similar
offense and defense. Furthermore, this study may also hold true for other Division I universities that
concentrate on running the football and who emphasize speed on the field.
Possible Future Studies and Recommendations
Further inquiry is needed on tests that evaluate shorter sprints and lateral movement. Studies should
involve more speed and agility tests, such as, the 10-yard sprint, NFL shuttle, and the 5-yard sprint. This may
add more credibility to the study. The addition of these tests may make it more sport-specific for the positions.
Another possible study would be to find if there are any correlations between tests. This finding may
bring in a change about the way we train certain athletes and how we train these athletes.

Johnson 57
The data in this study recommends that strength and conditioning coaches train their athletes in a more
sport-specific method. Skill group positions players need more focus on power and speed development while
the Combo and L.O.S. groups need to focus on the size of the athletes. The Combo group athlete is also
recommended to train speed development since the 40-yard speed test ranked so high among these athletes.
Surprisingly the L.O.S. group athlete also may need to focus on lower body power production in their training
regime.
These recommendations are given in direct accordance through the data that has been collected and
discussed in this study.
Implications for the Strength and Conditioning Coach
This study may help strength and conditioning coaches design their programs in a more training group-
specific manner. It may give some professionals the information about what factors to implement more than
others in their own program.
Furthermore, this study may be used by some strength and conditioning professionals with the
separation of positions into different positions groups used for training purposes. The similarities of the
positions, in each group, create an environment in which the athletes will train in a more training group-specific
program. This concept will aid the strength and conditioning program to be more specific to the positions and
this will adequately fulfill the biomechanical needs and the positional requirements of the athletes.
Based on this study, the strength and conditioning professional, in designing his/her training program,
might best understand the different position requirements and the factors that are most important to that position
group in order to produce a training group-specific program that fits the needs of the athlete.
The strength and conditioning professional can use this information to provide information about the
various training groups to their athletes and coaches. This information can be used to help the strength and

Johnson 58
conditioning professional bridge gaps between their field and other fields within the athletic department. The
knowledge that is gained through this study may provide information that will help the training aspects of
various football programs. In turn, this will benefit the athletic department.
The factors that are discussed in this chapter may help the strength and conditioning coach and they may
benefit other strength and conditioning programs that are similar to Virginia Tech.

Johnson 59
References
Arce, J. H. (1994). Purdue University’s Power Building Strength and Conditoning Program. Strength and Conditioning Journal, 7-19.
Arnold, J.A., Coker, T.P. & Micheli, R.P. (1977). Anatomical and Physiological
Characteristics to Predict Football Ability at the University of Arkansas. The Journal of the Arkansas Medical Society 74, 253-260.
Arthur, M. R., & Bailey, B. (1998). Complete Conditioning for football.
Champaign, IL: Human Kinetics. Baechle, T.R. (1994). Essentials of Strength Training and Conditioning. Champaign, IL:
Human Kinetics, Inc. Baechle, T.R., & Groves, B. R. (1998). Weight Training: Steps to Success. Champaign,
IL: Human Kinetics. Baechle, T.R. & Earle, R.W..(2000). Essentials of Strength Training and Conditioning
(2nd ed.). Champaign, IL: Human Kinetics. Bale, P., Colley, E., Mayhew, J.L., Piper, F.C., & Ware,J.S. (1994). Anthropometric and
Somatototype variables related to strength in American Football Players. The Journal of Sports Medicine and Physical Fitness,34, 4, 383-389.
Barker, M., Wyatt, T.J., Johnson, R.L., Stone, M.H., O’Bryant, H.S., Poe, C. & Kent, M.
(1993). Performance Factors, Psychological Assessment, Physical Characteristics, and football Playing Ability. Journal of Strength and Conditioning Research, 7(4), 224-233.
Berg, K., Latin, R.W. & Baechle, T. (1990). Physical and Performance Characteristics of
NCAA Division I Football Players. Research Quarterly For Exercise and Sport, 61(4), 395-401.

Johnson 60
Black, W. & Elmo, R. (1994). Comparisons of Size, Strength, Speed, and Power in
NCAA Division 1-A Football Players. Journal of Strength and Conditioning Research, 8,2, 80-85.
Burke, E.J., Winslow, M.S. & Strube, W.V. (1980). Measures of body composition and
performance in major college football players. Journal of Sports Medicine. 20, 173 – 180.
Chandler, J., & Stone, M. H. (1991). The Squat Exercise in Athletic Conditioning: A
Review of the Literature. National Strength and Conditioning Association Journal, 13, 5, 34-38.
Costill, D.L., Hoffman, W.M., Kehoe, F., Miller, S.J. & Myers, W.C. (1968). Maximum
anaerobic power among college football players. Journal of sports Medicine and Physical Fitness, 8, 103-106.
Crews, T.R. & Meadors, W.J. (1978). Analysis of reaction time, speed, and body
composition of college football players. Journal of Sports Medicine 18, 169-174. Ebben, W. P. (1998). A Review of Football Fitness Testing & Evaluation.
Strength and Conditioning Journal, 42-47. Fincher, G. (2000). Less is More in Resistance Training. Biomechanics. 43-52. Fry, A. C. & Kraemer, W. J. (1991). Physical Performance Characteristics of American Collegiate Football Players. Journal of Applied Sport Science Research,5,3,
126-137. Foss, M. L., & Keteyian, S. J. (1998). Physiological Basis For Exercise and Sport.
Boston, MA: McGraw-Hill. Gambetta, Vern. (1998). The Gambetta Method. Sarasota, Florida, Gambetta Sports
Training System, Inc.

Johnson 61
Garhammer, J. & Gregor, P. (1992). Propulsion forces as a function of intensity for
weightlifting and vertical jumping. Journal of Applied Sports Science Research, 6(3), 129-134.
Graham, J. (1994). Guidelines for Providing Valid Testing of Athletes Fitness
Levels.Strength and Conditioning, 7-13. Hedrick, A. (1996). The Vertical Jump: A Review of the Literature and a Team Case
Study. Strength and Conditioning Journal, 7-12. Jones, L. (1994). USWF Coaching Accreditation Course: Club Coach Manual. Colorado
Springs, Co: U.S. Weightlifting Federation. Kraemer, W.J. (1997). A Series of Studies- The Physiological Basis for Strength Training in American
Football: Fact Over Philosophy. Journal of Strength and Conditioning Research, 11, 3, 131-142. Kraemer, W. B., & Gotshalk, L. A. (2000). Physiology of American Football. Exercise
and Sport Science, 795-813. Kramer, J.B., Stone, M.H., O’Bryant, H.S., Conley, M.S., Johnson, R.L., Nieman, D.C.,
Honeycutt, D.R., Hoke, T.P. (1997). Effects of Single vs. Multiple Sets of Weight Training: Impact of Volume, Intensity, and Variation. Journal of Strength and Conditioning Research, 11,3, 143-147.
Mayhew, J.L., Wolfe, D.R. & McCormick, T. (1987). Determination of Starters on a
College Football Team from Speed, Strength, and Power Measurement. The Journal of Applied Sport Science Research, 1(3),60.
Mayhew, J.L., Bemben, M.G., Piper, F.C., Ware, J.S., Rohrs, D.M. & Bemben, D.A.
(1993). Assessing Bench Press Power in College Football Players: The Seated Shot Put. Journal of Strength and Conditioning Research, 7(2), 95-100.
McDavid,R.F. (1977). Predicting Potential in Football Players. The Research Quarterly,
48(1), 98-103. Neitzel, J. A., & Davies, G. J. (2000). The Benefits & Controversy of the Parallel Squat
in Strength Training & Rehabilitation. Journal of Strength and Conditioning Research, 22, 3, 30-37.

Johnson 62
Olson, J.R. & Hunter, G.R. (1985). A comparison of 1974 and 1984 player sizes, and
maximal strength and speed efforts for Division I NCAA Universities. National Strength and Conditioning Association Journal, 26-28.
O’Shea, P. (1999). Toward an Understanding of Power. Strength and ConditioningJournal. 21, 5, 34-36. O’Shea, J.P. & Wegner, J. (1981). Power weight training and the Female athlete. Physician and Sportsmedicine.
9(6), 109-120. Pearson,P., Faigenbaum, A., Conley, M. & Kraemer, W.J. (2000). The National Strength
and Conditioning Associations Basic Guidelines for Resistance Training of Athletes. Strength and Conditioning Journal, 22,4, 14-27.
Pearson D.R. & Gehlson G. M. (1998). Athletic Performance Enhancement: A Study With College Football
Players. Strength and Conditioning Journal, 70-73. Pincivero & Bompa, (1997). A Physiological Review of American Football. Sports Medicine. 23(4), 247-260. Pullo, F.M. (1992). A Profile of NCAA Division I Strength and Conditioning Coaches. Journal of Applied
Sport Science Research, 6(1), 55-62. ProcStepDisc Procedure. Retrieved from World Wide Web:
http://www2.chass.ncsu.edu/garson/pa765/discrim.htm Schmidt, W.D. (1999). Strength and Physiological Characteristics of NCAA Division III American Football Players. Journal of Strength and Conditioning Research, 13(3),
210-213. Seiler,S., Taylor, M., Diana, R., Layes, J., Newton, P., & Brown, B. (1994). Assessing Anaerobic Power in
Collegiate Football Players. Journal of Applied Sport Science Research, 4, 1, 9-15.

Johnson 63
Smith, D.P. & Byrd, R.J. (1976). Body Composition, pulmonary function and maximal
oxygen consumption of college football players. Journal of Sports Medicine and Physical Fitness.16, 301-308.
Stone, M.H., Collins, D., Plisk, S., Hatty, G. & Stone, M.E. (2000). Training Principles:
Evaluation of Modes and Methods of Resistance Training. Strength and Conditioning Journal, 22, 3, 65-76.
Wickkiser, J.D. & Kelly, J.M. (1975). The body composition of a college football team.
Medicine and Science in Sports. 7(3), 199-203.

Johnson 64
APPENDIX A
Description of Exercises
This is a standard Olympic bar and plates. The brand name is Eleiko.
This is a bench press rack. The bar and weights are standard Olympic style. The brand name is York.

Johnson 65
This is a power rack where the back squat, power clean, and the push jerk are performed.
This is a Vertec used to measure Vertical Jump

Johnson 66
Bench Press Description
Use a shoulder width grip. Lie down on a flat bench. Lower the weight slowly until the bar touches the middle of the chest and drive the bar upward towards the rack. Keep feet flat on the floor and buttocks on the bench at all times. Always use a spotter.
Figure 1
Figure 2
Figure 3

Johnson 67
Back Squat Description
Figure 1 Figure 4
Figure 2
Figure 3
Rest the bar on the back right below the trapezious, keep the back arched and the weight over the hips at all times. The feet should be slightly wider than shoulder width with the toes slightly pointed out. Go down slowly until the bottom of the thigh is parallel to the floor. Drive up quickly. Do not bounce at the bottomof the lift.

Johnson 68
Power Clean Description
Figure 1 Figure 2
Figure 3 Figure 4
“The lifter approaches the barbell while it is on the platform with their back straight. Elbows rotated out to sides. Arms straight and shoulders set in advance of bar. From this position by first extending the legs, then the body upward in a violent movement, finally shrugging the shoulders and rising up on to the balls of the feet before dipping and receiving the bar at the shoulders as before (Jones, L., 1994).”
Figure 5

Johnson 69
Description of the Push Jerk
Figure 1 Figure 2
Figure 3 Figure 4
Do this exercise standing, take the weight out of the rack. The bar is racked on the shoulders as in the completion of a power clean. Rock up on toes to get your momentum started, then squat 4” to 5” and quickly drive the legs up and throw the weight overhead. The bar should lock-out directly over the lifters head or slightly behind. Bend your knees when you lock-out the weight, then stand up. This is a jerk not a military press. The concept is of throwing and catching the weight.

Johnson 70
Description of the Vertical Jump
Figure 1 Figure 3
Figure 2 The athlete’s reach is taken by walking the athlete through the vertec and then recording the reach, as seen in Figure 1. The athlete jumps as high as he can with the feet first being stationary on the ground. The athlete cannot take a step. This is presented in Figure 2. The athlete’s jump height is subtracted by the reach height in order to get the vertical jump measurement.

Johnson 71
Description of the 40-Yard Dash
The 40-Yard dash is taken by a strength and conditioning coach with a watch. The athlete runs as fast as he can for 40-yards.

Johnson 73
APPENDIX B Descriptive Statistics
In this section the descriptive data for the subjects are illustrated in Table 9
through Table 20. These tables portray the Number, Mean, Median, Mode, Standard
Deviation, and Range for each of the tests. The tables represent the subjects in separate
categories.
Table 9 Descriptive Data for All Subjects
Variable n Mean Median Mode SD Range Bench Press 105 350.66 355 400 56.12 230-500 Back Squat 105 518.66 530 550 74.95 320-700 Clean 102 314.14 316 300 47.36 180-445 Jerk 103 312.91 320 300 41.80 211-401 40-Yard 102 4.74 4.70 4.48 0.29 4.3-5.5 Vertical Jump 105 32.79 33 36 4.19 22.5-43.5 Age 105 22.32 22 22 0.93 21-26 Bodyweight 105 234.87 235 202 44.42 164-322
Table 10 Descriptive Data for All Non-Starters
Variable n Mean Median Mode SD Range Bench Press 42 335.71 340 370 53.27 230-420 Back Squat 42 504.64 530 550 76.51 320-630 Clean 41 301.09 300 300 48.45 180-410 Push Jerk 42 300.76 300 300 40.90 211-386 40-Yard 40 4.81 4.8 4.67 0.29 4.32-5.5 Vertical Jump 42 31.52 31.75 27.5 4.07 22.5-42 Age 42 22.5 22 22 1.08 21-26 Bodyweight 42 227.38 234.5 235 42.43 163-322

Johnson 74
Table 11 Descriptive Data for All Starters
Variable n Mean Median Mode SD Range Bench Press 63 360.63 360.63 400 56.16 230-500 Back Squat 63 528.01 530 500 73.00 350-700 Clean 61 322.91 316 300 44.90 226-445 Push Jerk 61 321.27 326 331 40.65 225-401 40-Yard 62 4.70 4.6 4.48 0.29 4.22-5.41 Vertical Jump 63 33.64 34 30 4.07 25-43.5 Age 63 22.20 22 22 0.80 21-24 Bodyweight 63 239.87 235 202 45.33 163-
Table 12 Descriptive Data for Skill Group
Variable n Mean Median Mode SD Range Bench Press 28 300.89 300 310 46.90 230-400 Back Squat 28 448.75 455 500 60.30 320-575 Clean 28 282.78 277.5 226 43.35 180-365 Push Jerk 28 278.35 270 250 41.26 211-390 40-Yard 28 4.49 4.46 4.38 3.51 4.22-4.89 Vertical Jump 28 35.73 36 36 3.51 27.5-43.5 Age 28 22.32 22 22 1.12 21-26 Bodyweight 28 186.35 185.5 172 14.15 163-219
Table 13 Descriptive Data for Combo Group
Variable n Mean Median Mode SD Range Bench Press 43 356.62 355 340 41.8 270-440 Back Squat 43 526.44 530 550 53.06 360-650 Clean 42 318.54 316 300 45.42 220-410 Push Jerk 42 312.26 307.5 300 33.4 255-401 40-Yard 41 4.64 4.62 4.7 0.16 4.3-4.95 Vertical Jump 43 33.8 34 34 3.38 28-42 Age 43 22.44 22 22 0.76 21-24 Bodyweight 43 224.34 227 235 21.64 180-275

Johnson 75
Table 14 Descriptive Data for L.O.S. Group
Variable n Mean Median Mode SD Range Bench Press 34 384.11 385 400 51.01 290-500 Back Squat 34 571.47 575 530 64.08 430-700 Clean 32 335.81 328.5 300 39.29 275-445 Push Jerk 33 343.06 336 326 26.84 270-387 40-Yard 34 5.08 5.1 5.1 0.19 4.64-5.5 Vertical Jump 34 29.02 29.25 27.5 2.68 22.5-35.5 Age 34 22.17 22 22 0.96 21-25 Bodyweight 34 288.14 290.5 290 19.82 243-322
Table 15 Descriptive Data for Non-Starters in Skill Group
Variable n Mean Median Mode SD Range Bench Press 10 273.5 270 270 26.03 230-310 Back Squat 10 421.5 427.5 400 51.58 320-500 Clean 10 251.9 250.5 246 34.96 180-316 Push Jerk 10 253.8 252.5 250 26.9 211-295 40-Yard 10 4.61 4.57 4.57 0.17 4.38-4.89 Vertical Jump 10 33.05 34 4.57 3.26 27.5-38 Age 10 22.7 22 22 1.41 21-26 Bodyweight 10 178.3 180.5 172 9.38 163-190
Table 16 Descriptive Data for Starters in Skill Group
Variable n Mean Median Mode SD Range Bench Press 18 316.11 312.5 300 49.48 230-400 Back Squat 18 463.88 480 500 60.72 350-575 Clean 18 299.94 300 280 38.28 226-365 Push Jerk 18 292 300 250 42.06 226-390 40-Yard 18 4.43 4.42 4.4 0.09 4.22-4.59 Vertical Jump 18 37.22 37 36 2.71 33-43.5 Age 18 22.11 22 22 0.90 21-24 Bodyweight 18 190.83 190.5 186 14.57 164-219

Johnson 76
Table 17 Descriptive Data for Non-Starters in Combo Group
Variable n Mean Median Mode SD Range Bench Press 19 355.26 355 400 43.69 270-420 Back Squat 19 511.84 530 550 64.27 360-600 Clean 18 312.50 300 300 47.38 220-410 Push Jerk 19 305.78 300 300 32.28 260-360 40-Yard 17 4.69 4.7 4.67 0.18 4.5-4.95 Vertical Jump 19 33.18 33 28 3.54 28-42 Age 19 22.68 23 23 0.74 21-24 Bodyweight 19 219.84 215 235 23.54 180-270
Table 18 Descriptive Data for Starters in Combo Group
Variable n Mean Median Mode SD Range Bench Press 24 357.7 357.5 340 41.15 270-440 Back Squat 24 530.83 532.5 500 41.74 460-650 Clean 24 323.08 320.5 316 44.36 250-450 Push Jerk 23 317.60 321 280 34.06 255-401 40-Yard 24 4.60 4.58 4.48 0.15 4.3-4.91 Vertical Jump 24 34.39 34.75 34 3.23 28-40.5 Age 24 22.25 22.25 22 0.73 21-24 Bodyweight 24 227.91 227.91 197 19.78 197-275
Table 19 Descriptive Data for Non-Starters in L.O.S. Group
Variable n Mean Median Mode SD Range Bench Press 13 355 370 410 45.73 290-410 Back Squat 13 558.02 575 575 53.6 430-630 Clean 13 323.13 316 316 31.46 275-386 Push Jerk 13 329.53 326 326 29.92 270-386 40-Yard 13 5.13 5.12 5.12 0.19 4.78-5.5 Vertical Jump 13 27.92 27.5 27.5 3.08 22.5-34.5 Age 13 22.07 22 22 1.18 21-25 Bodyweight 13 276.11 270 303 24.11 243-322

Johnson 77
Table 20
Descriptive Data for Starters in L.O.S. Group Variable n Mean Median Mode SD Range Bench Press 21 402.14 400 400 46.32 320-500 Back Squat 21 579.76 575 530 69.74 450-700 Clean 19 344.47 340 300 42.46 290-445 Push Jerk 20 344.47 351 331 21.88 320-387 40-Yard 20 5.05 5.09 5.10 0.19 4.64-5.41 Vertical Jump 21 29.21 30 30 2.21 25-35.5 Age 21 22.23 22 22 0.83 21-24 Bodyweight 21 295.57 296 290 12.18 270-317

Johnson 78
APPENDIX C Step Procedures for each position group using the Proc StepDisc statistical procedure
Table 21 Proc StepDisc Procedure for the Skill Group
Step 1 Variable R-Square F-Value Pr > F Tolerance Bench Press 0.1965 6.36 0.0181 1.000 Back Squat 0.1176 3.47 0.0740 1.000 Power Clean 0.2923 10.74 0.0030 1.000 Push Jerk 0.2040 6.66 0.0158 1.000 40-yard Dash 0.3280 12.69 0.0014 1.000 Vertical Jump 0.3353 13.12 0.0012 1.000 Bodyweight 0.1866 5.96 0.0217 1.000
Step 2 Variable R-Square F-Value Pr > F Tolerance Bench Press 0.0347 0.90 0.3519 0.7023 Back Squat 0.0002 0.01 0.9401 0.6695 Power Clean 0.1264 3.62 0.0687 0.7498 Push Jerk 0.0279 0.72 0.4054 0.6515 40-yard Dash 0.0530 1.40 0.2482 0.3747 Bodyweight 0.0626 1.67 0.2083 0.8172 Step 3 Variable R-Square F-Value Pr > F Tolerance Bench Press 0.0000 0.00 0.9850 0.5029 Back Squat 0.0162 0.39 0.5361 0.5852 Push Jerk 0.0240 0.59 0.4494 0.2924 40-yard Dash 0.0549 1.39 0.2494 0.3382 Bodyweight 0.0049 0.12 0.7340 0.5232

Johnson 79
Step 4 Variable R-Square F-Value Pr > F Tolerance Bench Press 0.0006 0.01 0.9105 0.3280 Back Squat 0.0341 0.81 0.3766 0.3299 Push Jerk 0.0229 0.54 0.4703 0.2920 Bodyweight 0.0114 0.26 0.6118 0.3235 Step 5 Variable R-Square F-Value Pr > F Tolerance Bench Press 0.0205 0.46 0.5044 0.2659 Push Jerk 0.0026 0.06 0.8145 0.1852 Bodyweight 0.0679 1.60 0.2189 0.3228
Step 6
Variable R-Square F-Value Pr > F Tolerance Bench Press 0.0081 0.17 0.6825 0.2526 Push Jerk 0.0086 0.18 0.6739 0.1813
Step 7 Variable R-Square F-Value Pr > F Tolerance Bench Press 0.0234 0.48 0.4972 0.1407

Johnson 80
Table 22 Proc StepDisc Procedure for the Combo Group
Step 1 Variable R-Square F-Value Pr > F Tolerance Bench Press 0.0004 0.02 0.8981 1.000 Back Squat 0.0588 2.31 0.1370 1.000 Power Clean 0.0161 0.61 0.4411 1.000 Push Jerk 0.0315 1.20 0.2798 1.000 40-yard Dash 0.0718 2.86 0.0992 1.000 Vertical Jump 0.0194 0.73 0.3978 1.000 Bodyweight 0.0188 0.71 0.4053 1.000
Step 2
Variable R-Square F-Value Pr > F Tolerance Bench Press 0.0018 0.06 0.8011 0.9948 Back Squat 0.0441 1.66 0.2055 0.9747 Power Clean 0.0269 0.99 0.3252 0.9874 Push Jerk 0.0418 1.57 0.2180 0.9949 Vertical Jump 0.0045 0.16 0.6892 0.5189 Bodyweight 0.1206 4.94 0.0327 0.7087
Step 3
Variable R-Square F-Value Pr > F Tolerance Bench Press 0.0365 1.33 0.2574 0.4929 Back Squat 0.0014 0.05 0.8253 0.5184 Power Clean 0.0012 0.04 0.8387 0.6032 Push Jerk 0.0015 0.05 0.8198 0.3934 Vertical Jump 0.0124 0.44 0.5115 0.4023

Johnson 81
Step 4
Variable R-Square F-Value Pr > F Tolerance Back Squat 0.0306 1.07 0.3072 0.4660 Power Clean 0.0060 0.21 0.6525 0.4663 Push Jerk 0.0032 0.11 0.7423 0.3770 Vertical Jump 0.0162 0.56 0.4588 0.3767 Step 5
Variable R-Square F-Value Pr > F Tolerance Power Clean 0.0016 0.05 0.8179 0.4506 Push Jerk 0.0027 0.09 0.7654 0.3631 Vertical Jump 0.0210 0.71 0.4060 0.3573
Step 6
Variable R-Square F-Value Pr > F Tolerance Power Clean 0.0019 0.06 0.8061 0.3570 Push Jerk 0.0070 0.23 0.6374 0.3545 Step 7
Variable R-Square F-Value Pr > F Tolerance Power Clean 0.0001 0.00 0.9637 0.3385

Johnson 82
Table 23 Proc StepDisc Procedure for the L.O.S. group.
Step 1 Variable R-Square F-Value Pr > F Tolerance Bench Press 0.2240 8.66 0.0062 1.000 Back Squat 0.0531 1.68 0.2046 1.000 Power Clean 0.0733 2.37 0.1339 1.000 Push Jerk 0.1677 6.05 0.0199 1.000 40-yard Dash 0.0491 1.55 0.2229 1.000 Vertical Jump 0.1276 4.39 0.0448 1.000 Bodyweight 0.2709 11.15 0.0023 1.000 Step 2. Variable R-Square F-Value Pr > F Tolerance Bench Press 0.1236 4.09 0.0525 0.8597 Back Squat 0.0060 0.18 0.6775 0.8964 Power Clean 0.0295 0.88 0.3557 0.9388 Push Jerk 0.1240 4.10 0.0521 0.9498 40-yard Dash 0.1728 6.06 0.0200 0.9439 Vertical Jump 0.2237 8.36 0.0072 0.9925 Step 3 Variable R-Square F-Value Pr > F Tolerance Bench Press 0.0599 1.78 0.1926 0.7771 Back Squat 0.0257 0.74 0.3975 0.7279 Power Clean 0.0288 0.83 0.3700 0.9302 Push Jerk 0.0387 1.13 0.2976 0.7899 40-yard Dash 0.0115 0.33 0.5726 0.4187

Johnson 83
Step 4 Variable R-Square F-Value Pr > F Tolerance Back Squat 0.0634 1.83 0.1876 0.6635 Power Clean 0.0355 0.99 0.3280 0.7732 Push Jerk 0.0057 0.16 0.6968 0.5382 40-yard Dash 0.0036 0.10 0.7587 0.4007
Step 5 Variable R-Square F-Value Pr > F Tolerance Power Clean 0.0798 2.25 0.1453 0.6074 Push Jerk 0.0083 0.22 0.6453 0.5106 40-yard Dash 0.0004 0.01 0.9178 0.3815 Step 6 Variable R-Square F-Value Pr > F Tolerance Push Jerk 0.0009 0.02 0.8794 0.4821 40-yard Dash 0.0001 0.00 0.9629 0.3770 Step 7 Variable R-Square F-Value Pr > F Tolerance 40-yard Dash 0.0000 0.00 0.9801 0.3451

Johnson 84
APPENDIX D
ANOVA p-Values and F-Values for each group
Skill Combo L.O.S. F-Value p-Value F-Value p-Value F-Value p-Value
Bench 6.11 0.0151* 0.03 0.8558 9.34 0.0029* Squat 3.44 0.0668 1.14 0.2887 1.12 0.2918 Clean 8.70 0.0040* 0.68 0.4131 2.06 0.1547 Jerk 9.10 0.0033* 1.41 0.2381 3.80 0.540 40-Yard 7.45 0.0075* 2.50 0.1175 2.12 0.14186 V.J. 12.31 0.0007* 1.71 0.1937 2.83 0.0955 Weight 3.00 0.0864 2.05 0.1550 8.99 0.0034* * Tests that are significant at the p<.05 level.

Johnson 85
Curriculum Vitae
JACK BUCKLAND JOHNSON JR.
75 Goldleaf Drive Christiansburg, VA 24073
540-231-8207 [email protected]
EXPERIENCE: Assistant Director of Strength and Conditioning, Virginia Polytechnic Institute and State University (2001 to Present) Strength and Conditioning Coordinator for Men’s Olympic Sports, Virginia Polytechnic Institute and
State University (1999-2001)
Head Strength and Conditioning Coach, Radford University (1996-1999) EDUCATION: Doctor of Philosophy, Teaching and Learning, Virginia Polytechnic Institute and State University, 2001 Master of Science, Physical Education, Radford University, 1998 Bachelor of Arts, Health and Physical Education, Emory and Henry College, 1995 BIRTHDATE: December 26, 1971