Embed Size (px)
Citation preview

Evaluating RAP Mixtures using the Mechanistic Empirical Pavement Design Guide Level 3 Analysis
Ghassan R. Chehab Assistant Professor Department of Civil and Environmental Engineering The Pennsylvania State University 212 Sackett Building University Park, PA 16802 Ph: (814) 863-2936 Fax: (814) 863-7304 Email: [email protected] Jo Sias Daniel Assistant Professor Department of Civil Engineering University of New Hampshire W171 Kingsbury Hall Durham, NH 03824 Ph: (603) 862-3277 Fax: (603) 862-2364 Email: [email protected] Submitted for Presentation at the 2006 TRB Annual Meeting and Publication in the Transportation Research Record: Journal of the Transportation Research Board Word Count: 7365 words (4865 text, 2500 tables and figures) March 2006
Chehab and Daniel 2
ABSTRACT The main objective of this study is to assess the sensitivity of assumed binder grade on performance prediction of RAP mixtures. This is achieved by utilizing the Mechanistic-Empirical Design Guide (MEPDG) software to predict the performance of a specific flexible pavement structure with a RAP modified HMA surface layer. Different design runs are conducted for which all the pavement properties and conditions are held constant except for the properties of the surface layer. Specifically, a near-full factorial experiment is performed where RAP content and effective binder PG grade are the main variables. Comparison of the predicted performance of the various runs reveals important findings on the extent and manner that those two properties affect pavement distresses and performance. The influence of the assumed PG binder grade, particularly the high temperature grade, for the RAP mixtures has a significant influence on the predicted amount of thermal cracking and rutting for the given structure. The predicted performance is especially sensitive to changes in assumed PG grade in the range where the true effective PG grade is expected to fall; the difference from one PG grade to another can be the difference between a well performing mixture and one that requires redesign. The results emphasize the importance of determining the effective binder grade of RAP mixtures. An added benefit of conducting the numerous MEPDG software runs is the identification of issues that need to be considered when incorporating RAP mixtures in pavement design using the software.
Chehab and Daniel 3
INTRODUCTION Many agencies currently allow, or even encourage, the use of recycled asphalt pavement (RAP) materials in hot mix asphalt (HMA). The amount of RAP used varies depending upon agency experience and the application of national guidelines developed under NCHRP project 9-12 (1-3). The addition of the aged RAP binder in the mix will increase the stiffness measured in the laboratory. Recent research conducted at the University of New Hampshire (4) has shown that the addition of RAP can also increase the VMA of the mixture. The increase in VMA decreases the mixture stiffness, offsetting the increase due to the RAP binder. However, how this translates to mixture performance in the field is not well defined.
The new mechanistic-empirical pavement design guide (MEPDG) uses various models to predict pavement performance from measured or predicted material properties. The MEPDG uses a hierarchal approach; different levels of analysis are available depending upon desired reliability and available information. Level 1 analysis in the MEPDG uses laboratory measured values for the specific mixture while Level 3 analysis uses predicted mixture properties that are based on the binder and aggregate properties. With RAP mixtures, the appropriate binder properties are difficult to define, as there is a partial blending that occurs between the RAP binder and the virgin binder. Huang, et al (5) performed staged extractions on RAP mixtures and showed that a portion of the RAP binder mixed with the virgin binder while the remainder stayed as a coating on the RAP aggregates.
The main goal of this research is to evaluate the predicted field performance of RAP mixtures using Level 3 analysis. Extensive material characterization has been performed on a control mixture and mixtures containing 15%, 25%, and 40% RAP. Analysis is performed for a typical high volume pavement structure in New Hampshire. Traffic and climate data used in the analysis was obtained from New Hampshire Department of Transportation (NHDOT) as well as from a LTPP site. The predicted performance, in terms of rutting, longitudinal cracking, transverse cracking, and IRI for the different RAP mixes is compared for developing relationships between percent RAP and effective binder grade of RAP mixes and performance. Level 3 analysis is conducted using RAP binder properties, virgin binder properties, and combinations of the two to determine the appropriate method of dealing with RAP mixtures in the Level 3 analysis and the sensitivity of the results to the input parameters.
The outcome of this work is a better understanding of the issues involved in performing analysis on RAP mixtures within the framework of the MEPDG. It also provides some information on the expected performance of mixtures with various percentages of RAP. OBJECTIVES The objectives of this study are to:
1. Evaluate the sensitivity of predicted performance to assumed PG grade using Level 3 analysis;
2. Compare the predicted performance of mixtures with different RAP content and different effective binder grade; and
3. Provide recommendations on issues encountered when performing analysis of RAP mixtures within the MEPDG framework.

Chehab and Daniel 4
RESEARCH APPROACH To meet the stated objectives, the MEPDG is used as a platform to evaluate several RAP modified mixtures by incorporating them as AC mixtures for the surface overlay course of a pavement structure. The pavement structure chosen is a LTPP GPS-1 section on I-393 in Concord, NH, that has been recently overlaid with a RAP mixture. Several designs are run using primarily Level 3 analysis, with some Level 2 inputs, in the MEPDG software. The surface course mixture properties such as percentage RAP and effective PG grade for the RAP are varied for the different runs. Level 1 analysis could not be conducted at the time of this study due to associated problems and limitations in the software, particularly when using dynamic modulus, |E*|, as a Level 1 input for AC. The differences in predicted performance among different runs are used to deduce the effect of percent RAP on performance, in addition to the importance and level of accuracy required in determining the effective binder grade of a blended RAP mixture. EXPERIMENTAL PLAN The properties of the subgrade, base course, and AC binder courses are kept constant while the properties of the 3” surface layer are changed. Thicknesses of all the layers are constant for all analyses. Analyses were performed at four conditions: 0% RAP (control), 15% RAP, 25% RAP, and 40% RAP. The Level 3 analysis requires binder and aggregate properties as inputs and then uses predictive equations to obtain mixture properties. The difficulty in using Level 3 analysis with RAP mixtures is in uncertainty associated with the effective binder grade of the RAP mixture, which is a function of the RAP binder properties and the virgin binder properties. It is theorized that partial blending of these binders takes place such that the effective binder properties lie somewhere in between the two extremes. Currently, no method exists to determine the effective binder properties of RAP mixtures. Thus, the purpose of the Level 3 analysis performed in this study is to evaluate the sensitivity of the predicted performance to the binder data that is input to the program. To achieve that, a range of binder data were input for each RAP mixture; from the virgin 58-28 binder to an 82-12 binder, which is the stiffest allowed by the software for Level 3. TEST SECTION LOCATION AND PAVEMENT HISTORY The section used for this study is part of the GPS-1 LTPP experiment (ID 33-1001-1): Asphalt Concrete (AC) Pavement on Granular base. It is located on the east-bound lane of I-393 in Concord, New Hampshire, between Exits 1 and 2. A weigh-in-motion (WIM) station (ID 099149) is located about one mile further east and a weather station located nearby in the city of Concord is used for climatic data.
The original flexible pavement section was constructed in 1988 for a 20-year design life. The pavement is a full depth HMA on top of aggregate base and natural subgrade. Upon initial construction, the HMA layers consisted of a 1.2” thick dense graded AC surface course and a 7.2” thick dense-graded AC binder course. The base is composed of a 19.3” thick layer of crushed stone with a fine gradation; the sub-base is a 14.4” layer of sand with gravel, and the natural subgrade is fine sand.
Due to significant wheel-path and non wheel path cracking, and excessive roughness, the section was rehabilitated in 2002, after which it was de-assigned as an LTPP section. The rehabilitation conducted in 2002 consisted of milling 3” off the top of existing AC layers and replacing it with a 3” RAP-modified HMA overlay. The rehabilitated cross section is used for analysis in this study. The subgrade, base, and binder course properties are held constant
Comment [JSD1]: Do we need more detail here?
Comment [JSD2]: Good statement. Not too strong. No reference though.

Chehab and Daniel 5
in evaluating the effect of different RAP mixtures used as the surface course. Figure 1 shows the pavement structure and site location.
MECHANISTIC-EMPIRICAL (M-E) DESIGN PROCEDURES Concept of M-E Design Briefly stated, the M-E performance prediction model consists of four sub-models: the environmental effects model, pavement response model, material characterization model, and performance prediction model. The model is termed mechanistic-empirical due to the mechanistic calculation of stresses, strains, and deflections of a pavement structure, which are the fundamental pavement responses under repeated traffic loadings, and relating these responses to field distresses and performance using existing empirical relationships, widely known as transfer functions (6). The design process is an iterative procedure that starts with a trial design and ends when predicted distresses meet the acceptable limits based on the level of statistical reliability desired. Structure of the MEPDG Software The MEPDG software employs a mechanistic-empirical methodology to predict pavement performance. The software provides a user-friendly interface in entering the design inputs and a simple output file in MS EXCEL format that includes predicted performance data with corresponding graphs. In general, the software is user-oriented in that it provides the designer with the flexibility of choosing the pavement type, desired reliability level for each distress independently, accuracy levels of the inputs, in addition to site-specific design features and materials (7). The software is composed of four major input modules: environmental, traffic, structure, and distress potential (for rehabilitation design). In turn, the structure module consists of three sub-modules: drainage, layer properties (materials), and thermal cracking. In addition, design inputs are classified according to a hierarchy system where the designer can select the Level of data accuracy and sophistication based on the economic impact of the project. The selection is also a function of the state-of-knowledge and availability of the data. A summary of the hierarchical Design Levels follows below: • Level 3 represents the lowest level of the hierarchy system and provides the lowest level of
reliability; the inputs consist of default or user-selected values obtained from national and regional experiences such as LTTP sites.
• Level 2 represents a higher level in the hierarchy system and provides more reliability than Level 3. Design inputs are based on laboratory test data and/or default predictive equations. This level is expected to be used on pavement design projects of higher significance.
• Level 1 represents the highest level in the hierarchy system and provides the highest degree of reliability. Design inputs are generally site specific and are determined from material testing and/or in-situ measurement.
MEPDG Software Runs A default input file for the MEPDG was created where the input values were equivalent to those used in the original design of the pavement section. For the suite of runs conducted, the design inputs and levels were kept constant except for the AC surface layer, where the variables associated with the mixture properties were varied to investigate their sensitivity and impact on the predicted performance. The following section expands on the inputs used for the software runs.

Chehab and Daniel 6
General The design of the pavement section was conducted for a design life of 10 years as an AC overlay on top of existing AC pavement. The software default values for initial and terminal IRI’s were used with a reliability level of 90 %. A medium distress potential was chosen for potholes, patches, and sealed longitudinal cracks. Traffic Traffic information for the site location was obtained from available NHDOT and LTPP traffic data. Limited data from the WIM station was available for use in this study, thus limiting traffic analysis to Level 3. The full data set will be used in future research to evaluate the sensitivity and refine the results of this study. The AADT (average annual daily traffic) used was 35674 with 8% trucks thus yielding a two-way AADTT (average annual daily truck traffic) of 2854, with a traffic growth of 2.4% (8 ,9). Climate The climate data is obtained from the MEPDG climate database for the city of Concord, NH (concord.icm), with a water table level of 8 ft. The mixture coefficient of thermal contraction is computed by the software from the mixture VMA and the aggregate coefficient of thermal contraction. Structure The pavement structure is composed of five layers: subgrade, 14.4” aggregate subbase, 19.3” aggregate base, 5.4” existing AC layer, and 3” AC overlay (9). Unbound Layer Properties Level 2 inputs were used for unbound layer properties (Table 1). Data were obtained from the LTPP database as well as NHDOT specifications and guidelines (9, 10). AC Layer Properties Level 3 inputs were used for the AC layers. Data for the existing AC binder layer were obtained from the LTPP database (9). As part of this study, four different mixtures were selected for the surface course, a control mixture (no RAP), and three RAP-modified mixtures. A 19 mm Superpave gradation was used with an unmodified PG 58-28 binder. The RAP used in this study contains a mix of recycled asphalt pavement, portland cement concrete, and possibly slight amounts of organic material with an asphalt content of 3.6%. The extracted RAP binder has a grade of PG 94-14. The mixes were designed based on a NHDOT approved 19 mm Superpave mix containing 15% RAP. For the remaining mixtures (control, 25% RAP, 40% RAP), the stockpile percentages were adjusted to achieve an overall mixture gradation as close as possible to the original 15% RAP gradation while maintaining the same relative proportions of virgin blast rock and natural sand. The gradations for the RAP mixtures are shown in Figure 2. The increasing percentages of RAP cause the gradations to become finer at the smaller sieve sizes, with the 40% RAP mixture going into the restricted zone. All of the other gradations fall on the coarse side of the restricted zone. The asphalt contents and volumetric properties of the mixtures are shown in Table 2. More details on these mixtures can be found in Daniel and Lachance (4).
Chehab and Daniel 7
Properties of the mixtures were obtained from laboratory testing conducted at UNH
(Table 2). Additionally, the effective binder grades of the RAP-mixtures were varied to study its sensitivity on the predicted performance (Table 3). An as-constructed air void content (AV) of 6% was used. RESULTS AND ANALYSIS The comparison of the performance predictions for the various MEPDG software runs conducted provide valuable insight regarding the importance and sensitivity of the properties that varied among the runs. The three main distresses that will be discussed in this section are longitudinal cracking, transverse cracking, and rutting; in addition, IRI, the performance measure for ridability, will be discussed. The longitudinal cracking that is presented for the chosen pavement structure comprises of top-down cracking only; alligator cracking, as the MEPDG guide terms classical bottom-up fatigue cracking, was not significant in this pavement section, likely due to the thick asphalt layer and relatively low truck traffic. The authors acknowledge that the top-down cracking model in the MEPDG has some problems associated with it and is subject to improvement in the future under the NCHRP 1-42A project, however the data presented herein are for comparative purposes among the different mixtures. The transverse cracking corresponds to thermal cracking, while the rutting reported is that occurring in the asphalt layer only. The control mixture (0% RAP condition) was only run using the virgin binder grade (PG 58-28) and hence the data is not included in the graphs, but is presented in each section for comparative purposes. Longitudinal Cracking The amounts of longitudinal cracking (feet per mile) predicted at the end of the 10 year design life for all cases are shown in Figure 3. This figure shows data for the three RAP contents with a range of high and low temperature PG grades. Overall, the amount of longitudinal cracking predicted at 10 years ranges between 150 ft/mi and 350 ft/mi among all RAP trials. The amount of cracking predicted for the control mixture at 10 years was 888 ft/mi. None of the mixtures reach the design failure limit of 1000 ft/mi. Effect of RAP Content Figure 3a shows the effect of the increased RAP content for the various PG binder grades that were incorporated in the various runs. All of the RAP mixtures, regardless of the assumed effective binder grade, have significantly better performance than the control mixture. The amount of cracking decreases slightly as the RAP content increases from 15% to 25%, but then increases for the 40% RAP. This trend is typical for the various binder grades used, but is most pronounced for softer binders, specifically the PG 58-xx binders. This trend is at least partially due to the fact that the 25% RAP mixture has a higher asphalt content than the 15% and 40% RAP mixtures, which would make the mixture more resistant to cracking. Additionally, this observation can be supported by the belief that increase in RAP content from 10 to 25% increases the stiffness of the mixture for the same virgin binder thus improving the resistance to shear and tensile stresses at the surface that typically lead to top-down cracking (11). This also explains the large difference between the predicted performance of the control and RAP mixtures. However with additional increase of RAP content to 40%, the mixture becomes brittle, which increases the potential for top-down cracking (11).
Comment [GC3]: Jo, the design life is for 10 years and not 20
Comment [GC4]: Jo Can you provide a reference here since you are on the panel, maybe the RFP?
Chehab and Daniel 8
Effect of Binder Grade Figure 3b shows the longitudinal cracking at the end of design life as a function of the high temperature PG grade, with the low temperature PG grade being set at -22. The stiffer binders at high temperatures (higher high-temperature grade) experience less longitudinal cracking. The decrease in longitudinal cracking with increase in high temperature binder grade follows an exponential relationship, irrespective of the RAP content.
Similarly, Figure 3c shows that increased stiffness of the binder at low temperatures (lower low-temperature grade) also decreases the amount of longitudinal cracking. This observation is valid for various high temperature grades and RAP contents, and provides additional evidence that using stiffer binder decreases the potential of top-down cracking as predicted by the current model in the MEPDG. However, the sensitivity of longitudinal cracking to low-temperature stiffness is less than that observed with high temperature stiffness. Transverse Cracking As mentioned earlier, the predicted transverse cracking is solely the result of thermal cracking in the absence of any predicted reflective cracking. Thus thermal cracking and transverse cracking terms are used interchangeably in the paper. The predicted transverse cracking at the end of the 10 year design life for all mixtures is shown in Figure 4. The amount of transverse cracking predicted varies significantly with RAP content and assumed binder grade. While some mixtures exceeded the design failure limit of 1000 ft/mi, others exhibited minimal, if any, evidence of thermal cracking. The control mixture exhibited 291 ft/mi of thermal cracking at the end of the 10 year design period.
To fully comprehend the influence of RAP content and binder grade on the extent of predicted thermal cracking, one needs to understand how thermal cracking is computed for Level 3 analysis in the MEPDG software. Briefly stated, thermal cracking occurs when stresses resulting from thermal deformations exceed the strength of the material. Additionally, thermal cracks initiate easier and propagate faster when the material exhibits low ductility, which in turn is a function of creep compliance D(t). For the MEPDG software Level 3 analysis, strength and D(t) are a function of both high and low temperature grades, while thermal deformations are a function of VMA (through the coefficient of thermal contraction). Table 4, taken from the MEPDG documentation (7), shows the D(t) and strength associated with different binder grades. It is from the above discussion and observed trends of thermal cracking predictions (as shown next) that studying the RAP mixture properties, particularly effective binder grade and VMA, derives its importance. An in depth study on the impact and sensitivity of those properties on thermal cracking has been documented elsewhere (12, 13). Effect of RAP Content Figure 4a shows the influence of RAP percentage for the different assumed binder grades. The design limit value of 1000 ft/mi is also shown on the graph. For those cases that exhibited significant transverse cracking, the observed amount of cracking increases with the increase of RAP content from 15% to 25% and then drops for the 40% RAP case. The ranking of the 15, 25, and 40% RAP in terms of the amount of transverse cracks at the end of the design life is consistent with the ranking of their effective asphalt content, Vbe, and with the VMA for the same as-constructed AV. The Vbe values for the mixtures are a function of the design asphalt content.
Chehab and Daniel 9
Effect of Binder Grade Figure 4b shows the transverse cracking as a function of the high temperature PG grade for all cases where a low temperature grade of -22 was assumed. The amount of cracking increases dramatically with the increase in high temperature binder grade and then levels off for PG grades of 76 and higher. The high temperature grade range for the steep slope varies with the RAP content; it may be likely that the true effective PG grade of the binder in the RAP mixtures falls in this range. This illustrates the importance of determining the appropriate binder grade to use in the analysis because a relatively small change in grade can produce a significant difference in the amount of transverse cracking that is predicted. The predicted transverse cracking as a function of the low temperature PG grade is shown in Figure 4c. The trend is similar to that for the high temperature grades: a steep increase as the binder becomes stiffer that levels off. This graph emphasizes the importance of determining the correct low temperature PG grade for the RAP mixtures. Rutting Figure 5 shows the predicted rutting in the asphalt layer for the various RAP cases. As expected, the softer PG grades exhibit more rutting, with some exceeding the design limit of 0.25”. The control mixture exhibited 0.332 inches of rutting at the end of the 10 year design period. Effect of RAP Content There is a slight increase in rutting with an increase in RAP content from 15% to 25%, as shown in Figure 5a. It would be expected for the higher RAP content mixture to be stiffer and exhibit less rutting, however the asphalt content for the 25% RAP mixture is higher than that for the 15% mixture and the higher asphalt content will tend to increase the amount of rutting. In this case, the increase in stiffness due to the higher RAP content appears to be offset by the higher binder content in the mixture. The amount of rutting then drops for the 40% RAP mixture, as expected. Effect of Binder Grade The effect of the high temperature PG grade and low temperature PG grade on predicted rutting are shown in Figures 5b and 5c, respectively. The amount of rutting decreases exponentially with the increasing stiffness, as the material is more resistant to applied loading. The high temperature PG grade has a larger influence on the predicted rutting than the low temperature PG grade, as expected. Similar to the transverse cracking, the likely region of the true effective PG grade in the RAP mixtures has the steepest slope in the graph, further emphasizing the need for accurate representation of the binder in the RAP mixtures. IRI The International Roughness Index is another performance indicator predicted by the MEPDG software. It is a function of other pavement distresses and hence can be seen as a comprehensive indicator of the pavement performance. A large number of State Highway Agencies relate their pavement rehabilitation and management strategies to the measured IRI values, thus its importance. The initial and terminal (failure) IRI in this study were set at values of 100 and 172 in/mi respectively.

Chehab and Daniel 10
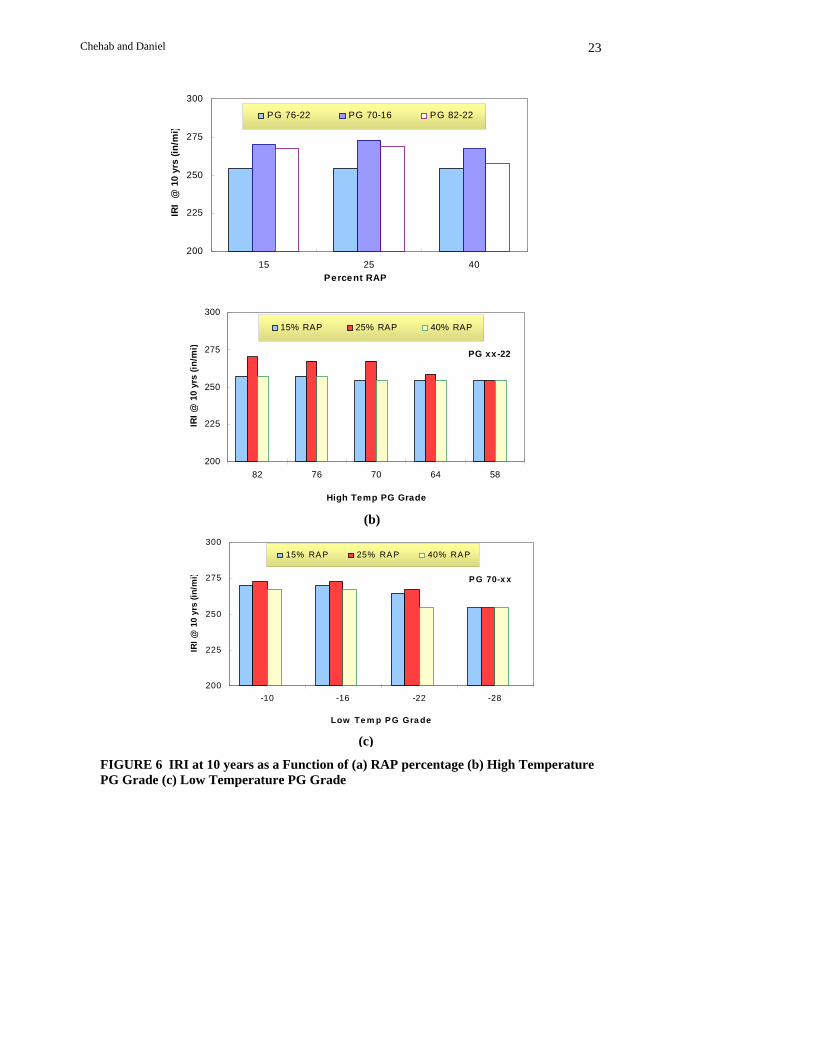
All the runs conducted led to an IRI at the end of the design life exceeding that of the design limit. The difference in IRI performance among mixtures with various RAP percentages and binder grades is very small as can be seen in Figure 6. For most of the mixtures, it takes between 80 to 85 months for the IRI to reach the terminal value of 172 in/mi. IRI values at the end of design life vary from 250 to 280 in/mi. Both visually and statistically, it is safe to assume that RAP content and binder grades do not carry significant impact on the IRI values throughout the design life of the rehabilitated pavement. This finding is only limited to the mixtures, climatic and traffic conditions, and the pavement structure incorporated in this study. Whether it is applicable to pavement design of additional pavement sections with differing conditions has to be studied. It is also worthy to note that the lack of sensitivity of IRI to RAP content and effective binder grade is also influenced by the fact that the IRI values computed in this study are not heavily impacted by bottom-up cracking since the amounts of that distress are minimal for all the mixtures. CONCLUSIONS AND RECOMMENDATIONS This paper presents the results of Level 3 analysis using the MEPDG for mixtures containing various percentages of RAP. One of the main issues in using RAP mixtures within the MEPDG framework is the determination of the appropriate binder grade as an input value for the Level 3 analysis. To determine the sensitivity of the predicted distresses to the assumed effective RAP binder grade, analyses were performed on a range of high and low temperature PG grades. For the pavement structure analyzed in this study, the predominant distresses were top-down (longitudinal) cracking, thermal (transverse) cracking, and rutting in the asphalt layer. Conclusions based on the analysis of these distresses, along with IRI, can be summarized as follows: • The assumed binder grade for the various mixtures has a significant effect on the predicted
distresses. Stiffer binder grades on both the high and low sides show an exponentially decreasing function for the amount of longitudinal cracking and rutting. However, the effect of the low PG grade is less significant than the high PG grade. The stiffer binder grades increase the amount of predicted thermal cracking up to a point after which a plateau is reached. Both the high and low PG grades are significant for the thermal cracking prediction.
• The rate of change (slope) of the various distresses as a function of the assumed binder grade are greatest in the region where the true effective grade of the RAP mixture binder is likely to fall. This indicates the importance of accurately determining the appropriate binder grade for the analysis as a large difference in expected performance can result from a small change in binder grade. For the cases analyzed in this study, it could be the difference between acceptable performance and cause for redesign.
• The predicted IRI was not sensitive to the RAP content or the assumed binder grade. This could be a function of the chosen pavement structure and the fact that minimal alligator cracking was predicted.
• The influence of the amount of RAP on predicted performance depends on the differences between the mixtures; a blanket statement on how increasing RAP affects the performance cannot be made. The mixtures examined in this study show how a combination of higher binder content and VMA can offset expected increases in stiffness due to the aged RAP binder such that reversing trends with increased RAP percentages are seen.

Chehab and Daniel 11
The results of this study emphasize the need for a method to determine the effective PG grade of RAP mixtures for Level 3 analysis with the MEPDG. When Level 1 analysis is to be performed, the problem will become more complicated because the appropriate binder properties will be required. Agencies need to recognize this problem and work towards possible solutions. This study has only included analysis of a single pavement structure and a single RAP source and as such, has only identified some issues that need to be addressed with respect to RAP mixtures and the MEPDG. Future research with various mixtures and pavement structures for both Level 1 and Level 3 analysis is planned.
ACKNOWLEDGEMENTS The authors would like to acknowledge the Recycled Materials Resource Center and the University of New Hampshire for supporting this research. Thanks also go to the NH Department of Transportation Bureau of Materials and Research and PIKE for their contributions and to Leslie Myers at FHWA for guidance in using the MEPDG.
REFERENCES 1. McDaniel, Rebecca S., H. Soleymani, R.M. Anderson, P. Turner, R. Peterson.
“Recommended Use of Reclaimed Asphalt Pavement in the Superpave Mix Design Method”. Contractor’s Final Report, NCHRP Web Document 30 (Project D9-12), 2000. Website: http://trb.org/trb/publications/nchrp/nchrp_w30-a.pdf
2. McDaniel, Rebecca and R.M. Anderson. “Recommended Use of Reclaimed Asphalt Pavement in the Superpave Mix Design Method: Technician’s Manual”. NCHRP Report 452, Transportation Research Board, National Research Council, National Academy Press, Washington, D.C., 2001. Website: http://trb.org/trb/publications/nchrp/nchrp_rpt_452.pdf
3. McDaniel, Rebecca and R.M. Anderson. “Recommended Use of Reclaimed Asphalt Pavement in the Superpave Mix Design Method: Guidelines”. NCHRP Research Results Digest, Number 253, 2001. Website: http://trb.org/trb/publications/nchrp/nchrp_rrd_253.pdf
4. Daniel, J.S. and A. Lachance “Mechanistic and Volumetric Properties of Asphalt Mixtures with RAP”, to be published in the Transportation Research Record, TRB, 2005.
5. Huang, B., G. Li, D. Vukosavljevic, X. Shu, and B. Egan ”Laboratory Investigation of Mixing HMA with RAP”, to be published in the Transportation Research Record, TRB, 2005.
6. “Guide for Mechanistic-Empirical Design of New and Rehabilitated Pavement structures;” Final Report; Appendices A to C; National Cooperative Research Program (NCHRP); Washington D.C., March 2004.
7. “Guide for Mechanistic-Empirical Design of New and Rehabilitated Pavement Structures”; Final Report; Part 1 introduction and Part 2 Design Inputs; National Cooperative Research Program (NCHRP); Washington D.C., March 2004.
8. Traffic volume Reports webpage. New Hampshire Department of Transportation. http://www.nh.gov/dot/business/engineers.htm. Accessed July 2005.
9. LTPP DataPave Online. Federal Highway Administration. http://www.datapave.com/. Accessed July 2005.
10. Specification, Standard, and Details webpage. New Hampshire Department of Transportation. http://www.nh.gov/dot/business/engineers.htm. Accessed July 2005.

Chehab and Daniel 12
11. Myers, L. and R. Roque, “Top-Down Crack Propagation in Bituminous Pavements and Implications For Pavement Management”, Journal of the Association of Asphalt Paving Technologists, Vol. 71, pp. 651-670, 2002.
12. Hao, Y., Chehab, G.R., S. Stoffels, “A Case Study: Assessing the Sensitivity of the Coefficient of Thermal Contraction of AC Mixtures on Thermal Crack Prediction”, Geotechnical Special Publication, ASCE Geo-Institute, in print, 2005.
13. Chehab, G.R., Y.R. Kim, (2005) “Viscoelastoplastic Continuum Damage Model Application to Thermal Cracking of Asphalt Concrete”, Journal of Materials in Civil Engineering, ASCE, Vol. 17, Issue 4, 2005.

Chehab and Daniel 13
LIST OF TABLES TABLE 1 MEPDG Input Properties for the Unbound Layers TABLE 2 MEPDG Input and Volumetric Properties of the AC Layers TABLE 3 PG Grade Combinations Used for the AC Surface Mixture TABLE 4. Creep Compliance and Tensile Strength Typical Values (Level 3 Input) LIST OF FIGURES FIGURE 1 a) Pavement cross-section; b) aerial image of the test section and WIM station; c) photo of the section showing transverse and longitudinal cracks FIGURE 2 Aggregate Gradations for RAP Mixtures FIGURE 3 Longitudinal Cracking at 10 years as a Function of (a) RAP percentage (b) High Temperature PG Grade (c) Low Temperature PG Grade FIGURE 4 Transverse Cracking at 10 years as a Function of (a) RAP percentage (b) High Temperature PG Grade (c) Low Temperature PG Grade FIGURE 5 AC Rutting at 10 years as a Function of (a) RAP percentage (b) High Temperature PG Grade (c) Low Temperature PG Grade FIGURE 6 IRI at 10 years as a Function of (a) RAP percentage (b) High Temperature PG Grade (c) Low Temperature PG Grade

Chehab and Daniel 14
TABLE 1 MEPDG Input Properties for the Unbound Layers
Unbound Layer
Data Sources Classification Modulus
(psi) PI % Pass #4
% Pass #200
D60 (mm) Poisson K0
Base NHDOT, LTPP
Crushed Stone (Fine Gradation)
24370 0 35 3.8 19 0.35 0.5
Subbase NHDOT, LTPP
Gravel with Sand 21150 0 54 2.4 9.5 0.35 0.5
Subgrade LTPP, Default Level 3
Fine Sand 13320 0 80 10 0.2 0.35 0.5

Chehab and Daniel 15
TABLE 2 MEPDG Input and Volumetric Properties of the AC Layers
Surface Overlay AC Layer Existing Binder Control 15% RAP 25% RAP 40% RAP
Data Source LTPP UNH UNH UNH UNH 3/4 24 1.3 1.4 1.4 1.4 3/8 52 33.1 32.5 32.3 33.9 #4 68 57.9 57.5 57.5 57.1
Gradation
#200 2 3.7 3.7 4 4.5 Binder Grade AC-20 PG 58-22 Variable1 Variable1 Variable1
Vbe 8.6 8.8 11.6 12.0 11.0 AV 6.7 6 6 6 6
Unit Weight (pcf) 150 144 146 143 145 Thermal
Cracking Data Level 3 Default
Level 3 Default Level 3 Default
Level 3 Default
Level 3 Default
% ac2 n/a 4.8 5.1 5.4 4.9 VMA2 n/a 13.1 13.3 16.3 15.2 VFA2 n/a 69.4 69.9 75.4 73.6 Gmm2 n/a 2.451 2.483 2.445 2.466
1 PG Grades_ High: 82, 76, 70, 64, 58. Low: -10, -16, -22, -28. 2 Values obtained from Superpave mix design process

Chehab and Daniel 16
TABLE 3 PG Grade Combinations Used for the AC Surface Mixture High Binder
Grade Low Binder Grade Control 15% RAP 25% RAP 40% RAP
58 -28 -10 -16 -22 -28 -10 -16 -22 -28 -10 -16 -22 -28
64 -22 -22 -22
70 -10 -16 -22 -28 -10 -16 -22 -28 -10 -16 -22 -28
76 -22 -22 -22
82 -22 -22 -22

Chehab and Daniel 17
TABLE 4. Creep Compliance and Tensile Strength Typical Values (Level 3 Input)
Creep Compliance (1/GPa) Binder Grade Time
(sec) -4 oF 14 oF 32 oF
Tensile Strength at 14 oF
(psi)
1 0.041 0.060 0.0772 0.043 0.061 0.0905 0.048 0.076 0.11310 0.049 0.085 0.12720 0.053 0.094 0.15250 0.055 0.116 0.197
PG 58-22
PG 58-28
100 0.058 0.132 0.246
444
1 0.030 0.035 0.0622 0.032 0.039 0.0685 0.035 0.043 0.08010 0.037 0.047 0.09120 0.039 0.051 0.10850 0.041 0.057 0.137
PG 64-22
100 0.045 0.059 0.163
370
1 0.063 0.120 0.1912 0.106 0.148 0.2485 0.124 0.199 0.34310 0.144 0.259 0.45920 0.168 0.332 0.60950 0.214 0.472 0.924
PG 70-34
100 0.261 0.612 1.276
590

Chehab and Daniel 18
FIGURE 1 a) Pavement cross-section; b) aerial image of the test section and WIM station; c) photo of the section showing transverse and longitudinal cracks
TEST SECTION
WIM
AC SURFACE
AC BINDER
AGGREGATE BASE
AGG. SUBBASE
(a) SUBGRADE
(b)
(c)
Chehab and Daniel 19
0.0%
20.0%
40.0%
60.0%
80.0%
100.0%
0 1 2 3 4 5
Sieve Size 0.45
Perc
ent P
assi
ng
Control15% RAP25% RAP40% RAPControl PointsRestricted Zone
FIGURE 2 Aggregate Gradations for RAP Mixtures

Chehab and Daniel 20
100
150
200
250
300
350
400
10 15 20 25 30 35 40
Percent RAP
450
Long
Cr
@ 1
0 yr
s (ft
/mi)
PG 58-10PG 58-16PG 58-22PG 58-28PG 64-22PG 70-10PG 70-16PG 70-22PG 70-28PG 76-22PG 82-22
(a)
100
150
200
250
300
52 58 64 70 76 82 88
High Temp PG Grade
Long
Cr @
10
yrs
(ft
350
400
/mi)
15% RAP25% RAP40% RAP
PG xx-22(b)
0
150
-30 -25 -20 -15 -10
Low PG Grade
Long
Cr @
300
450
10
yrs
(ft/m
i) 15% PG 70
15% PG 58
25% PG 70
25% PG 58
40% PG 70
40% PG 58
(c)
FIGURE 3 Longitudinal Cracking at 10 years as a Function of (a) RAP percentage (b) High Temperature PG Grade (c) Low Temperature PG Grade
Chehab and Daniel 21
0
200
400
600
800
1000
1200
1400
1600
10 20 30 40 50
Percent RAP
1800
Tra
nsv
Cr
@ 1
0 yr
s (f
t/mi)
PG 58-10PG 58-16PG 58-22PG 58-28PG 64-22PG 70-10PG 70-16PG 70-22PG 70-28PG 76-22PG 82-22LIMIT
(a)
0
400
800
52 58 64 70 76 82 88
High Temp PG Grade
1200
1600
Tran
sv C
r @ 1
0 yr
s (f
t/mi)
15% RAP25% RAP40% RAPLimit
PG xx-22(b)
0
600
-30 -25 -20 -15 -10
Low PG Grade
1200
1800
Tran
sv C
r @ 1
0 yr
s (f
t/mi) 15% PG 70
15% PG 58
25% PG 70
25% PG 58
40% PG 70
40% PG 58
Limit
(c)
FIGURE 4 Transverse Cracking at 10 years as a Function of (a) RAP percentage (b) High Temperature PG Grade (c) Low Temperature PG Grade

Chehab and Daniel 22
0.1
0.2
0.3
10 20 30 40 50Percent RAP
0.4
AC
Rutti
ng @
10
yrs
(in)
PG 58-10PG 58-16PG 58-22PG 58-28PG 64-22PG 70-10PG 70-16PG 70-22PG 70-28PG 76-22PG 82-22LIMIT
(a)
0.1
15
0.2
25
0.3
52 58 64 70 76 82 88
High Temp PG Grade
0.
0.
0.35
0.4
AC
Rut
ting
@ 1
0 yr
s(in
)
15% RAP
25% RAP
40% RAP
Limit
PG xx-22(b)
0.1
0.2
-30 -25 -20 -15 -10
Low PG Grade
0.3
0.4
AC
Rut
ting
@ 1
0 yr
s (in
)
15% PG 70
15% PG 58
25% PG 70
25% PG 58
40% PG 70
40% PG 58
Limit
(c)
FIGURE 5 AC Rutting at 10 years as a Function of (a) RAP percentage (b) High Temperature PG Grade (c) Low Temperature PG Grade
Chehab and Daniel 23
200
225
250
275
300
15 25 40Percent RAP
IRI
@ 1
0 yr
s (in
/mi
PG 76-22 PG 70-16
FIGURE 6 IRI at 10 years as a Function of (a) RAP percentage (b) High Temperature PG Grade (c) Low Temperature PG Grade
PG 82-22
)
275
300
n/m
i
15% RAP 25% RAP
)IR
I @ 1
0 yr
s (i
200
225
250
82 76 70 64 58
High Temp PG Grade
40% RAP
PG xx-22
(b)
225
250
275
300
IRI @
10
yrs
(in/m
i)
15% RAP 25% RAP 40% RAP
PG 70-x x
200-10 -16 -22 -28
Low Te m p PG Gra de
(c)